
T COUNTRIES OF - Walt Crawford · This book is a supplement to Gold Open Access Journals 2011-2015,...
336
Transcript of T COUNTRIES OF - Walt Crawford · This book is a supplement to Gold Open Access Journals 2011-2015,...


THE COUNTRIES OF
OAWORLD 2011-2015
Supplement to Gold OpenAccess Journals 2011-2015
Walt Crawford
Cites & Insights BooksLivermore, California, 2016

The Countries of OAWorld 2011-2015
Supplement to Gold Open Access Journals 2011-2015
Copyright © 2016 by Walt CrawfordORCID 0000-0002-4815-1997
Some Rights Reserved:Creative Commons Attribution License (CC BY)
You are free to make any use of this text, so long as you provide appro-priate attribution: Crawford, Walt (ORCID 0000-0002-4815-1997),Gold Open Access Journals 2011-2015: A Subject Approach, Livermore, CA:2016.
While you’re legally free to redistribute this PDF to others, it’s a kind-ness to the author to distribute links instead, so that it’s possible tocount the number of downloads.
This book was prepared entirely in Word 2013, using the licensedtypefaces Berkeley Book and Berkeley (bold) for text and Calibri forheadings and subheadings. Excel 2013 was used for data gathering andto prepare tables and graphs. The template is a customized version ofbk6pv.dotx (modified for different typefaces and slightly different head-ing practices), a template developed by the author, modified and im-proved with the cooperation Information Today, Inc. and freelyavailable at waltcrawford.name/bk6pv.dotx. (The template named usesPalatino Linotype for body text and Verdana for headings.) For moreabout the template and using no-cost methods to produce professional-quality books, read The Librarian’s Guide to Micropublishing.

iii
Contents
Preface ........................................................................................ vii
OAWorld.......................................................................................1
Africa ............................................................................................5
Nigeria ..........................................................................................9
South Africa ................................................................................13
Other African Countries ..............................................................17
Asia .............................................................................................23
Bangladesh ..................................................................................27
China ..........................................................................................31
Hong Kong..................................................................................35
India ...........................................................................................39
Indonesia ....................................................................................43
Japan...........................................................................................47
Malaysia ......................................................................................51
Nepal ..........................................................................................55
Pakistan.......................................................................................58
Philippines ..................................................................................62
Singapore ....................................................................................65
South Korea.................................................................................69
Sri Lanka.....................................................................................73
Taiwan, Province of China ...........................................................76
Thailand......................................................................................80
iv The Countries of OAWorld 2011-2015
Other Asian Countries ................................................................ 83
Eastern Europe ........................................................................... 85
Bosnia and Herzegovina.............................................................. 89
Bulgaria ...................................................................................... 92
Croatia........................................................................................ 96
Czech Republic......................................................................... 100
Estonia ..................................................................................... 104
Hungary ................................................................................... 107
Lithuania .................................................................................. 111
Macedonia, the Former Yugoslav Republic of ............................ 115
Moldova ................................................................................... 118
Poland ...................................................................................... 121
Romania ................................................................................... 125
Russian Federation.................................................................... 129
Serbia ....................................................................................... 133
Slovakia .................................................................................... 137
Slovenia.................................................................................... 141
Ukraine .................................................................................... 145
Other Eastern European Countries............................................ 149
Latin America ........................................................................... 155
Argentina.................................................................................. 159
Brazil ........................................................................................ 163
Chile......................................................................................... 167
Colombia.................................................................................. 171
Costa Rica................................................................................. 175
Cuba......................................................................................... 179
Ecuador .................................................................................... 183
Mexico...................................................................................... 185
Peru.......................................................................................... 189

Preface v
Uruguay ....................................................................................193
Venezuela, Bolivarian Republic of ..............................................196
Other Latin American and Caribbean Countries.........................200
Middle East ...............................................................................206
Egypt.........................................................................................210
Iran, Islamic Republic of............................................................213
Israel .........................................................................................217
Jordan .......................................................................................220
Turkey.......................................................................................223
United Arab Emirates ................................................................227
Other Middle East Countries .....................................................230
Pacific/English ...........................................................................235
Australia....................................................................................239
Canada......................................................................................243
New Zealand .............................................................................247
United States .............................................................................251
Western Europe.........................................................................255
Austria ......................................................................................259
Belgium.....................................................................................263
Denmark ...................................................................................267
Finland......................................................................................271
France .......................................................................................275
Germany ...................................................................................279
Greece .......................................................................................283
Ireland ......................................................................................287
Italy...........................................................................................290
Netherlands...............................................................................294
Norway .....................................................................................298
Portugal.....................................................................................302

vi The Countries of OAWorld 2011-2015
Spain ........................................................................................ 306
Sweden..................................................................................... 310
Switzerland............................................................................... 314
United Kingdom....................................................................... 318
Other Western European Countries........................................... 322
Country Index .......................................................................... 325

Preface vii
Preface
This book is a supplement to Gold Open Access Journals 2011-2015,providing details on OA publishing by country, with the large APC-ori-ented publishers in APCLand removed. (See Chapters 2 and 12 of GoldOpen Access Journals for more information on APCLand and OAWorld.)
Countries with at least 10 OA journals eligible for analysis in theoverall project have full details, with some changes in formatting (e.g.,dropping captions for tables and figures, relying on subheadings toidentify them and stripping out some derivative data) to provide a morecompact presentation.
Publisher category and subject tables appear sorted by article count.There’s very little commentary in most cases; I believe the data can
largely speak for itself, especially when a country is compared to its re-gion and to OAWorld.
After the OAWorld discussion, each region is followed by chaptersfor countries within that region, then a chapter offering brief notes oncountries with fewer than 10 OA journals (except for Pacific/English,which has no such countries).
For compactness in PDF size and page count, redundant graphs inregion and OAWorld chapters are deleted, as are starting-date graphsfor countries with fewer than 25 journals.
The easiest way to find a particular country is the index, which con-sists entirely of country and region names.
Thanks again to SPARC for sponsoring this project.The heatmap on the cover is based on combined 2014-2015 OA-
World articles per 100,000 people and was generated at GunnMap 2.


1
OAWorld
OAWorld has 8,932 journals, an average cost per article of $611 forarticles in APC-based journals and an overall average cost of $241.
Journals and Articles
2015 2014 2013 2012 2011
Journals 8,229 8,578 8,403 7,882 7,077
%Free 80% 80% 81% 81% 83%
Articles 403,307 402,623 367,887 337,595 288,777
%Free 61% 62% 65% 67% 69%
Article Volume
Journals %Free Articles %Free
Largest: 600+ 63 24% 83,181 27%
Large: 150-599 309 49% 78,947 43%
Med.: 60-149 1,023 68% 89,489 67%
Small: 20-59 3,459 84% 114,799 83%
Smallest: 0-19 4,078 84% 36,891 87%

2 The Countries of OAWorld 2011-2015
APC Levels and Revenues
Journals Articles Revenue $/article
$1,400+ 165 23,956 $50,569,396 $2,111
$600-$1.399 312 27,244 $26,073,228 $957
$200-$599 584 39,928 $14,112,747 $353
$2-$199 672 67,960 $6,418,334 $94
Free 7,199 244,219
Total 8,932 403,307 $97,173,704 $241
Publisher Category
Category Journals %Free Articles %Free
Univ/college 4,443 92% 146,304 82%
Miscellaneous 2,012 78% 118,212 51%
Society/govt 1,086 83% 59,372 61%
Open Access 885 38% 57,934 30%
Traditional 506 59% 21,485 50%
Growth and Shrinkage
Change 2014-15 Count Percent Cum%
Grew 50%+ 1,349 15.1%
Grew 10-49% 1,685 18.9% 34.0%
Even, ±9.99% 2,012 22.5% 56.5%
Shrank 10-49% 2,447 27.4% 83.9%
Shrank 50%+ 1,085 12.1% 96.0%

OAWorld 3
Gray OA and DOAJ16
GrayOA %Gray DOAJ16
Journals/Free 2,099 29% 5,100
Journals/Pay 513 30% 1,220
Articles/Free 67,881 28% 176,338
Articles/Pay 55,060 35% 104,028

4 The Countries of OAWorld 2011-2015
Subjects
Subject Journals %Free Articles %Free
Medicine 1,767 70% 113,370 55%
Engineering 277 70% 24,549 41%
Computer Science 335 57% 23,736 23%
Agriculture 396 66% 18,421 51%
Other Sciences 175 63% 18,119 44%
Physics 102 70% 17,191 63%
Education 614 92% 15,591 89%
Economics 553 79% 15,536 68%
Sociology 434 91% 13,987 76%
Language & Literature 571 97% 13,278 91%
Biology 268 57% 12,986 46%
Technology 169 77% 12,586 76%
Miscellany 132 84% 11,350 42%
Ecology 223 75% 10,077 65%
Zoology 214 65% 9,653 51%
Chemistry 113 70% 9,428 49%
Earth Sciences 284 87% 8,542 72%
History 296 99% 7,544 99%
Anthropology 280 91% 6,763 89%
Mathematics 217 89% 6,614 90%
Law 233 97% 5,139 92%
Political Science 226 94% 5,122 87%
Arts & Architecture 242 95% 4,936 92%
Media & Communications 180 94% 4,505 83%
Psychology 171 87% 4,311 86%
Religion 135 88% 3,818 69%
Philosophy 185 97% 3,301 96%
Library Science 140 97% 2,854 98%

5
Africa
Africa has 141 OAWorld OA journals. Average cost per article for APC-based journals in 2015 was $323; the overall average was $209.
Journals and Articles
2015 2014 2013 2012 2011
Journals 134 139 138 132 115
%Free 52% 53% 52% 54% 53%
Articles 7,731 8,621 7,947 9,267 9,096
%Free 35% 33% 30% 26% 22%
Pay articles declining most years since 2011, free articles generally onthe rise.
Article Volume
Journals %Free Articles %Free
Largest: 600+ 2 0% 1,869 0%
Large: 150-599 8 50% 2,125 43%
Med.: 60-149 12 42% 1,100 44%
Small: 20-59 58 48% 2,024 48%
Smallest: 0-19 61 62% 613 59%
Unusually, only the smallest are mostly free.

6 The Countries of OAWorld 2011-2015
APC Levels and Revenues
Journals Articles Revenue $/article
$600-$1.399 11 1,333 $839,897 $630
$200-$599 25 1,183 $444,829 $376
$2-$199 30 2,500 $333,316 $133
Free 75 2,715
Total 141 7,731 $1,618,042 $209
No expensive journals; almost half of fee articles have nominal fees.
Publisher Category
Category Journals %Free Articles %Free
Miscellaneous 45 49% 2,928 18%
Open Access 37 41% 2,339 20%
Univ/college 46 61% 2,042 65%
Society/govt 8 75% 311 86%
Traditional 5 80% 111 87%
Growth and Shrinkage
Change 2014-15 Count Percent Cum%
Grew 50%+ 12 8.5%
Grew 10-49% 23 16.3% 24.8%
Even, ±9.99% 36 25.5% 50.4%
Shrank 10-49% 44 31.2% 81.6%
Shrank 50%+ 24 17.0% 98.6%
More journals shrinking than growing.

Africa 7
Gray OA and DOAJ16
GrayOA %Gray DOAJ16
Journals/Free 30 40% 45
Journals/Pay 13 20% 53
Articles/Free 1,438 53% 1,277
Articles/Pay 438 9% 4,578
8 The Countries of OAWorld 2011-2015
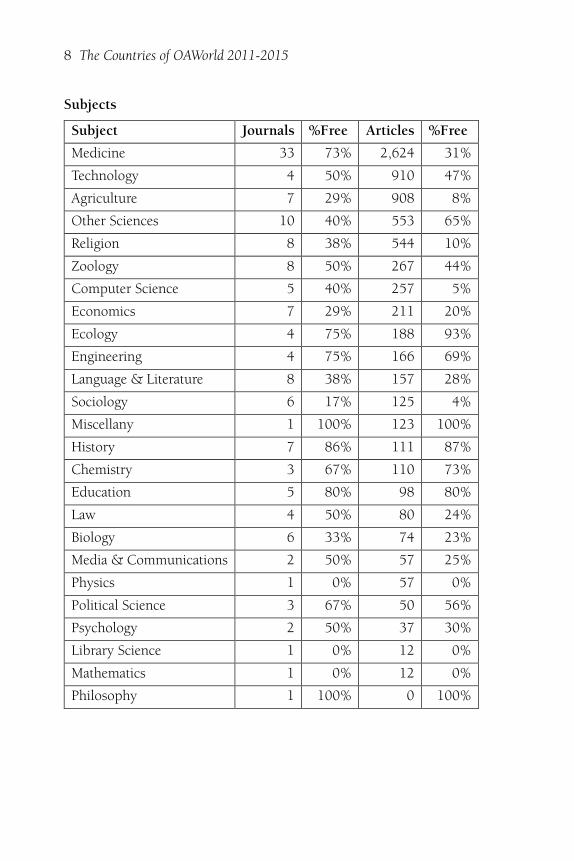
Subjects
Subject Journals %Free Articles %Free
Medicine 33 73% 2,624 31%
Technology 4 50% 910 47%
Agriculture 7 29% 908 8%
Other Sciences 10 40% 553 65%
Religion 8 38% 544 10%
Zoology 8 50% 267 44%
Computer Science 5 40% 257 5%
Economics 7 29% 211 20%
Ecology 4 75% 188 93%
Engineering 4 75% 166 69%
Language & Literature 8 38% 157 28%
Sociology 6 17% 125 4%
Miscellany 1 100% 123 100%
History 7 86% 111 87%
Chemistry 3 67% 110 73%
Education 5 80% 98 80%
Law 4 50% 80 24%
Biology 6 33% 74 23%
Media & Communications 2 50% 57 25%
Physics 1 0% 57 0%
Political Science 3 67% 50 56%
Psychology 2 50% 37 30%
Library Science 1 0% 12 0%
Mathematics 1 0% 12 0%
Philosophy 1 100% 0 100%
9
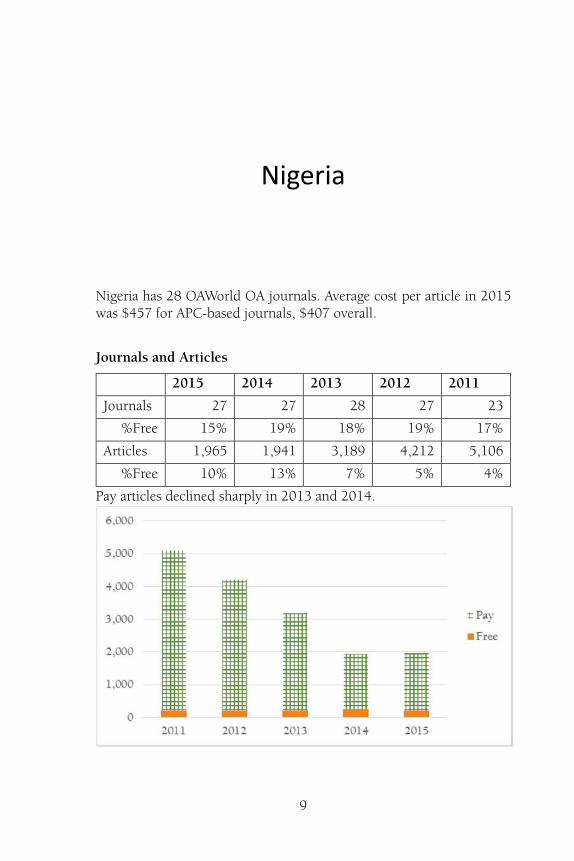
Nigeria
Nigeria has 28 OAWorld OA journals. Average cost per article in 2015was $457 for APC-based journals, $407 overall.
Journals and Articles
2015 2014 2013 2012 2011
Journals 27 27 28 27 23
%Free 15% 19% 18% 19% 17%
Articles 1,965 1,941 3,189 4,212 5,106
%Free 10% 13% 7% 5% 4%
Pay articles declined sharply in 2013 and 2014.

10 The Countries of OAWorld 2011-2015
Article Volume
Journals %Free Articles %Free
Largest: 600+ 1 0% 750 0%
Large: 150-599 1 0% 309 0%
Med.: 60-149 5 20% 445 16%
Small: 20-59 9 33% 317 42%
Smallest: 0-19 12 8% 144 0%
APC Levels and Revenues
Journals Articles Revenue $/article
$600-$1.399 2 882 $529,200 $600
$200-$599 12 642 $247,300 $385
$2-$199 9 236 $26,980 $114
Free 5 205
Total 28 1,965 $803,480 $409
No really expensive journals, but also very little free OA.
Publisher Category
Category Journals %Free Articles %Free
Univ/college 28 18% 1,965 10%
Open Access 10 10% 1,244 3%
Traditional 7 29% 511 24%
Miscellaneous 8 13% 166 29%
Society/govt 3 33% 44 0%
A rare case where universities and colleges predominantly charge APCs.

Nigeria 11
Starting Date
Almost all recent, primarily since 2006.
Growth and Shrinkage
Change 2014-15 Count Percent Cum%
Grew 50%+ 2 7.1%
Grew 10-49% 1 3.6% 10.7%
Even, ±9.99% 7 25.0% 35.7%
Shrank 10-49% 16 57.1% 92.9%
Shrank 50%+ 1 3.6% 96.4%
Gray OA and DOAJ16
GrayOA %Gray DOAJ16
Journals/Free 4 80% 1
Journals/Pay 6 26% 17
Articles/Free 169 82% 36
Articles/Pay 115 7% 1,645
Only one of the five free journals reapplied to DOAJ, making pay jour-nals even more dominant. No delisted journals grew significantly.

12 The Countries of OAWorld 2011-2015
Subjects
Subject Journals %Free Articles %Free
Agriculture 5 0% 834 0%
Medicine 7 43% 634 13%
Other Sciences 3 0% 116 0%
Economics 2 0% 87 0%
Ecology 2 50% 84 85%
Zoology 2 50% 79 63%
Physics 1 0% 57 0%
Biology 3 0% 41 0%
Law 1 0% 15 0%
Religion 1 0% 14 0%
Sociology 1 0% 4 0%
Unusual in that medicine isn’t the topic with the most coverage—andonly two subjects are mostly free, with most being entirely paid.

13
South Africa
South Africa has 73 OAWorld OA journals. Average cost in 2015 forarticles in APC-based journals was $412; overall average was $221.
Journals and Articles
2015 2014 2013 2012 2011
Journals 70 72 73 69 67
%Free 54% 54% 55% 55% 54%
Articles 2,412 2,812 2,524 2,351 2,167
%Free 46% 48% 49% 57% 52%
Both free and pay declined slightly in 2015.

14 The Countries of OAWorld 2011-2015
Article Volume
Journals %Free Articles %Free
Large: 150-599 2 50% 409 38%
Med.: 60-149 5 40% 457 47%
Small: 20-59 36 47% 1,235 43%
Smallest: 0-19 30 67% 311 68%
APC Levels and Revenues
Journals Articles Revenue $/article
$600-$1.399 9 451 $310,697 $689
$200-$599 12 511 $191,529 $375
$2-$199 12 334 $31,631 $95
Free 40 1,116
Total 73 2,412 $533,857 $221
Just as there are no very large journals, there are no expensive ones.
Publisher Category
Category Journals %Free Articles %Free
Open Access 25 48% 1,063 39%
Miscellaneous 21 62% 653 47%
Univ/college 20 45% 406 30%
Society/govt 2 100% 179 100%
Traditional 5 80% 111 87%

South Africa 15
Starting Date
Growth and Shrinkage
Change 2014-15 Count Percent Cum%
Grew 50%+ 6 8.2%
Grew 10-49% 15 20.5% 28.8%
Even, ±9.99% 21 28.8% 57.5%
Shrank 10-49% 20 27.4% 84.9%
Shrank 50%+ 10 13.7% 98.6%
Gray OA and DOAJ16
GrayOA %Gray DOAJ16
Journals/Free 19 48% 21
Journals/Pay 5 15% 28
Articles/Free 559 50% 557
Articles/Pay 245 19% 1,051
Another case where free journals were delisted more than usual.

16 The Countries of OAWorld 2011-2015
Subjects
Subject Journals %Free Articles %Free
Medicine 17 82% 575 77%
Religion 7 43% 530 11%
Other Sciences 2 100% 171 100%
Zoology 4 25% 148 19%
Sociology 4 0% 116 0%
Language & Literature 5 0% 113 0%
History 7 86% 111 87%
Education 4 75% 98 80%
Engineering 3 67% 91 43%
Ecology 1 100% 88 100%
Economics 3 0% 82 0%
Law 2 50% 58 21%
Political Science 3 67% 50 56%
Psychology 2 50% 37 30%
Chemistry 1 100% 34 100%
Computer Science 2 50% 31 19%
Biology 2 50% 25 36%
Technology 1 0% 16 0%
Media & Communications 1 100% 14 100%
Library Science 1 0% 12 0%
Mathematics 1 0% 12 0%
Religion comes in close behind medicine and far ahead of any othertopic—and it’s almost all in APC-charging journals.

17
Other African Countries
This group of countries has 40 OA journals. Average cost per article inAPC-charging journals in 2015 was $143; overall average, $84.
Journals and Articles
2015 2014 2013 2012 2011
Journals 37 40 37 36 25
%Free 76% 75% 73% 78% 84%
Articles 3,354 3,868 2,234 2,704 1,823
%Free 42% 33% 42% 33% 36%
Sizable growth in 2014, partly fading away in 2015.

18 The Countries of OAWorld 2011-2015
Article Volume
Journals %Free Articles %Free
Largest: 600+ 1 0% 1,119 0%
Large: 150-599 5 60% 1,407 53%
Med.: 60-149 2 100% 198 100%
Small: 20-59 13 62% 472 63%
Smallest: 0-19 19 89% 158 94%
One APC-charging megajournal, most articles in it and five large ones.
APC Levels and Revenues
Journals Articles Revenue $/article
$200-$599 1 30 $6,000 $200
$2-$199 9 1,930 $274,705 $142
Free 30 1,394 $0
Total 40 3,354 $280,705 $84
All low and nominal APCs, and most revenue is from very low APCs.
Publisher Category
Category Journals %Free Articles %Free
Miscellaneous 16 50% 2,109 9%
Univ/college 19 89% 1,125 97%
Society/govt 3 100% 88 100%
Open Access 2 100% 32 100%
Independent journals publish most of the articles.

Other African Countries 19
Starting Date
Note the pay-journal line: nothing before 2007.
Growth and Shrinkage
Change 2014-15 Count Percent Cum%
Grew 50%+ 4 10.0%
Grew 10-49% 7 17.5% 27.5%
Even, ±9.99% 8 20.0% 47.5%
Shrank 10-49% 15 37.5% 85.0%
Shrank 50%+ 6 15.0% 100.0%
Most of these journals are shrinking, but not rapidly.
Gray OA and DOAJ16
GrayOA %Gray DOAJ16
Journals/Free 7 23% 23
Journals/Pay 2 20% 8
Articles/Free 710 51% 684
Articles/Pay 78 4% 1,882
While journal delisting is typical, free article delisting is high.

20 The Countries of OAWorld 2011-2015
Subjects
Subject Journals %Free Articles %Free
Medicine 9 78% 1,415 20%
Technology 3 67% 894 48%
Other Sciences 5 40% 266 71%
Computer Science 3 33% 226 4%
Miscellany 1 100% 123 100%
Chemistry 2 50% 76 61%
Engineering 1 100% 75 100%
Agriculture 2 100% 74 100%
Language & Literature 3 100% 44 100%
Media & Communications 1 0% 43 0%
Economics 2 100% 42 100%
Zoology 2 100% 40 100%
Ecology 1 100% 16 100%
Biology 1 100% 8 100%
Law 1 100% 7 100%
Sociology 1 100% 5 100%
Education 1 100% 0
Philosophy 1 100% 0
Country Summaries
Algeria
Five journals, all but one university-based, all free, mostly growing. Inall, 316 articles in 2015, up from 170 in 2014.
Burundi
One free journal with ten articles in 2015.
Other African Countries 21
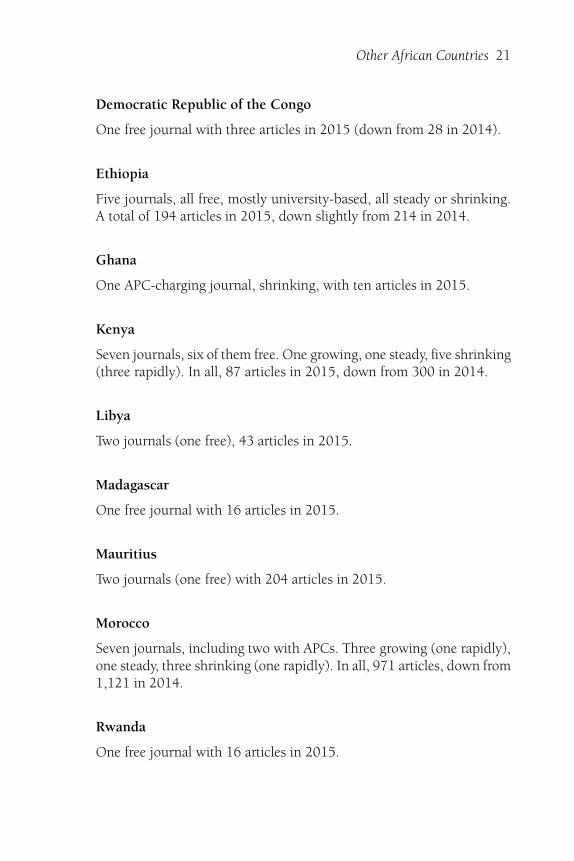
Democratic Republic of the Congo
One free journal with three articles in 2015 (down from 28 in 2014).
Ethiopia
Five journals, all free, mostly university-based, all steady or shrinking.A total of 194 articles in 2015, down slightly from 214 in 2014.
Ghana
One APC-charging journal, shrinking, with ten articles in 2015.
Kenya
Seven journals, six of them free. One growing, one steady, five shrinking(three rapidly). In all, 87 articles in 2015, down from 300 in 2014.
Libya
Two journals (one free), 43 articles in 2015.
Madagascar
One free journal with 16 articles in 2015.
Mauritius
Two journals (one free) with 204 articles in 2015.
Morocco
Seven journals, including two with APCs. Three growing (one rapidly),one steady, three shrinking (one rapidly). In all, 971 articles, down from1,121 in 2014.
Rwanda
One free journal with 16 articles in 2015.

22 The Countries of OAWorld 2011-2015
Tanzania, United Republic of
One free journal with 40 articles in 2015.
Tunisia
One free journal with 12 articles in 2015.
Uganda
Three journals: two free, one APC-charging megajournal. A total of1,321 articles in 2015.
Zambia
Two APC-charging journals with a total of 78 articles in 2015.
Delistings
All of these journals are in DOAJ16 except one from Ethiopia, one fromKenya, one from Morocco, one from Tanzania, and two each fromUganda and Zambia.

23
Asia
Asia has 1,221 OAWorld OA journals. Average cost per article in APC-charging journals in 2015 was $323; across all journals it was $202.
Journals and Articles
2015 2014 2013 2012 2011
Journals 1,133 1,185 1,167 1,067 866
%Free 56% 56% 56% 57% 59%
Articles 101,276 97,894 82,477 68,288 49,919
%Free 29% 30% 35% 38% 44%
Article Volume
Journals %Free Articles %Free
Largest: 600+ 30 3% 37,478 5%
Large: 150-599 98 32% 25,585 26%
Med.: 60-149 214 45% 19,417 45%
Small: 20-59 427 62% 14,686 62%
Smallest: 0-19 452 65% 4,110 69%

24 The Countries of OAWorld 2011-2015
APC Levels and Revenues
Journals Articles Revenue $/article
$1,400+ 7 4,669 $8,760,055 $1,876
$600-$1.399 48 5,850 $4,290,391 $733
$200-$599 151 18,207 $6,187,091 $340
$2-$199 332 43,412 $4,027,729 $93
Free 683 29,138
Total 1,221 101,276 $23,265,266 $230
Publisher Category
Category Journals %Free Articles %Free
Miscellaneous 349 46% 37,589 16%
Open Access 261 36% 26,858 26%
Univ/college 394 75% 20,220 48%
Society/govt 188 64% 14,134 38%
Traditional 29 45% 2,475 40%
Growth and Shrinkage
Change 2014-15 Count Percent Cum%
Grew 50%+ 165 13.5%
Grew 10-49% 213 17.4% 31.0%
Even, ±9.99% 265 21.7% 52.7%
Shrank 10-49% 354 29.0% 81.7%
Shrank 50%+ 188 15.4% 97.1%

Asia 25
Gray OA and DOAJ16
GrayOA %Gray DOAJ16
Journals/Free 204 30% 479
Journals/Pay 226 42% 312
Articles/Free 9,530 33% 19,608
Articles/Pay 37,533 52% 34,605
A surprisingly high delisted percentage of pay journals, including a ma-jority of articles for 2015.

26 The Countries of OAWorld 2011-2015
Subjects
Subject Journals %Free Articles %Free
Medicine 376 63% 37,707 36%
Computer Science 139 29% 16,340 9%
Engineering 72 43% 10,978 12%
Other Sciences 47 40% 6,521 8%
Technology 38 63% 3,842 71%
Agriculture 56 45% 3,268 22%
Miscellany 9 33% 3,237 2%
Biology 66 38% 3,078 28%
Chemistry 31 58% 2,670 45%
Zoology 33 45% 2,451 27%
Economics 53 51% 1,663 39%
Education 62 69% 1,528 57%
Sociology 26 65% 1,033 33%
Ecology 22 45% 853 29%
Earth Sciences 18 78% 761 81%
Mathematics 25 84% 708 91%
Language & Literature 28 82% 669 65%
Media & Communications 6 50% 625 16%
Political Science 6 67% 588 29%
Law 14 79% 570 41%
Physics 17 76% 544 71%
Anthropology 13 62% 479 77%
Religion 17 65% 309 60%
Psychology 10 90% 226 92%
Library Science 13 100% 224 100%
Arts & Architecture 12 83% 181 82%
History 8 75% 171 67%
Philosophy 4 100% 52 100%

27
Bangladesh
Bangladesh has 31 OAWorld OA journals. In 2015, average cost perarticle for APC-charging journals was $91; overall average was $58.
Journals and Articles
2015 2014 2013 2012 2011
Journals 25 29 29 25 25
%Free 64% 66% 69% 68% 68%
Articles 1,278 1,851 1,814 1,422 744
%Free 36% 31% 27% 36% 61%
Journals mostly free, articles mostly not, big drop in 2015.

28 The Countries of OAWorld 2011-2015
Article Volume
Journals %Free Articles %Free
Large: 150-599 1 0% 434 0%
Med.: 60-149 5 40% 473 46%
Small: 20-59 9 44% 243 46%
Smallest: 0-19 16 88% 128 100%
All very small journals are free—but they publish very few papers.
APC Levels and Revenues
Journals Articles Revenue $/article
$200-$599 1 0 $0 $0
$2-$199 10 821 $74,726 $91
Free 20 457
Total 31 1,278 $74,726 $58
The single $200 journal hasn’t published articles since 2013.
Publisher Category
Category Journals %Free Articles %Free
Miscellaneous 11 36% 879 15%
Society/govt 14 86% 319 92%
Univ/college 6 67% 80 36%

Bangladesh 29
Starting Date
Growth and Shrinkage
Change 2014-15 Count Percent Cum%
Grew 50%+ 3 9.7%
Grew 10-49% 4 12.9% 22.6%
Even, ±9.99% 3 9.7% 32.3%
Shrank 10-49% 12 38.7% 71.0%
Shrank 50%+ 7 22.6% 93.5%
An unusually bleak picture, with less than one-third growing or steady.
Gray OA and DOAJ16
GrayOA %Gray DOAJ16
Journals/Free 11 55% 9
Journals/Pay 7 64% 4
Articles/Free 233 51% 224
Articles/Pay 633 77% 188
Most journals delisted.

30 The Countries of OAWorld 2011-2015
Subjects
Subject Journals %Free Articles %Free
Biology 1 0% 434 0%
Medicine 13 100% 372 100%
Agriculture 6 33% 268 14%
Zoology 4 25% 119 12%
Other Sciences 3 33% 51 0%
Chemistry 1 100% 12 100%
Engineering 1 100% 11 100%
Philosophy 1 100% 11 100%
Computer Science 1 0% 0
An odd mix: the single biology journal (by far the largest) charges; noneof the mostly-small medical journals do. Agriculture and zoology aremostly fee-based.

31
China
China has 47 OAWorld OA journals. Average cost per article in APC-charging journals in 2015 was a high $1,167; overall, a high $949.
Journals and Articles
2015 2014 2013 2012 2011
Journals 46 46 45 43 43
%Free 50% 50% 49% 47% 47%
Articles 9,039 10,015 5,628 5,173 4,878
%Free 19% 17% 33% 34% 39%
The big jump in pay articles in 2014 fell somewhat in 2015.
Free-journal articles have been up and down in a narrow range.

32 The Countries of OAWorld 2011-2015
Article Volume
Journals %Free Articles %Free
Largest: 600+ 4 0% 4,506 0%
Large: 150-599 9 33% 2,417 27%
Med.: 60-149 16 44% 1,545 39%
Small: 20-59 13 77% 517 76%
Smallest: 0-19 5 80% 54 76%
Atypically, most articles are in a few very large APC-charging journals
APC Levels and Revenues
Journals Articles Revenue $/article
$1,400+ 3 3,025 $5,799,108 $1,917
$600-$1.399 16 3,690 $2,600,344 $705
$200-$599 4 641 $182,040 $284
Free 24 1,683
Total 47 9,039 $8,581,492 $949
Note that there are no journals with nominal fees.
Publisher Category
Category Journals %Free Articles %Free
Open Access 16 6% 5,715 0%
Miscellaneous 16 75% 2,045 38%
Traditional 5 60% 488 75%
Univ/college 6 83% 444 59%
Society/govt 4 75% 347 72%
Mostly OA publishers (primarily one publisher with 14 journals).
China 33
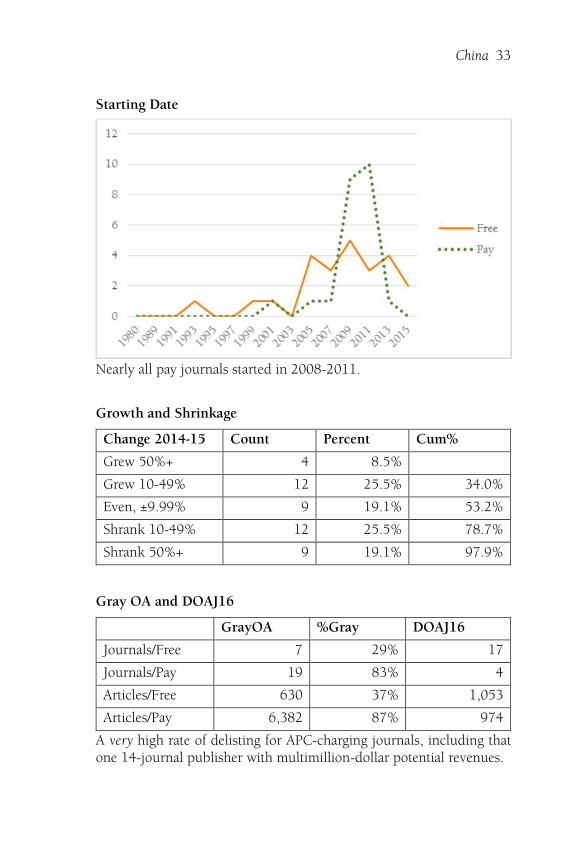
Starting Date
Nearly all pay journals started in 2008-2011.
Growth and Shrinkage
Change 2014-15 Count Percent Cum%
Grew 50%+ 4 8.5%
Grew 10-49% 12 25.5% 34.0%
Even, ±9.99% 9 19.1% 53.2%
Shrank 10-49% 12 25.5% 78.7%
Shrank 50%+ 9 19.1% 97.9%
Gray OA and DOAJ16
GrayOA %Gray DOAJ16
Journals/Free 7 29% 17
Journals/Pay 19 83% 4
Articles/Free 630 37% 1,053
Articles/Pay 6,382 87% 974
A very high rate of delisting for APC-charging journals, including thatone 14-journal publisher with multimillion-dollar potential revenues.

34 The Countries of OAWorld 2011-2015
Subjects
Subject Journals %Free Articles %Free
Medicine 28 32% 7,127 10%
Agriculture 4 50% 1,092 18%
Chemistry 1 100% 217 100%
Technology 3 67% 164 92%
Other Sciences 3 100% 147 100%
Zoology 2 100% 136 100%
Earth Sciences 2 100% 73 100%
Biology 2 50% 46 17%
Economics 1 100% 20 100%
Language & Literature 1 100% 17 100%
Medicine dominates, and two-thirds of other subjects are entirely free.

35
Hong Kong
Hong Kong has 39 OAWorld OA journals. In 2015, average cost perarticle in APC-charging journals was $297; overall average was $171.
Journals and Articles
2015 2014 2013 2012 2011
Journals 38 39 38 35 31
%Free 53% 51% 53% 51% 58%
Articles 3,390 3,410 2,937 2,691 2,195
%Free 42% 39% 38% 41% 39%
Free journals continue to grow; slight pay drop in 2015.

36 The Countries of OAWorld 2011-2015
Article Volume
Journals %Free Articles %Free
Largest: 600+ 1 0% 651 0%
Large: 150-599 5 40% 1,197 32%
Med.: 60-149 10 70% 930 74%
Small: 20-59 14 71% 507 67%
Smallest: 0-19 9 11% 105 17%
Unusual, with few smallest journals, all but one with APCs.
APC Levels and Revenues
Journals Articles Revenue $/article
$200-$599 13 965 $422,386 $438
$2-$199 6 993 $158,880 $160
Free 20 1,432
Total 39 3,390 $581,266 $171
No expensive journals, even split between two lowest APC levels.
Publisher Category
Category Journals %Free Articles %Free
Open Access 17 41% 1,427 41%
Society/govt 7 43% 851 8%
Miscellaneous 10 60% 757 58%
Univ/college 5 80% 355 97%
No traditional publishers—and society publishers mostly have APCs.

Hong Kong 37
Starting Date
Growth and Shrinkage
Change 2014-15 Count Percent Cum%
Grew 50%+ 4 10.3%
Grew 10-49% 9 23.1% 33.3%
Even, ±9.99% 9 23.1% 56.4%
Shrank 10-49% 16 41.0% 97.4%
Shrank 50%+ 1 2.6% 100.0%
Very little extreme change in either direction.
Gray OA and DOAJ16
GrayOA %Gray DOAJ16
Journals/Free 6 30% 14
Journals/Pay 3 16% 16
Articles/Free 333 23% 1,099
Articles/Pay 84 4% 1,874
Fewer pay-journal delistings than is typical. No delisted journal wasgrowing 25% or more.

38 The Countries of OAWorld 2011-2015
Subjects
Subject Journals %Free Articles %Free
Computer Science 15 73% 1,032 67%
Engineering 3 0% 750 0%
Medicine 9 67% 727 88%
Political Science 1 0% 399 0%
Law 1 0% 242 0%
Mathematics 2 50% 74 35%
Biology 4 0% 73 0%
Education 2 100% 72 100%
Other Sciences 1 0% 13 0%
Ecology 1 0% 8 0%
Distinctive, with more activity in computer science and engineeringthan in medicine—and also distinctive in that most medical articles arein no-fee journals.

39
India
India has 461 OAWorld open access journals. Average cost per articlein APC-charging journals in 2015: $149. Overall average: $118.
Journals and Articles
2015 2014 2013 2012 2011
Journals 427 447 446 400 310
%Free 44% 45% 44% 45% 51%
Articles 54,650 53,585 44,199 32,945 22,491
%Free 21% 25% 29% 35% 45%
A significant drop in free-journal articles in 2015, along with a slow-down in fast-rising pay journals publications.

40 The Countries of OAWorld 2011-2015
Article Volume
Journals %Free Articles %Free
Largest: 600+ 20 0% 26,030 0%
Large: 150-599 50 36% 12,571 30%
Med.: 60-149 106 43% 9,752 43%
Small: 20-59 143 56% 5,241 58%
Smallest: 0-19 142 44% 1,056 45%
Many high-volume all-APC journals, including four over 2,000 articles.
APC Levels and Revenues
Journals Articles Revenue $/article
$1,400+ 2 677 $1,080,400 $1,596
$600-$1.399 14 382 $282,964 $741
$200-$599 43 7,377 $1,994,733 $270
$2-$199 196 34,701 $3,088,350 $89
Free 206 11,513
Total 461 54,650 $6,446,447 $118
Most articles appear in very low-cost journals.
Publisher Category
Category Journals %Free Articles %Free
Miscellaneous 202 34% 27,028 10%
Open Access 163 49% 13,920 45%
Univ/college 33 73% 7,418 9%
Society/govt 43 58% 4,835 24%
Traditional 20 45% 1,449 40%
While most university-published journals don’t charge, nearly all of thearticles are in the few that do.

India 41
Starting Date
A pure gold-rush pattern, with most pay journals starting 2008-2013.
Growth and Shrinkage
Change 2014-15 Count Percent Cum%
Grew 50%+ 64 13.9%
Grew 10-49% 72 15.6% 29.5%
Even, ±9.99% 68 14.8% 44.3%
Shrank 10-49% 157 34.1% 78.3%
Shrank 50%+ 86 18.7% 97.0%
Most journals shrank from 2014 to 2015.
Gray OA and DOAJ16
GrayOA %Gray DOAJ16
Journals/Free 57 28% 149
Journals/Pay 106 42% 149
Articles/Free 2,238 19% 9,275
Articles/Pay 20,302 47% 22,835
Unusually high percentage of delisting for pay journals and articles.

42 The Countries of OAWorld 2011-2015
Subjects
Subject Journals %Free Articles %Free
Medicine 202 58% 21,295 35%
Computer Science 64 11% 10,547 3%
Engineering 24 17% 6,135 8%
Other Sciences 15 13% 5,451 1%
Miscellany 5 0% 2,981 0%
Chemistry 17 41% 2,027 31%
Biology 29 34% 1,476 30%
Zoology 6 50% 969 28%
Technology 15 53% 590 59%
Agriculture 11 9% 585 8%
Economics 14 29% 484 30%
Earth Sciences 7 86% 341 83%
Physics 5 80% 312 73%
Education 4 25% 255 2%
Ecology 5 40% 246 27%
Sociology 9 56% 165 39%
Anthropology 2 100% 132 100%
Library Science 4 100% 132 100%
Language & Literature 7 71% 128 83%
Psychology 2 100% 100 100%
Law 5 100% 81 100%
Political Science 1 100% 74 100%
Mathematics 4 50% 66 95%
Arts & Architecture 2 100% 65 100%
Media & Communications 1 0% 13 0%
Philosophy 1 100% 0
43
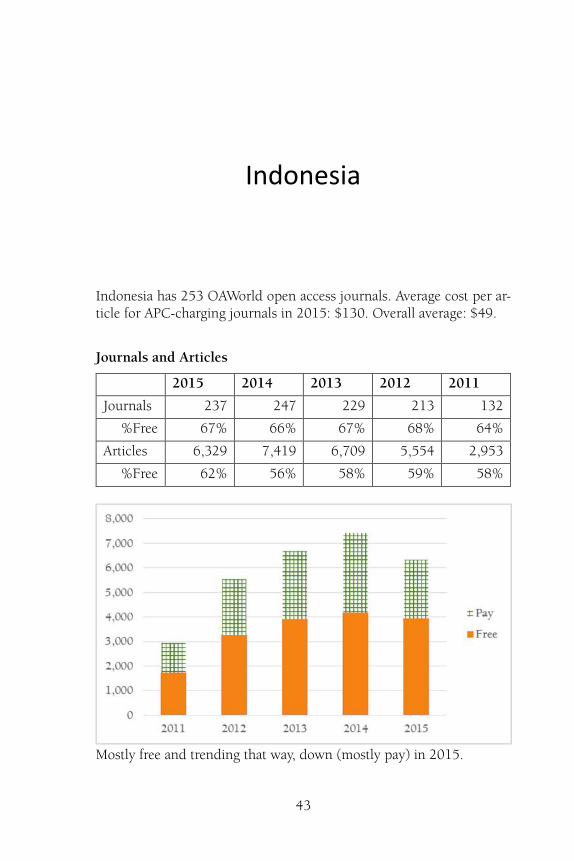
Indonesia
Indonesia has 253 OAWorld open access journals. Average cost per ar-ticle for APC-charging journals in 2015: $130. Overall average: $49.
Journals and Articles
2015 2014 2013 2012 2011
Journals 237 247 229 213 132
%Free 67% 66% 67% 68% 64%
Articles 6,329 7,419 6,709 5,554 2,953
%Free 62% 56% 58% 59% 58%
Mostly free and trending that way, down (mostly pay) in 2015.

44 The Countries of OAWorld 2011-2015
Article Volume
Journals %Free Articles %Free
Large: 150-599 2 50% 441 37%
Med.: 60-149 13 62% 1,223 68%
Small: 20-59 109 58% 3,192 58%
Smallest: 0-19 129 72% 1,473 75%
No very large journals, and free journals a majority in most sizes.
APC Levels and Revenues
Journals Articles Revenue $/article
$200-$599 9 544 $156,690 $288
$2-$199 79 1,833 $153,238 $84
Free 165 3,952
Total 253 6,329 $309,928 $49
No expensive journals and almost all articles either free or nominallypriced; thus the very low per-article average.
Publisher Category
Category Journals %Free Articles %Free
Univ/college 203 70% 4,952 71%
Miscellaneous 29 59% 690 48%
Open Access 13 0% 539 0%
Society/govt 8 75% 148 80%
No OA journals from traditional publishers.
Indonesia 45
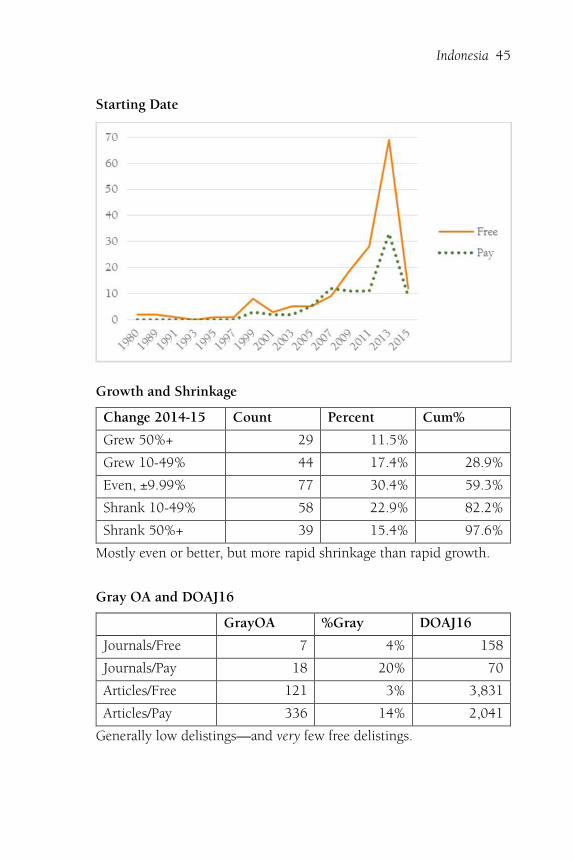
Starting Date
Growth and Shrinkage
Change 2014-15 Count Percent Cum%
Grew 50%+ 29 11.5%
Grew 10-49% 44 17.4% 28.9%
Even, ±9.99% 77 30.4% 59.3%
Shrank 10-49% 58 22.9% 82.2%
Shrank 50%+ 39 15.4% 97.6%
Mostly even or better, but more rapid shrinkage than rapid growth.
Gray OA and DOAJ16
GrayOA %Gray DOAJ16
Journals/Free 7 4% 158
Journals/Pay 18 20% 70
Articles/Free 121 3% 3,831
Articles/Pay 336 14% 2,041
Generally low delistings—and very few free delistings.

46 The Countries of OAWorld 2011-2015
Subjects
Subject Journals %Free Articles %Free
Medicine 28 79% 1,037 75%
Education 39 72% 903 69%
Engineering 18 39% 681 17%
Economics 16 81% 396 83%
Technology 9 89% 382 100%
Agriculture 17 71% 322 64%
Anthropology 8 50% 279 68%
Biology 11 55% 260 67%
Other Sciences 7 29% 247 13%
Law 7 71% 243 62%
Computer Science 14 43% 224 57%
Religion 13 69% 222 61%
Language & Literature 9 78% 173 51%
Chemistry 8 63% 159 58%
Ecology 6 50% 127 57%
Zoology 6 50% 121 74%
Earth Sciences 5 60% 96 60%
Physics 6 83% 82 73%
Arts & Architecture 8 75% 81 59%
Miscellany 2 100% 69 100%
History 3 67% 54 63%
Mathematics 3 67% 54 76%
Psychology 4 75% 48 65%
Political Science 2 50% 27 33%
Media & Communications 1 0% 22 0%
Sociology 3 33% 20 100%

47
Japan
Japan has 94 OAWorld open access journals. In 2015, the average costper article in APC-charging journals was $798; overall average, $441.
Journals and Articles
2015 2014 2013 2012 2011
Journals 89 92 93 91 90
%Free 64% 64% 65% 66% 66%
Articles 6,907 5,837 6,008 6,098 5,944
%Free 45% 45% 49% 48% 51%
Free journals recovered in 2015 after three down years.

48 The Countries of OAWorld 2011-2015
Article Volume
Journals %Free Articles %Free
Largest: 600+ 2 0% 1,563 0%
Large: 150-599 8 75% 2,001 69%
Med.: 60-149 20 40% 1,715 39%
Small: 20-59 38 63% 1,437 62%
Smallest: 0-19 26 88% 191 83%
Unusual in that most large journals are free, most medium journals not.
APC Levels and Revenues
Journals Articles Revenue $/article
$1,400+ 1 895 $1,672,755 $1,869
$600-$1.399 11 902 $833,553 $924
$200-$599 14 1,593 $500,021 $314
$2-$199 7 429 $40,836 $95
Free 61 3,088
Total 94 6,907 $3,047,165 $441
Publisher Category
Category Journals %Free Articles %Free
Society/govt 60 63% 5,528 46%
Univ/college 17 65% 753 42%
Miscellaneous 16 69% 607 38%
Open Access 1 100% 19 100%
Mostly society publishing, no traditional-publisher involvement.

Japan 49
Starting Date
Very little recent activity.
Growth and Shrinkage
Change 2014-15 Count Percent Cum%
Grew 50%+ 22 23.4%
Grew 10-49% 22 23.4% 46.8%
Even, ±9.99% 23 24.5% 71.3%
Shrank 10-49% 18 19.1% 90.4%
Shrank 50%+ 7 7.4% 97.9%
Much more rapid growth than rapid shrinkage.
Gray OA and DOAJ16
GrayOA %Gray DOAJ16
Journals/Free 48 79% 13
Journals/Pay 23 70% 10
Articles/Free 2,615 85% 473
Articles/Pay 3,279 86% 540
Astonishingly high delisting percentages, both free and pay.

50 The Countries of OAWorld 2011-2015
Subjects
Subject Journals %Free Articles %Free
Medicine 31 58% 3,997 44%
Zoology 6 17% 646 1%
Technology 4 0% 460 0%
Agriculture 6 67% 260 66%
Computer Science 6 83% 243 93%
Chemistry 2 100% 216 100%
Ecology 5 40% 186 30%
Mathematics 7 100% 183 100%
Engineering 3 67% 149 21%
Biology 5 60% 128 32%
Sociology 2 100% 93 100%
Physics 3 100% 73 100%
Anthropology 2 50% 56 63%
History 2 100% 54 100%
Psychology 2 100% 41 100%
Earth Sciences 1 100% 40 100%
Education 3 100% 27 100%
Philosophy 1 100% 20 100%
Religion 1 100% 16 100%
Other Sciences 1 0% 15 0%
Law 1 100% 4 100%
Mostly medical (more than half of all articles), with only five journals(242 articles) still in DOAJ.

51
Malaysia
Malaysia has 63 OAWorld open access journals. Average cost per articlein fee journals in 2015 was a low $192; overall average a very low $21.
Journals and Articles
2015 2014 2013 2012 2011
Journals 58 62 63 62 57
%Free 74% 74% 75% 74% 74%
Articles 3,419 2,042 1,864 1,683 1,437
%Free 89% 83% 80% 75% 70%
Predominantly free. The big jump in 2015 is one big journal with hugenumbers of 2015 issues. (See note after Subjects.)

52 The Countries of OAWorld 2011-2015
Article Volume
Journals %Free Articles %Free
Largest: 600+ 1 100% 1,780 100%
Med.: 60-149 7 71% 687 71%
Small: 20-59 18 78% 622 81%
Smallest: 0-19 37 73% 330 81%
One megajournal, no large journals.
APC Levels and Revenues
Journals Articles Revenue $/article
$200-$599 13 209 $49,300 $236
$2-$199 3 171 $23,810 $139
Free 47 3,039
Total 63 3,419 $73,110 $21
Few paid articles, mostly inexpensive.
Publisher Category
Category Journals %Free Articles %Free
Univ/college 43 95% 2,948 99%
Society/govt 5 40% 221 38%
Miscellaneous 6 67% 171 27%
Open Access 9 0% 79 0%
Almost all university-based, almost all free.

Malaysia 53
Starting Date
Growth and Shrinkage
Change 2014-15 Count Percent Cum%
Grew 50%+ 10 15.9%
Grew 10-49% 14 22.2% 38.1%
Even, ±9.99% 15 23.8% 61.9%
Shrank 10-49% 16 25.4% 87.3%
Shrank 50%+ 7 11.1% 98.4%
More fast growth than fast shrinkage, and positive overall.
Gray OA and DOAJ16
GrayOA %Gray DOAJ16
Journals/Free 18 38% 29
Journals/Pay 2 13% 14
Articles/Free 2,305 76% 734
Articles/Pay 17 4% 363
The one megajournal was delisted, as were quite a few others.

54 The Countries of OAWorld 2011-2015
Subjects
Subject Journals %Free Articles %Free
Technology 4 100% 1,813 100%
Engineering 10 90% 322 98%
Language & Literature 6 83% 261 52%
Medicine 6 100% 257 100%
Biology 5 40% 156 21%
Earth Sciences 1 100% 147 100%
Sociology 3 100% 90 100%
Religion 3 33% 71 46%
Computer Science 10 40% 62 37%
Media & Communications 1 100% 55 100%
Education 3 100% 42 100%
Economics 4 50% 37 38%
Other Sciences 2 100% 30 100%
History 2 100% 27 100%
Physics 1 0% 26 0%
Mathematics 2 100% 23 100%
“Technology” for the megajournal is based on the journal’s name, butmay be misleading.
It’s possible that the 2011-2014 counts for that journal are low: itpublishes many issues, and while those were counted for 2015, theywere sampled and estimated for earlier years. Still, there were manymore such issues in 2015.

55
Nepal
Nepal has 17 OAWorld OA journals. In 2015, average cost per articlein APC-charging journals was $120; overall average was $22.
Journals and Articles
2015 2014 2013 2012 2011
Journals 14 16 17 14 12
%Free 93% 94% 88% 93% 100%
Articles 555 506 503 333 349
%Free 82% 81% 86% 95% 100%
Free journals have gone back and forth: down a bit 2012, 2014.

56 The Countries of OAWorld 2011-2015
Article Volume
Journals %Free Articles %Free
Med.: 60-149 3 67% 321 69%
Small: 20-59 6 100% 174 100%
Smallest: 0-19 8 88% 60 100%
No large journals at all.
APC Levels and Revenues
Journals Articles Revenue $/article
$2-$199 2 101 $12,120 $120
Free 15 454
Total 17 555 $12,120 $22
A bit misleading: one of two pay journals hasn’t published anythingsince 2013.
Publisher Category
Category Journals %Free Articles %Free
Miscellaneous 8 75% 385 74%
Society/govt 7 100% 133 100%
Univ/college 2 100% 37 100%
Growth and Shrinkage
Change 2014-15 Count Percent Cum%
Grew 50%+ 3 17.6%
Grew 10-49% 4 23.5% 41.2%
Even, ±9.99% 1 5.9% 47.1%
Shrank 10-49% 5 29.4% 76.5%
Shrank 50%+ 3 17.6% 94.1%
Most everything either grew or shrank, with more of the latter.

Nepal 57
Gray OA and DOAJ16
GrayOA %Gray DOAJ16
Journals/Free 9 60% 6
Journals/Pay 1 50% 1
Articles/Free 326 72% 128
Articles/Pay 0 0% 101
The delisted pay journal has been inactive for two years. Unfortunately,most free journals were also delisted.
Subjects
Subject Journals %Free Articles %Free
Medicine 11 91% 301 100%
Other Sciences 1 0% 101 0%
Biology 1 100% 87 100%
Engineering 2 100% 47 100%
Sociology 1 100% 12 100%
Ecology 1 100% 7 100%
Mostly biomed with one pay multidisciplinary journal, started in 2013.

58
Pakistan
Pakistan has 70 OAWorld open access journals. Average cost per articlein 2015 for APC-charging journals: $200. Average overall: $162.
Journals and Articles
2015 2014 2013 2012 2011
Journals 61 66 66 51 43
%Free 51% 50% 48% 53% 53%
Articles 5,833 4,385 4,670 4,688 3,026
%Free 19% 27% 25% 20% 28%
After two years of slow decline, pay articles jumped in 2015.

Pakistan 59
Article Volume
Journals %Free Articles %Free
Largest: 600+ 2 0% 2,948 0%
Large: 150-599 4 25% 1,074 29%
Med.: 60-149 8 13% 683 9%
Small: 20-59 23 65% 868 65%
Smallest: 0-19 33 58% 260 62%
Another country where only smaller journals are mostly free.
APC Levels and Revenues
Journals Articles Revenue $/article
$600-$1.399 1 60 $39,000 $650
$200-$599 13 1,319 $489,334 $371
$2-$199 20 3,354 $417,191 $124
Free 36 1,100
Total 70 5,833 $945,525 $162
Publisher Category
Category Journals %Free Articles %Free
Miscellaneous 24 50% 4,112 13%
Univ/college 27 70% 1,273 31%
Society/govt 10 50% 379 41%
Open Access 9 0% 69 0%
Independent journals dominate.

60 The Countries of OAWorld 2011-2015
Starting Date
Growth and Shrinkage
Change 2014-15 Count Percent Cum%
Grew 50%+ 9 12.9%
Grew 10-49% 7 10.0% 22.9%
Even, ±9.99% 15 21.4% 44.3%
Shrank 10-49% 21 30.0% 74.3%
Shrank 50%+ 14 20.0% 94.3%
Few growing journals, many shrinking ones.
Gray OA and DOAJ16
GrayOA %Gray DOAJ16
Journals/Free 10 28% 26
Journals/Pay 15 44% 19
Articles/Free 129 12% 971
Articles/Pay 3,150 67% 1,583
Very high rate of delisting among pay journals.

Pakistan 61
Subjects
Subject Journals %Free Articles %Free
Engineering 2 0% 2,352 0%
Medicine 21 67% 1,033 66%
Computer Science 6 33% 788 5%
Agriculture 10 20% 689 2%
Zoology 5 60% 277 22%
Economics 9 44% 209 49%
Biology 2 0% 98 0%
Political Science 2 100% 88 100%
Education 2 50% 85 12%
Sociology 3 67% 77 22%
Mathematics 1 100% 46 100%
History 1 0% 36 0%
Other Sciences 3 67% 18 0%
Chemistry 1 100% 17 100%
Media & Communications 1 100% 14 100%
Library Science 1 100% 6 100%

62
Philippines
The Philippines have 12 OAWorld open access journals. Average costper article in the APC-charging journal is $70; overall average is $31.
Journals and Articles
2015 2014 2013 2012 2011
Journals 11 11 12 11 8
%Free 91% 91% 92% 100% 100%
Articles 426 390 231 206 129
%Free 56% 63% 91% 100% 100%
The single APC-charging journal accounts for most growth.

Philippines 63
Article Volume
Journals %Free Articles %Free
Large: 150-599 1 0% 187 0%
Med.: 60-149 1 100% 66 100%
Small: 20-59 5 100% 134 100%
Smallest: 0-19 5 100% 39 100%
APC Levels and Revenues
Journals Articles Revenue $/article
$2-$199 1 187 $13,090 $70
Free 11 239
Total 12 426 $13,090 $31
Publisher Category
Category Journals %Free Articles %Free
Univ/college 6 83% 267 30%
Society/govt 2 100% 92 100%
Open Access 3 100% 67 100%
Miscellaneous 1 100% 0
Growth and Shrinkage
Change 2014-15 Count Percent Cum%
Grew 50%+ 1 8.3%
Grew 10-49% 1 8.3% 16.7%
Even, ±9.99% 3 25.0% 41.7%
Shrank 10-49% 6 50.0% 91.7%
No rapid shrinkage, very little growth.

64 The Countries of OAWorld 2011-2015
Gray OA and DOAJ16
GrayOA %Gray DOAJ16
Journals/Free 1 9% 10
Journals/Pay 0 0% 1
Articles/Free 0 0% 239
Articles/Pay 0 0% 187
The first perfect record: the only delisted journal hasn’t published anyarticles since 2013.
Subjects
Subject Journals %Free Articles %Free
Miscellany 2 50% 187 0%
Medicine 2 100% 92 100%
Language & Literature 2 100% 59 100%
Education 1 100% 28 100%
Philosophy 1 100% 21 100%
Arts & Architecture 1 100% 12 100%
Sociology 1 100% 11 100%
Economics 1 100% 8 100%
Other Sciences 1 100% 8 100%

65
Singapore
Singapore has 28 OAWorld OA journals. In 2015, average cost per ar-ticle in fee journals was $267; overall average was $251.
Journals and Articles
2015 2014 2013 2012 2011
Journals 26 28 28 25 22
%Free 19% 25% 25% 28% 27%
Articles 2,248 2,562 2,706 3,319 2,055
%Free 6% 5% 6% 4% 4%
Very few free articles; steady decline since 2012.

66 The Countries of OAWorld 2011-2015
Article Volume
Journals %Free Articles %Free
Large: 150-599 5 0% 1,111 0%
Med.: 60-149 9 0% 733 0%
Small: 20-59 9 22% 371 26%
Smallest: 0-19 5 100% 33 100%
The few free journals are small or very small.
APC Levels and Revenues
Journals Articles Revenue $/article
$200-$599 18 1623 $544,950 $336
$2-$199 3 494 $19,760 $40
Free 7 131
Total 28 2,248 $564,710 $251
Publisher Category
Category Journals %Free Articles %Free
Open Access 18 0% 1,623 0%
Traditional 3 0% 494 0%
Univ/college 5 100% 121 100%
Miscellaneous 1 100% 10 100%
Society/govt 1 100% 0
Dominated by all-fee OA publishers.

Singapore 67
Starting Date
Almost all fee journals started 2010-2013.
Growth and Shrinkage
Change 2014-15 Count Percent Cum%
Grew 50%+ 2 7.1%
Grew 10-49% 5 17.9% 25.0%
Even, ±9.99% 6 21.4% 46.4%
Shrank 10-49% 7 25.0% 71.4%
Shrank 50%+ 8 28.6% 100.0%
High shrinkage, little growth.
Gray OA and DOAJ16
GrayOA %Gray DOAJ16
Journals/Free 6 86% 1
Journals/Pay 21 100% 0
Articles/Free 112 85% 19
Articles/Pay 2,117 100% 0
Almost complete wipeout from DOAJ. Of four OA journals in DOAJ inMay 2016, one is APCLand (Elsevier) and two are new 2016 listings.

68 The Countries of OAWorld 2011-2015
Subjects
Subject Journals %Free Articles %Free
Computer Science 7 0% 615 0%
Sociology 2 0% 536 0%
Economics 6 17% 466 2%
Engineering 3 0% 240 0%
Ecology 1 0% 180 0%
Mathematics 1 100% 49 100%
Zoology 1 100% 49 100%
Other Sciences 1 0% 35 0%
Physics 1 0% 29 0%
Education 2 50% 26 0%
Language & Literature 2 100% 23 100%
Library Science 1 100% 0

69
South Korea
South Korea has 46 OAWorld open access journals. Average cost perarticle in APC-charging journals in 2015: $530. Overall average: $467.
Journals and Articles
2015 2014 2013 2012 2011
Journals 44 45 44 44 41
%Free 43% 42% 41% 41% 41%
Articles 5,505 4,297 3,644 2,795 2,557
%Free 12% 17% 18% 23% 25%
Mostly pay journals, continuing growth, flat free-journal remnant.

70 The Countries of OAWorld 2011-2015
Article Volume
Journals %Free Articles %Free
Large: 150-599 13 0% 4,152 0%
Med.: 60-149 9 33% 702 32%
Small: 20-59 16 69% 597 63%
Smallest: 0-19 8 75% 54 98%
Three-quarters of articles are in thirteen large fee journals.
APC Levels and Revenues
Journals Articles Revenue $/article
$1,400+ 1 72 $207,792 $2,886
$600-$1.399 6 816 $534,530 $655
$200-$599 18 3,809 $1,810,980 $475
$2-$199 1 152 $15,200 $100
Free 20 656
Total 46 5,505 $2,568,502 $467
Publisher Category
Category Journals %Free Articles %Free
Open Access 12 17% 3,400 3%
Society/govt 20 45% 1,084 29%
Univ/college 8 63% 761 27%
Miscellaneous 6 67% 260 15%
Predominantly multijournal OA publishers—or, actually, one publisher.

South Korea 71
Starting Date
That publisher started almost all of its fee journals in 2007 and 2009.
Growth and Shrinkage
Change 2014-15 Count Percent Cum%
Grew 50%+ 8 17.4%
Grew 10-49% 8 17.4% 34.8%
Even, ±9.99% 15 32.6% 67.4%
Shrank 10-49% 11 23.9% 91.3%
Shrank 50%+ 3 6.5% 97.8%
More growth than shrinkage and a lot of steady journals.
Gray OA and DOAJ16
GrayOA %Gray DOAJ16
Journals/Free 6 30% 14
Journals/Pay 10 38% 16
Articles/Free 165 25% 491
Articles/Pay 1,185 24% 3,664
Slightly high percentage of delisted mostly-smaller journals.

72 The Countries of OAWorld 2011-2015
Subjects
Subject Journals %Free Articles %Free
Computer Science 12 25% 2,716 3%
Medicine 13 46% 1,119 22%
Media & Communications 1 0% 490 0%
Technology 2 50% 409 1%
Biology 4 0% 235 0%
Mathematics 2 100% 142 100%
Zoology 2 0% 107 0%
Earth Sciences 2 50% 64 20%
Ecology 1 0% 52 0%
Engineering 1 100% 50 100%
Agriculture 1 100% 35 100%
Library Science 2 100% 30 100%
Chemistry 1 100% 22 100%
Physics 1 100% 22 100%
Nearly half of all 2015 articles are in computer science.
A note on country names
This chapter combines 40 journals listed under South Korea and sixlisted under Korea, Republic of.

73
Sri Lanka
Sri Lanka has a dozen OAWorld open access journals—none of whichhave author processing charges, so most tables are omitted or modified.
Journals and Articles
2015 2014 2013 2012 2011
Journals 10 10 12 11 10
Articles 199 203 205 189 167
Tiny decline in 2015, even smaller one in 2014.

74 The Countries of OAWorld 2011-2015
Article Volume
Journals Articles
Small: 20-59 3 105
Smallest: 0-19 9 94
Publisher Category
Journals Articles
Univ/college 9 125
Society/govt 3 74
Growth and Shrinkage
Change 2014-15 Count Percent Cum%
Grew 50%+ 1 8.3%
Grew 10-49% 1 8.3% 16.7%
Even, ±9.99% 2 16.7% 33.3%
Shrank 10-49% 5 41.7% 75.0%
Shrank 50%+ 1 8.3% 83.3%
Mostly shrinking.
Gray OA and DOAJ16
GrayOA %Gray DOAJ16
Journals/Free 6 50% 6
Articles/Free 78 39% 121
All delisted journals were shrinking or inactive.

Sri Lanka 75
Subjects
Subject Journals Articles
Medicine 7 130
Zoology 1 27
Agriculture 1 17
Ecology 1 17
Mathematics 1 8
Computer Science 1 0

76
Taiwan, Province of China
Note: I use the country name as given in DOAJ.Taiwan has 26 OAWorld OA journals. Average cost per article in
APC-charging journals in 2015: $117. Overall average: $36.
Journals and Articles
2015 2014 2013 2012 2011
Journals 26 26 25 24 24
%Free 77% 77% 80% 79% 79%
Articles 617 564 504 542 488
%Free 69% 84% 83% 85% 87%
Still mostly free but with growing pay-journal component.

Taiwan, Province of China 77
Article Volume
Journals %Free Articles %Free
Med.: 60-149 1 0% 82 0%
Small: 20-59 13 85% 401 81%
Smallest: 0-19 12 75% 134 76%
No large journals; even the one medium (fee) journal is smallish.
APC Levels and Revenues
Journals Articles Revenue $/article
$200-$599 3 46 $16,617 $361
$2-$199 3 143 $5,578 $39
Free 20 428
Total 26 617 $22,195 $36
Most fees are fairly nominal.
Publisher Category
Category Journals %Free Articles %Free
Miscellaneous 11 64% 297 58%
Univ/college 12 83% 256 75%
Traditional 1 100% 44 100%
Society/govt 2 100% 20 100%

78 The Countries of OAWorld 2011-2015
Starting Date
Growth and Shrinkage
Change 2014-15 Count Percent Cum%
Grew 50%+ 2 7.7%
Grew 10-49% 4 15.4% 23.1%
Even, ±9.99% 13 50.0% 73.1%
Shrank 10-49% 6 23.1% 96.2%
Shrank 50%+ 1 3.8% 100.0%
Mostly even or growing, although shrinkage outweighs growth.
Gray OA and DOAJ16
GrayOA %Gray DOAJ16
Journals/Free 8 40% 12
Journals/Pay 0 0% 6
Articles/Free 166 39% 262
Articles/Pay 0 0% 189
Higher than usual percentage of delisted free journals, but all APC-charging journals remain in DOAJ.

Taiwan, Province of China 79
Subjects
Subject Journals %Free Articles %Free
Computer Science 3 67% 113 27%
Other Sciences 3 67% 107 52%
Medicine 2 100% 84 100%
Education 5 40% 74 57%
Mathematics 2 100% 63 100%
Library Science 5 100% 56 100%
Media & Communications 1 100% 31 100%
Economics 1 0% 24 0%
Technology 1 100% 24 100%
Arts & Architecture 1 100% 23 100%
Engineering 1 100% 10 100%
Language & Literature 1 100% 8 100%
Another Asian country where computer science has the most activity,(Yes, there really are five OA library science journals in Taiwan.)

80
Thailand
Thailand has 15 OAWorld OA journals. In 2015, average cost per articlein APC-charging journals was $247; overall average was $33.
Journals and Articles
2015 2014 2013 2012 2011
Journals 14 14 14 12 12
%Free 86% 86% 86% 83% 83%
Articles 616 598 637 476 363
%Free 87% 88% 80% 81% 75%
Free journals continue to grow; pay journals have been erratic.

Thailand 81
Article Volume
Journals %Free Articles %Free
Med.: 60-149 4 100% 319 100%
Small: 20-59 7 71% 244 67%
Smallest: 0-19 4 100% 53 100%
No large journals, and both APC-charging journals are small.
APC Levels and Revenues
Journals Articles Revenue $/article
$200-$599 2 81 $20,040 $247
Free 13 535
Total 15 616 $20,040 $33
Both APC-charging journals have low rather than nominal fees.
Publisher Category
Category Journals %Free Articles %Free
Univ/college 8 88% 384 91%
Miscellaneous 6 83% 194 75%
Society/govt 1 100% 38 100%
University publications dominate.
Growth and Shrinkage
Change 2014-15 Count Percent Cum%
Grew 50%+ 2 13.3%
Grew 10-49% 3 20.0% 33.3%
Even, ±9.99% 5 33.3% 66.7%
Shrank 10-49% 3 20.0% 86.7%
Shrank 50%+ 1 6.7% 93.3%
Two-thirds even or growing, a good figure.

82 The Countries of OAWorld 2011-2015
Gray OA and DOAJ16
GrayOA %Gray DOAJ16
Journals/Free 3 23% 10
Journals/Pay 1 50% 1
Articles/Free 75 14% 460
Articles/Pay 48 59% 33
Slightly low free-journal delisting rates.
Subjects
Subject Journals %Free Articles %Free
Other Sciences 6 67% 298 73%
Engineering 2 100% 97 100%
Biology 1 100% 75 100%
Medicine 1 100% 38 100%
Psychology 2 100% 37 100%
Ecology 1 100% 30 100%
Sociology 1 100% 25 100%
Education 1 100% 16 100%
A fair number of multidisciplinary science journals account for the larg-est group of articles and both APC-charging journals.

83
Other Asian Countries
Six other Asian countries publish a total of seven OAWorld open accessjournals, with a total of 265 articles in 2015, 230 in 2014, 218 in 2013,174 in 2012 and 143 in 2011.
Six of the seven journals are free; one, started in 2014, charges $150fees. Two are medium-sized, one (the fee journal) is small and four arevery small.
One was shrinking rapidly (and was delisted). The rest, all still inDOAJ, include one with slow shrinkage, one even, two growing moder-ately and one growing rapidly.
Country Summaries
Bhutan
One free university-published sociology journal with four 2015 articles,down from eight in 2014. Now gray OA.
Brunei Darussalam
One free government medical journal with 65 articles in 2015, up from41 in 2014.
Cambodia
One free university-published biology journal with ten articles in 2015,up from eight in 2014.

84 The Countries of OAWorld 2011-2015
Korea, Democratic People's Republic of
One free institute-published engineering journal with 121 articles in2015, up from 115 in 2014.
Kyrgyzstan
Two free university-published journals, one economics and one engi-neering, with 32 articles in both 2015 and 2014.
Viet Nam
One APC-charging independent medical journal with 33 articles in2015, up from 26 in 2014.

85
Eastern Europe
Eastern Europe has 1,474 OAWorld open access journals. In 2015, av-erage cost per article in fee journals was $236; overall average was $60.
Journals and Articles
2015 2014 2013 2012 2011
Journals 1,398 1,426 1,379 1,243 1,108
%Free 88% 89% 89% 89% 88%
Articles 61,126 63,247 62,178 56,466 49,165
%Free 75% 74% 75% 77% 78%
The 2015 decline is in both free and pay journals.
Article Volume
Journals %Free Articles %Free
Largest: 600+ 7 29% 6,785 21%
Large: 150-599 36 75% 8,407 70%
Med.: 60-149 215 74% 18,658 73%
Small: 20-59 630 90% 21,200 90%
Smallest: 0-19 586 94% 6,076 94%
Free journals dominate in all but the largest category.

86 The Countries of OAWorld 2011-2015
APC Levels and Revenues
Journals Articles Revenue $/article
$1,400+ 3 262 $459,992 $1,756
$600-$1.399 11 839 $774,632 $923
$200-$599 47 4,622 $1,571,042 $340
$2-$199 105 9,744 $840,671 $86
Free 1,308 45,659
Total 1,474 61,126 $3,646,337 $60
Unusual in that most revenue is in low-priced journals.
Publisher Category
Category Journals %Free Articles %Free
Univ/college 739 90% 30,706 84%
Miscellaneous 310 85% 16,212 54%
Traditional 237 93% 6,205 86%
Society/govt 133 86% 5,832 74%
Open Access 55 80% 2,171 67%
Mostly university and college journals.
Growth and Shrinkage
Change 2014-15 Count Percent Cum%
Grew 50%+ 188 12.8%
Grew 10-49% 295 20.0% 32.8%
Even, ±9.99% 372 25.2% 58.0%
Shrank 10-49% 393 26.7% 84.7%
Shrank 50%+ 178 12.1% 96.7%

Eastern Europe 87
Gray OA and DOAJ16
GrayOA %Gray DOAJ16
Journals/Free 247 19% 1,061
Journals/Pay 19 11% 147
Articles/Free 8,889 19% 36,770
Articles/Pay 2,660 17% 12,807
Relatively low rates of delisting, especially among pay journals.
Subjects
Although medical journals form the largest single group, they’re muchless major than in OAWorld as a whole.

88 The Countries of OAWorld 2011-2015
Subject Journals %Free Articles %Free
Medicine 153 84% 6,934 80%
Economics 163 80% 6,128 65%
Miscellany 27 63% 4,689 29%
Agriculture 96 77% 3,867 65%
Engineering 75 91% 3,515 83%
Sociology 52 92% 3,244 64%
Chemistry 35 86% 2,708 55%
Technology 44 86% 2,631 82%
Other Sciences 17 76% 2,550 52%
Language & Literature 96 99% 2,445 98%
Education 52 92% 2,221 96%
Physics 31 94% 2,133 97%
Mathematics 64 95% 2,112 91%
Anthropology 68 93% 2,017 85%
Zoology 43 72% 1,673 56%
Computer Science 57 91% 1,580 86%
Earth Sciences 70 99% 1,482 99%
Biology 41 76% 1,480 71%
Ecology 41 85% 1,265 80%
Political Science 58 98% 1,138 99%
Arts & Architecture 31 97% 981 90%
Law 29 100% 957 100%
History 31 100% 897 100%
Psychology 24 100% 848 100%
Philosophy 31 97% 839 95%
Religion 15 100% 343 100%
Media & Communications 16 100% 235 100%
Library Science 14 100% 214 100%

89
Bosnia and Herzegovina
Bosnia and Herzegovina have 15 OAWorld journals. In 2015, averagecost per article in the APC-charging journal: $324. Overall average $53.
Journals and Articles
2015 2014 2013 2012 2011
Journals 14 13 14 14 12
%Free 93% 92% 93% 93% 92%
Articles 290 279 350 363 301
%Free 84% 90% 88% 88% 84%
Still down from 2012 high but starting to reover.
90 The Countries of OAWorld 2011-2015
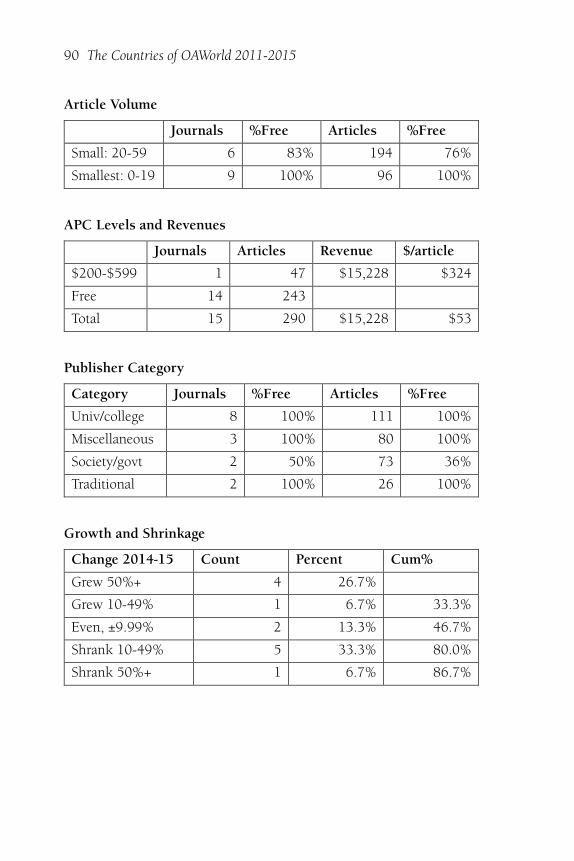
Article Volume
Journals %Free Articles %Free
Small: 20-59 6 83% 194 76%
Smallest: 0-19 9 100% 96 100%
APC Levels and Revenues
Journals Articles Revenue $/article
$200-$599 1 47 $15,228 $324
Free 14 243
Total 15 290 $15,228 $53
Publisher Category
Category Journals %Free Articles %Free
Univ/college 8 100% 111 100%
Miscellaneous 3 100% 80 100%
Society/govt 2 50% 73 36%
Traditional 2 100% 26 100%
Growth and Shrinkage
Change 2014-15 Count Percent Cum%
Grew 50%+ 4 26.7%
Grew 10-49% 1 6.7% 33.3%
Even, ±9.99% 2 13.3% 46.7%
Shrank 10-49% 5 33.3% 80.0%
Shrank 50%+ 1 6.7% 86.7%

Bosnia and Herzegovina 91
Gray OA and DOAJ16
GrayOA %Gray DOAJ16
Journals/Free 3 21% 11
Journals/Pay 0 0% 1
Articles/Free 71 29% 172
Articles/Pay 0 0% 47
Of the three delisted journals, one was moderately growing, one wasslightly declining and one had no articles later than 2013.
Subjects
Subject Journals %Free Articles %Free
Medicine 7 86% 140 66%
Anthropology 2 100% 63 100%
Economics 3 100% 42 100%
Miscellany 1 100% 26 100%
Engineering 1 100% 10 100%
Earth Sciences 1 100% 9 100%
Medicine biggest as usual.

92
Bulgaria
Bulgaria has 34 OAWorld open access journals. In 2015 the average costper article in APC-charging journals was $277; overall average $138.
Journals and Articles
2015 2014 2013 2012 2011
Journals 34 32 29 28 21
%Free 59% 59% 62% 64% 57%
Articles 1,479 1,593 1,435 1,266 981
%Free 50% 39% 42% 39% 31%
Steady growth in free-journal articles, 2015 drop in fee articles.

Bulgaria 93
Article Volume
Journals %Free Articles %Free
Large: 150-599 2 50% 524 41%
Med.: 60-149 4 25% 336 27%
Small: 20-59 13 85% 443 80%
Smallest: 0-19 15 47% 176 47%
APC Levels and Revenues
Journals Articles Revenue $/article
$200-$599 8 466 $165,813 $356
$2-$199 6 268 $37,840 $141
Free 20 745
Total 34 1,479 $203,653 $138
Publisher Category
Category Journals %Free Articles %Free
Traditional 13 15% 595 6%
Univ/college 8 100% 494 100%
Miscellaneous 10 80% 330 52%
Society/govt 2 50% 35 60%
Open Access 1 100% 25 100%
One traditional publisher accounts for 12 of the 13 journals.

94 The Countries of OAWorld 2011-2015
Starting Date
Growth and Shrinkage
Change 2014-15 Count Percent Cum%
Grew 50%+ 3 8.8%
Grew 10-49% 8 23.5% 32.4%
Even, ±9.99% 9 26.5% 58.8%
Shrank 10-49% 11 32.4% 91.2%
Shrank 50%+ 1 2.9% 94.1%
More shrinkage than growth, very little extreme change.
Gray OA and DOAJ16
GrayOA %Gray DOAJ16
Journals/Free 1 5% 19
Journals/Pay 0 0% 14
Articles/Free 15 2% 730
Articles/Pay 0 0% 734
Near-perfect retention, with only one very small delisted journal.

Bulgaria 95
Subjects
Subject Journals %Free Articles %Free
Zoology 6 50% 407 17%
Other Sciences 1 100% 215 100%
Biology 6 17% 212 25%
Medicine 4 50% 119 31%
Computer Science 2 100% 112 100%
Mathematics 1 0% 91 0%
Technology 2 100% 70 100%
Agriculture 2 0% 64 0%
Miscellany 1 100% 42 100%
Language & Literature 2 100% 41 100%
Ecology 2 50% 32 97%
Economics 1 100% 28 100%
Anthropology 1 100% 21 100%
Education 1 100% 15 100%
Library Science 1 100% 6 100%
Physics 1 100% 4 100%
Zoology as the most popular topic, mostly in three pay journals.

96
Croa�a
Croatia has 103 OAWorld open access journal. Average 2015 cost perarticle in APC-charging journals: $356. Overall average: a very low $22.
Journals and Articles
2015 2014 2013 2012 2011
Journals 95 102 101 100 99
%Free 95% 95% 96% 97% 97%
Articles 3,022 2,786 2,814 2,743 2,599
%Free 94% 96% 96% 97% 97%
After small dip in 2014, growth resumed in 2015.

Croatia 97
Article Volume
Journals %Free Articles %Free
Large: 150-599 1 100% 215 100%
Med.: 60-149 12 92% 884 92%
Small: 20-59 52 92% 1,556 92%
Smallest: 0-19 38 100% 367 100%
Most articles are in small journals.
APC Levels and Revenues
Journals Articles Revenue $/article
$600-$1.399 1 38 $36,708 $966
$200-$599 1 26 $15,574 $599
$2-$199 3 121 $13,603 $112
Free 98 2,837
Total 103 3,022 $65,885 $22
Most potential revenues go to one small technology journal.
Publisher Category
Category Journals %Free Articles %Free
Univ/college 52 98% 1,489 99%
Society/govt 28 100% 784 100%
Miscellaneous 20 85% 699 80%
Open Access 2 50% 37 30%
Traditional 1 100% 13 100%
University publications account for just under half of all articles.

98 The Countries of OAWorld 2011-2015
Starting Date
An unusual pattern, with most new journals starting in 2000-2007 andalmost none since 2011.
Growth and Shrinkage
Change 2014-15 Count Percent Cum%
Grew 50%+ 22 21.4%
Grew 10-49% 27 26.2% 47.6%
Even, ±9.99% 19 18.4% 66.0%
Shrank 10-49% 22 21.4% 87.4%
Shrank 50%+ 12 11.7% 99.0%
Mostly positive, with lots of growth and little rapid shrinkage.
Gray OA and DOAJ16
GrayOA %Gray DOAJ16
Journals/Free 26 27% 72
Journals/Pay 0 0% 5
Articles/Free 599 21% 2,238
Articles/Pay 0 0% 185
Fairly typical free delisting rate, but all pay journals still in DOAJ.
Croatia 99
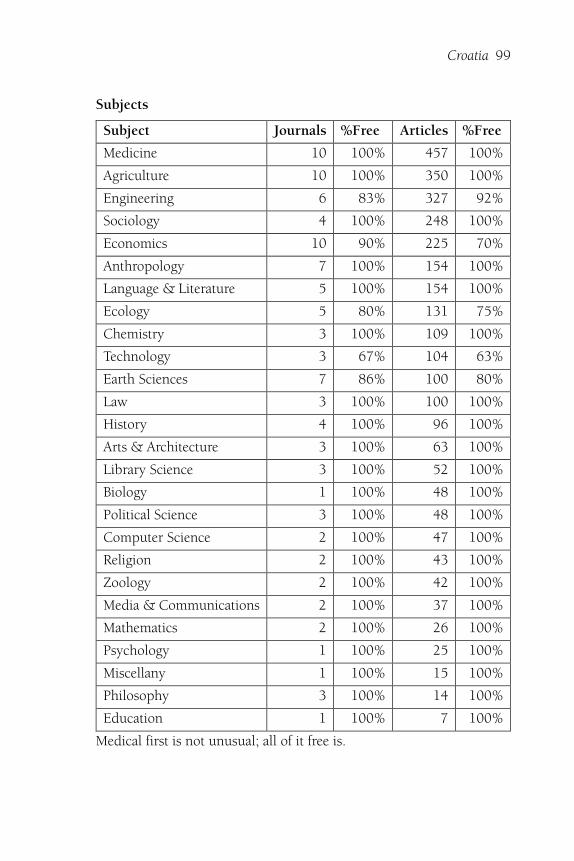
Subjects
Subject Journals %Free Articles %Free
Medicine 10 100% 457 100%
Agriculture 10 100% 350 100%
Engineering 6 83% 327 92%
Sociology 4 100% 248 100%
Economics 10 90% 225 70%
Anthropology 7 100% 154 100%
Language & Literature 5 100% 154 100%
Ecology 5 80% 131 75%
Chemistry 3 100% 109 100%
Technology 3 67% 104 63%
Earth Sciences 7 86% 100 80%
Law 3 100% 100 100%
History 4 100% 96 100%
Arts & Architecture 3 100% 63 100%
Library Science 3 100% 52 100%
Biology 1 100% 48 100%
Political Science 3 100% 48 100%
Computer Science 2 100% 47 100%
Religion 2 100% 43 100%
Zoology 2 100% 42 100%
Media & Communications 2 100% 37 100%
Mathematics 2 100% 26 100%
Psychology 1 100% 25 100%
Miscellany 1 100% 15 100%
Philosophy 3 100% 14 100%
Education 1 100% 7 100%
Medical first is not unusual; all of it free is.

100
Czech Republic
The Czech Republic has 87 OAWorld open access journals. 2015 aver-age cost per article in fee journals: $434. Overall average: $224.
Journals and Articles
2015 2014 2013 2012 2011
Journals 85 84 83 80 71
%Free 73% 73% 72% 71% 70%
Articles 2,696 2,899 2,720 2,600 2,665
%Free 48% 48% 56% 53% 54%
Free journals peaked in 2013, pay journals in 2014.

Czech Republic 101
Article Volume
Journals %Free Articles %Free
Large: 150-599 2 0% 450 0%
Med.: 60-149 9 33% 774 26%
Small: 20-59 31 77% 967 71%
Smallest: 0-19 45 82% 505 82%
Classic pattern: the larger the journal, the more likely it charges APCs.
APC Levels and Revenues
Journals Articles Revenue $/article
$1,400+ 1 160 $293,120 $1,832
$600-$1.399 1 88 $58,520 $665
$200-$599 12 696 $187,956 $270
$2-$199 9 448 $65,006 $145
Free 64 1,304
Total 87 2,696 $604,602 $224
Publisher Category
Category Journals %Free Articles %Free
Univ/college 52 71% 1,524 53%
Miscellaneous 19 63% 730 30%
Society/govt 8 88% 324 51%
Traditional 6 100% 82 100%
Open Access 2 100% 36 100%
Atypically, OA and traditional publishers don’t charge.

102 The Countries of OAWorld 2011-2015
Starting Date
Growth and Shrinkage
Change 2014-15 Count Percent Cum%
Grew 50%+ 12 13.8%
Grew 10-49% 13 14.9% 28.7%
Even, ±9.99% 22 25.3% 54.0%
Shrank 10-49% 28 32.2% 86.2%
Shrank 50%+ 9 10.3% 96.6%
More shrinkage than growth, but more rapid growth than shrinkage.
Gray OA and DOAJ16
GrayOA %Gray DOAJ16
Journals/Free 14 22% 50
Journals/Pay 5 22% 18
Articles/Free 208 16% 1,096
Articles/Pay 638 46% 754
Moderately low journal delisting rate, but a high rate of loss amongAPC-charging journals.

Czech Republic 103
Subjects
Subject Journals %Free Articles %Free
Agriculture 13 38% 567 16%
Other Sciences 2 50% 355 18%
Engineering 6 83% 338 62%
Economics 14 79% 212 82%
Chemistry 3 67% 198 19%
Medicine 6 50% 188 36%
Miscellany 3 0% 105 0%
Political Science 5 100% 84 100%
Anthropology 5 100% 77 100%
Computer Science 3 100% 64 100%
Language & Literature 4 100% 61 100%
Zoology 1 0% 60 0%
Education 3 100% 57 100%
Mathematics 2 100% 52 100%
Earth Sciences 3 100% 47 100%
Physics 2 100% 47 100%
Ecology 2 50% 39 77%
Psychology 2 100% 37 100%
Media & Communications 2 100% 35 100%
Biology 1 100% 26 100%
Technology 2 100% 21 100%
Sociology 2 50% 17 71%
Library Science 1 100% 9 100%
Lots of agriculture, not much medicine.

104
Estonia
Estonia has 22 OAWorld open access journals, none of which has articleprocessing charges, so most tables are modified or omitted.
Journals and Articles
2015 2014 2013 2012 2011
Journals 19 20 22 20 19
Articles 356 400 368 351 336
Two journals account for most of the dip in 2015.

Estonia 105
Article Volume
Journals Articles
Small: 20-59 7 203
Smallest: 0-19 15 153
All small journals, some smaller than others.
Publisher Category
Category Journals Articles
Univ/college 11 177
Miscellaneous 7 143
Society/govt 3 36
Open Access 1 0
Growth and Shrinkage
Change 2014-15 Count Percent Cum%
Grew 10-49% 4 18.2% 18.2%
Even, ±9.99% 9 40.9% 59.1%
Shrank 10-49% 4 18.2% 77.3%
Shrank 50%+ 3 13.6% 90.9%
High degree of stability but more shrinkage than growth.
Gray OA and DOAJ16
GrayOA %Gray DOAJ16
Journals/Free 5 23% 17
Articles/Free 88 25% 268
Slightly low delisting rate.
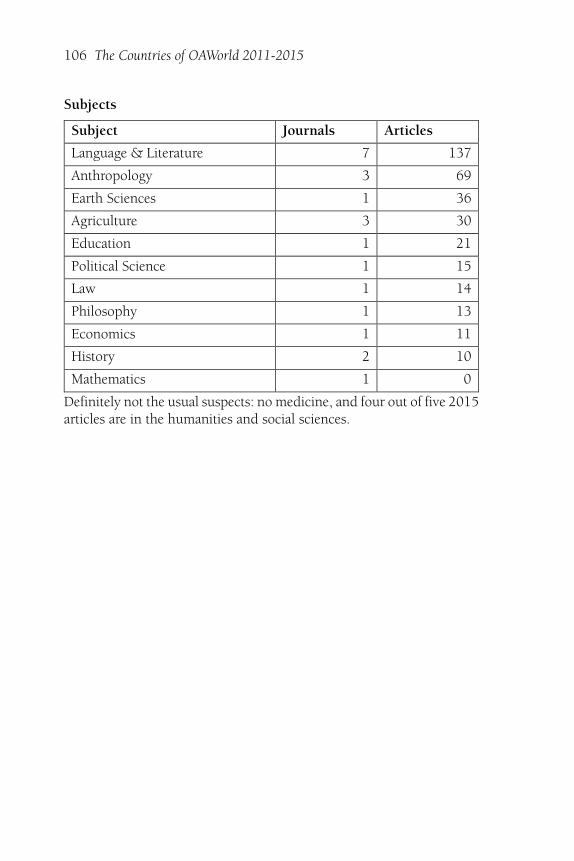
106 The Countries of OAWorld 2011-2015
Subjects
Subject Journals Articles
Language & Literature 7 137
Anthropology 3 69
Earth Sciences 1 36
Agriculture 3 30
Education 1 21
Political Science 1 15
Law 1 14
Philosophy 1 13
Economics 1 11
History 2 10
Mathematics 1 0
Definitely not the usual suspects: no medicine, and four out of five 2015articles are in the humanities and social sciences.

107
Hungary
Hungary has 33 OAWorld OA journals. In 2015, average cost per articlein the single fee-charging journal was $109; overall average was $9.
Journals and Articles
2015 2014 2013 2012 2011
Journals 32 32 31 30 27
%Free 97% 97% 97% 97% 100%
Articles 1,070 1,114 1,052 921 735
%Free 92% 85% 81% 83% 100%
Free journals continue to grow, but the pay journal had a slow 2015.

108 The Countries of OAWorld 2011-2015
Article Volume
Journals %Free Articles %Free
Med.: 60-149 6 83% 579 85%
Small: 20-59 12 100% 355 100%
Smallest: 0-19 15 100% 136 100%
Another country with no large OA journals.
APC Levels and Revenues
Journals Articles Revenue $/article
$2-$199 1 84 $9,156 $109
Free 32 986
Total 33 1,070 $9,156 $9
Publisher Category
Category Journals %Free Articles %Free
Univ/college 19 100% 631 100%
Miscellaneous 7 86% 275 69%
Society/govt 6 100% 154 100%
Traditional 1 100% 10 100%

Hungary 109
Starting Date
Growth and Shrinkage
Change 2014-15 Count Percent Cum%
Grew 50%+ 5 15.2%
Grew 10-49% 7 21.2% 36.4%
Even, ±9.99% 6 18.2% 54.5%
Shrank 10-49% 10 30.3% 84.8%
Shrank 50%+ 4 12.1% 97.0%
Slightly more shrinkage than growth.
Gray OA and DOAJ16
GrayOA %Gray DOAJ16
Journals/Free 11 34% 21
Journals/Pay 0 0% 1
Articles/Free 328 33% 658
Articles/Pay 0 0% 84
Slightly high delisting percentage among free journals.

110 The Countries of OAWorld 2011-2015
Subjects
Subject Journals %Free Articles %Free
Mathematics 3 100% 235 100%
Technology 2 100% 208 100%
Ecology 3 100% 95 100%
Chemistry 2 50% 94 11%
Language & Literature 6 100% 92 100%
Agriculture 3 100% 69 100%
Medicine 3 100% 51 100%
History 1 100% 49 100%
Engineering 2 100% 37 100%
Earth Sciences 1 100% 30 100%
Zoology 1 100% 25 100%
Economics 1 100% 23 100%
Sociology 1 100% 22 100%
Education 1 100% 16 100%
Media & Communications 1 100% 15 100%
Anthropology 1 100% 9 100%
Political Science 1 100% 0
An interesting mix at the top: math, technology, ecology and chemistry.

111
Lithuania
Lithuania has 35 OAWorld open access journals. In 2015, average costper article in APC-charging journals was $368. Overall average: $79.
Journals and Articles
2015 2014 2013 2012 2011
Journals 33 33 34 29 28
%Free 91% 91% 91% 90% 93%
Articles 898 1,051 1,113 893 982
%Free 79% 80% 83% 78% 79%
Most of the 2015 decline is among free journals.

112 The Countries of OAWorld 2011-2015
Article Volume
Journals %Free Articles %Free
Med.: 60-149 3 67% 260 56%
Small: 20-59 13 85% 418 81%
Smallest: 0-19 19 100% 220 100%
APC Levels and Revenues
Journals Articles Revenue $/article
$200-$599 1 114 $63,612 $558
$2-$199 2 78 $7,122 $91
Free 32 706
Total 35 898 $70,734 $79
Publisher Category
Category Journals %Free Articles %Free
Univ/college 29 90% 815 76%
Miscellaneous 5 100% 67 100%
Open Access 1 100% 16 100%
Primarily university publishing; somewhat unusual in that all APC-charging journals are from universities.

Lithuania 113
Starting Date
Growth and Shrinkage
Change 2014-15 Count Percent Cum%
Grew 50%+ 2 5.7%
Grew 10-49% 7 20.0% 25.7%
Even, ±9.99% 9 25.7% 51.4%
Shrank 10-49% 11 31.4% 82.9%
Shrank 50%+ 4 11.4% 94.3%
Considerably more shrinkage than growth.
Gray OA and DOAJ16
GrayOA %Gray DOAJ16
Journals/Free 6 19% 26
Journals/Pay 0 0% 3
Articles/Free 102 14% 604
Articles/Pay 0 0% 192
Low delisting percentage, even lower article percentage.

114 The Countries of OAWorld 2011-2015
Subjects
Subject Journals %Free Articles %Free
Economics 4 75% 139 63%
Language & Literature 6 100% 123 100%
Technology 1 0% 114 0%
Education 2 100% 84 100%
Biology 1 100% 82 100%
Mathematics 3 100% 65 100%
Sociology 3 67% 50 46%
Library Science 2 100% 41 100%
Law 2 100% 35 100%
Political Science 3 100% 35 100%
Ecology 2 100% 31 100%
Computer Science 2 100% 25 100%
Religion 1 100% 23 100%
Medicine 1 100% 21 100%
Media & Communications 1 100% 17 100%
Psychology 1 100% 13 100%
Varied coverage, strong on HSS and low on medicine.
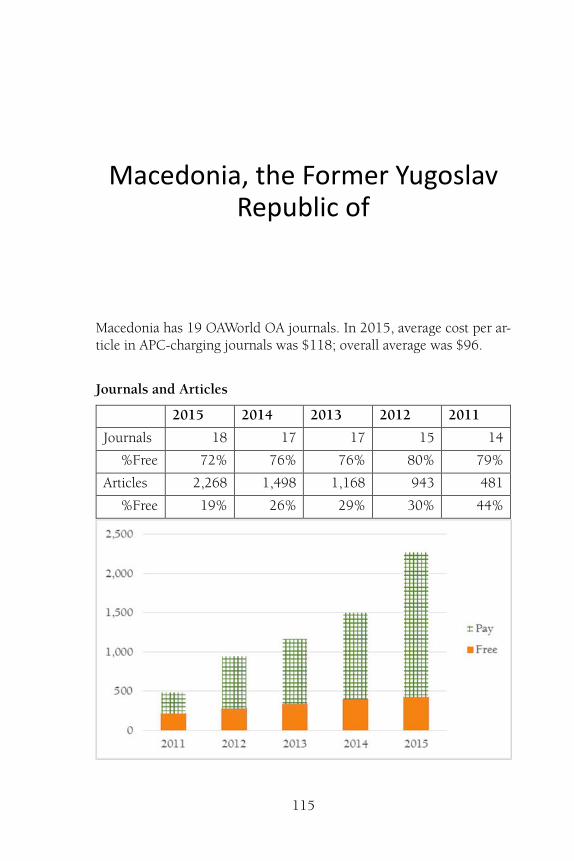
115
Macedonia, the Former YugoslavRepublic of
Macedonia has 19 OAWorld OA journals. In 2015, average cost per ar-ticle in APC-charging journals was $118; overall average was $96.
Journals and Articles
2015 2014 2013 2012 2011
Journals 18 17 17 15 14
%Free 72% 76% 76% 80% 79%
Articles 2,268 1,498 1,168 943 481
%Free 19% 26% 29% 30% 44%

116 The Countries of OAWorld 2011-2015
Free journals have grown each year, but one fast-growing APC-chargingmultidisciplinary journal is much larger than all of them put together.(Note: pre-2015 counts for that complex journal are approximations.)
Article Volume
Journals %Free Articles %Free
Largest: 600+ 1 0% 1,645 0%
Med.: 60-149 3 67% 273 53%
Small: 20-59 8 88% 290 84%
Smallest: 0-19 7 71% 60 65%
APC Levels and Revenues
Journals Articles Revenue $/article
$200-$599 3 186 $45,310 $244
$2-$199 2 1,655 $172,150 $104
Free 14 427
Total 19 2,268 $217,460 $96
Publisher Category
Category Journals %Free Articles %Free
Miscellaneous 5 40% 1,915 5%
Univ/college 9 89% 183 95%
Society/govt 4 100% 159 100%
Open Access 1 0% 11 0%

Macedonia, the Former Yugoslav Republic of 117
Growth and Shrinkage
Change 2014-15 Count Percent Cum%
Grew 50%+ 3 15.8%
Grew 10-49% 4 21.1% 36.8%
Even, ±9.99% 4 21.1% 57.9%
Shrank 10-49% 3 15.8% 73.7%
Shrank 50%+ 3 15.8% 89.5%
More growth than shrinkage.
Gray OA and DOAJ16
GrayOA %Gray DOAJ16
Journals/Free 4 29% 10
Journals/Pay 0 0% 5
Articles/Free 114 27% 313
Articles/Pay 0 0% 1,841
Typical free-journal delisting rate, with no pay-journal losses.
Subjects
Subject Journals %Free Articles %Free
Miscellany 1 0% 1,645 0%
Anthropology 5 100% 192 100%
Medicine 3 67% 158 18%
Sociology 2 100% 82 100%
Biology 2 0% 57 0%
Chemistry 1 100% 41 100%
Economics 1 100% 33 100%
Political Science 3 67% 30 67%
Zoology 1 100% 30 100%
Since the interdisciplinary journal is primarily HSS (despite “Science”in the title), it’s fair to say HSS dominates the Macedonian OA field.

118
Moldova
Moldova has a dozen OAWorld open access journals. None of themcharge APCS, and all of them are still in DOAJ, making this a very briefchapter. More than half of them started in 2006-2007.
Journals and Articles
2015 2014 2013 2012 2011
Journals 11 12 12 12 12
Articles 490 548 542 612 632

Moldova 119
Article Volume
Journals Articles
Med.: 60-149 3 193
Small: 20-59 6 263
Smallest: 0-19 3 34
Publisher Category
Category Journals Articles
Univ/college 8 341
Society/govt 4 149
Growth and Shrinkage
Change 2014-15 Count Percent Cum%
Grew 10-49% 2 16.7%
Even, ±9.99% 4 33.3% 50.0%
Shrank 10-49% 5 41.7% 91.7%
Shrank 50%+ 1 8.3% 100.0%
Much more shrinkage than growth.

120 The Countries of OAWorld 2011-2015
Subjects
Subject Journals Articles
Chemistry 2 92
Education 1 73
Arts & Architecture 1 60
Sociology 1 57
Economics 1 52
History 1 51
Technology 1 46
Computer Science 1 25
Mathematics 1 18
Language & Literature 2 16

121
Poland
Poland has 343 OAWorld open access journals. For 2015, average costper article in fee journals was $475; overall average was $87.
Journals and Articles
2015 2014 2013 2012 2011
Journals 322 334 303 236 192
%Free 90% 90% 89% 87% 85%
Articles 12,389 12,487 11,921 9,401 7,719
%Free 82% 78% 72% 69% 71%
Predominantly free, with a tiny drop (pay articles) in 2015.
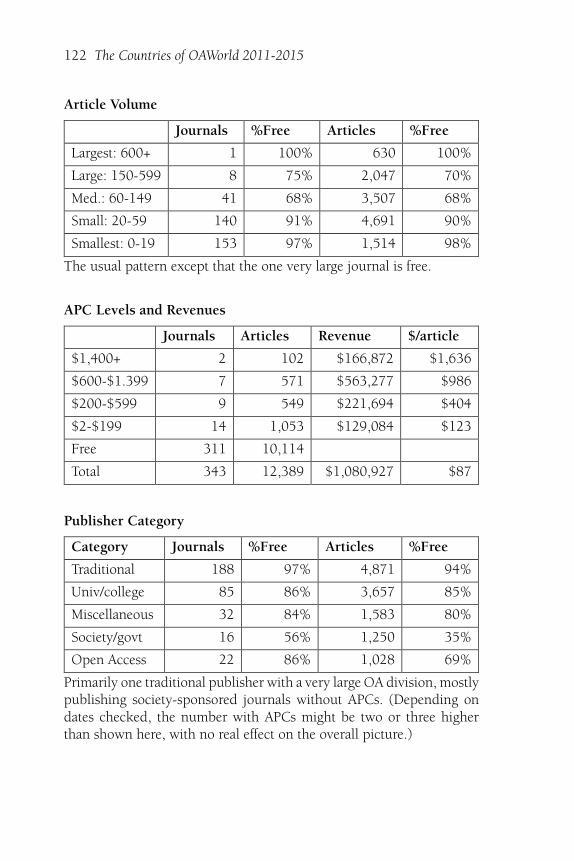
122 The Countries of OAWorld 2011-2015
Article Volume
Journals %Free Articles %Free
Largest: 600+ 1 100% 630 100%
Large: 150-599 8 75% 2,047 70%
Med.: 60-149 41 68% 3,507 68%
Small: 20-59 140 91% 4,691 90%
Smallest: 0-19 153 97% 1,514 98%
The usual pattern except that the one very large journal is free.
APC Levels and Revenues
Journals Articles Revenue $/article
$1,400+ 2 102 $166,872 $1,636
$600-$1.399 7 571 $563,277 $986
$200-$599 9 549 $221,694 $404
$2-$199 14 1,053 $129,084 $123
Free 311 10,114
Total 343 12,389 $1,080,927 $87
Publisher Category
Category Journals %Free Articles %Free
Traditional 188 97% 4,871 94%
Univ/college 85 86% 3,657 85%
Miscellaneous 32 84% 1,583 80%
Society/govt 16 56% 1,250 35%
Open Access 22 86% 1,028 69%
Primarily one traditional publisher with a very large OA division, mostlypublishing society-sponsored journals without APCs. (Depending ondates checked, the number with APCs might be two or three higherthan shown here, with no real effect on the overall picture.)

Poland 123
Starting Date
In some cases—here and elsewhere—the date started may be the datethe current publisher took over or the date the journal became OA.
Growth and Shrinkage
Change 2014-15 Count Percent Cum%
Grew 50%+ 47 13.7%
Grew 10-49% 57 16.6% 30.3%
Even, ±9.99% 94 27.4% 57.7%
Shrank 10-49% 83 24.2% 81.9%
Shrank 50%+ 53 15.5% 97.4%
Gray OA and DOAJ16
GrayOA %Gray DOAJ16
Journals/Free 29 9% 282
Journals/Pay 7 22% 25
Articles/Free 1,003 10% 9,111
Articles/Pay 693 30% 1,582
Very low rate of delisting for free journals.

124 The Countries of OAWorld 2011-2015
Subjects
Subject Journals %Free Articles %Free
Medicine 53 83% 2,561 76%
Physics 11 91% 1,156 96%
Technology 11 82% 1,113 82%
Agriculture 26 77% 799 61%
Sociology 13 100% 757 100%
Engineering 22 95% 711 95%
Economics 23 91% 585 88%
Mathematics 20 95% 554 86%
Earth Sciences 21 100% 544 100%
Ecology 17 94% 529 80%
Other Sciences 2 50% 477 8%
Anthropology 15 87% 420 80%
Biology 14 86% 337 52%
Language & Literature 20 100% 279 100%
Education 8 88% 238 98%
Chemistry 7 86% 227 66%
Zoology 9 89% 216 93%
Philosophy 8 100% 151 100%
Computer Science 10 90% 130 92%
Psychology 4 100% 113 100%
Arts & Architecture 5 100% 112 100%
Political Science 7 100% 112 100%
Religion 5 100% 104 100%
Library Science 4 100% 78 100%
History 3 100% 40 100%
Media & Communications 2 100% 25 100%
Law 3 100% 21 100%

125
Romania
Romania has 322 OAWorld open access journals. Average 2015 cost perarticle in APC-charging journals: $93. Overall average: $30.
Journals and Articles
2015 2014 2013 2012 2011
Journals 302 310 306 284 264
%Free 84% 84% 85% 86% 86%
Articles 12,734 12,841 11,768 12,077 12,169
%Free 69% 71% 77% 77% 77%
Free journals down in 2015, pay journals up.

126 The Countries of OAWorld 2011-2015
Article Volume
Journals %Free Articles %Free
Largest: 600+ 1 0% 1,004 0%
Large: 150-599 8 75% 1,606 76%
Med.: 60-149 51 59% 4,547 57%
Small: 20-59 128 87% 4,177 86%
Smallest: 0-19 134 93% 1,400 94%
Slightly atypical, with six of eight large journals free.
APC Levels and Revenues
Journals Articles Revenue $/article
$600-$1.399 1 75 $48,825 $651
$200-$599 5 304 $94,765 $312
$2-$199 44 3,630 $233,787 $64
Free 272 8,725
Total 322 12,734 $377,377 $30
Almost all fees are fairly nominal, thus the low average costs.
Publisher Category
Category Journals %Free Articles %Free
Univ/college 199 85% 7,922 73%
Miscellaneous 87 86% 3,330 61%
Society/govt 21 81% 853 71%
Open Access 10 50% 516 39%
Traditional 5 100% 113 100%

Romania 127
Starting Date
Mostly fairly recent, but with earlier-than-usual new-journal peaks.
Growth and Shrinkage
Change 2014-15 Count Percent Cum%
Grew 50%+ 50 15.5%
Grew 10-49% 68 21.1% 36.6%
Even, ±9.99% 73 22.7% 59.3%
Shrank 10-49% 80 24.8% 84.2%
Shrank 50%+ 39 12.1% 96.3%
Almost precisely equal shrinkage and growth, but more fast growth.
Gray OA and DOAJ16
GrayOA %Gray DOAJ16
Journals/Free 57 21% 215
Journals/Pay 5 10% 45
Articles/Free 2,134 24% 6,591
Articles/Pay 460 11% 3,549
Slightly low free delisting rate, very low pay delisting rate,

128 The Countries of OAWorld 2011-2015
Subjects
Subject Journals %Free Articles %Free
Economics 61 72% 2,582 64%
Sociology 13 85% 1,513 25%
Medicine 21 71% 1,071 66%
Agriculture 17 82% 1,035 71%
Engineering 13 92% 762 97%
Zoology 12 50% 634 56%
Political Science 24 100% 602 100%
Language & Literature 11 100% 473 100%
Computer Science 18 78% 455 53%
Anthropology 10 70% 403 43%
Law 11 100% 385 100%
Miscellany 4 50% 317 44%
Earth Sciences 19 100% 307 100%
Education 12 92% 290 91%
Arts & Architecture 9 89% 274 64%
Technology 8 88% 270 71%
Biology 7 86% 247 81%
Mathematics 13 100% 239 100%
Philosophy 8 88% 205 81%
Ecology 4 75% 153 54%
History 7 100% 135 100%
Chemistry 3 100% 107 100%
Physics 3 100% 97 100%
Media & Communications 5 100% 59 100%
Other Sciences 4 100% 54 100%
Religion 3 100% 51 100%
Psychology 1 100% 14 100%
Library Science 1 100% 0

129
Russian Federa�on
Russia has 147 OAWorld open access journals. The 2015 average costper article in APC-charging journals was $187; overall average, $35.
Journals and Articles
2015 2014 2013 2012 2011
Journals 145 143 142 127 103
%Free 94% 94% 94% 93% 93%
Articles 10,625 12,181 12,979 10,738 8,003
%Free 81% 75% 75% 85% 86%
Drop in publishing since 2013 is mostly, but not all, pay journals.

130 The Countries of OAWorld 2011-2015
Article Volume
Journals %Free Articles %Free
Largest: 600+ 2 50% 2,047 40%
Large: 150-599 6 83% 1,774 75%
Med.: 60-149 44 93% 3,796 94%
Small: 20-59 73 96% 2,748 97%
Smallest: 0-19 22 95% 260 95%
APC Levels and Revenues
Journals Articles Revenue $/article
$600-$1.399 1 67 $67,302 $1,005
$200-$599 3 1,268 $276,074 $218
$2-$199 5 653 $27,745 $42
Free 138 8,637
Total 147 10,625 $371,121 $35
Publisher Category
Category Journals %Free Articles %Free
Univ/college 81 96% 5,678 98%
Miscellaneous 50 90% 4,329 56%
Open Access 9 100% 343 100%
Traditional 4 100% 141 100%
Society/govt 3 67% 134 91%
Unusual in that all journals from multijournal OA and traditional pub-lishers are free.

Russian Federation 131
Starting Date
Growth and Shrinkage
Change 2014-15 Count Percent Cum%
Grew 50%+ 13 8.8%
Grew 10-49% 27 18.4% 27.2%
Even, ±9.99% 46 31.3% 58.5%
Shrank 10-49% 43 29.3% 87.8%
Shrank 50%+ 14 9.5% 97.3%
Sizable steady-state group, but considerably more shrinkage than growth.
Gray OA and DOAJ16
GrayOA %Gray DOAJ16
Journals/Free 33 24% 105
Journals/Pay 1 11% 8
Articles/Free 2,189 25% 6,448
Articles/Pay 28 1% 1,960
Moderate free delisting, but only one small delisted pay journal.

132 The Countries of OAWorld 2011-2015
Subjects
Subject Journals %Free Articles %Free
Miscellany 11 64% 2,104 33%
Other Sciences 3 67% 1,284 65%
Medicine 24 100% 1,116 100%
Education 5 80% 874 97%
Language & Literature 9 100% 610 100%
Psychology 12 100% 533 100%
Economics 8 100% 523 100%
Engineering 6 100% 397 100%
Law 7 100% 388 100%
Arts & Architecture 4 100% 355 100%
History 6 100% 351 100%
Chemistry 3 100% 341 100%
Computer Science 4 100% 284 100%
Earth Sciences 6 100% 214 100%
Sociology 4 100% 188 100%
Agriculture 4 75% 165 62%
Mathematics 3 100% 142 100%
Philosophy 3 100% 123 100%
Physics 5 80% 116 90%
Religion 2 100% 109 100%
Ecology 3 67% 101 66%
Political Science 3 100% 93 100%
Technology 3 100% 73 100%
Anthropology 4 100% 51 100%
Zoology 2 100% 40 100%
Media & Communications 2 100% 33 100%
Biology 1 100% 17 100%
Very strong on multidisciplinary journals of all varieties.
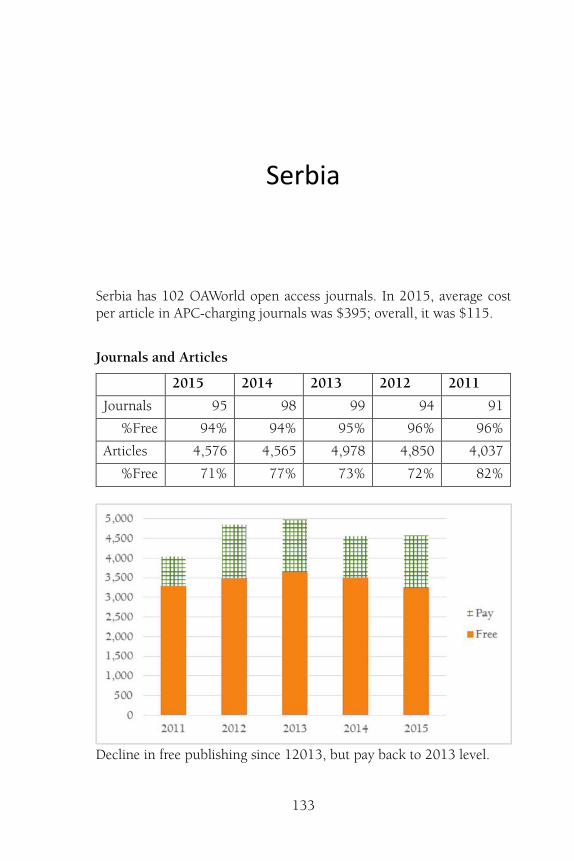
133
Serbia
Serbia has 102 OAWorld open access journals. In 2015, average costper article in APC-charging journals was $395; overall, it was $115.
Journals and Articles
2015 2014 2013 2012 2011
Journals 95 98 99 94 91
%Free 94% 94% 95% 96% 96%
Articles 4,576 4,565 4,978 4,850 4,037
%Free 71% 77% 73% 72% 82%
Decline in free publishing since 12013, but pay back to 2013 level.

134 The Countries of OAWorld 2011-2015
Article Volume
Journals %Free Articles %Free
Largest: 600+ 1 0% 841 0%
Large: 150-599 4 75% 893 65%
Med.: 60-149 8 88% 731 91%
Small: 20-59 48 94% 1,680 93%
Smallest: 0-19 41 100% 431 100%
APC Levels and Revenues
Journals Articles Revenue $/article
$200-$599 1 841 $458,345 $545
$2-$199 5 492 $67,972 $138
Free 96 3,243
Total 102 4,576 $526,317 $115
The one big journal is also the most expensive journal.
Publisher Category
Category Journals %Free Articles %Free
Univ/college 60 98% 2,035 84%
Miscellaneous 20 85% 1,451 36%
Society/govt 20 90% 1,056 92%
Traditional 2 100% 34 100%

Serbia 135
Starting Date
2002 was a banner year for free OA in what is now Serbia (nearly all ofthose in 2002-2003 show 2002 start dates).
Growth and Shrinkage
Change 2014-15 Count Percent Cum%
Grew 50%+ 4 3.9%
Grew 10-49% 26 25.5% 29.4%
Even, ±9.99% 28 27.5% 56.9%
Shrank 10-49% 29 28.4% 85.3%
Shrank 50%+ 11 10.8% 96.1%
Much more shrinkage than growth.
Gray OA and DOAJ16
GrayOA %Gray DOAJ16
Journals/Free 20 21% 76
Journals/Pay 1 17% 5
Articles/Free 775 24% 2,468
Articles/Pay 841 63% 492
The only delisted pay journal is also the largest journal.

136 The Countries of OAWorld 2011-2015
Subjects
Subject Journals %Free Articles %Free
Chemistry 6 67% 1,175 23%
Medicine 10 90% 574 95%
Engineering 10 90% 559 43%
Mathematics 5 100% 367 100%
Economics 11 91% 293 78%
Biology 2 100% 267 100%
Sociology 3 100% 168 100%
Agriculture 5 100% 164 100%
Anthropology 6 100% 156 100%
Education 5 80% 121 78%
Philosophy 3 100% 118 100%
Technology 3 100% 96 100%
Computer Science 3 100% 82 100%
Language & Literature 7 100% 78 100%
Zoology 3 100% 75 100%
History 4 100% 65 100%
Earth Sciences 5 100% 54 100%
Arts & Architecture 4 100% 47 100%
Ecology 1 100% 28 100%
Psychology 1 100% 27 100%
Other Sciences 2 100% 25 100%
Political Science 2 100% 23 100%
Law 1 100% 14 100%

137
Slovakia
Slovakia has 43 OAWorld open access journals. The average 2015 costper article in fee-charging journals was $137; overall average was $21.
Journals and Articles
2015 2014 2013 2012 2011
Journals 42 41 39 35 34
%Free 90% 90% 92% 94% 94%
Articles 1,172 1,102 1,088 996 680
%Free 84% 87% 94% 93% 88%
Slight dip in free journal activity, but overall shows increase.

138 The Countries of OAWorld 2011-2015
Article Volume
Journals %Free Articles %Free
Large: 150-599 1 100% 165 100%
Med.: 60-149 3 67% 227 59%
Small: 20-59 17 88% 530 86%
Smallest: 0-19 22 95% 250 95%
APC Levels and Revenues
Journals Articles Revenue $/article
$200-$599 1 55 $12,155 $221
$2-$199 3 127 $12,836 $101
Free 39 990
Total 43 1,172 $24,991 $21
What few fees there are, are typically low.
Publisher Category
Category Journals %Free Articles %Free
Univ/college 14 93% 489 96%
Miscellaneous 12 83% 311 78%
Society/govt 3 67% 153 39%
Traditional 10 100% 147 100%
Open Access 4 100% 72 100%

Slovakia 139
Starting Date
Growth and Shrinkage
Change 2014-15 Count Percent Cum%
Grew 50%+ 6 14.0%
Grew 10-49% 6 14.0% 27.9%
Even, ±9.99% 10 23.3% 51.2%
Shrank 10-49% 16 37.2% 88.4%
Shrank 50%+ 3 7.0% 95.3%
Much more moderate shrinkage—but more fast growth than shrinkage.
Gray OA and DOAJ16
GrayOA %Gray DOAJ16
Journals/Free 10 26% 29
Journals/Pay 0 0% 4
Articles/Free 210 21% 780
Articles/Pay 0 0% 182
Fairly typical free delisting, no pay delisting.
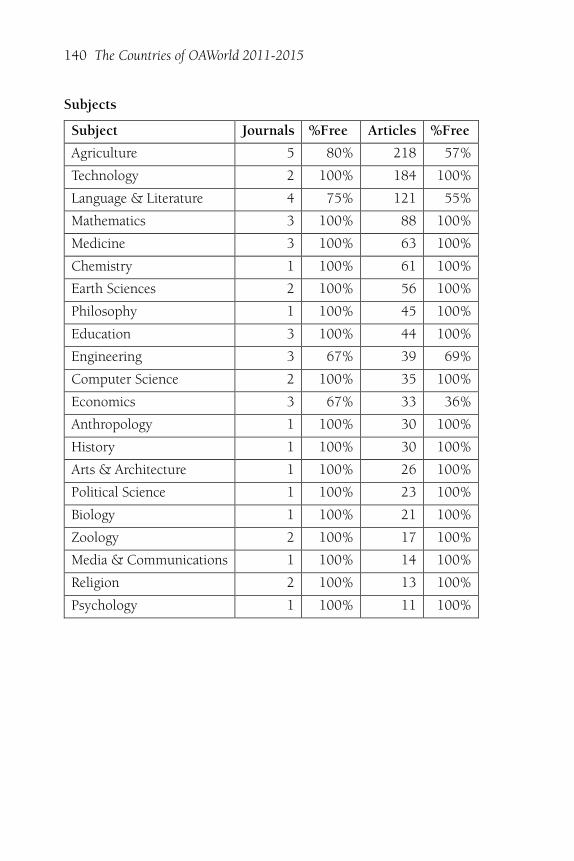
140 The Countries of OAWorld 2011-2015
Subjects
Subject Journals %Free Articles %Free
Agriculture 5 80% 218 57%
Technology 2 100% 184 100%
Language & Literature 4 75% 121 55%
Mathematics 3 100% 88 100%
Medicine 3 100% 63 100%
Chemistry 1 100% 61 100%
Earth Sciences 2 100% 56 100%
Philosophy 1 100% 45 100%
Education 3 100% 44 100%
Engineering 3 67% 39 69%
Computer Science 2 100% 35 100%
Economics 3 67% 33 36%
Anthropology 1 100% 30 100%
History 1 100% 30 100%
Arts & Architecture 1 100% 26 100%
Political Science 1 100% 23 100%
Biology 1 100% 21 100%
Zoology 2 100% 17 100%
Media & Communications 1 100% 14 100%
Religion 2 100% 13 100%
Psychology 1 100% 11 100%

141
Slovenia
Slovenia has 54 OAWorld open access journals. In 2015, articles in thesole fee-charging journals cost $220 each; overall average was $3.
Journals and Articles
2015 2014 2013 2012 2011
Journals 53 54 54 51 46
%Free 98% 98% 98% 98% 98%
Articles 1,437 1,434 1,524 1,539 1,319
%Free 99% 98% 99% 99% 99%
Down slightly from 2012 peak.
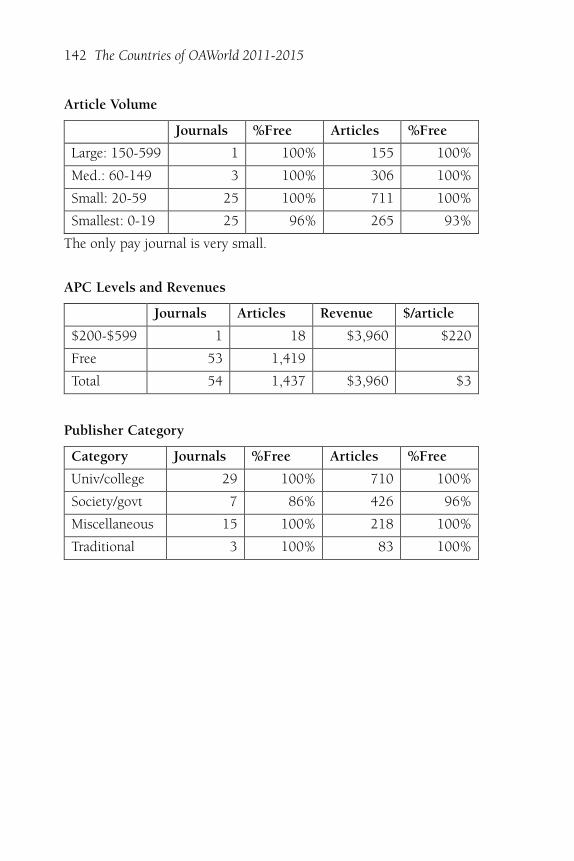
142 The Countries of OAWorld 2011-2015
Article Volume
Journals %Free Articles %Free
Large: 150-599 1 100% 155 100%
Med.: 60-149 3 100% 306 100%
Small: 20-59 25 100% 711 100%
Smallest: 0-19 25 96% 265 93%
The only pay journal is very small.
APC Levels and Revenues
Journals Articles Revenue $/article
$200-$599 1 18 $3,960 $220
Free 53 1,419
Total 54 1,437 $3,960 $3
Publisher Category
Category Journals %Free Articles %Free
Univ/college 29 100% 710 100%
Society/govt 7 86% 426 96%
Miscellaneous 15 100% 218 100%
Traditional 3 100% 83 100%

Slovenia 143
Starting Date
Growth and Shrinkage
Change 2014-15 Count Percent Cum%
Grew 50%+ 6 11.1%
Grew 10-49% 14 25.9% 37.0%
Even, ±9.99% 18 33.3% 70.4%
Shrank 10-49% 10 18.5% 88.9%
Shrank 50%+ 6 11.1% 100.0%
More growth than shrinkage.
Gray OA and DOAJ16
GrayOA %Gray DOAJ16
Journals/Free 11 21% 42
Journals/Pay 0 0% 1
Articles/Free 216 15% 1,203
Articles/Pay 0 0% 18
Slightly low free-journal delisting, mostly smaller journals.

144 The Countries of OAWorld 2011-2015
Subjects
Subject Journals %Free Articles %Free
Language & Literature 9 100% 191 100%
Medicine 3 67% 157 89%
Technology 1 100% 155 100%
Chemistry 1 100% 149 100%
Anthropology 5 100% 143 100%
Economics 7 100% 139 100%
Earth Sciences 4 100% 85 100%
Education 4 100% 83 100%
Agriculture 3 100% 63 100%
Computer Science 1 100% 45 100%
Arts & Architecture 4 100% 44 100%
Miscellany 1 100% 32 100%
Zoology 2 100% 31 100%
Sociology 1 100% 29 100%
History 1 100% 28 100%
Library Science 2 100% 28 100%
Political Science 2 100% 16 100%
Biology 1 100% 10 100%
Philosophy 1 100% 9 100%
Law 1 100% 0

145
Ukraine
Ukraine has 69 OAWorld open access journals. Average cost per articlein 2015 in APC-charging journals: $43. Average cost overall: $9.
Journals and Articles
2015 2014 2013 2012 2011
Journals 64 68 63 58 49
%Free 89% 90% 89% 88% 88%
Articles 4,416 5,185 5,064 4,947 4,644
%Free 79% 77% 75% 74% 74%
Paid activity peaked in 2012, free journals in 2014.

146 The Countries of OAWorld 2011-2015
Article Volume
Journals %Free Articles %Free
Largest: 600+ 1 0% 618 0%
Large: 150-599 3 100% 578 100%
Med.: 60-149 20 90% 1,726 91%
Small: 20-59 33 88% 1,408 88%
Smallest: 0-19 12 100% 86 100%
APC Levels and Revenues
Journals Articles Revenue $/article
$2-$199 7 935 $40,179 $43
Free 62 3,481
Total 69 4,416 $40,179 $9
All APCs are fairly nominal.
Publisher Category
Category Journals %Free Articles %Free
Univ/college 54 91% 3,637 76%
Miscellaneous 9 78% 495 86%
Society/govt 5 100% 226 100%
Traditional 1 100% 58 100%
Dominated by university publications, which is fairly typical.

Ukraine 147
Starting Date
More recent peak than usual, in 2012-2013.
Growth and Shrinkage
Change 2014-15 Count Percent Cum%
Grew 50%+ 7 10.1%
Grew 10-49% 15 21.7% 31.9%
Even, ±9.99% 12 17.4% 49.3%
Shrank 10-49% 24 34.8% 84.1%
Shrank 50%+ 10 14.5% 98.6%
Considerably more shrinkage than growth.
Gray OA and DOAJ16
GrayOA %Gray DOAJ16
Journals/Free 12 19% 50
Journals/Pay 0 0% 7
Articles/Free 607 17% 2,874
Articles/Pay 0 0% 935
Relatively low delisting rate for free journals, none among the paid ones.

148 The Countries of OAWorld 2011-2015
Subjects
Subject Journals %Free Articles %Free
Economics 10 60% 1,022 21%
Physics 7 100% 664 100%
Engineering 5 80% 300 86%
Miscellany 3 100% 266 100%
Medicine 5 100% 258 100%
Computer Science 6 100% 220 100%
Education 2 100% 220 100%
Anthropology 2 100% 219 100%
Mathematics 4 100% 187 100%
Philosophy 3 100% 161 100%
Technology 4 75% 151 65%
Agriculture 3 100% 146 100%
Biology 3 100% 134 100%
Zoology 2 50% 96 60%
Chemistry 2 100% 83 100%
Ecology 1 100% 83 100%
Other Sciences 1 100% 65 100%
Political Science 2 100% 53 100%
History 1 100% 42 100%
Sociology 2 100% 31 100%
Language & Literature 1 100% 15 100%

149
Other Eastern European Countries
This group of countries has 34 OAWorld open access journals. Averagecost per article in 2015 in APC-charging journals: $138. Overall: $29.
Journals and Articles
2015 2014 2013 2012 2011
Journals 34 33 30 30 26
%Free 85% 88% 87% 87% 85%
Articles 1,208 1,284 1,294 1,226 882
%Free 79% 83% 81% 86% 81%
Free journals down in 2015, pay up.
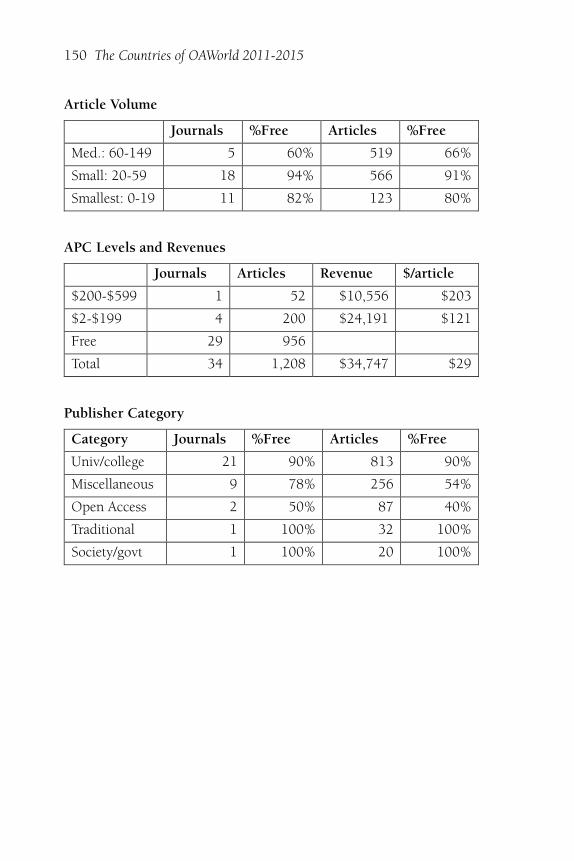
150 The Countries of OAWorld 2011-2015
Article Volume
Journals %Free Articles %Free
Med.: 60-149 5 60% 519 66%
Small: 20-59 18 94% 566 91%
Smallest: 0-19 11 82% 123 80%
APC Levels and Revenues
Journals Articles Revenue $/article
$200-$599 1 52 $10,556 $203
$2-$199 4 200 $24,191 $121
Free 29 956
Total 34 1,208 $34,747 $29
Publisher Category
Category Journals %Free Articles %Free
Univ/college 21 90% 813 90%
Miscellaneous 9 78% 256 54%
Open Access 2 50% 87 40%
Traditional 1 100% 32 100%
Society/govt 1 100% 20 100%
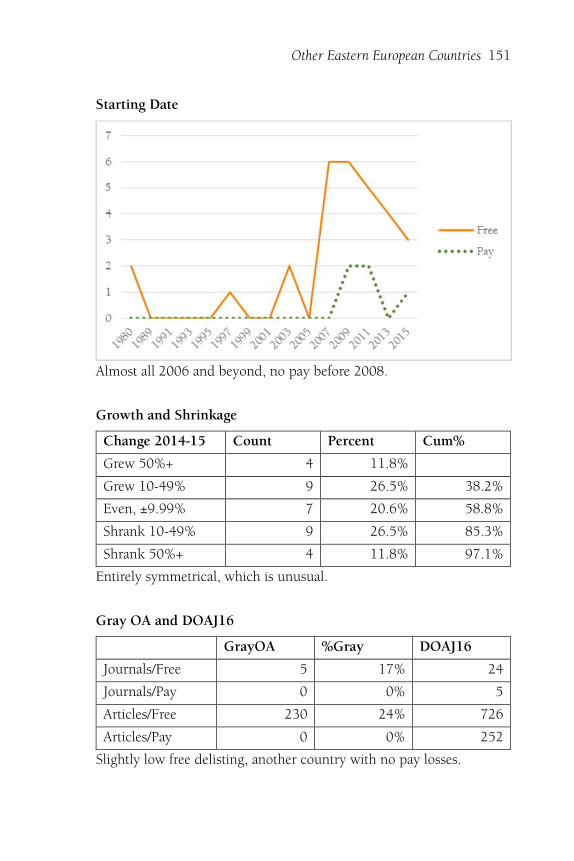
Other Eastern European Countries 151
Starting Date
Almost all 2006 and beyond, no pay before 2008.
Growth and Shrinkage
Change 2014-15 Count Percent Cum%
Grew 50%+ 4 11.8%
Grew 10-49% 9 26.5% 38.2%
Even, ±9.99% 7 20.6% 58.8%
Shrank 10-49% 9 26.5% 85.3%
Shrank 50%+ 4 11.8% 97.1%
Entirely symmetrical, which is unusual.
Gray OA and DOAJ16
GrayOA %Gray DOAJ16
Journals/Free 5 17% 24
Journals/Pay 0 0% 5
Articles/Free 230 24% 726
Articles/Pay 0 0% 252
Slightly low free delisting, another country with no pay losses.

152 The Countries of OAWorld 2011-2015
Subjects
Subject Journals %Free Articles %Free
Agriculture 2 50% 197 67%
Economics 4 50% 186 37%
Miscellany 1 100% 137 100%
Sociology 3 100% 82 100%
Education 3 100% 78 100%
Other Sciences 2 50% 75 31%
Psychology 1 100% 75 100%
Computer Science 3 100% 56 100%
Language & Literature 3 100% 54 100%
Physics 2 100% 49 100%
Mathematics 3 67% 48 65%
Ecology 1 100% 43 100%
Engineering 1 100% 35 100%
Chemistry 1 100% 31 100%
Technology 1 100% 26 100%
Biology 1 100% 22 100%
Anthropology 1 100% 10 100%
Political Science 1 100% 4 100%
Country Summaries
Albania
Four journals, the largest (and one of two with APCs) starting in 2015,the second largest (also with APCs) falling sharply in 2015. Total 240articles in 2015, down from 244in 2014.

Other Eastern European Countries 153
Armenia
Three free university-published journals, two small, one even smaller.Sixty articles in both 2014 and 2015.
Azerbaijan
Three journals, one of which is large and charges APCs. 174 articles in2015, down from 225 in 2014.
Belarus
Two small free journals. 49 articles in 2015, down from 73 in 2014.
Cyprus
Four free journals, all in humanities and social sciences, one small andthree smallest. Total of 55 articles in 2015, down from 66 in 1045.
Georgia
Two free university-published journals, one medium-sized, one small.In all, 85 articles in 2015, down from 152 in 2014.
Kazakhstan
One free university-published journal, shrinking since 2012. 31 articlesin 2015, down from 55 in 2014.
Kosova
Two APC-charging journals, both very small. 25 articles in 2015, downfrom 30 in 2014.
Latvia
Six journals, all small, one with APCs. Total of 187 articles in 2015, upfrom 139 in 2014.

154 The Countries of OAWorld 2011-2015
Montenegro
Seven journals, all free, including two medium-sized, two small andthree smallest. Total of 302 articles in 2015, up from 240 in 2014.

155
La�n America
Latin America has 1,917 OAWorld open access journals. In 2015, aver-age cost per article in APC-charging journals: $372. Overall: $39
Journals and Articles
2015 2014 2013 2012 2011
Journals 1,783 1,902 1,918 1,864 1,787
%Free 95% 95% 95% 95% 95%
Articles 65,298 67,847 66,044 65,597 62,383
%Free 90% 90% 90% 89% 89%
Predominantly free, both free and pay off a bit from 2014 to 2015.
Article Volume
Journals %Free Articles %Free
Large: 150-599 36 75% 8,437 73%
Med.: 60-149 228 85% 19,321 84%
Small: 20-59 925 96% 30,255 96%
Smallest: 0-19 782 98% 7,285 98%
No very large journal, predominantly small and smallest.

156 The Countries of OAWorld 2011-2015
APC Levels and Revenues
Journals Articles Revenue $/article
$1,400+ 3 351 $545,530 $1,554
$600-$1.399 12 987 $881,040 $893
$200-$599 35 2,534 $845,783 $334
$2-$199 45 2,886 $243,011 $84
Free 1,876 58,540
Total 1,971 65,298 $2,515,364 $39
Publisher Category
Category Journals %Free Articles %Free
Univ/college 1,499 96% 45,401 92%
Society/govt 270 89% 13,355 84%
Miscellaneous 193 95% 6,250 86%
Open Access 8 100% 219 100%
Traditional 1 100% 73 100%
Predominantly university-published journals.
Growth and Shrinkage
Change 2014-15 Count Percent Cum%
Grew 50%+ 246 12.5%
Grew 10-49% 372 18.9% 31.4%
Even, ±9.99% 543 27.5% 58.9%
Shrank 10-49% 480 24.4% 83.3%
Shrank 50%+ 261 13.2% 96.5%
A large even contingent, but more shrinkage than growth.

Latin America 157
Gray OA and DOAJ16
GrayOA %Gray DOAJ16
Journals/Free 619 33% 1,257
Journals/Pay 34 36% 61
Articles/Free 16,647 28% 41,893
Articles/Pay 1,653 24% 5,105
Journal delistings on the high side, articles roughly typical.
Subjects
Medicine far out in front of any other field, with agriculture and educa-tion following. Biology and zoology tie for the largest presence of payarticles, still only 37% in each case.

158 The Countries of OAWorld 2011-2015
Subject Journals %Free Articles %Free
Medicine 309 94% 16,533 90%
Agriculture 127 75% 5,763 59%
Education 140 99% 4,067 99%
Sociology 128 100% 3,260 100%
Economics 153 98% 3,231 97%
Zoology 58 76% 2,940 63%
Language & Literature 106 100% 2,588 100%
Biology 41 83% 2,447 63%
Law 91 100% 2,075 100%
Earth Sciences 79 97% 1,887 98%
Engineering 48 100% 1,859 100%
History 76 100% 1,753 100%
Psychology 59 97% 1,750 93%
Anthropology 67 97% 1,582 96%
Ecology 58 90% 1,495 91%
Other Sciences 35 100% 1,428 100%
Miscellany 46 100% 1,424 100%
Technology 31 97% 1,422 95%
Media & Communications 49 98% 1,267 99%
Political Science 51 100% 1,060 100%
Philosophy 60 100% 1,009 100%
Religion 24 96% 936 97%
Arts & Architecture 42 100% 824 100%
Chemistry 12 92% 808 95%
Computer Science 24 96% 578 96%
Library Science 27 100% 503 100%
Mathematics 21 100% 447 100%
Physics 9 78% 362 91%

159
Argen�na
Argentina has 159 OAWorld open access journals. In 2015, average costper article in APC-charging journals was $454; overall average, $52.
Journals and Articles
2015 2014 2013 2012 2011
Journals 128 153 156 151 140
%Free 92% 93% 93% 93% 92%
Articles 2,712 3,344 3,301 3,230 2,986
%Free 89% 87% 88% 89% 87%
Both free and pay articles peaked in 2014.

160 The Countries of OAWorld 2011-2015
Article Volume
Journals %Free Articles %Free
Large: 150-599 1 100% 150 100%
Med.: 60-149 4 75% 342 72%
Small: 20-59 42 88% 1,316 88%
Smallest: 0-19 112 96% 904 94%
APC Levels and Revenues
Journals Articles Revenue $/article
$600-$1.399 3 160 $119,000 $744
$200-$599 3 54 $15,100 $280
$2-$199 5 97 $7,247 $75
Free 148 2,401
Total 159 2,712 $141,347 $52
Publisher Category
Category Journals %Free Articles %Free
Univ/college 102 99% 1,562 100%
Society/govt 34 79% 723 76%
Miscellaneous 22 86% 419 68%
Open Access 1 100% 8 100%

Argentina 161
Starting Date
Growth and Shrinkage
Change 2014-15 Count Percent Cum%
Grew 50%+ 21 13.2%
Grew 10-49% 24 15.1% 28.3%
Even, ±9.99% 24 15.1% 43.4%
Shrank 10-49% 40 25.2% 68.6%
Shrank 50%+ 44 27.7% 96.2%
Much more shrinkage than growth, with few steady-state journals.
Gray OA and DOAJ16
GrayOA %Gray DOAJ16
Journals/Free 44 30% 104
Journals/Pay 2 18% 9
Articles/Free 782 33% 1,619
Articles/Pay 56 18% 255
Typical free-journal delisting rates for Latin America

162 The Countries of OAWorld 2011-2015
Subjects
Subject Journals %Free Articles %Free
Medicine 19 89% 599 78%
Sociology 15 100% 247 100%
Media & Communications 5 100% 225 100%
Anthropology 16 100% 196 100%
Language & Literature 11 100% 185 100%
History 12 100% 172 100%
Biology 9 89% 167 71%
Agriculture 10 60% 125 54%
Earth Sciences 10 90% 98 78%
Zoology 4 75% 95 85%
Law 4 100% 84 100%
Education 5 100% 72 100%
Economics 8 100% 65 100%
Other Sciences 2 100% 59 100%
Miscellany 2 100% 50 100%
Computer Science 2 50% 45 51%
Political Science 2 100% 42 100%
Ecology 5 100% 40 100%
Arts & Architecture 4 100% 33 100%
Religion 1 100% 26 100%
Philosophy 7 100% 22 100%
Technology 1 100% 19 100%
Physics 1 0% 17 0%
Library Science 2 100% 16 100%
Mathematics 1 100% 13 100%
Psychology 1 100% 0
Interesting that the next five busiest subjects after medicine are all inthe humanities and social sciences (and all entirely free).
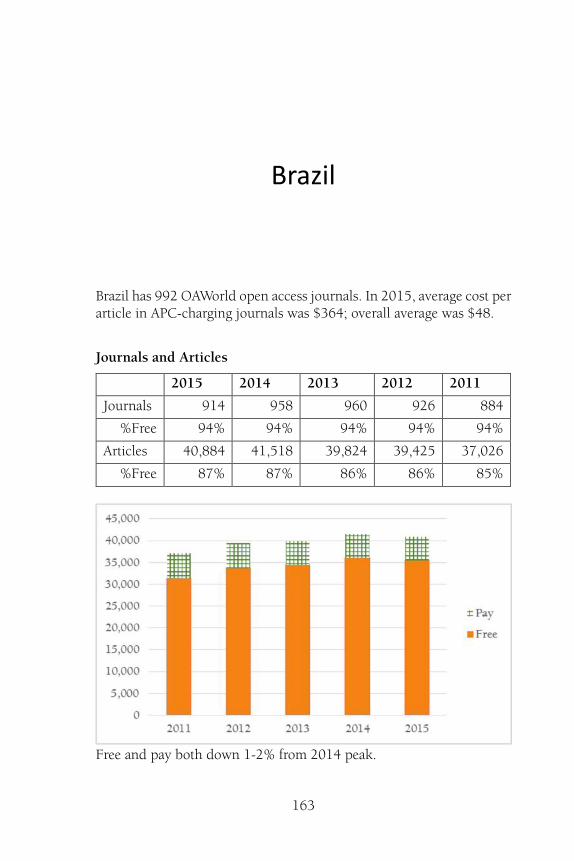
163
Brazil
Brazil has 992 OAWorld open access journals. In 2015, average cost perarticle in APC-charging journals was $364; overall average was $48.
Journals and Articles
2015 2014 2013 2012 2011
Journals 914 958 960 926 884
%Free 94% 94% 94% 94% 94%
Articles 40,884 41,518 39,824 39,425 37,026
%Free 87% 87% 86% 86% 85%
Free and pay both down 1-2% from 2014 peak.
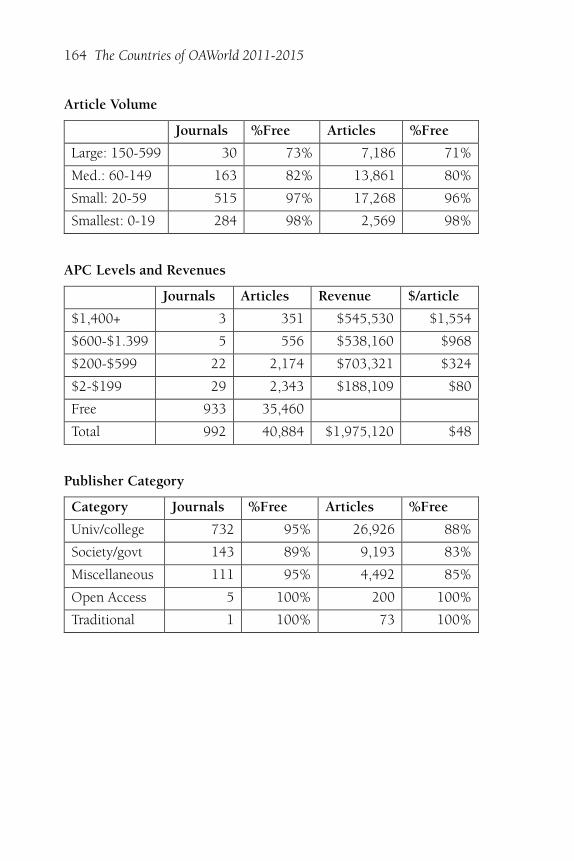
164 The Countries of OAWorld 2011-2015
Article Volume
Journals %Free Articles %Free
Large: 150-599 30 73% 7,186 71%
Med.: 60-149 163 82% 13,861 80%
Small: 20-59 515 97% 17,268 96%
Smallest: 0-19 284 98% 2,569 98%
APC Levels and Revenues
Journals Articles Revenue $/article
$1,400+ 3 351 $545,530 $1,554
$600-$1.399 5 556 $538,160 $968
$200-$599 22 2,174 $703,321 $324
$2-$199 29 2,343 $188,109 $80
Free 933 35,460
Total 992 40,884 $1,975,120 $48
Publisher Category
Category Journals %Free Articles %Free
Univ/college 732 95% 26,926 88%
Society/govt 143 89% 9,193 83%
Miscellaneous 111 95% 4,492 85%
Open Access 5 100% 200 100%
Traditional 1 100% 73 100%

Brazil 165
Starting Date
Some early OA journals, picking up after 1995 to 2009 peak.
Growth and Shrinkage
Change 2014-15 Count Percent Cum%
Grew 50%+ 122 12.3%
Grew 10-49% 193 19.5% 31.8%
Even, ±9.99% 306 30.8% 62.6%
Shrank 10-49% 232 23.4% 86.0%
Shrank 50%+ 105 10.6% 96.6%
Strong even group, slightly more shrinkage than growth.
Gray OA and DOAJ16
GrayOA %Gray DOAJ16
Journals/Free 251 27% 682
Journals/Pay 16 27% 43
Articles/Free 7,007 20% 28,453
Articles/Pay 937 17% 4,487
Delisted journals tend to have fewer articles.

166 The Countries of OAWorld 2011-2015
Subjects
Subject Journals %Free Articles %Free
Medicine 146 92% 10,560 90%
Agriculture 67 67% 3,930 45%
Education 81 100% 2,758 100%
Economics 86 99% 2,109 98%
Zoology 28 68% 1,962 50%
Biology 22 73% 1,892 54%
Language & Literature 66 100% 1,770 100%
Sociology 49 100% 1,390 100%
Earth Sciences 42 100% 1,255 100%
Law 43 100% 1,047 100%
Anthropology 30 93% 1,037 94%
History 39 100% 1,031 100%
Ecology 29 83% 1,003 89%
Psychology 26 96% 993 89%
Technology 16 100% 914 100%
Engineering 18 100% 877 100%
Miscellany 28 100% 830 100%
Religion 17 94% 775 97%
Media & Communications 28 100% 770 100%
Philosophy 33 100% 650 100%
Chemistry 6 100% 630 100%
Other Sciences 13 100% 576 100%
Arts & Architecture 19 100% 505 100%
Political Science 24 100% 505 100%
Library Science 15 100% 363 100%
Computer Science 10 100% 287 100%
Physics 3 100% 234 100%
Mathematics 8 100% 231 100%
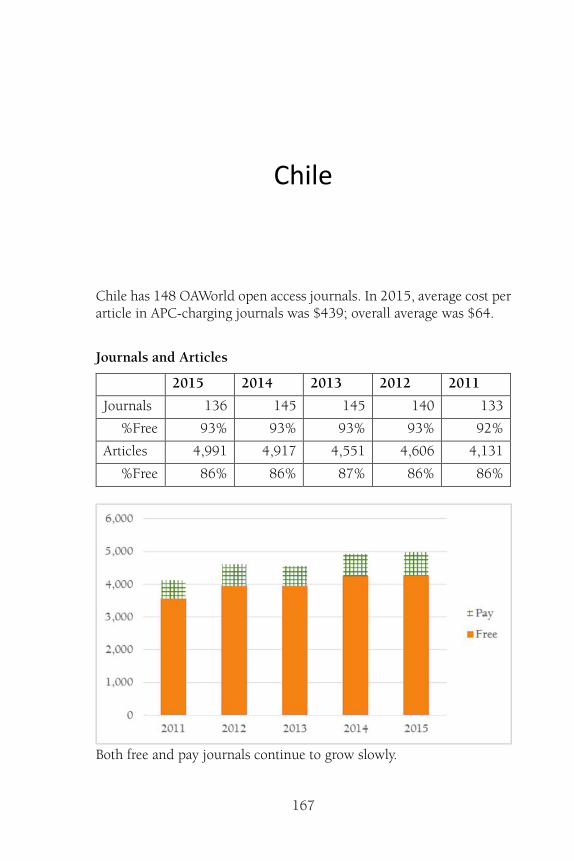
167
Chile
Chile has 148 OAWorld open access journals. In 2015, average cost perarticle in APC-charging journals was $439; overall average was $64.
Journals and Articles
2015 2014 2013 2012 2011
Journals 136 145 145 140 133
%Free 93% 93% 93% 93% 92%
Articles 4,991 4,917 4,551 4,606 4,131
%Free 86% 86% 87% 86% 86%
Both free and pay journals continue to grow slowly.

168 The Countries of OAWorld 2011-2015
Article Volume
Journals %Free Articles %Free
Large: 150-599 2 50% 485 51%
Med.: 60-149 19 79% 1,618 82%
Small: 20-59 67 93% 2,220 92%
Smallest: 0-19 60 100% 668 100%
APC Levels and Revenues
Journals Articles Revenue $/article
$600-$1.399 3 236 $188,880 $800
$200-$599 5 225 $101,045 $449
$2-$199 2 262 $27,400 $105
Free 138 4,268
Total 148 4,991 $317,325 $64
Oddly even distribution of articles at various APC levels.
Publisher Category
Category Journals %Free Articles %Free
Univ/college 113 94% 3,277 90%
Society/govt 19 89% 1,415 78%
Miscellaneous 15 93% 299 70%
Open Access 1 100% 0

Chile 169
Starting Date
Growth and Shrinkage
Change 2014-15 Count Percent Cum%
Grew 50%+ 17 11.5%
Grew 10-49% 36 24.3% 35.8%
Even, ±9.99% 50 33.8% 69.6%
Shrank 10-49% 31 20.9% 90.5%
Shrank 50%+ 11 7.4% 98.0%
More growth than shrinkage, and a large steady group.
Gray OA and DOAJ16
GrayOA %Gray DOAJ16
Journals/Free 66 48% 72
Journals/Pay 7 70% 3
Articles/Free 2,406 56% 1,862
Articles/Pay 514 71% 209
Very high delisting rates, especially among pay journals.

170 The Countries of OAWorld 2011-2015
Subjects
Subject Journals %Free Articles %Free
Medicine 22 82% 1,240 66%
Agriculture 12 83% 496 84%
Language & Literature 13 100% 324 100%
Technology 4 75% 318 75%
Law 9 100% 285 100%
Sociology 9 100% 253 100%
Other Sciences 1 100% 247 100%
Education 4 75% 145 61%
Engineering 4 100% 130 100%
Philosophy 7 100% 127 100%
Political Science 7 100% 127 100%
Arts & Architecture 7 100% 118 100%
Anthropology 6 100% 117 100%
Psychology 5 100% 113 100%
Miscellany 2 100% 111 100%
Biology 1 100% 108 100%
Media & Communications 5 100% 101 100%
Chemistry 1 100% 92 100%
History 4 100% 92 100%
Earth Sciences 4 100% 88 100%
Zoology 2 0% 87 0%
Religion 3 100% 69 100%
Mathematics 3 100% 61 100%
Computer Science 3 100% 50 100%
Ecology 3 100% 48 100%
Economics 6 100% 41 100%
Library Science 1 100% 3 100%

171
Colombia
Colombia has 263 OAWorld open access journals. The 2015 averagecost per article in APC-charging journals was $234; overall average, $2.
Journals and Articles
2015 2014 2013 2012 2011
Journals 240 257 259 257 249
%Free 99% 98% 98% 98% 98%
Articles 6,267 6,735 6,762 6,855 6,769
%Free 99% 99% 98% 98% 98%
Both pay and free articles peaked in 2012, with significant drop in 2015.
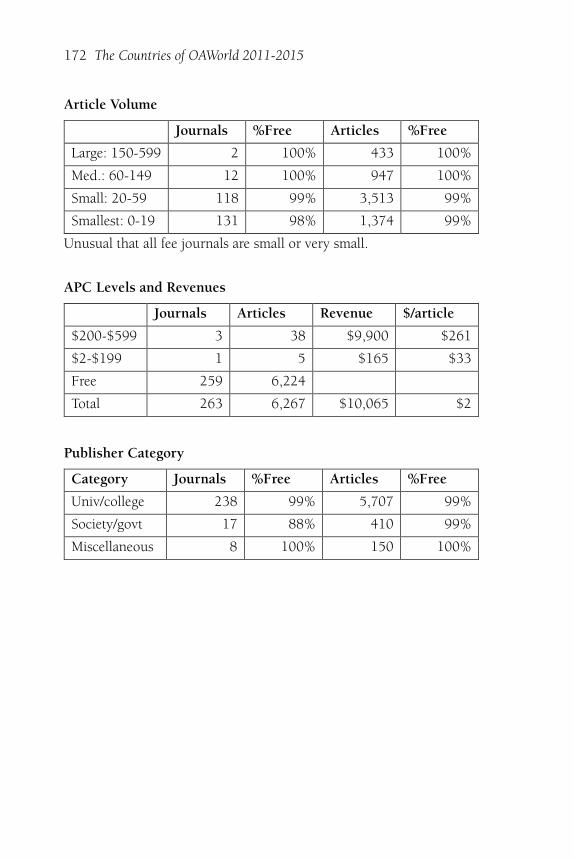
172 The Countries of OAWorld 2011-2015
Article Volume
Journals %Free Articles %Free
Large: 150-599 2 100% 433 100%
Med.: 60-149 12 100% 947 100%
Small: 20-59 118 99% 3,513 99%
Smallest: 0-19 131 98% 1,374 99%
Unusual that all fee journals are small or very small.
APC Levels and Revenues
Journals Articles Revenue $/article
$200-$599 3 38 $9,900 $261
$2-$199 1 5 $165 $33
Free 259 6,224
Total 263 6,267 $10,065 $2
Publisher Category
Category Journals %Free Articles %Free
Univ/college 238 99% 5,707 99%
Society/govt 17 88% 410 99%
Miscellaneous 8 100% 150 100%

Colombia 173
Starting Date
Growth and Shrinkage
Change 2014-15 Count Percent Cum%
Grew 50%+ 29 11.0%
Grew 10-49% 48 18.3% 29.3%
Even, ±9.99% 65 24.7% 54.0%
Shrank 10-49% 78 29.7% 83.7%
Shrank 50%+ 37 14.1% 97.7%
Much more shrinkage than growth.
Gray OA and DOAJ16
GrayOA %Gray DOAJ16
Journals/Free 86 33% 173
Journals/Pay 3 75% 1
Articles/Free 2,112 34% 4,112
Articles/Pay 20 47% 23
Fairly typical delisting rate for free journals—but only one pay journalremains in DOAJ.

174 The Countries of OAWorld 2011-2015
Subjects
Subject Journals %Free Articles %Free
Medicine 44 100% 1,393 100%
Engineering 13 100% 496 100%
Sociology 20 100% 477 100%
Zoology 10 80% 443 99%
Economics 23 100% 385 100%
Psychology 14 93% 376 94%
Law 22 100% 370 100%
Agriculture 13 92% 355 96%
History 10 100% 260 100%
Education 18 100% 242 100%
Language & Literature 8 100% 203 100%
Political Science 7 100% 180 100%
Biology 4 100% 142 100%
Miscellany 5 100% 134 100%
Earth Sciences 6 100% 89 100%
Philosophy 4 100% 89 100%
Media & Communications 3 100% 81 100%
Other Sciences 6 100% 77 100%
Mathematics 4 100% 74 100%
Technology 4 100% 73 100%
Anthropology 4 100% 70 100%
Computer Science 5 100% 62 100%
Ecology 5 100% 60 100%
Arts & Architecture 5 100% 55 100%
Religion 2 100% 35 100%
Chemistry 2 100% 30 100%
Library Science 1 100% 16 100%
Physics 1 100% 0

175
Costa Rica
All 31 of Costa Rica’s OAWorld open access journals are free.
Journals and Articles
2015 2014 2013 2012 2011
Journals 40 41 41 39 39
Articles 946 939 939 891 775
Growing, if slowly.

176 The Countries of OAWorld 2011-2015
Article Volume
Journals Articles
Med.: 60-149 3 237
Small: 20-59 12 414
Smallest: 0-19 26 295
Publisher Category
Category Journals Articles
Univ/college 36 864
Society/govt 3 57
Miscellaneous 2 25
Starting Date

Costa Rica 177
Growth and Shrinkage
Change 2014-15 Count Percent Cum%
Grew 50%+ 8 19.5%
Grew 10-49% 9 22.0% 41.5%
Even, ±9.99% 4 9.8% 51.2%
Shrank 10-49% 15 36.6% 87.8%
Shrank 50%+ 5 12.2% 100.0%
More shrinkage than growth, and very few stable journals.
Gray OA and DOAJ16
GrayOA %Gray DOAJ16
Journals/Free 10 24% 31
Articles/Free 260 27% 686
Fairly typical delisting percentage.

178 The Countries of OAWorld 2011-2015
Subjects
Subject Journals Articles
Education 4 188
Medicine 8 170
Agriculture 4 161
Other Sciences 3 105
Anthropology 4 51
Economics 3 41
Psychology 3 40
Religion 1 31
History 1 28
Mathematics 1 24
Earth Sciences 2 22
Sociology 2 21
Law 1 20
Philosophy 1 18
Library Science 1 17
Ecology 1 5
Political Science 1 4

179
Cuba
Cuba has 68 OAWorld open access journals. None of them have APCs.
Journals and Articles
2015 2014 2013 2012 2011
Journals 63 64 67 65 65
Articles 2,493 2,944 2,892 2,955 3,040
Down sharply in 2015 after mild declines from peak in 2011.

180 The Countries of OAWorld 2011-2015
Article Volume
Journals Articles
Large: 150-599 1 183
Med.: 60-149 9 738
Small: 20-59 43 1,452
Smallest: 0-19 15 120
Publisher Category
Category Journals Articles
Univ/college 36 1,463
Society/govt 26 896
Miscellaneous 6 134
Most “Society/govt” is government in this case.
Starting Date

Cuba 181
Growth and Shrinkage
Change 2014-15 Count Percent Cum%
Grew 50%+ 4 5.9%
Grew 10-49% 9 13.2% 19.1%
Even, ±9.99% 21 30.9% 50.0%
Shrank 10-49% 21 30.9% 80.9%
Shrank 50%+ 9 13.2% 94.1%
Much more shrinkage than growth.
Gray OA and DOAJ16
GrayOA %Gray DOAJ16
Journals/Free 36 53% 32
Articles/Free 1,475 59% 1,018
Very high delisting rate.

182 The Countries of OAWorld 2011-2015
Subjects
Subject Journals Articles
Medicine 34 1,495
Agriculture 7 247
Engineering 5 140
Education 3 95
Miscellany 1 89
Technology 3 71
Computer Science 1 56
Earth Sciences 2 39
Other Sciences 1 36
Arts & Architecture 2 35
Sociology 1 34
Library Science 2 32
Biology 1 30
Zoology 1 30
Mathematics 1 28
Ecology 1 23
Political Science 1 13
Anthropology 1 0
Half the journals and more than half the articles are medical.

183
Ecuador
Ecuador has 11 OAWorld open access journals—all free and all still inDOAJ.
Journals and Articles
2015 2014 2013 2012 2011
Journals 10 11 10 8 6
Articles 208 137 182 86 74
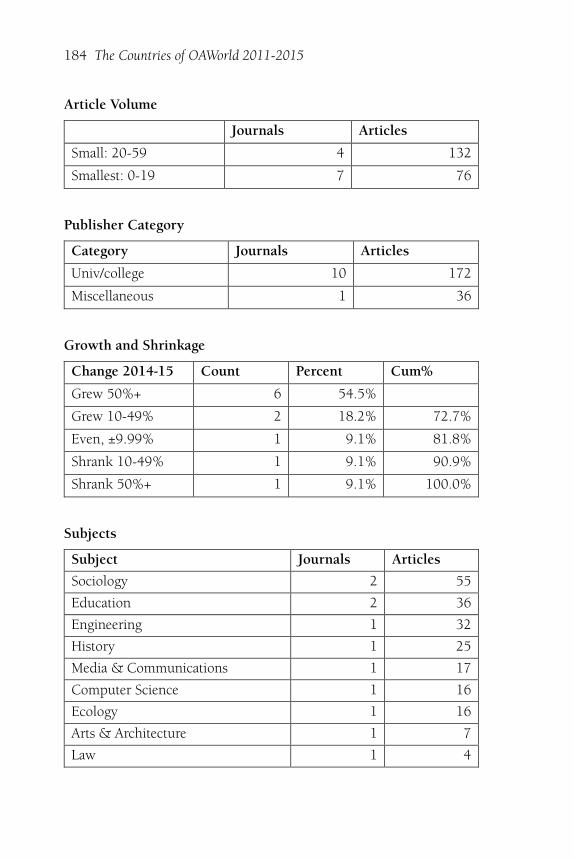
184 The Countries of OAWorld 2011-2015
Article Volume
Journals Articles
Small: 20-59 4 132
Smallest: 0-19 7 76
Publisher Category
Category Journals Articles
Univ/college 10 172
Miscellaneous 1 36
Growth and Shrinkage
Change 2014-15 Count Percent Cum%
Grew 50%+ 6 54.5%
Grew 10-49% 2 18.2% 72.7%
Even, ±9.99% 1 9.1% 81.8%
Shrank 10-49% 1 9.1% 90.9%
Shrank 50%+ 1 9.1% 100.0%
Subjects
Subject Journals Articles
Sociology 2 55
Education 2 36
Engineering 1 32
History 1 25
Media & Communications 1 17
Computer Science 1 16
Ecology 1 16
Arts & Architecture 1 7
Law 1 4

185
Mexico
Mexico has 155 OAWorld open access journals. In 2015, average costfor articles in APC-charging journals was $197; overall average, $6.
Journals and Articles
2015 2014 2013 2012 2011
Journals 141 149 151 150 145
%Free 96% 96% 96% 96% 96%
Articles 4,068 4,606 4,728 4,641 4,676
%Free 97% 97% 96% 96% 95%
Slight drop in 2015, both free and pay.

186 The Countries of OAWorld 2011-2015
Article Volume
Journals %Free Articles %Free
Med.: 60-149 13 100% 1,069 100%
Small: 20-59 76 96% 2,406 96%
Smallest: 0-19 66 95% 593 93%
APC Levels and Revenues
Journals Articles Revenue $/article
$200-$599 2 43 $16,417 $382
$2-$199 4 86 $8,950 $104
Free 149 3,939
Total 155 4,068 $25,367 $6
Publisher Category
Category Journals %Free Articles %Free
Univ/college 125 98% 3,381 98%
Society/govt 15 80% 357 86%
Miscellaneous 14 100% 319 100%
Open Access 1 100% 11 100%

Mexico 187
Starting Date
Growth and Shrinkage
Change 2014-15 Count Percent Cum%
Grew 50%+ 18 11.6%
Grew 10-49% 25 16.1% 27.7%
Even, ±9.99% 44 28.4% 56.1%
Shrank 10-49% 37 23.9% 80.0%
Shrank 50%+ 25 16.1% 96.1%
More shrinkage than growth, with a solid even group.
Gray OA and DOAJ16
GrayOA %Gray DOAJ16
Journals/Free 70 47% 79
Journals/Pay 4 67% 2
Articles/Free 1,600 41% 2,339
Articles/Pay 68 53% 61
Very high delisting percentage, especially among pay journals.

188 The Countries of OAWorld 2011-2015
Subjects
Subject Journals %Free Articles %Free
Sociology 20 100% 613 100%
Education 15 100% 429 100%
Agriculture 8 63% 371 82%
Economics 15 93% 371 93%
Medicine 10 100% 280 100%
Earth Sciences 10 90% 252 92%
Ecology 7 100% 195 100%
Political Science 7 100% 167 100%
Law 6 100% 161 100%
Engineering 5 100% 140 100%
Miscellany 5 100% 120 100%
Other Sciences 3 100% 117 100%
History 6 100% 113 100%
Psychology 4 100% 112 100%
Zoology 5 100% 107 100%
Physics 3 67% 99 85%
Anthropology 4 100% 86 100%
Arts & Architecture 4 100% 71 100%
Computer Science 2 100% 62 100%
Media & Communications 4 100% 50 100%
Biology 2 100% 46 100%
Library Science 1 100% 33 100%
Language & Literature 2 100% 22 100%
Philosophy 3 100% 22 100%
Mathematics 2 100% 16 100%
Technology 1 100% 13 100%
Chemistry 1 100% 0

189
Peru
Peru has 45 OAWorld open access journals. In 2015, the average costper article in APC-charging journals was $132; overall average was $7.
Journals and Articles
2015 2014 2013 2012 2011
Journals 39 42 44 45 44
%Free 95% 95% 95% 96% 95%
Articles 1,169 1,094 1,038 996 893
%Free 95% 95% 94% 96% 95%
Free journals grow every year; pay flat at 58 articles since 2013.

190 The Countries of OAWorld 2011-2015
Article Volume
Journals %Free Articles %Free
Med.: 60-149 3 100% 315 100%
Small: 20-59 19 89% 649 91%
Smallest: 0-19 23 100% 205 100%
APC Levels and Revenues
Journals Articles Revenue $/article
$2-$199 2 58 $7,640 $132
Free 43 1,111
Total 45 1,169 $7,640 $7
Publisher Category
Category Journals %Free Articles %Free
Univ/college 37 97% 946 98%
Society/govt 5 80% 172 78%
Miscellaneous 3 100% 51 100%

Peru 191
Starting Date
Growth and Shrinkage
Change 2014-15 Count Percent Cum%
Grew 50%+ 8 17.8%
Grew 10-49% 10 22.2% 40.0%
Even, ±9.99% 13 28.9% 68.9%
Shrank 10-49% 7 15.6% 84.4%
Shrank 50%+ 4 8.9% 93.3%
Considerably more growth than shrinkage.
Gray OA and DOAJ16
GrayOA %Gray DOAJ16
Journals/Free 12 28% 31
Journals/Pay 2 100% 0
Articles/Free 364 33% 747
Articles/Pay 58 100% 0
Fairly typical free journal delisting; unusual that all pay journals gone.

192 The Countries of OAWorld 2011-2015
Subjects
Subject Journals %Free Articles %Free
Medicine 9 100% 497 100%
Zoology 3 100% 138 100%
Biology 2 100% 62 100%
Psychology 3 100% 53 100%
Other Sciences 1 100% 50 100%
Economics 3 100% 47 100%
Language & Literature 2 100% 41 100%
Law 2 100% 38 100%
Chemistry 1 0% 37 0%
Philosophy 2 100% 37 100%
Ecology 2 50% 35 40%
Education 3 100% 35 100%
Anthropology 2 100% 25 100%
Agriculture 1 100% 23 100%
Media & Communications 2 100% 13 100%
Sociology 2 100% 13 100%
Political Science 1 100% 12 100%
Earth Sciences 1 100% 8 100%
Miscellany 1 100% 5 100%
History 1 100% 0
Library Science 1 100% 0

193
Uruguay
Uruguay has ten OAWorld open access journals, all free and all still inDOAJ.
Journals and Articles
2015 2014 2013 2012 2011
Journals 9 10 10 10 10
Articles 168 173 182 211 182
Slightly down each year since 2012 peak.

194 The Countries of OAWorld 2011-2015
Article Volume
Journals Articles
Small: 20-59 4 115
Smallest: 0-19 6 53
Publisher Category
Category Journals Articles
Univ/college 7 124
Miscellaneous 3 44
Growth and Shrinkage
Change 2014-15 Count Percent Cum%
Grew 50%+ 1 10.0%
Grew 10-49% 1 10.0% 20.0%
Even, ±9.99% 4 40.0% 60.0%
Shrank 10-49% 2 20.0% 80.0%
Shrank 50%+ 2 20.0% 100.0%
More shrinkage than growth.

Uruguay 195
Subjects
Subject Journals Articles
Psychology 2 56
Ecology 1 34
Law 1 25
Medicine 1 16
Education 1 15
Technology 1 10
Engineering 1 7
Library Science 1 5
Economics 1 0

196
Venezuela, Bolivarian Republic of
Venezuela has 53 OAWorld open access journals. Average cost per arti-cle in 2015 in APC-charging journals was $100; overall average, $4.
Journals and Articles
2015 2014 2013 2012 2011
Journals 40 48 51 52 52
%Free 95% 96% 96% 96% 96%
Articles 936 997 1,095 1,212 1,204
%Free 96% 96% 95% 97% 96%
Slow ongoing losses from 2012 peak.

Venezuela, Bolivarian Republic of 197
Article Volume
Journals %Free Articles %Free
Med.: 60-149 2 100% 194 100%
Small: 20-59 13 92% 420 94%
Smallest: 0-19 38 97% 322 97%
APC Levels and Revenues
Journals Articles Revenue $/article
$2-$199 2 35 $3,500 $100
Free 51 901
Total 53 936 $3,500 $4
Publisher Category
Category Journals %Free Articles %Free
Univ/college 44 95% 679 95%
Miscellaneous 4 100% 183 100%
Society/govt 5 100% 74 100%

198 The Countries of OAWorld 2011-2015
Starting Date
2001 was a big year for Venezuelan OA.
Growth and Shrinkage
Change 2014-15 Count Percent Cum%
Grew 50%+ 8 15.1%
Grew 10-49% 7 13.2% 28.3%
Even, ±9.99% 7 13.2% 41.5%
Shrank 10-49% 13 24.5% 66.0%
Shrank 50%+ 13 24.5% 90.6%
Much more shrinkage than growth.
Gray OA and DOAJ16
GrayOA %Gray DOAJ16
Journals/Free 33 65% 18
Journals/Pay 0 0% 2
Articles/Free 493 55% 408
Articles/Pay 0 0% 35
Very high rate of delisting among free journals.

Venezuela, Bolivarian Republic of 199
Subjects
Subject Journals %Free Articles %Free
Medicine 9 100% 151 100%
Other Sciences 3 100% 119 100%
Sociology 7 100% 119 100%
Economics 4 75% 88 72%
Miscellany 2 100% 85 100%
Zoology 5 100% 78 100%
Agriculture 5 100% 55 100%
Engineering 1 100% 37 100%
Language & Literature 3 100% 37 100%
Philosophy 2 100% 35 100%
Education 3 100% 23 100%
History 1 100% 23 100%
Chemistry 1 100% 19 100%
Library Science 1 100% 18 100%
Earth Sciences 1 100% 15 100%
Ecology 1 100% 14 100%
Media & Communications 1 0% 10 0%
Political Science 1 100% 10 100%
Law 1 100% 0
Mathematics 1 100% 0

200
Other La�n American and Caribbean Countries
This group has 26 OAWorld open access journals. Average cost per ar-ticle in the fee journal in 2015 was $1,000; average overall, $77.
Journals and Articles
2015 2014 2013 2012 2011
Journals 23 24 24 21 20
%Free 96% 96% 100% 100% 100%
Articles 456 443 550 489 465
%Free 92% 93% 100% 100% 100%

Other Latin American and Caribbean Countries 201
Article Volume
Journals %Free Articles %Free
Small: 20-59 12 92% 350 90%
Smallest: 0-19 14 100% 106 100%
APC Levels and Revenues
Journals Articles Revenue $/article
$600-$1.399 1 35 $35,000 $1,000
Free 25 421
Total 26 456 $35,000 $77
Publisher Category
Category Journals %Free Articles %Free
Univ/college 19 95% 300 88%
Miscellaneous 4 100% 98 100%
Society/govt 3 100% 58 100%

202 The Countries of OAWorld 2011-2015
Starting Date
Growth and Shrinkage
Change 2014-15 Count Percent Cum%
Grew 50%+ 4 15.4%
Grew 10-49% 8 30.8% 46.2%
Even, ±9.99% 4 15.4% 61.5%
Shrank 10-49% 3 11.5% 73.1%
Shrank 50%+ 5 19.2% 92.3%
Gray OA and DOAJ16
GrayOA %Gray DOAJ16
Journals/Free 11 44% 14
Journals/Pay 0 0% 1
Articles/Free 148 35% 273
Articles/Pay 0 0% 35
High delisting rate among free journals.

Other Latin American and Caribbean Countries 203
Subjects
Subject Journals %Free Articles %Free
Medicine 7 86% 132 73%
Economics 4 100% 84 100%
Other Sciences 2 100% 42 100%
Law 1 100% 41 100%
Sociology 1 100% 38 100%
Education 1 100% 29 100%
Ecology 2 100% 22 100%
Earth Sciences 1 100% 21 100%
Physics 1 100% 12 100%
History 1 100% 9 100%
Philosophy 1 100% 9 100%
Psychology 1 100% 7 100%
Language & Literature 1 100% 6 100%
Technology 1 100% 4 100%
Library Science 1 100% 0
Country Summaries
Bahamas
One very small free education journal with nine articles in 2014 and in2015.
Barbados
One small free education journal with 29 2015 articles, up from 22 in2014.

204 The Countries of OAWorld 2011-2015
Bolivia, Plurinational State of
Seven free journals, three small, four very small, with three in medicine;six of the seven journals are now gray OA. In all, 122 articles in 2015,down from 143 in 2014.
British Virgin Islands
One very small free language & literature journal with six articles in2015, up from four in 2014.
Dominican Republic
One small free economics journal, now gray OA, with 30 articles in2015, down from 34 in 2014.
Guatemala
Three free journals, one small and two very small; one now gray OA.Total of 28 articles in 2015, up from 21 in 2014.
Jamaica
Technically, two journals—but one moved to a different URL in 2014and became a subscription journal, spinning off the other as an APC-charging journal. 35 articles in 2015, down from 56 in 2014.
Martinique
One free small economics journal with 30 articles in 2015, up from 25in 2014.
Nicaragua
Four free journals, two small and two very small. Total of 67 articles in2015, up from 36 in 2014.
Paraguay
Three free small journals. In all, 87 articles in 2015, up from 64 in 2014.
Other Latin American and Caribbean Countries 205
Puerto Rico
Two free journals, one now very small and one with no articles since2013; both are now gray OA. 13 articles in 2015, down from 29 in2014.

206
Middle East
The Middle East has 675 OAWorld open access journals. 2015 averagecost per article in APC-charging journals: $291. Overall average: $62.
Journals and Articles
2015 2014 2013 2012 2011
Journals 642 657 626 556 458
%Free 85% 85% 85% 84% 85%
Articles 31,237 30,189 27,457 24,583 19,149
%Free 79% 77% 78% 76% 77%
Pay journals published fewer articles in 2015, but overall output in-creased every year.
Article Volume
Journals %Free Articles %Free
Largest: 600+ 2 100% 1,652 100%
Large: 150-599 28 50% 6,366 47%
Med.: 60-149 105 84% 9,153 84%
Small: 20-59 350 87% 12,236 86%
Smallest: 0-19 190 88% 1,830 91%

Middle East 207
APC Levels and Revenues
Journals Articles Revenue $/article
$1,400+ 1 40 $79,800 $1,995
$600-$1.399 10 739 $694,785 $940
$200-$599 31 2,457 $808,155 $329
$2-$199 59 3,443 $363,213 $105
Free 574 24,558
Total 675 31,237 $1,945,953 $62
Publisher Category
Category Journals %Free Articles %Free
Univ/college 367 89% 15,892 85%
Miscellaneous 162 86% 7,858 78%
Open Access 67 57% 3,271 56%
Society/govt 60 93% 2,998 91%
Traditional 19 63% 1,218 28%
Growth and Shrinkage
Change 2014-15 Count Percent Cum%
Grew 50%+ 98 14.5%
Grew 10-49% 154 22.8% 37.3%
Even, ±9.99% 169 25.0% 62.4%
Shrank 10-49% 163 24.1% 86.5%
Shrank 50%+ 73 10.8% 97.3%
Slightly more growth than shrinkage.

208 The Countries of OAWorld 2011-2015
Gray OA and DOAJ16
GrayOA %Gray DOAJ16
Journals/Free 202 35% 372
Journals/Pay 20 20% 81
Articles/Free 9,345 38% 15,213
Articles/Pay 1,546 23% 5,133
Fairly high delisting percentage for free journals, fairly low for pay.
Subjects
Medicine accounts for almost half of all articles.

Middle East 209
Subject Journals %Free Articles %Free
Medicine 283 89% 15,070 82%
Education 65 91% 1,839 83%
Agriculture 25 64% 1,317 78%
Economics 30 67% 1,259 44%
Engineering 26 85% 1,228 77%
Biology 28 86% 1,135 71%
Sociology 20 80% 1,134 74%
Other Sciences 18 61% 1,093 37%
Language & Literature 17 88% 1,050 99%
Miscellany 7 100% 1,048 100%
Zoology 20 50% 952 60%
Mathematics 24 88% 666 82%
Computer Science 16 75% 594 55%
Arts & Architecture 13 92% 405 100%
Chemistry 8 100% 389 100%
Anthropology 10 80% 383 67%
History 10 100% 276 100%
Ecology 8 63% 233 49%
Earth Sciences 9 100% 231 100%
Physics 5 100% 206 100%
Library Science 7 100% 150 100%
Political Science 7 100% 137 100%
Religion 7 86% 124 84%
Media & Communications 3 100% 89 100%
Psychology 3 100% 84 100%
Technology 2 100% 75 100%
Philosophy 3 67% 54 85%
Law 1 100% 16 100%
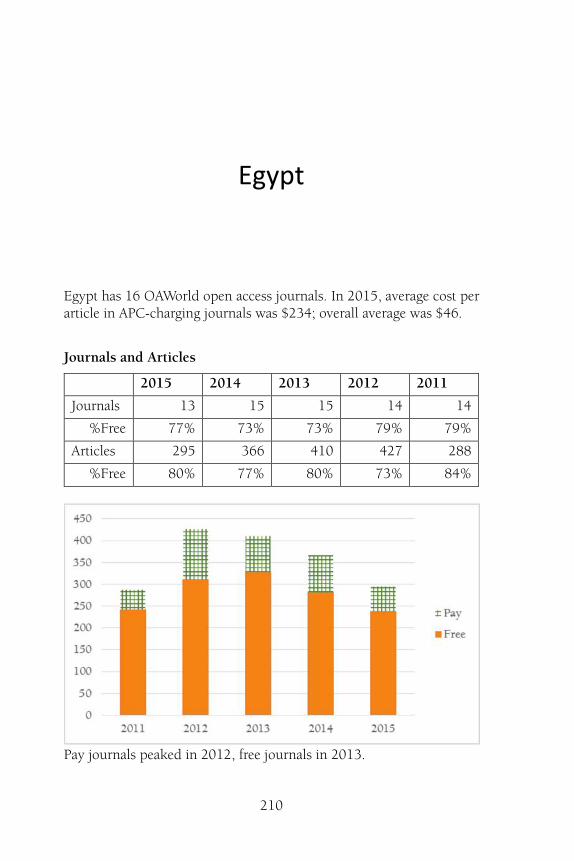
210
Egypt
Egypt has 16 OAWorld open access journals. In 2015, average cost perarticle in APC-charging journals was $234; overall average was $46.
Journals and Articles
2015 2014 2013 2012 2011
Journals 13 15 15 14 14
%Free 77% 73% 73% 79% 79%
Articles 295 366 410 427 288
%Free 80% 77% 80% 73% 84%
Pay journals peaked in 2012, free journals in 2013.

Egypt 211
Article Volume
Journals %Free Articles %Free
Med.: 60-149 1 100% 69 100%
Small: 20-59 6 67% 169 73%
Smallest: 0-19 9 78% 57 79%
APC Levels and Revenues
Journals Articles Revenue $/article
$200-$599 3 37 $11,450 $309
$2-$199 1 21 $2,100 $100
Free 12 237
Total 16 295 $13,550 $46
Publisher Category
Category Journals %Free Articles %Free
Miscellaneous 8 75% 193 81%
Society/govt 3 100% 40 100%
Univ/college 2 50% 35 100%
Open Access 3 67% 27 22%
Note that Hindawi is part of APCLand and not included in this book.
Growth and Shrinkage
Change 2014-15 Count Percent Cum%
Grew 50%+ 1 6.3%
Grew 10-49% 1 6.3% 12.5%
Even, ±9.99% 4 25.0% 37.5%
Shrank 10-49% 5 31.3% 68.8%
Shrank 50%+ 4 25.0% 93.8%
Much more shrinkage than growth.

212 The Countries of OAWorld 2011-2015
Gray OA and DOAJ16
GrayOA %Gray DOAJ16
Journals/Free 5 42% 7
Journals/Pay 2 50% 2
Articles/Free 48 20% 189
Articles/Pay 33 57% 25
High delisting percentage for both free and pay journals.
Subjects
Subject Journals %Free Articles %Free
Medicine 3 100% 93 100%
Mathematics 3 67% 62 66%
Other Sciences 2 50% 49 49%
History 1 100% 41 100%
Library Science 1 100% 23 100%
Anthropology 1 0% 12 0%
Computer Science 2 100% 8 100%
Biology 2 100% 7 100%
Language & Literature 1 0% 0

213
Iran, Islamic Republic of
Iran has 297 OAWorld open access journals. In 2015, average cost perarticle for APC-charging journals was $275; overall average, $64.
Journals and Articles
2015 2014 2013 2012 2011
Journals 284 291 267 226 168
%Free 84% 84% 83% 81% 82%
Articles 13,621 13,905 12,143 10,767 7,900
%Free 77% 75% 78% 71% 71%
The small dip in 2015 is mostly pay journals.

214 The Countries of OAWorld 2011-2015
Article Volume
Journals %Free Articles %Free
Large: 150-599 14 57% 3,060 53%
Med.: 60-149 42 76% 3,718 77%
Small: 20-59 177 89% 6,240 87%
Smallest: 0-19 64 84% 603 85%
APC Levels and Revenues
Journals Articles Revenue $/article
$600-$1.399 5 329 $246,284 $749
$200-$599 11 1,200 $427,427 $356
$2-$199 30 1,631 $193,900 $119
Free 251 10,461
Total 297 13,621 $867,611 $64
Publisher Category
Category Journals %Free Articles %Free
Univ/college 216 90% 10,135 84%
Miscellaneous 35 86% 1,394 78%
Traditional 15 60% 852 28%
Society/govt 18 94% 725 91%
Open Access 13 0% 515 0%
University publishers dominate even more than elsewhere.

Iran, Islamic Republic of 215
Starting Date
Several universities started or expanded OA in 2012-2013.
Growth and Shrinkage
Change 2014-15 Count Percent Cum%
Grew 50%+ 34 11.4%
Grew 10-49% 69 23.2% 34.7%
Even, ±9.99% 89 30.0% 64.6%
Shrank 10-49% 67 22.6% 87.2%
Shrank 50%+ 32 10.8% 98.0%
Just slightly more growth than shrinkage; sizable even group.
Gray OA and DOAJ16
GrayOA %Gray DOAJ16
Journals/Free 75 30% 176
Journals/Pay 9 20% 37
Articles/Free 3,480 33% 6,981
Articles/Pay 626 20% 2,534
Typical delisting rate for free journals, fairly low for pay journals.

216 The Countries of OAWorld 2011-2015
Subjects
Subject Journals %Free Articles %Free
Medicine 175 88% 9,312 77%
Biology 17 76% 796 58%
Engineering 10 100% 495 100%
Mathematics 13 92% 407 90%
Zoology 10 30% 381 41%
Agriculture 7 57% 329 81%
Education 10 100% 290 100%
Ecology 6 67% 201 54%
Earth Sciences 7 100% 190 100%
Economics 6 100% 183 100%
Computer Science 3 67% 179 37%
Other Sciences 4 50% 139 60%
Chemistry 3 100% 122 100%
Sociology 4 50% 110 57%
Language & Literature 5 80% 88 88%
Psychology 3 100% 84 100%
Physics 2 100% 76 100%
Library Science 3 100% 65 100%
Technology 1 100% 59 100%
Political Science 1 100% 34 100%
Philosophy 2 50% 33 76%
Anthropology 2 100% 20 100%
Religion 2 50% 20 0%
Media & Communications 1 100% 8 100%
Medicine accounts for more than two-thirds of all articles.

217
Israel
Israel has 13 OAWorld open access journals. In 2015, average cost perarticle in APC-charging journals was $29; overall average was $13.
Journals and Articles
2015 2014 2013 2012 2011
Journals 11 12 13 13 11
%Free 82% 83% 85% 85% 91%
Articles 352 350 396 377 380
%Free 55% 50% 54% 52% 53%
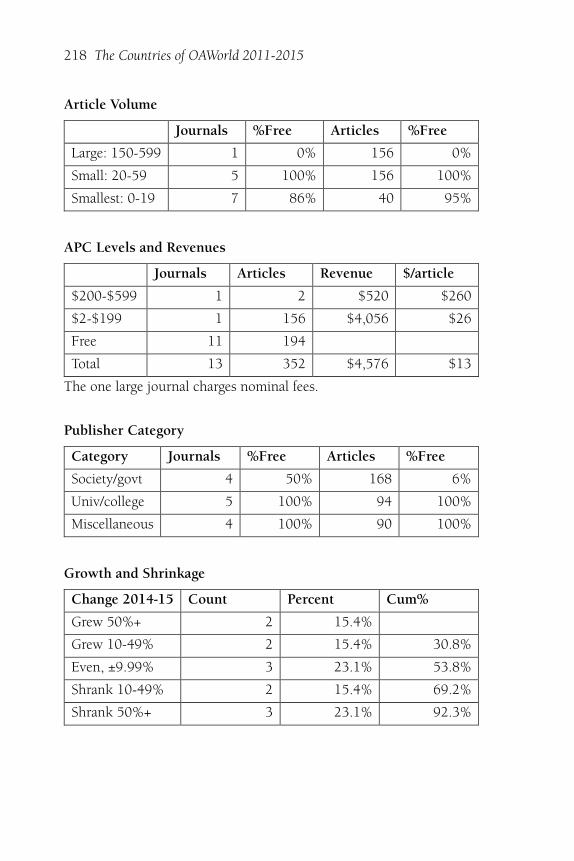
218 The Countries of OAWorld 2011-2015
Article Volume
Journals %Free Articles %Free
Large: 150-599 1 0% 156 0%
Small: 20-59 5 100% 156 100%
Smallest: 0-19 7 86% 40 95%
APC Levels and Revenues
Journals Articles Revenue $/article
$200-$599 1 2 $520 $260
$2-$199 1 156 $4,056 $26
Free 11 194
Total 13 352 $4,576 $13
The one large journal charges nominal fees.
Publisher Category
Category Journals %Free Articles %Free
Society/govt 4 50% 168 6%
Univ/college 5 100% 94 100%
Miscellaneous 4 100% 90 100%
Growth and Shrinkage
Change 2014-15 Count Percent Cum%
Grew 50%+ 2 15.4%
Grew 10-49% 2 15.4% 30.8%
Even, ±9.99% 3 23.1% 53.8%
Shrank 10-49% 2 15.4% 69.2%
Shrank 50%+ 3 23.1% 92.3%

Israel 219
Gray OA and DOAJ16
GrayOA %Gray DOAJ16
Journals/Free 5 45% 6
Journals/Pay 1 50% 1
Articles/Free 73 38% 121
Articles/Pay 156 99% 2
High delisting percentage, including the only large journal.
Subjects
Subject Journals %Free Articles %Free
Medicine 2 50% 199 22%
Political Science 3 100% 49 100%
History 2 100% 39 100%
Language & Literature 3 100% 36 100%
Arts & Architecture 2 50% 29 93%
Zoology 1 100% 0

220
Jordan
Jordan has ten OAWorld open access journals. In 2015, the average costper article in APC-charging journals was $160; overall average $137.
Journals and Articles
2015 2014 2013 2012 2011
Journals 8 9 10 10 9
%Free 63% 67% 70% 70% 78%
Articles 973 687 394 318 325
%Free 15% 25% 41% 57% 80%
An extreme case: 85% of articles from the 37% pay journals.

Jordan 221
Article Volume
Journals %Free Articles %Free
Large: 150-599 2 0% 734 0%
Med.: 60-149 1 0% 95 0%
Small: 20-59 3 100% 122 100%
Smallest: 0-19 4 100% 22 100%
APC Levels and Revenues
Journals Articles Revenue $/article
$200-$599 2 245 $71,500 $292
$2-$199 1 584 $61,320 $105
Free 7 144
Total 10 973 $132,820 $137
Publisher Category
Category Journals %Free Articles %Free
Miscellaneous 5 40% 876 5%
Univ/college 4 100% 97 100%
Society/govt 1 100% 0
Growth and Shrinkage
Change 2014-15 Count Percent Cum%
Grew 50%+ 1 10.0%
Grew 10-49% 3 30.0% 40.0%
Even, ±9.99% 2 20.0% 60.0%
Shrank 10-49% 2 20.0% 80.0%
Shrank 50%+ 1 10.0% 90.0%

222 The Countries of OAWorld 2011-2015
Gray OA and DOAJ16
GrayOA %Gray DOAJ16
Journals/Free 4 57% 3
Journals/Pay 1 33% 2
Articles/Free 69 48% 75
Articles/Pay 150 18% 679
High delisting percentage for free journals and articles.
Subjects
Subject Journals %Free Articles %Free
Other Sciences 1 0% 584 0%
Education 1 0% 150 0%
Computer Science 5 80% 144 34%
Biology 1 100% 53 100%
Engineering 1 100% 32 100%
Medicine 1 100% 10 100%

223
Turkey
Turkey has 295 OAWorld open access journals. In 2015, average costper article in APC-charging journals was $313; overall average was $36.
Journals and Articles
2015 2014 2013 2012 2011
Journals 285 290 281 256 228
%Free 92% 91% 91% 91% 92%
Articles 13,838 12,136 11,719 10,614 8,724
%Free 88% 89% 86% 88% 86%
Pay articles not quite back to 2013 peak; free keep rising.
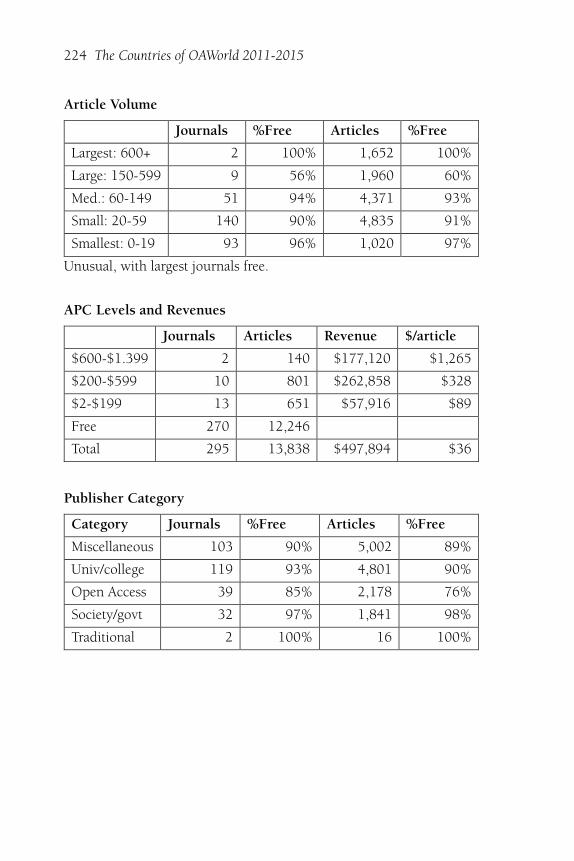
224 The Countries of OAWorld 2011-2015
Article Volume
Journals %Free Articles %Free
Largest: 600+ 2 100% 1,652 100%
Large: 150-599 9 56% 1,960 60%
Med.: 60-149 51 94% 4,371 93%
Small: 20-59 140 90% 4,835 91%
Smallest: 0-19 93 96% 1,020 97%
Unusual, with largest journals free.
APC Levels and Revenues
Journals Articles Revenue $/article
$600-$1.399 2 140 $177,120 $1,265
$200-$599 10 801 $262,858 $328
$2-$199 13 651 $57,916 $89
Free 270 12,246
Total 295 13,838 $497,894 $36
Publisher Category
Category Journals %Free Articles %Free
Miscellaneous 103 90% 5,002 89%
Univ/college 119 93% 4,801 90%
Open Access 39 85% 2,178 76%
Society/govt 32 97% 1,841 98%
Traditional 2 100% 16 100%

Turkey 225
Starting Date
Growth and Shrinkage
Change 2014-15 Count Percent Cum%
Grew 50%+ 54 18.3%
Grew 10-49% 69 23.4% 41.7%
Even, ±9.99% 59 20.0% 61.7%
Shrank 10-49% 81 27.5% 89.2%
Shrank 50%+ 27 9.2% 98.3%
Much more fast growth than fast shrinkage.
Gray OA and DOAJ16
GrayOA %Gray DOAJ16
Journals/Free 104 39% 166
Journals/Pay 5 20% 20
Articles/Free 4,979 41% 7,267
Articles/Pay 320 20% 1,272
Somewhat high delisting rate for free journals, on low side for pay.

226 The Countries of OAWorld 2011-2015
Subjects
Subject Journals %Free Articles %Free
Medicine 86 99% 4,344 99%
Education 51 92% 1,272 90%
Miscellany 5 100% 1,023 100%
Sociology 15 93% 985 79%
Economics 22 64% 958 39%
Language & Literature 7 100% 926 100%
Agriculture 16 69% 782 82%
Zoology 7 71% 517 69%
Engineering 9 89% 496 63%
Arts & Architecture 11 100% 376 100%
Anthropology 7 86% 351 67%
Biology 8 100% 279 100%
Other Sciences 8 88% 274 94%
Chemistry 5 100% 267 100%
Computer Science 4 100% 206 100%
History 7 100% 196 100%
Mathematics 7 100% 141 100%
Religion 5 100% 104 100%
Media & Communications 2 100% 81 100%
Library Science 3 100% 62 100%
Political Science 3 100% 54 100%
Earth Sciences 2 100% 41 100%
Physics 1 100% 34 100%
Ecology 2 50% 32 19%
Philosophy 1 100% 21 100%
Technology 1 100% 16 100%
Medicine largest subject but not dominant or majority.

227
United Arab Emirates
The UAE have 14 OAWorld open access journals. Average cost per arti-cle in APC-charging journals in 2015: $484. Overall average: $381
Journals and Articles
2015 2014 2013 2012 2011
Journals 13 13 13 13 8
%Free 23% 23% 23% 23% 38%
Articles 823 1,411 933 857 491
%Free 21% 10% 16% 13% 18%
One very large (in 2014) pay journal has no more recent articles.

228 The Countries of OAWorld 2011-2015
Article Volume
Journals %Free Articles %Free
Large: 150-599 1 0% 259 0%
Med.: 60-149 3 33% 244 49%
Small: 20-59 8 13% 308 14%
Smallest: 0-19 2 50% 12 100%
UAE unusual in having fees for most journals.
APC Levels and Revenues
Journals Articles Revenue $/article
$600-$1.399 1 259 $260,036 $1,004
$200-$599 3 141 $28,200 $200
$2-$199 7 249 $25,690 $103
Free 3 174
Total 14 823 $313,926 $381
Publisher Category
Category Journals %Free Articles %Free
Open Access 8 0% 368 0%
Traditional 1 0% 259 0%
Univ/college 1 100% 120 100%
Miscellaneous 4 50% 76 71%
Two OA publishers, four journals each.

United Arab Emirates 229
Growth and Shrinkage
Change 2014-15 Count Percent Cum%
Grew 50%+ 3 21.4%
Grew 10-49% 5 35.7% 57.1%
Even, ±9.99% 2 14.3% 71.4%
Shrank 10-49% 2 14.3% 85.7%
Shrank 50%+ 1 7.1% 92.9%
Much more growth than shrinkage at the journal level.
Gray OA and DOAJ16
GrayOA %Gray DOAJ16
Journals/Free 3 100% 0
Journals/Pay 1 9% 10
Articles/Free 174 100% 0
Articles/Pay 259 40% 390
Only one delisted fee journal—but all the free journals delisted.
Subjects
Subject Journals %Free Articles %Free
Medicine 2 0% 284 0%
Agriculture 1 100% 120 100%
Economics 2 0% 118 0%
Engineering 1 0% 60 0%
Computer Science 2 0% 57 0%
Mathematics 1 0% 56 0%
Education 2 50% 47 26%
Physics 1 100% 42 100%
Sociology 1 0% 39 0%
Other Sciences 1 0% 0

230
Other Middle East Countries
These countries have 30 OAWorld open access journals. Average costper article in APC-charging journals in 2015: $496. Overall: $87.
Journals and Articles
2015 2014 2013 2012 2011
Journals 28 27 27 24 20
%Free 68% 70% 70% 71% 65%
Articles 1,335 1,334 1,462 1,223 1,041
%Free 83% 81% 70% 80% 79%
Free journals keep growing, pay journals peaked in 2013.

Other Middle East Countries 231
Article Volume
Journals %Free Articles %Free
Large: 150-599 1 100% 197 100%
Med.: 60-149 7 86% 656 87%
Small: 20-59 11 64% 406 70%
Smallest: 0-19 11 55% 76 68%
Just the opposite of typical pattern: higher fee % in smaller journals.
APC Levels and Revenues
Journals Articles Revenue $/article
$1,400+ 1 40 $79,800 $1,995
$600-$1.399 2 11 $11,345 $1,031
$200-$599 1 31 $6,200 $200
$2-$199 6 151 $18,231 $121
Free 20 1,102
Total 30 1,335 $115,576 $87
Publisher Category
Category Journals %Free Articles %Free
Univ/college 20 55% 610 67%
Miscellaneous 3 100% 227 100%
Society/govt 2 100% 224 100%
Open Access 4 75% 183 83%
Traditional 1 100% 91 100%

232 The Countries of OAWorld 2011-2015
Starting Date
Growth and Shrinkage
Change 2014-15 Count Percent Cum%
Grew 50%+ 3 10.0%
Grew 10-49% 5 16.7% 26.7%
Even, ±9.99% 10 33.3% 60.0%
Shrank 10-49% 4 13.3% 73.3%
Shrank 50%+ 5 16.7% 90.0%
Slightly more shrinkage than growth, with a strong even core.
Gray OA and DOAJ16
GrayOA %Gray DOAJ16
Journals/Free 6 30% 14
Journals/Pay 1 10% 9
Articles/Free 522 47% 580
Articles/Pay 2 1% 231
Typical free-journal delisting rate, trivial pay-journal rate.
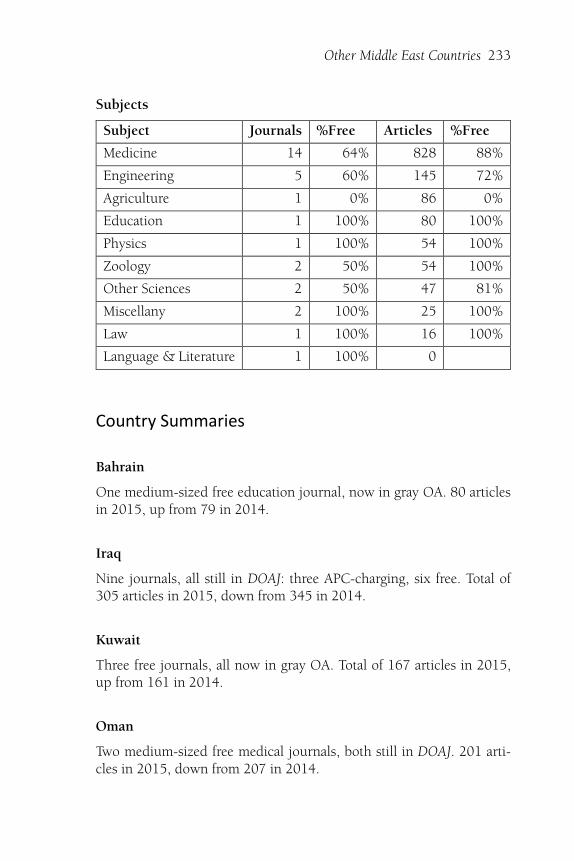
Other Middle East Countries 233
Subjects
Subject Journals %Free Articles %Free
Medicine 14 64% 828 88%
Engineering 5 60% 145 72%
Agriculture 1 0% 86 0%
Education 1 100% 80 100%
Physics 1 100% 54 100%
Zoology 2 50% 54 100%
Other Sciences 2 50% 47 81%
Miscellany 2 100% 25 100%
Law 1 100% 16 100%
Language & Literature 1 100% 0
Country Summaries
Bahrain
One medium-sized free education journal, now in gray OA. 80 articlesin 2015, up from 79 in 2014.
Iraq
Nine journals, all still in DOAJ: three APC-charging, six free. Total of305 articles in 2015, down from 345 in 2014.
Kuwait
Three free journals, all now in gray OA. Total of 167 articles in 2015,up from 161 in 2014.
Oman
Two medium-sized free medical journals, both still in DOAJ. 201 arti-cles in 2015, down from 207 in 2014.

234 The Countries of OAWorld 2011-2015
Palestine, State of
One small APC-charging engineering journal, still in DOAJ, with 32 ar-ticles in 2015, up from 24 in 2014.
Qatar
Seven journals, one now gray OA. Three APC-charging, four free; twosmall, five very small; all but two medical. In all, 110 articles in 2015,up from 108 in 2014.
Saudi Arabia
Five journals, all but one medical, and the fifth hasn’t published anyarticles since 2011. Of the other four, one small one charges APCs; amedium sized free one is now gray OA, as is a free large one; and onefree medium-sized one is still in DOAJ. Total of 426 articles in 2015, upfrom 386 in 2014.
Yemen
Two very small journals, both still in DOAJ: one free, one with APCs.Total of 14 articles in 2015, down from 24 in 2014.
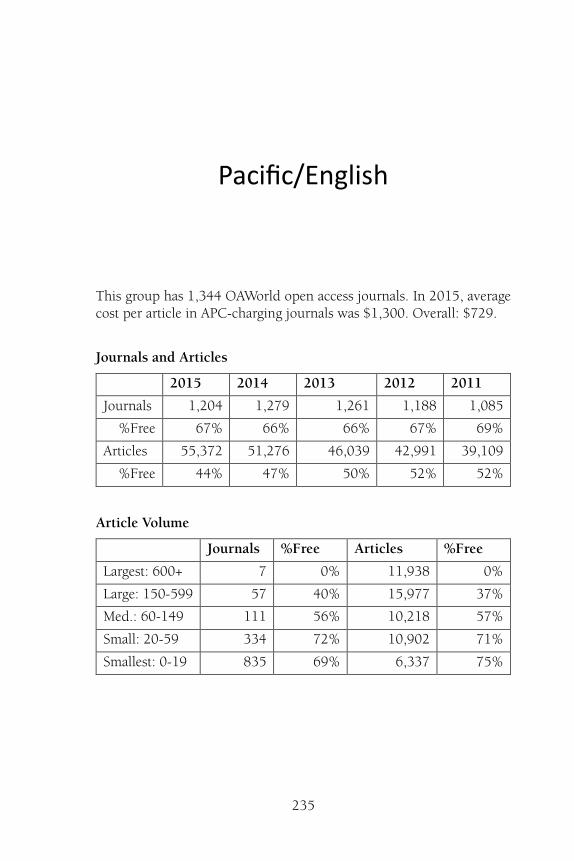
235
Pacific/English
This group has 1,344 OAWorld open access journals. In 2015, averagecost per article in APC-charging journals was $1,300. Overall: $729.
Journals and Articles
2015 2014 2013 2012 2011
Journals 1,204 1,279 1,261 1,188 1,085
%Free 67% 66% 66% 67% 69%
Articles 55,372 51,276 46,039 42,991 39,109
%Free 44% 47% 50% 52% 52%
Article Volume
Journals %Free Articles %Free
Largest: 600+ 7 0% 11,938 0%
Large: 150-599 57 40% 15,977 37%
Med.: 60-149 111 56% 10,218 57%
Small: 20-59 334 72% 10,902 71%
Smallest: 0-19 835 69% 6,337 75%

236 The Countries of OAWorld 2011-2015
APC Levels and Revenues
Journals Articles Revenue $/article
$1,400+ 97 11,133 $24,864,772 $2,233
$600-$1.399 131 11,087 $12,744,362 $1,149
$200-$599 169 6,131 $2,498,670 $408
$2-$199 50 2,696 $256,824 $95
Free 897 24,325
Total 1,344 55,372 $40,364,628 $729
Publisher Category
Category Journals %Free Articles %Free
Miscellaneous 335 79% 14,844 52%
Society/govt 180 79% 13,619 40%
Univ/college 486 95% 11,729 83%
Open Access 233 12% 11,721 11%
Traditional 110 3% 3,459 4%
Growth and Shrinkage
Change 2014-15 Count Percent Cum%
Grew 50%+ 280 20.8%
Grew 10-49% 217 16.1% 37.0%
Even, ±9.99% 217 16.1% 53.1%
Shrank 10-49% 304 22.6% 75.7%
Shrank 50%+ 261 19.4% 95.2%
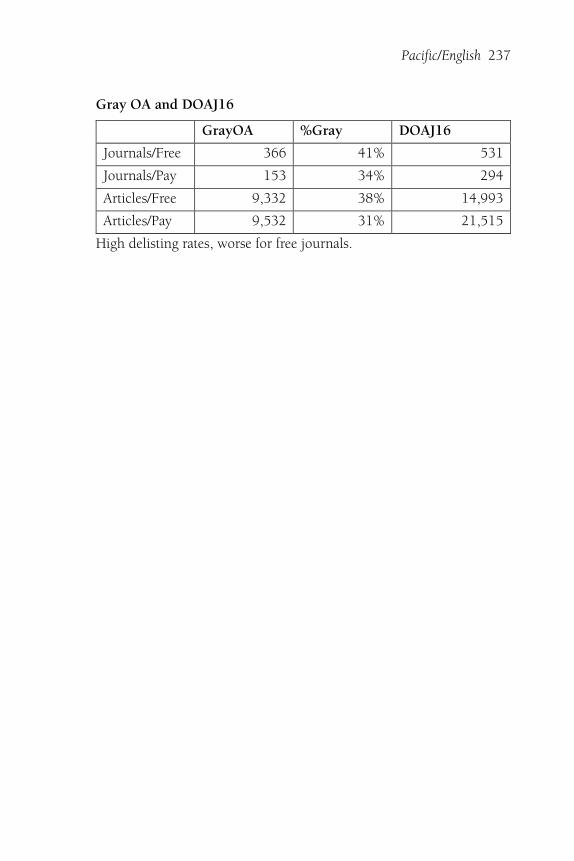
Pacific/English 237
Gray OA and DOAJ16
GrayOA %Gray DOAJ16
Journals/Free 366 41% 531
Journals/Pay 153 34% 294
Articles/Free 9,332 38% 14,993
Articles/Pay 9,532 31% 21,515
High delisting rates, worse for free journals.

238 The Countries of OAWorld 2011-2015
Subjects
Subject Journals %Free Articles %Free
Medicine 319 34% 19,524 31%
Physics 23 39% 5,514 12%
Education 138 90% 2,533 86%
Computer Science 42 55% 2,517 37%
Biology 47 36% 2,397 25%
Sociology 79 91% 2,373 62%
Language & Literature 82 94% 2,288 64%
Mathematics 47 91% 1,890 98%
History 48 98% 1,805 100%
Engineering 28 36% 1,766 7%
Other Sciences 18 50% 1,735 9%
Economics 63 70% 1,324 77%
Ecology 38 55% 1,217 62%
Religion 34 97% 932 47%
Library Science 38 97% 927 99%
Agriculture 34 44% 901 36%
Chemistry 11 27% 882 19%
Technology 18 61% 728 59%
Media & Communications 29 93% 692 80%
Arts & Architecture 34 94% 630 77%
Political Science 30 90% 564 92%
Zoology 15 27% 441 13%
Law 37 97% 378 100%
Anthropology 19 84% 358 82%
Psychology 21 48% 327 47%
Philosophy 24 96% 309 89%
Earth Sciences 17 47% 278 32%
Miscellany 11 82% 142 63%

239
Australia
Australia has 114 OAWorld open access journals. Average cost in 2015for articles in APC-charging journals: $715. Overall average: $245.
Journals and Articles
2015 2014 2013 2012 2011
Journals 104 110 105 96 92
%Free 86% 85% 85% 88% 88%
Articles 3,190 3,221 2,947 2,690 2,438
%Free 66% 61% 59% 60% 64%
Decline in 2015 is entirely pay journals; free ones keep growing.

240 The Countries of OAWorld 2011-2015
Article Volume
Journals %Free Articles %Free
Large: 150-599 4 50% 701 52%
Med.: 60-149 9 44% 920 38%
Small: 20-59 29 83% 912 82%
Smallest: 0-19 72 94% 657 96%
No very large journals.
APC Levels and Revenues
Journals Articles Revenue $/article
$600-$1.399 5 534 $676,586 $1,267
$200-$599 2 205 $55,624 $271
$2-$199 9 356 $50,514 $142
Free 98 2,095
Total 114 3,190 $782,724 $245
Publisher Category
Category Journals %Free Articles %Free
Open Access 13 23% 1,027 21%
Univ/college 60 98% 1,011 99%
Miscellaneous 27 85% 944 74%
Society/govt 14 93% 208 88%
Universities publish most of the journals, but not most of the articles.

Australia 241
Starting Date
Growth and Shrinkage
Change 2014-15 Count Percent Cum%
Grew 50%+ 28 24.6%
Grew 10-49% 13 11.4% 36.0%
Even, ±9.99% 20 17.5% 53.5%
Shrank 10-49% 30 26.3% 79.8%
Shrank 50%+ 19 16.7% 96.5%
More shrinkage than growth.
Gray OA and DOAJ16
GrayOA %Gray DOAJ16
Journals/Free 39 40% 59
Journals/Pay 6 38% 10
Articles/Free 717 34% 1,378
Articles/Pay 229 21% 866
Moderately high delisting percentages.
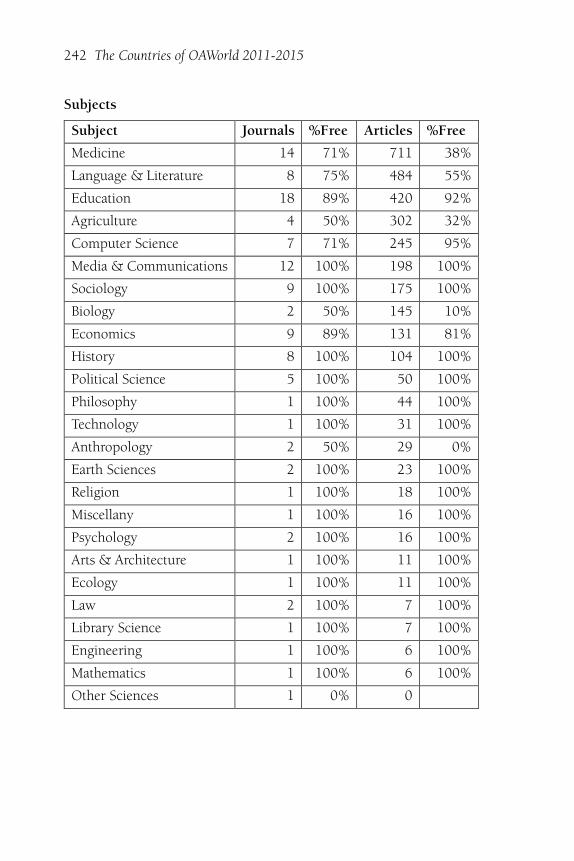
242 The Countries of OAWorld 2011-2015
Subjects
Subject Journals %Free Articles %Free
Medicine 14 71% 711 38%
Language & Literature 8 75% 484 55%
Education 18 89% 420 92%
Agriculture 4 50% 302 32%
Computer Science 7 71% 245 95%
Media & Communications 12 100% 198 100%
Sociology 9 100% 175 100%
Biology 2 50% 145 10%
Economics 9 89% 131 81%
History 8 100% 104 100%
Political Science 5 100% 50 100%
Philosophy 1 100% 44 100%
Technology 1 100% 31 100%
Anthropology 2 50% 29 0%
Earth Sciences 2 100% 23 100%
Religion 1 100% 18 100%
Miscellany 1 100% 16 100%
Psychology 2 100% 16 100%
Arts & Architecture 1 100% 11 100%
Ecology 1 100% 11 100%
Law 2 100% 7 100%
Library Science 1 100% 7 100%
Engineering 1 100% 6 100%
Mathematics 1 100% 6 100%
Other Sciences 1 0% 0

243
Canada
Canada has 199 OAWorld open access journals. The 2015 average costper article in APC-charging journals was $911; overall average $407.
Journals and Articles
2015 2014 2013 2012 2011
Journals 177 186 191 186 165
%Free 76% 77% 79% 80% 81%
Articles 6,175 5,898 5,714 5,524 4,402
%Free 55% 60% 63% 64% 65%
Free journals peaked in 2013; pay journals still growing.

244 The Countries of OAWorld 2011-2015
Article Volume
Journals %Free Articles %Free
Large: 150-599 7 14% 1,835 21%
Med.: 60-149 14 57% 1,305 56%
Small: 20-59 61 70% 1,992 70%
Smallest: 0-19 117 89% 1,043 87%
No very large journals; standard size/APC pattern.
APC Levels and Revenues
Journals Articles Revenue $/article
$1,400+ 8 646 $1,386,990 $2,147
$600-$1.399 7 518 $477,624 $922
$200-$599 24 1,507 $641,774 $426
$2-$199 4 85 $5,370 $63
Free 156 3,419
Total 199 6,175 $2,511,758 $407
Several very expensive journals: note the top-row average.
Publisher Category
Category Journals %Free Articles %Free
Univ/college 95 91% 2,767 72%
Open Access 25 24% 1,493 16%
Miscellaneous 52 83% 1,257 56%
Society/govt 26 81% 640 74%
Traditional 1 0% 18 0%

Canada 245
Starting Date
Growth and Shrinkage
Change 2014-15 Count Percent Cum%
Grew 50%+ 42 21.1%
Grew 10-49% 31 15.6% 36.7%
Even, ±9.99% 34 17.1% 53.8%
Shrank 10-49% 53 26.6% 80.4%
Shrank 50%+ 26 13.1% 93.5%
More fast growth than fast shrinkage, more shrinkage than growth.
Gray OA and DOAJ16
GrayOA %Gray DOAJ16
Journals/Free 62 40% 94
Journals/Pay 9 21% 34
Articles/Free 1,230 36% 2,189
Articles/Pay 792 29% 1,964
High rate of free-journal delisting, low rate for fee.

246 The Countries of OAWorld 2011-2015
Subjects
Subject Journals %Free Articles %Free
Medicine 43 47% 2,191 32%
Sociology 19 89% 773 50%
Language & Literature 18 89% 664 50%
Education 28 100% 440 100%
Ecology 7 57% 318 27%
Economics 11 82% 246 87%
Mathematics 6 100% 236 100%
Computer Science 4 50% 204 79%
Media & Communications 4 100% 170 100%
Political Science 7 86% 117 74%
Library Science 3 100% 114 100%
Other Sciences 4 75% 82 29%
Philosophy 7 100% 81 100%
Earth Sciences 2 50% 67 9%
Anthropology 5 100% 59 100%
History 6 100% 59 100%
Biology 2 100% 55 100%
Miscellany 3 67% 54 17%
Agriculture 3 100% 51 100%
Engineering 2 100% 43 100%
Law 2 100% 36 100%
Religion 3 100% 29 100%
Psychology 3 0% 28 0%
Chemistry 1 100% 21 100%
Zoology 2 0% 20 0%
Physics 1 100% 11 100%
Arts & Architecture 3 100% 6 100%

247
New Zealand
New Zealand has 79 OAWorld open access journals. For 2015, averagecost per article for APC-charging journals: $1,880. Overall: $1,156.
Journals and Articles
2015 2014 2013 2012 2011
Journals 72 77 73 71 66
%Free 24% 27% 26% 28% 29%
Articles 1,126 1,016 965 856 711
%Free 39% 45% 44% 45% 47%
Free journals down slightly from 2014, pay still growing.
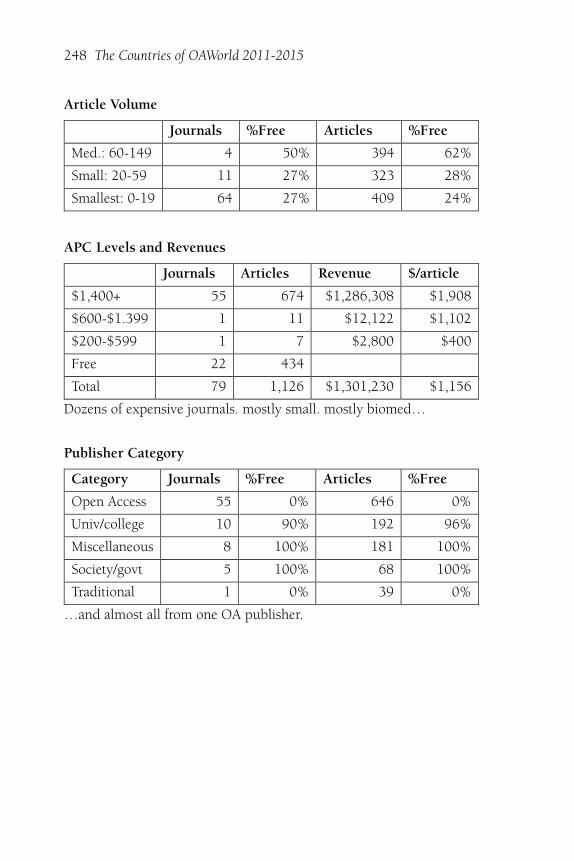
248 The Countries of OAWorld 2011-2015
Article Volume
Journals %Free Articles %Free
Med.: 60-149 4 50% 394 62%
Small: 20-59 11 27% 323 28%
Smallest: 0-19 64 27% 409 24%
APC Levels and Revenues
Journals Articles Revenue $/article
$1,400+ 55 674 $1,286,308 $1,908
$600-$1.399 1 11 $12,122 $1,102
$200-$599 1 7 $2,800 $400
Free 22 434
Total 79 1,126 $1,301,230 $1,156
Dozens of expensive journals. mostly small. mostly biomed…
Publisher Category
Category Journals %Free Articles %Free
Open Access 55 0% 646 0%
Univ/college 10 90% 192 96%
Miscellaneous 8 100% 181 100%
Society/govt 5 100% 68 100%
Traditional 1 0% 39 0%
…and almost all from one OA publisher.

New Zealand 249
Starting Date
Growth and Shrinkage
Change 2014-15 Count Percent Cum%
Grew 50%+ 24 30.4%
Grew 10-49% 10 12.7% 43.0%
Even, ±9.99% 4 5.1% 48.1%
Shrank 10-49% 19 24.1% 72.2%
Shrank 50%+ 20 25.3% 97.5%
Slightly more shrinkage—and very few steady-state.
Gray OA and DOAJ16
GrayOA %Gray DOAJ16
Journals/Free 8 36% 14
Journals/Pay 3 5% 54
Articles/Free 146 34% 288
Articles/Pay 47 7% 645
Very low pay delisting, somewhat high free.

250 The Countries of OAWorld 2011-2015
Subjects
Subject Journals %Free Articles %Free
Medicine 42 5% 559 7%
Biology 11 9% 144 13%
Computer Science 3 67% 126 99%
Technology 1 100% 123 100%
Education 3 100% 36 100%
Psychology 1 100% 26 100%
Sociology 2 100% 24 100%
Chemistry 2 0% 16 0%
Arts & Architecture 1 100% 14 100%
Mathematics 2 100% 12 100%
Agriculture 2 50% 11 27%
Religion 2 100% 10 100%
Ecology 1 0% 9 0%
Library Science 1 0% 7 0%
Zoology 1 0% 7 0%
Economics 1 100% 2 100%
Language & Literature 1 100% 0
Law 1 100% 0
Miscellany 1 100% 0

251
United States
The US has 952 OAWorld open access journals. Average cost per 2015article in APC-charging journals was $1,350; overall average was $797.
Journals and Articles
2015 2014 2013 2012 2011
Journals 851 906 892 835 762
%Free 66% 65% 65% 66% 68%
Articles 44,881 41,141 36,413 33,921 31,558
%Free 41% 45% 48% 49% 50%
Free journals keep growing, but pay ones grow faster.

252 The Countries of OAWorld 2011-2015
Article Volume
Journals %Free Articles %Free
Largest: 600+ 7 0% 11,938 0%
Large: 150-599 46 43% 13,441 39%
Med.: 60-149 84 57% 7,599 59%
Small: 20-59 233 73% 7,675 72%
Smallest: 0-19 582 66% 4,228 74%
APC Levels and Revenues
Journals Articles Revenue $/article
$1,400+ 34 9,813 $22,191,474 $2,261
$600-$1.399 118 10,024 $11,578,030 $1,155
$200-$599 142 4,412 $1,798,472 $408
$2-$199 37 2,255 $200,940 $89
Free 621 18,377
Total 952 44,881 $35,768,916 $797
Most fee journals are on the expensive side.
Publisher Category
Category Journals %Free Articles %Free
Society/govt 135 76% 12,703 38%
Miscellaneous 248 77% 12,462 49%
Open Access 140 14% 8,555 10%
Univ/college 321 95% 7,759 84%
Traditional 108 3% 3,402 4%
University publishing plays a relatively small (and mostly free) role.

United States 253
Starting Date
Growth and Shrinkage
Change 2014-15 Count Percent Cum%
Grew 50%+ 186 19.5%
Grew 10-49% 163 17.1% 36.7%
Even, ±9.99% 159 16.7% 53.4%
Shrank 10-49% 202 21.2% 74.6%
Shrank 50%+ 196 20.6% 95.2%
More journals shrinking than growing.
Gray OA and DOAJ16
GrayOA %Gray DOAJ16
Journals/Free 257 41% 364
Journals/Pay 135 41% 196
Articles/Free 7,239 39% 11,138
Articles/Pay 8,464 32% 18,040
Surprisingly high delisting rates for both free and pay journals.
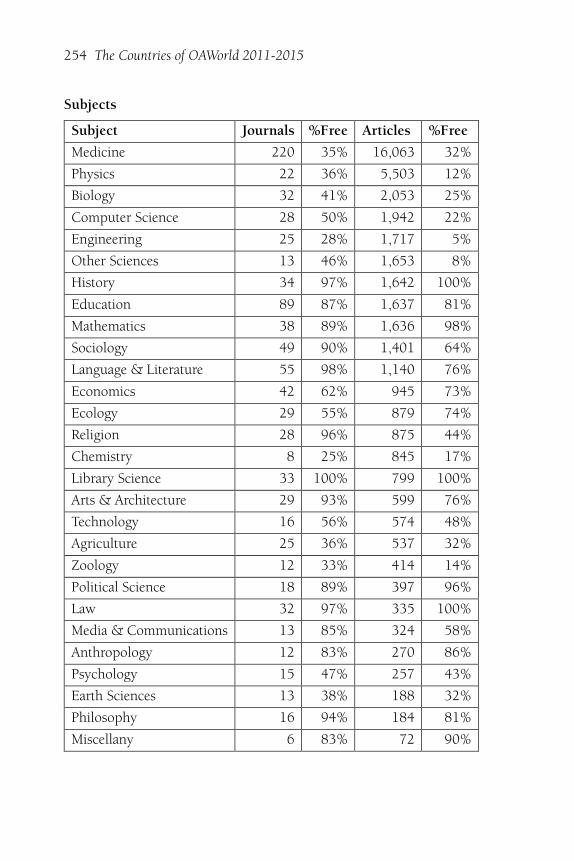
254 The Countries of OAWorld 2011-2015
Subjects
Subject Journals %Free Articles %Free
Medicine 220 35% 16,063 32%
Physics 22 36% 5,503 12%
Biology 32 41% 2,053 25%
Computer Science 28 50% 1,942 22%
Engineering 25 28% 1,717 5%
Other Sciences 13 46% 1,653 8%
History 34 97% 1,642 100%
Education 89 87% 1,637 81%
Mathematics 38 89% 1,636 98%
Sociology 49 90% 1,401 64%
Language & Literature 55 98% 1,140 76%
Economics 42 62% 945 73%
Ecology 29 55% 879 74%
Religion 28 96% 875 44%
Chemistry 8 25% 845 17%
Library Science 33 100% 799 100%
Arts & Architecture 29 93% 599 76%
Technology 16 56% 574 48%
Agriculture 25 36% 537 32%
Zoology 12 33% 414 14%
Political Science 18 89% 397 96%
Law 32 97% 335 100%
Media & Communications 13 85% 324 58%
Anthropology 12 83% 270 86%
Psychology 15 47% 257 43%
Earth Sciences 13 38% 188 32%
Philosophy 16 94% 184 81%
Miscellany 6 83% 72 90%

255
Western Europe
Western Europe has 2,106 OAWorld open access journals. In 2015, av-erage cost per article for APC-charging journals: $1,083. Overall: $293.
Journals and Articles
2015 2014 2013 2012 2011
Journals 1,935 1,990 1,914 1,832 1,658
%Free 84% 85% 85% 86% 87%
Articles 81,267 83,549 75,745 70,403 59,956
%Free 73% 76% 74% 77% 78%
Article Volume
Journals %Free Articles %Free
Largest: 600+ 15 67% 23,459 75%
Large: 150-599 46 52% 12,050 45%
Med.: 60-149 138 64% 11,622 64%
Small: 20-59 735 84% 23,496 82%
Smallest: 0-19 1,172 90% 10,640 90%
Unusual: largest journals mostly free.

256 The Countries of OAWorld 2011-2015
APC Levels and Revenues
Journals Articles Revenue $/article
$1,400+ 54 7,501 $15,859,247 $2,114
$600-$1.399 89 6,409 $5,848,121 $912
$200-$599 126 4,794 $1,757,177 $367
$2-$199 51 3,279 $353,570 $108
Free 1,786 59,284
Total 2,106 81,267 $23,818,115 $293
Publisher Category
Category Journals %Free Articles %Free
Miscellaneous 618 86% 32,531 80%
Univ/college 912 96% 20,314 88%
Open Access 224 48% 11,355 43%
Society/govt 247 91% 9,123 75%
Traditional 105 42% 7,944 47%
Growth and Shrinkage
Change 2014-15 Count Percent Cum%
Grew 50%+ 360 17.1%
Grew 10-49% 411 19.5% 36.6%
Even, ±9.99% 410 19.5% 56.1%
Shrank 10-49% 517 24.5% 80.6%
Shrank 50%+ 292 13.9% 94.5%
More rapid growth than rapid shrinkage, but more shrinkage thangrowth overall.

Western Europe 257
Gray OA and DOAJ16
GrayOA %Gray DOAJ16
Journals/Free 431 24% 1,355
Journals/Pay 48 15% 272
Articles/Free 12,700 21% 46,584
Articles/Pay 1,698 8% 20,285
Fairly low delisting rate for free journals, considerably lower for pay.
Subjects
Medicine largest—and here, most medical articles appear in free jour-nals.

258 The Countries of OAWorld 2011-2015
Subject Journals %Free Articles %Free
Medicine 294 66% 14,978 57%
Physics 16 50% 8,375 86%
Engineering 24 54% 5,037 55%
Ecology 52 81% 4,826 59%
Other Sciences 30 67% 4,239 88%
Language & Literature 234 100% 4,081 100%
Earth Sciences 91 77% 3,903 50%
Education 152 95% 3,305 93%
Technology 32 72% 2,978 83%
Sociology 123 90% 2,818 93%
History 116 100% 2,531 100%
Agriculture 51 71% 2,397 59%
Biology 39 51% 2,375 46%
Anthropology 103 92% 1,944 96%
Arts & Architecture 110 95% 1,915 94%
Computer Science 52 71% 1,870 37%
Chemistry 13 54% 1,861 30%
Economics 84 76% 1,720 65%
Political Science 71 90% 1,585 89%
Media & Communications 75 95% 1,540 96%
Law 57 98% 1,063 99%
Psychology 52 85% 1,039 76%
Philosophy 62 95% 1,038 95%
Zoology 37 86% 929 75%
Library Science 40 95% 824 96%
Mathematics 35 77% 779 70%
Miscellany 31 90% 687 91%
Religion 30 93% 630 94%

259
Austria
Austria has 50 OAWorld open access journals. The 2015 average costper article in APC-charging journals was $802; overall, $217.
Journals and Articles
2015 2014 2013 2012 2011
Journals 46 46 41 39 39
%Free 89% 87% 88% 90% 90%
Articles 1,297 1,766 1,857 1,417 1,149
%Free 73% 77% 64% 75% 86%
Drop in 2015 in both free and pay journals.

260 The Countries of OAWorld 2011-2015
Article Volume
Journals %Free Articles %Free
Large: 150-599 1 0% 195 0%
Med.: 60-149 4 50% 291 56%
Small: 20-59 19 95% 569 96%
Smallest: 0-19 26 92% 242 99%
APC Levels and Revenues
Journals Articles Revenue $/article
$600-$1.399 2 257 $255,052 $992
$200-$599 3 91 $26,500 $291
$2-$199 1 3 $90 $30
Free 44 946
Total 50 1,297 $281,642 $217
Publisher Category
Category Journals %Free Articles %Free
Miscellaneous 23 87% 445 71%
Traditional 14 100% 346 100%
Univ/college 9 78% 213 87%
Open Access 1 0% 195 0%
Society/govt 3 100% 98 100%
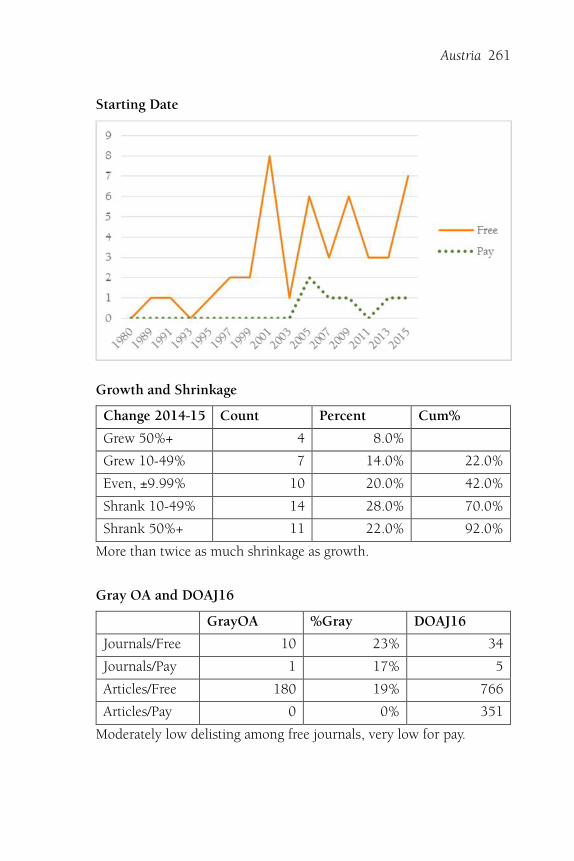
Austria 261
Starting Date
Growth and Shrinkage
Change 2014-15 Count Percent Cum%
Grew 50%+ 4 8.0%
Grew 10-49% 7 14.0% 22.0%
Even, ±9.99% 10 20.0% 42.0%
Shrank 10-49% 14 28.0% 70.0%
Shrank 50%+ 11 22.0% 92.0%
More than twice as much shrinkage as growth.
Gray OA and DOAJ16
GrayOA %Gray DOAJ16
Journals/Free 10 23% 34
Journals/Pay 1 17% 5
Articles/Free 180 19% 766
Articles/Pay 0 0% 351
Moderately low delisting among free journals, very low for pay.

262 The Countries of OAWorld 2011-2015
Subjects
Subject Journals %Free Articles %Free
Medicine 16 94% 428 85%
Computer Science 3 67% 323 40%
Education 3 67% 99 75%
Political Science 5 100% 66 100%
Biology 1 0% 62 0%
Mathematics 2 100% 60 100%
Law 2 100% 41 100%
Media & Communications 1 100% 40 100%
Philosophy 3 100% 34 100%
Religion 1 100% 33 100%
History 2 100% 29 100%
Agriculture 2 100% 25 100%
Psychology 2 100% 25 100%
Earth Sciences 1 100% 13 100%
Miscellany 1 100% 12 100%
Arts & Architecture 1 100% 4 100%
Anthropology 1 0% 3 0%
Language & Literature 1 100% 0
Other Sciences 1 0% 0
Sociology 1 100% 0
Medicine predominantly free, biology never free.

263
Belgium
Belgium has 30 OAWorld open access journals. For 2015, the singleAPC-charging journal was $216 per article; overall average cost $15.
Journals and Articles
2015 2014 2013 2012 2011
Journals 29 29 26 23 23
%Free 97% 97% 96% 96% 96%
Articles 535 485 391 447 391
%Free 93% 95% 92% 91% 92%
Pay articles peaked in 2012; free journals growing since 2013.

264 The Countries of OAWorld 2011-2015
Article Volume
Journals %Free Articles %Free
Small: 20-59 10 90% 295 88%
Smallest: 0-19 20 100% 240 100%
All small and smaller (none over 40 articles in 2015).
APC Levels and Revenues
Journals Articles Revenue $/article
$200-$599 1 36 $7,776 $216
Free 29 499 $0
Total 30 535 $7,776 $15
Publisher Category
Category Journals %Free Articles %Free
Univ/college 14 100% 221 100%
Miscellaneous 8 88% 179 80%
Society/govt 8 100% 135 100%

Belgium 265
Starting Date
Growth and Shrinkage
Change 2014-15 Count Percent Cum%
Grew 50%+ 11 36.7%
Grew 10-49% 8 26.7% 63.3%
Even, ±9.99% 3 10.0% 73.3%
Shrank 10-49% 4 13.3% 86.7%
Shrank 50%+ 3 10.0% 96.7%
Very high growth rate, very little sbrinkage.
Gray OA and DOAJ16
GrayOA %Gray DOAJ16
Journals/Free 5 17% 24
Journals/Pay 0 0% 1
Articles/Free 88 18% 411
Articles/Pay 0 0% 36
Low delisting among free journals, and the single pay journal stays.

266 The Countries of OAWorld 2011-2015
Subjects
Subject Journals %Free Articles %Free
Language & Literature 8 100% 175 100%
Technology 5 100% 87 100%
Agriculture 2 50% 75 52%
Education 2 100% 43 100%
Earth Sciences 2 100% 30 100%
Arts & Architecture 2 100% 27 100%
Computer Science 2 100% 25 100%
Medicine 1 100% 24 100%
Economics 1 100% 16 100%
Sociology 1 100% 16 100%
Philosophy 2 100% 10 100%
Political Science 2 100% 7 100%
Truly distinctive: language & literature largest, one out of three articles.

267
Denmark
Denmark has 38 OAWorld open access journals, none of which havearticle processing charges (APCs).
Journals and Articles
2015 2014 2013 2012 2011
Journals 35 33 34 31 27
Articles 619 642 636 583 479

268 The Countries of OAWorld 2011-2015
Article Volume
Journals Articles
Med.: 60-149 1 135
Small: 20-59 10 269
Smallest: 0-19 27 215
Publisher Category
Category Journals Articles
Univ/college 20 250
Miscellaneous 12 194
Society/govt 5 175
Open Access 1
Starting Date

Denmark 269
Growth and Shrinkage
Change 2014-15 Count Percent Cum%
Grew 50%+ 2 5.3%
Grew 10-49% 6 15.8% 21.1%
Even, ±9.99% 10 26.3% 47.4%
Shrank 10-49% 12 31.6% 78.9%
Shrank 50%+ 3 7.9% 86.8%
Much more shrinkage than growth.
Gray OA and DOAJ16
GrayOA %Gray DOAJ16
Journals/Free 16 42% 22
Articles/Free 326 53% 293
High delisting rate.

270 The Countries of OAWorld 2011-2015
Subjects
Subject Journals Articles
Medicine 2 135
Media & Communications 4 84
Sociology 5 69
Earth Sciences 3 39
Anthropology 2 37
Ecology 2 36
Philosophy 3 36
Education 2 34
Economics 3 29
History 1 27
Language & Literature 4 23
Library Science 1 22
Political Science 1 17
Miscellany 1 10
Arts & Architecture 2 8
Psychology 1 8
Computer Science 1 5

271
Finland
Finland has 37 OAWorld open access journals. Average 2015 cost perarticle in APC-charging journals was $396; overall average was $183.
Journals and Articles
2015 2014 2013 2012 2011
Journals 36 36 36 36 35
%Free 69% 69% 69% 69% 71%
Articles 982 1,823 1,994 1,762 1,550
%Free 54% 23% 20% 24% 28%
The drop in pay articles is entirely one six-journal publisher.

272 The Countries of OAWorld 2011-2015
Article Volume
Journals %Free Articles %Free
Med.: 60-149 1 0% 121 0%
Small: 20-59 17 59% 680 54%
Smallest: 0-19 19 84% 181 91%
There were large (fee) journals prior to 2015, now medium or small.
APC Levels and Revenues
Journals Articles Revenue $/article
$600-$1.399 1 43 $33,497 $779
$200-$599 10 410 $145,821 $356
Free 26 529
Total 37 982 $179,318 $183
Publisher Category
Category Journals %Free Articles %Free
Open Access 7 0% 314 0%
Univ/college 9 67% 259 49%
Society/govt 10 90% 190 97%
Miscellaneous 10 100% 180 100%
Traditional 1 100% 39 100%
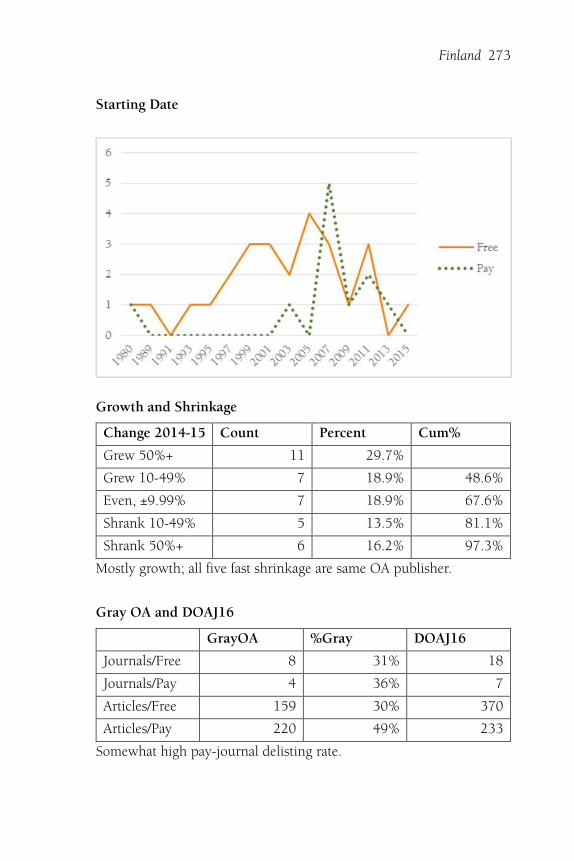
Finland 273
Starting Date
Growth and Shrinkage
Change 2014-15 Count Percent Cum%
Grew 50%+ 11 29.7%
Grew 10-49% 7 18.9% 48.6%
Even, ±9.99% 7 18.9% 67.6%
Shrank 10-49% 5 13.5% 81.1%
Shrank 50%+ 6 16.2% 97.3%
Mostly growth; all five fast shrinkage are same OA publisher.
Gray OA and DOAJ16
GrayOA %Gray DOAJ16
Journals/Free 8 31% 18
Journals/Pay 4 36% 7
Articles/Free 159 30% 370
Articles/Pay 220 49% 233
Somewhat high pay-journal delisting rate.
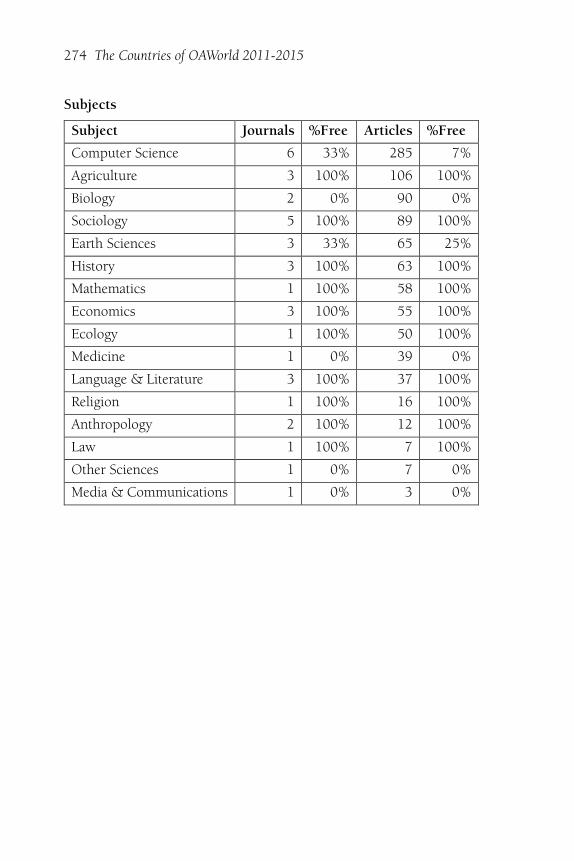
274 The Countries of OAWorld 2011-2015
Subjects
Subject Journals %Free Articles %Free
Computer Science 6 33% 285 7%
Agriculture 3 100% 106 100%
Biology 2 0% 90 0%
Sociology 5 100% 89 100%
Earth Sciences 3 33% 65 25%
History 3 100% 63 100%
Mathematics 1 100% 58 100%
Economics 3 100% 55 100%
Ecology 1 100% 50 100%
Medicine 1 0% 39 0%
Language & Literature 3 100% 37 100%
Religion 1 100% 16 100%
Anthropology 2 100% 12 100%
Law 1 100% 7 100%
Other Sciences 1 0% 7 0%
Media & Communications 1 0% 3 0%

275
France
France has 175 OAWorld open access journals. In 2015, average costper article in APC-charging journals was $627; overall average, $11.
Journals and Articles
2015 2014 2013 2012 2011
Journals 153 159 158 165 151
%Free 97% 97% 97% 98% 98%
Articles 6,229 6,247 5,977 5,057 3,550
%Free 98% 98% 98% 99% 99%
Pay articles down slightly in 2015, free up less than 1%.

276 The Countries of OAWorld 2011-2015
Article Volume
Journals %Free Articles %Free
Largest: 600+ 2 100% 2,342 100%
Large: 150-599 2 100% 371 100%
Med.: 60-149 9 100% 654 100%
Small: 20-59 59 97% 1,893 96%
Smallest: 0-19 103 97% 969 96%
Unusual: the few pay journals are all small or very small.
APC Levels and Revenues
Journals Articles Revenue $/article
$600-$1.399 1 37 $36,334 $982
$200-$599 3 66 $33,936 $514
$2-$199 1 11 $1,188 $108
Free 170 6,115
Total 175 6,229 $71,458 $11
Publisher Category
Category Journals %Free Articles %Free
Traditional 14 79% 2,926 97%
Miscellaneous 66 98% 1,424 99%
Univ/college 53 100% 1,133 100%
Society/govt 33 97% 720 98%
Open Access 9 100% 26 100%

France 277
Starting Date
Growth and Shrinkage
Change 2014-15 Count Percent Cum%
Grew 50%+ 38 21.7%
Grew 10-49% 30 17.1% 38.9%
Even, ±9.99% 18 10.3% 49.1%
Shrank 10-49% 46 26.3% 75.4%
Shrank 50%+ 27 15.4% 90.9%
Mostly dynamic, with few steady-state journals.
Gray OA and DOAJ16
GrayOA %Gray DOAJ16
Journals/Free 36 21% 134
Journals/Pay 0 0% 5
Articles/Free 694 11% 5,421
Articles/Pay 0 0% 114
Fairly low free delisting, even lower articles, no pay delisting.

278 The Countries of OAWorld 2011-2015
Subjects
Subject Journals %Free Articles %Free
Physics 4 100% 1,442 100%
Technology 3 100% 1,049 100%
Language & Literature 38 100% 554 100%
Sociology 18 100% 447 100%
Anthropology 16 100% 436 100%
Other Sciences 2 100% 215 100%
History 12 100% 211 100%
Earth Sciences 8 75% 167 66%
Ecology 7 86% 153 94%
Medicine 3 67% 141 74%
Chemistry 2 100% 134 100%
Agriculture 4 100% 115 100%
Mathematics 5 100% 111 100%
Political Science 6 100% 108 100%
Zoology 4 100% 105 100%
Biology 2 100% 102 100%
Economics 6 83% 102 89%
Education 6 100% 96 100%
Religion 3 100% 94 100%
Miscellany 3 100% 85 100%
Library Science 3 100% 74 100%
Law 4 100% 69 100%
Computer Science 4 100% 63 100%
Arts & Architecture 4 100% 52 100%
Engineering 1 100% 39 100%
Media & Communications 3 100% 30 100%
Philosophy 3 100% 21 100%
Psychology 1 100% 14 100%
Varied strong subjects, little biomed.
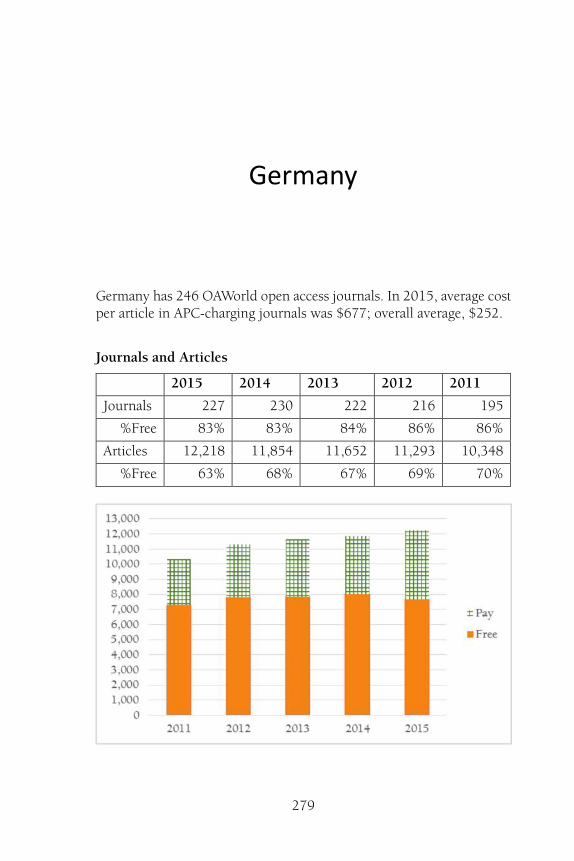
279
Germany
Germany has 246 OAWorld open access journals. In 2015, average costper article in APC-charging journals was $677; overall average, $252.
Journals and Articles
2015 2014 2013 2012 2011
Journals 227 230 222 216 195
%Free 83% 83% 84% 86% 86%
Articles 12,218 11,854 11,652 11,293 10,348
%Free 63% 68% 67% 69% 70%

280 The Countries of OAWorld 2011-2015
Article Volume
Journals %Free Articles %Free
Largest: 600+ 3 67% 2,265 64%
Large: 150-599 19 63% 4,940 53%
Med.: 60-149 18 56% 1,683 50%
Small: 20-59 68 81% 2,172 78%
Smallest: 0-19 138 92% 1,158 92%
APC Levels and Revenues
Journals Articles Revenue $/article
$1,400+ 3 211 $382,329 $1,812
$600-$1.399 11 2,982 $2,414,572 $810
$200-$599 17 697 $260,505 $374
$2-$199 9 653 $19,891 $30
Free 206 7,675
Total 246 12,218 $3,077,297 $252
Publisher Category
Category Journals %Free Articles %Free
Open Access 55 60% 6,783 50%
Univ/college 84 92% 2,579 69%
Miscellaneous 87 93% 2,444 95%
Traditional 11 82% 236 33%
Society/govt 9 67% 176 51%
Multijournal OA dominates, with one 45-journal publisher.

Germany 281
Starting Date
Growth and Shrinkage
Change 2014-15 Count Percent Cum%
Grew 50%+ 45 18.3%
Grew 10-49% 46 18.7% 37.0%
Even, ±9.99% 56 22.8% 59.8%
Shrank 10-49% 51 20.7% 80.5%
Shrank 50%+ 32 13.0% 93.5%
Slightly more growth than shrinkage.
Gray OA and DOAJ16
GrayOA %Gray DOAJ16
Journals/Free 68 33% 138
Journals/Pay 1 3% 39
Articles/Free 1,450 19% 6,225
Articles/Pay 0 0% 4,543
Slightly high free-journal delisting rate, low article rate, very low payjournal delisting rate, and that one hasn’t had articles since 2013.

282 The Countries of OAWorld 2011-2015
Subjects
Subject Journals %Free Articles %Free
Ecology 16 69% 3,337 56%
Earth Sciences 31 58% 2,436 27%
Technology 9 78% 1,295 91%
Medicine 16 88% 751 79%
Computer Science 7 43% 658 5%
Education 14 86% 381 76%
Chemistry 3 100% 373 100%
History 16 100% 359 100%
Economics 10 100% 280 100%
Language & Literature 17 100% 268 100%
Engineering 8 63% 249 35%
Arts & Architecture 8 100% 232 100%
Psychology 10 90% 200 97%
Sociology 10 90% 199 100%
Political Science 9 100% 175 100%
Biology 6 83% 173 92%
Religion 7 100% 124 100%
Agriculture 6 50% 120 46%
Mathematics 6 50% 114 47%
Library Science 6 100% 107 100%
Zoology 3 100% 91 100%
Law 5 100% 77 100%
Philosophy 5 100% 66 100%
Media & Communications 5 100% 62 100%
Other Sciences 5 100% 35 100%
Miscellany 3 100% 31 100%
Anthropology 4 100% 22 100%
Physics 1 100% 3 100%

283
Greece
Greece has 40 OAWorld open access journals. Average 2015 cost perarticle in APC-charging journals was $325; overall average, $99.
Journals and Articles
2015 2014 2013 2012 2011
Journals 35 39 38 39 36
%Free 74% 77% 76% 77% 81%
Articles 1,230 1,213 1,137 908 800
%Free 70% 73% 71% 80% 83%
Slight drop in free articles in 2015, slight increase in pay.
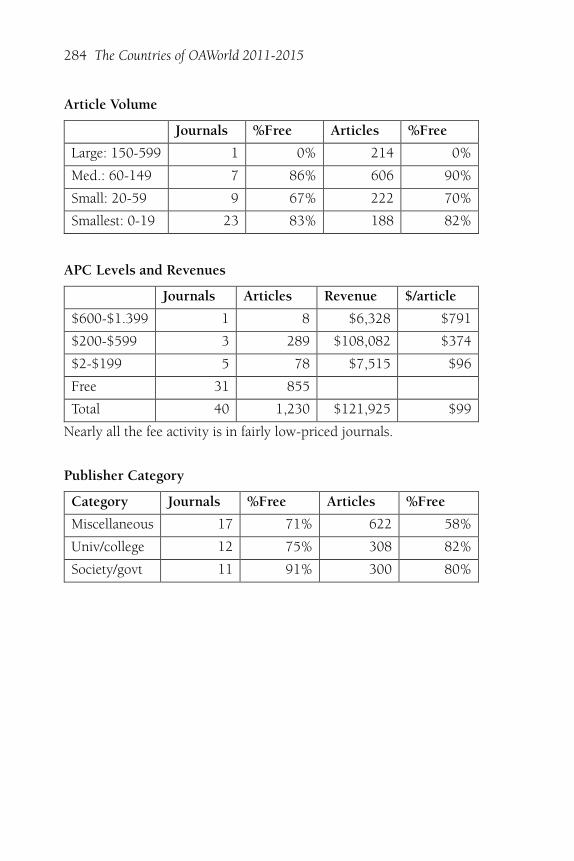
284 The Countries of OAWorld 2011-2015
Article Volume
Journals %Free Articles %Free
Large: 150-599 1 0% 214 0%
Med.: 60-149 7 86% 606 90%
Small: 20-59 9 67% 222 70%
Smallest: 0-19 23 83% 188 82%
APC Levels and Revenues
Journals Articles Revenue $/article
$600-$1.399 1 8 $6,328 $791
$200-$599 3 289 $108,082 $374
$2-$199 5 78 $7,515 $96
Free 31 855
Total 40 1,230 $121,925 $99
Nearly all the fee activity is in fairly low-priced journals.
Publisher Category
Category Journals %Free Articles %Free
Miscellaneous 17 71% 622 58%
Univ/college 12 75% 308 82%
Society/govt 11 91% 300 80%

Greece 285
Starting Date
Growth and Shrinkage
Change 2014-15 Count Percent Cum%
Grew 50%+ 2 5.0%
Grew 10-49% 12 30.0% 35.0%
Even, ±9.99% 9 22.5% 57.5%
Shrank 10-49% 9 22.5% 80.0%
Shrank 50%+ 7 17.5% 97.5%
More shrinkage than growth.
Gray OA and DOAJ16
GrayOA %Gray DOAJ16
Journals/Free 11 35% 20
Journals/Pay 4 44% 5
Articles/Free 331 39% 524
Articles/Pay 294 78% 81
Extremely high rate of pay article delisting from high journal rate.
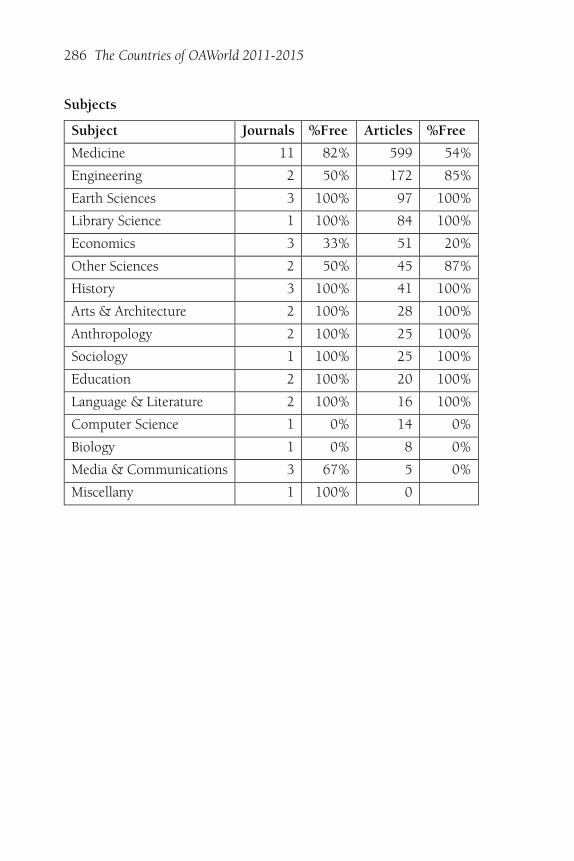
286 The Countries of OAWorld 2011-2015
Subjects
Subject Journals %Free Articles %Free
Medicine 11 82% 599 54%
Engineering 2 50% 172 85%
Earth Sciences 3 100% 97 100%
Library Science 1 100% 84 100%
Economics 3 33% 51 20%
Other Sciences 2 50% 45 87%
History 3 100% 41 100%
Arts & Architecture 2 100% 28 100%
Anthropology 2 100% 25 100%
Sociology 1 100% 25 100%
Education 2 100% 20 100%
Language & Literature 2 100% 16 100%
Computer Science 1 0% 14 0%
Biology 1 0% 8 0%
Media & Communications 3 67% 5 0%
Miscellany 1 100% 0

287
Ireland
Ireland has 14 OAWorld open access journals. While there is one APC-charging journal ($150), it published no articles in 2014 or 2015.
Journals and Articles
2015 2014 2013 2012 2011
Journals 13 12 14 12 9
%Free 100% 100% 93% 92% 100%
Articles 256 218 192 213 164
%Free 100% 100% 98% 98% 100%

288 The Countries of OAWorld 2011-2015
Article Volume
Journals %Free Articles %Free
Med.: 60-149 1 100% 87 100%
Small: 20-59 1 100% 45 100%
Smallest: 0-19 12 92% 124 100%
Publisher Category
Category Journals %Free Articles %Free
Univ/college 10 100% 150 100%
Society/govt 2 100% 93 100%
Miscellaneous 2 50% 13 100%
Growth and Shrinkage
Change 2014-15 Count Percent Cum%
Grew 50%+ 3 21.4%
Grew 10-49% 3 21.4% 42.9%
Even, ±9.99% 4 28.6% 71.4%
Shrank 10-49% 2 14.3% 85.7%
Shrank 50%+ 0 0.0% 85.7%
Much more growth than shrinkage.
Gray OA and DOAJ16
GrayOA %Gray DOAJ16
Journals/Free 3 23% 10
Journals/Pay 0 0% 1
Articles/Free 116 45% 140
Articles/Pay 0 0
Fairly low journal delisting percentage, but high article loss.

Ireland 289
Subjects
Subject Journals %Free Articles %Free
Medicine 1 100% 87 100%
Political Science 1 100% 45 100%
Media & Communications 2 100% 32 100%
Education 2 100% 30 100%
Language & Literature 2 100% 17 100%
Religion 1 100% 14 100%
History 1 100% 13 100%
Philosophy 1 100% 7 100%
Arts & Architecture 1 100% 6 100%
Ecology 1 100% 5 100%
Sociology 1 0% 0

290
Italy
Italy has 303 OAWorld open access journals. The 2015 average cost perarticle in APC-charging journals was $874; overall average $122.
Journals and Articles
2015 2014 2013 2012 2011
Journals 274 290 282 270 244
%Free 86% 87% 87% 87% 86%
Articles 10,885 15,395 13,026 13,430 10,314
%Free 86% 90% 89% 88% 78%
The drop from 2014 to 2015 is mostly due to one conference-reportsmegajournal going from 7,074 to 2,981 articles.

Italy 291
Article Volume
Journals %Free Articles %Free
Largest: 600+ 1 100% 2,981 100%
Large: 150-599 3 67% 986 58%
Med.: 60-149 22 77% 1,911 80%
Small: 20-59 109 85% 3,613 84%
Smallest: 0-19 168 90% 1,394 90%
APC Levels and Revenues
Journals Articles Revenue $/article
$1,400+ 2 496 $879,200 $1,773
$600-$1.399 4 150 $120,720 $805
$200-$599 26 687 $314,837 $458
$2-$199 7 188 $14,868 $79
Free 264 9,364
Total 303 10,885 $1,329,625 $122
Publisher Category
Category Journals %Free Articles %Free
Miscellaneous 98 92% 6,558 89%
Univ/college 125 98% 2,606 99%
Open Access 51 55% 939 35%
Society/govt 21 86% 598 89%
Traditional 8 63% 184 60%

292 The Countries of OAWorld 2011-2015
Starting Date
Growth and Shrinkage
Change 2014-15 Count Percent Cum%
Grew 50%+ 37 12.2%
Grew 10-49% 57 18.8% 31.0%
Even, ±9.99% 43 14.2% 45.2%
Shrank 10-49% 92 30.4% 75.6%
Shrank 50%+ 61 20.1% 95.7%
Much more shrinkage than growth.
Gray OA and DOAJ16
GrayOA %Gray DOAJ16
Journals/Free 41 16% 223
Journals/Pay 5 13% 34
Articles/Free 3,748 40% 5,616
Articles/Pay 134 9% 1,387
Low journal delisting percentages; that megajournal accounts for articlepercentage (conf-reports journals not APCs; paid by conference).
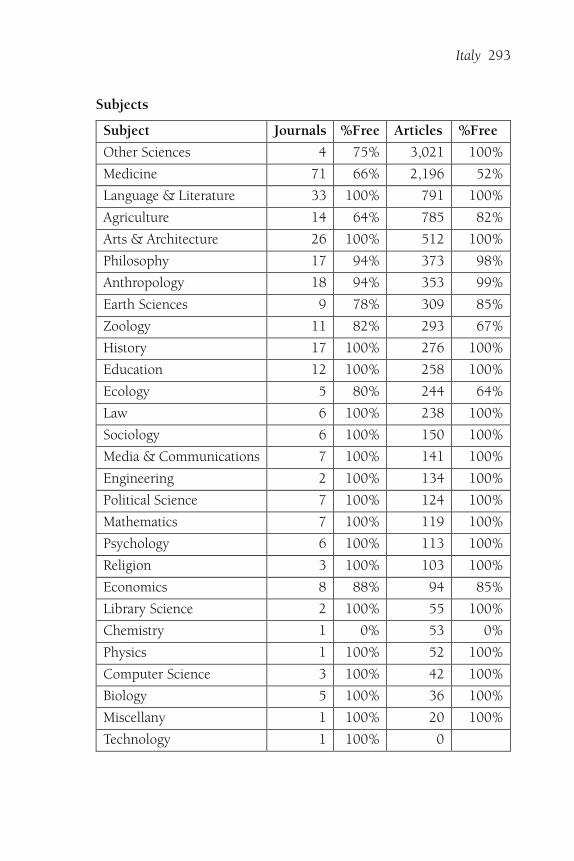
Italy 293
Subjects
Subject Journals %Free Articles %Free
Other Sciences 4 75% 3,021 100%
Medicine 71 66% 2,196 52%
Language & Literature 33 100% 791 100%
Agriculture 14 64% 785 82%
Arts & Architecture 26 100% 512 100%
Philosophy 17 94% 373 98%
Anthropology 18 94% 353 99%
Earth Sciences 9 78% 309 85%
Zoology 11 82% 293 67%
History 17 100% 276 100%
Education 12 100% 258 100%
Ecology 5 80% 244 64%
Law 6 100% 238 100%
Sociology 6 100% 150 100%
Media & Communications 7 100% 141 100%
Engineering 2 100% 134 100%
Political Science 7 100% 124 100%
Mathematics 7 100% 119 100%
Psychology 6 100% 113 100%
Religion 3 100% 103 100%
Economics 8 88% 94 85%
Library Science 2 100% 55 100%
Chemistry 1 0% 53 0%
Physics 1 100% 52 100%
Computer Science 3 100% 42 100%
Biology 5 100% 36 100%
Miscellany 1 100% 20 100%
Technology 1 100% 0
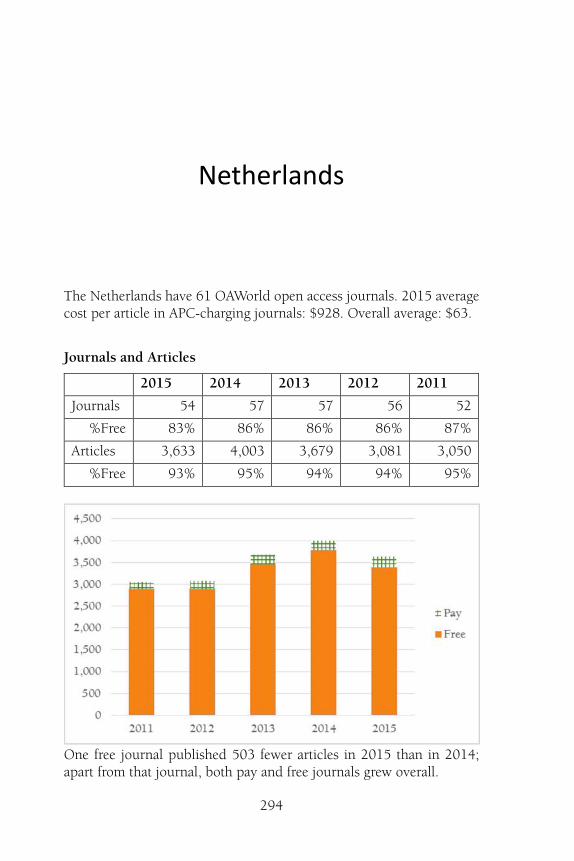
294
Netherlands
The Netherlands have 61 OAWorld open access journals. 2015 averagecost per article in APC-charging journals: $928. Overall average: $63.
Journals and Articles
2015 2014 2013 2012 2011
Journals 54 57 57 56 52
%Free 83% 86% 86% 86% 87%
Articles 3,633 4,003 3,679 3,081 3,050
%Free 93% 95% 94% 94% 95%
One free journal published 503 fewer articles in 2015 than in 2014;apart from that journal, both pay and free journals grew overall.

Netherlands 295
Article Volume
Journals %Free Articles %Free
Largest: 600+ 2 100% 2,316 100%
Med.: 60-149 5 100% 404 100%
Small: 20-59 21 71% 624 66%
Smallest: 0-19 33 91% 289 88%
Another case where pay journals are all small or very small.
APC Levels and Revenues
Journals Articles Revenue $/article
$1,400+ 2 55 $104,814 $1,906
$600-$1.399 4 103 $102,115 $991
$200-$599 2 33 $11,900 $361
$2-$199 1 55 $9,350 $170
Free 52 3,387
Total 61 3,633 $228,179 $63
Publisher Category
Category Journals %Free Articles %Free
Miscellaneous 16 94% 1,350 99%
Society/govt 2 100% 1,302 100%
Univ/college 36 89% 693 81%
Traditional 6 33% 272 62%
Open Access 1 100% 16 100%

296 The Countries of OAWorld 2011-2015
Starting Date
Growth and Shrinkage
Change 2014-15 Count Percent Cum%
Grew 50%+ 9 14.8%
Grew 10-49% 15 24.6% 39.3%
Even, ±9.99% 10 16.4% 55.7%
Shrank 10-49% 12 19.7% 75.4%
Shrank 50%+ 11 18.0% 93.4%
Nearly equal growth and shrinkage.
Gray OA and DOAJ16
GrayOA %Gray DOAJ16
Journals/Free 21 40% 31
Journals/Pay 2 22% 7
Articles/Free 1,534 45% 1,853
Articles/Pay 72 29% 174
Very high delisting rates for free journals.

Netherlands 297
Subjects
Subject Journals %Free Articles %Free
Medicine 5 60% 2,428 97%
History 5 100% 269 100%
Miscellany 3 100% 174 100%
Language & Literature 10 100% 107 100%
Political Science 3 33% 95 31%
Sociology 3 100% 75 100%
Philosophy 4 75% 74 58%
Engineering 2 50% 62 58%
Agriculture 2 100% 51 100%
Media & Communications 2 100% 45 100%
Arts & Architecture 4 75% 43 67%
Library Science 2 100% 41 100%
Law 3 100% 35 100%
Technology 2 100% 30 100%
Economics 1 100% 25 100%
Biology 2 50% 23 57%
Religion 1 0% 23 0%
Zoology 2 100% 19 100%
Mathematics 1 100% 10 100%
Earth Sciences 1 100% 4 100%
Anthropology 1 100% 0
Computer Science 1 100% 0
Other Sciences 1 100% 0

298
Norway
Norway has 50 OAWorld open access journals. The 2015 average costper article in APC-charging journals was $1,372; overall average, $46.
Journals and Articles
2015 2014 2013 2012 2011
Journals 48 49 43 39 35
%Free 94% 96% 95% 95% 94%
Articles 807 924 761 703 569
%Free 97% 98% 97% 98% 96%
Pay journals up, but free journals down.

Norway 299
Article Volume
Journals %Free Articles %Free
Med.: 60-149 1 100% 98 100%
Small: 20-59 16 100% 419 100%
Smallest: 0-19 33 91% 290 91%
APC-charging journals are all very small.
APC Levels and Revenues
Journals Articles Revenue $/article
$1,400+ 2 14 $23,816 $1,701
$600-$1.399 1 13 $13,234 $1,018
Free 47 780
Total 50 807 $37,050 $46
Publisher Category
Category Journals %Free Articles %Free
Univ/college 29 100% 473 100%
Miscellaneous 17 82% 221 88%
Society/govt 3 100% 78 100%
Open Access 1 100% 35 100%

300 The Countries of OAWorld 2011-2015
Starting Date
Growth and Shrinkage
Change 2014-15 Count Percent Cum%
Grew 50%+ 9 18.0%
Grew 10-49% 8 16.0% 34.0%
Even, ±9.99% 10 20.0% 54.0%
Shrank 10-49% 11 22.0% 76.0%
Shrank 50%+ 11 22.0% 98.0%
More shrinkage than growth.
Gray OA and DOAJ16
GrayOA %Gray DOAJ16
Journals/Free 5 11% 42
Journals/Pay 0 0% 3
Articles/Free 133 17% 647
Articles/Pay 0 0% 27
Very low rate of delisting for free journals and none for pay.

Norway 301
Subjects
Subject Journals %Free Articles %Free
Education 10 90% 209 97%
Language & Literature 9 100% 154 100%
Medicine 6 100% 124 100%
Arts & Architecture 3 100% 71 100%
Law 5 80% 59 86%
Sociology 4 100% 45 100%
Zoology 3 100% 30 100%
Miscellany 1 100% 21 100%
Computer Science 1 100% 20 100%
Religion 2 100% 17 100%
Media & Communications 1 100% 16 100%
Philosophy 1 0% 13 0%
Other Sciences 1 100% 12 100%
Biology 1 100% 8 100%
Psychology 1 100% 7 100%
Library Science 1 100% 1 100%
Five of the top seven subjects are humanities and social scienes.

302
Portugal
Portugal has 80 OAWorld open access journals. In 2015, average costper article in APC-charging journals was $485; overall average, $88.
Journals and Articles
2015 2014 2013 2012 2011
Journals 72 75 74 68 66
%Free 89% 89% 89% 93% 92%
Articles 1,771 1,756 1,581 1,407 1,453
%Free 82% 87% 84% 83% 82%

Portugal 303
Article Volume
Journals %Free Articles %Free
Med.: 60-149 2 50% 169 57%
Small: 20-59 38 87% 1,255 82%
Smallest: 0-19 40 95% 347 93%
APC Levels and Revenues
Journals Articles Revenue $/article
$600-$1.399 3 150 $130,650 $871
$200-$599 2 24 $6,810 $284
$2-$199 3 148 $18,846 $127
Free 72 1,449
Total 80 1,771 $156,306 $88
Publisher Category
Category Journals %Free Articles %Free
Univ/college 49 98% 1,044 96%
Miscellaneous 18 89% 338 80%
Society/govt 10 80% 239 75%
Open Access 3 0% 150 0%

304 The Countries of OAWorld 2011-2015
Starting Date
Growth and Shrinkage
Change 2014-15 Count Percent Cum%
Grew 50%+ 12 15.0%
Grew 10-49% 18 22.5% 37.5%
Even, ±9.99% 15 18.8% 56.3%
Shrank 10-49% 22 27.5% 83.8%
Shrank 50%+ 8 10.0% 93.8%
Equal growth and shrinkage, but more fast growth.
Gray OA and DOAJ16
GrayOA %Gray DOAJ16
Journals/Free 20 28% 52
Journals/Pay 1 13% 7
Articles/Free 238 16% 1,211
Articles/Pay 5 2% 317
Low article percentage delisted, very low pay delisting.

Portugal 305
Subjects
Subject Journals %Free Articles %Free
Medicine 10 90% 366 86%
Sociology 7 86% 220 67%
Arts & Architecture 10 90% 199 78%
Media & Communications 6 83% 182 82%
Language & Literature 10 100% 158 100%
History 5 100% 107 100%
Miscellany 3 100% 99 100%
Education 4 100% 72 100%
Political Science 2 50% 65 31%
Agriculture 2 50% 55 0%
Earth Sciences 4 100% 45 100%
Computer Science 3 67% 36 47%
Economics 1 100% 27 100%
Technology 1 100% 27 100%
Chemistry 1 100% 21 100%
Philosophy 2 100% 20 100%
Mathematics 1 100% 16 100%
Library Science 1 100% 14 100%
Biology 2 50% 12 58%
Psychology 1 100% 12 100%
Religion 1 100% 11 100%
Ecology 1 100% 7 100%
Anthropology 2 100% 0
Eight of the top nine subjects are humanities & social sciences.

306
Spain
Spain has 560 OAWorld open access journals. Average 2015 cost perarticle in APC-charging journals: $187. Overall average: $9.
Journals and Articles
2015 2014 2013 2012 2011
Journals 516 538 523 513 464
%Free 97% 97% 97% 97% 97%
Articles 13,158 12,752 12,448 11,885 11,714
%Free 95% 94% 92% 93% 93%
Pay journals peaked in 2013; free journals still growing.

Spain 307
Article Volume
Journals %Free Articles %Free
Large: 150-599 3 100% 715 100%
Med.: 60-149 27 85% 2,235 81%
Small: 20-59 233 97% 7,259 97%
Smallest: 0-19 297 99% 2,949 99%
No very large journals, and most pay journals are medium-sized.
APC Levels and Revenues
Journals Articles Revenue $/article
$600-$1.399 1 14 $12,628 $902
$200-$599 7 337 $86,805 $258
$2-$199 6 305 $22,922 $75
Free 546 12,502
Total 560 13,158 $122,355 $9
Publisher Category
Category Journals %Free Articles %Free
Univ/college 338 100% 7,216 98%
Miscellaneous 111 93% 3,058 88%
Society/govt 90 97% 2,156 97%
Open Access 21 90% 728 83%
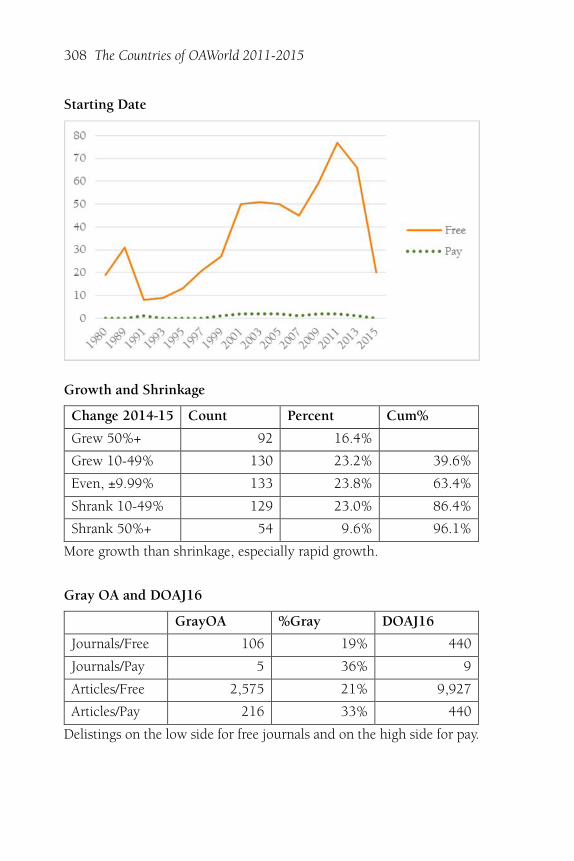
308 The Countries of OAWorld 2011-2015
Starting Date
Growth and Shrinkage
Change 2014-15 Count Percent Cum%
Grew 50%+ 92 16.4%
Grew 10-49% 130 23.2% 39.6%
Even, ±9.99% 133 23.8% 63.4%
Shrank 10-49% 129 23.0% 86.4%
Shrank 50%+ 54 9.6% 96.1%
More growth than shrinkage, especially rapid growth.
Gray OA and DOAJ16
GrayOA %Gray DOAJ16
Journals/Free 106 19% 440
Journals/Pay 5 36% 9
Articles/Free 2,575 21% 9,927
Articles/Pay 216 33% 440
Delistings on the low side for free journals and on the high side for pay.

Spain 309
Subjects
Subject Journals %Free Articles %Free
Medicine 48 92% 1,590 88%
Education 61 100% 1,439 100%
Language & Literature 73 100% 1,364 100%
Sociology 34 97% 957 97%
Anthropology 38 97% 829 97%
History 39 100% 824 100%
Political Science 17 100% 627 100%
Media & Communications 26 96% 601 96%
Earth Sciences 23 100% 592 100%
Psychology 21 90% 526 72%
Arts & Architecture 32 100% 488 100%
Economics 28 100% 432 100%
Law 19 100% 428 100%
Agriculture 10 100% 377 100%
Zoology 9 89% 316 74%
Philosophy 12 100% 295 100%
Ecology 11 100% 223 100%
Computer Science 12 100% 216 100%
Library Science 12 100% 186 100%
Miscellany 9 89% 168 82%
Other Sciences 5 100% 146 100%
Engineering 2 50% 128 27%
Technology 5 80% 122 85%
Religion 3 100% 91 100%
Mathematics 5 100% 72 100%
Biology 4 75% 47 70%
Physics 1 100% 44 100%
Chemistry 1 100% 30 100%
HSS strong again: seven of top eight, 11 of top 13.

310
Sweden
Sweden has 69 OAWorld open access journals. Average 2015 cost perarticle in APC-charging journals: $1,430. Overall average: $888.
Journals and Articles
2015 2014 2013 2012 2011
Journals 67 66 65 61 53
%Free 52% 52% 54% 56% 57%
Articles 2,112 1,862 1,614 1,537 1,259
%Free 38% 49% 49% 54% 57%

Sweden 311
Article Volume
Journals %Free Articles %Free
Large: 150-599 3 33% 701 29%
Med.: 60-149 5 0% 328 0%
Small: 20-59 24 54% 775 50%
Smallest: 0-19 37 62% 308 68%
APC Levels and Revenues
Journals Articles Revenue $/article
$1,400+ 16 831 $1,416,539 $1,705
$600-$1.399 13 373 $403,764 $1,082
$200-$599 3 107 $54,683 $511
Free 37 801
Total 69 2,112 $1,874,986 $888
Unusual to have more expensive journals dominate.
Publisher Category
Category Journals %Free Articles %Free
Open Access 28 7% 899 4%
Miscellaneous 19 79% 559 76%
Society/govt 5 80% 400 23%
Univ/college 17 94% 254 99%

312 The Countries of OAWorld 2011-2015
Starting Date
Growth and Shrinkage
Change 2014-15 Count Percent Cum%
Grew 50%+ 23 33.3%
Grew 10-49% 12 17.4% 50.7%
Even, ±9.99% 15 21.7% 72.5%
Shrank 10-49% 13 18.8% 91.3%
Shrank 50%+ 3 4.3% 95.7%
Twice as much growth as shrinkage; fast growth exceeds all shrinkage.
Gray OA and DOAJ16
GrayOA %Gray DOAJ16
Journals/Free 10 27% 27
Journals/Pay 1 3% 31
Articles/Free 106 13% 695
Articles/Pay 42 3% 1,269
Low free article delisting rate and almost no pay delisting.

Sweden 313
Subjects
Subject Journals %Free Articles %Free
Medicine 16 19% 1,065 23%
Physics 3 0% 141 0%
Language & Literature 7 100% 129 100%
Education 6 83% 90 93%
Agriculture 2 50% 83 8%
Political Science 6 83% 80 91%
Sociology 6 67% 73 78%
Technology 2 0% 65 0%
Biology 2 0% 54 0%
Other Sciences 1 0% 43 0%
Mathematics 1 100% 42 100%
Arts & Architecture 1 100% 39 100%
Zoology 1 0% 37 0%
Religion 1 100% 35 100%
Media & Communications 2 100% 32 100%
Economics 2 50% 24 50%
Miscellany 2 50% 24 13%
Library Science 1 100% 13 100%
Law 1 100% 11 100%
History 1 100% 10 100%
Chemistry 1 0% 7 0%
Psychology 1 0% 7 0%
Anthropology 2 100% 5 100%
Earth Sciences 1 0% 3 0%

314
Switzerland
Switzerland has 43 OAWorld open access journals. The average 2015cost per article in APC-charging journals was $1,635; overall, $1,012.
Journals and Articles
2015 2014 2013 2012 2011
Journals 41 43 41 35 32
%Free 59% 58% 59% 57% 63%
Articles 2,282 2,796 2,237 2,536 1,795
%Free 38% 38% 48% 44% 56%
Free journals peaked in 2012, pay journals in 2014.

Switzerland 315
Article Volume
Journals %Free Articles %Free
Large: 150-599 3 33% 895 23%
Med.: 60-149 10 40% 893 43%
Small: 20-59 7 43% 298 44%
Smallest: 0-19 23 74% 196 78%
APC Levels and Revenues
Journals Articles Revenue $/article
$1,400+ 5 805 $2,001,859 $2,487
$600-$1.399 9 385 $273,467 $710
$200-$599 1 11 $3,300 $300
$2-$199 3 211 $30,193 $143
Free 25 870
Total 43 2,282 $2,308,819 $1,012
Publisher Category
Category Journals %Free Articles %Free
Traditional 12 0% 1,037 0%
Miscellaneous 11 64% 458 53%
Society/govt 7 71% 374 57%
Open Access 2 100% 268 100%
Univ/college 11 100% 145 100%
Really one traditional publisher with a dozen APC OA journals.

316 The Countries of OAWorld 2011-2015
Starting Date
Growth and Shrinkage
Change 2014-15 Count Percent Cum%
Grew 50%+ 3 7.0%
Grew 10-49% 7 16.3% 23.3%
Even, ±9.99% 11 25.6% 48.8%
Shrank 10-49% 17 39.5% 88.4%
Shrank 50%+ 5 11.6% 100.0%
More than twice as much shrinkage as growth.
Gray OA and DOAJ16
GrayOA %Gray DOAJ16
Journals/Free 10 40% 15
Journals/Pay 2 11% 16
Articles/Free 268 31% 602
Articles/Pay 161 11% 1,251
High delisting rate for free journals, low for pay.

Switzerland 317
Subjects
Subject Journals %Free Articles %Free
Medicine 19 32% 1,215 46%
Biology 2 0% 586 0%
Economics 1 0% 154 0%
Earth Sciences 1 100% 69 100%
Language & Literature 2 100% 55 100%
Philosophy 1 100% 41 100%
Political Science 2 100% 25 100%
Computer Science 2 100% 23 100%
Sociology 1 100% 19 100%
History 1 100% 15 100%
Law 2 100% 15 100%
Education 2 100% 14 100%
Library Science 2 100% 13 100%
Religion 2 100% 12 100%
Agriculture 1 0% 11 0%
Miscellany 1 100% 8 100%
Arts & Architecture 1 0% 7 0%
Biomed accounts for three out of four articles.

318
United Kingdom
The UK has 300 OAWorld open access journals. In 2015, average costper article in APC-charging journals was $1,321; overall average $607.
Journals and Articles
2015 2014 2013 2012 2011
Journals 280 278 252 220 189
%Free 57% 59% 60% 63% 69%
Articles 23,098 19,615 16,385 13,992 11,229
%Free 54% 56% 50% 59% 67%
Both free and pay journals growing fairly rapidly.
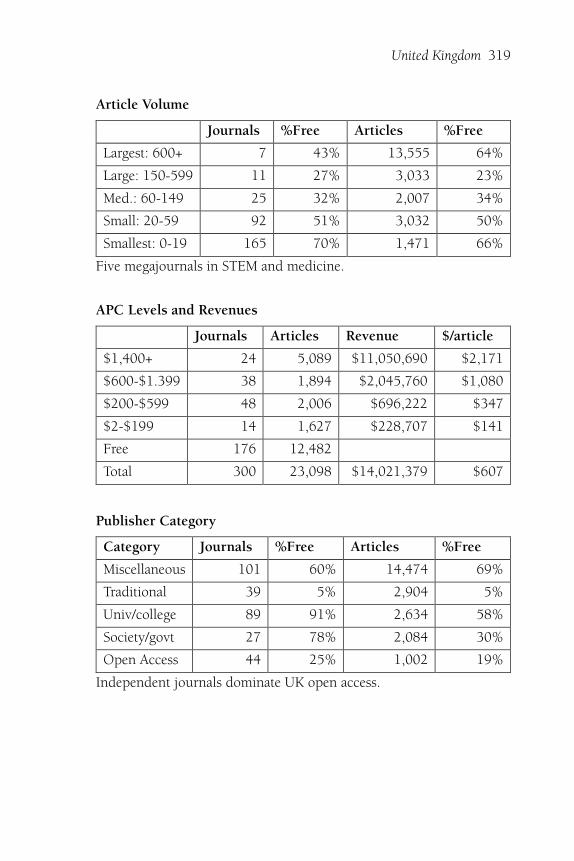
United Kingdom 319
Article Volume
Journals %Free Articles %Free
Largest: 600+ 7 43% 13,555 64%
Large: 150-599 11 27% 3,033 23%
Med.: 60-149 25 32% 2,007 34%
Small: 20-59 92 51% 3,032 50%
Smallest: 0-19 165 70% 1,471 66%
Five megajournals in STEM and medicine.
APC Levels and Revenues
Journals Articles Revenue $/article
$1,400+ 24 5,089 $11,050,690 $2,171
$600-$1.399 38 1,894 $2,045,760 $1,080
$200-$599 48 2,006 $696,222 $347
$2-$199 14 1,627 $228,707 $141
Free 176 12,482
Total 300 23,098 $14,021,379 $607
Publisher Category
Category Journals %Free Articles %Free
Miscellaneous 101 60% 14,474 69%
Traditional 39 5% 2,904 5%
Univ/college 89 91% 2,634 58%
Society/govt 27 78% 2,084 30%
Open Access 44 25% 1,002 19%
Independent journals dominate UK open access.

320 The Countries of OAWorld 2011-2015
Starting Date
Growth and Shrinkage
Change 2014-15 Count Percent Cum%
Grew 50%+ 58 19.3%
Grew 10-49% 44 14.7% 34.0%
Even, ±9.99% 54 18.0% 52.0%
Shrank 10-49% 74 24.7% 76.7%
Shrank 50%+ 48 16.0% 92.7%
More shrinkage than growth.
Gray OA and DOAJ16
GrayOA %Gray DOAJ16
Journals/Free 57 32% 119
Journals/Pay 22 18% 102
Articles/Free 695 6% 11,787
Articles/Pay 554 5% 10,062
Most delisted journals were small; very low article percentages.

United Kingdom 321
Subjects
Subject Journals %Free Articles %Free
Physics 6 17% 6,693 84%
Engineering 7 29% 4,253 54%
Medicine 66 44% 3,742 19%
Chemistry 4 0% 1,243 0%
Biology 9 22% 1,174 63%
Ecology 8 63% 771 49%
Other Sciences 7 29% 715 36%
Agriculture 3 0% 594 0%
Education 23 91% 489 76%
Economics 17 18% 431 15%
Sociology 19 68% 429 80%
Technology 4 0% 303 0%
History 10 100% 287 100%
Media & Communications 12 100% 267 100%
Language & Literature 15 100% 233 100%
Anthropology 15 67% 222 79%
Library Science 8 75% 214 86%
Arts & Architecture 12 83% 185 72%
Mathematics 6 17% 177 4%
Computer Science 6 33% 160 63%
Psychology 8 50% 127 26%
Political Science 8 63% 94 35%
Law 8 100% 83 100%
Religion 4 75% 57 75%
Philosophy 8 100% 48 100%
Zoology 4 75% 38 71%
Miscellany 2 50% 35 60%
Earth Sciences 1 0% 34 0%
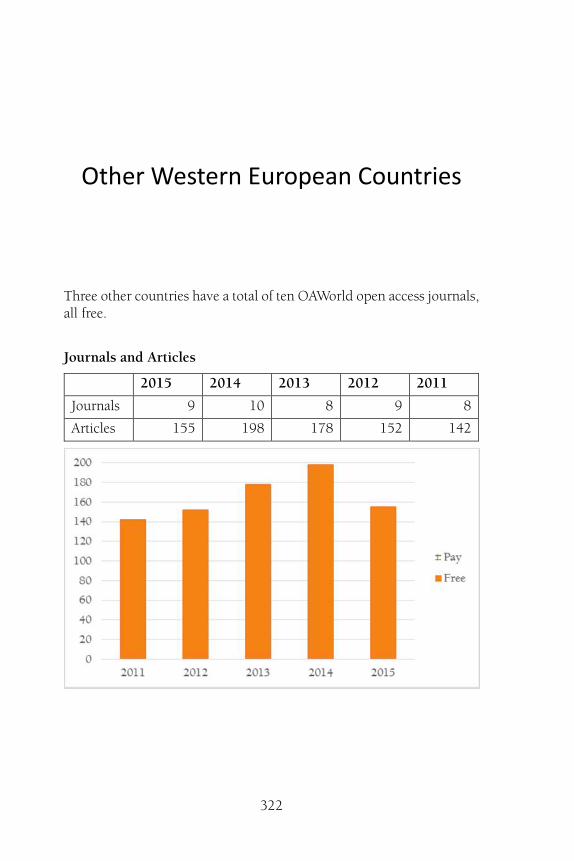
322
Other Western European Countries
Three other countries have a total of ten OAWorld open access journals,all free.
Journals and Articles
2015 2014 2013 2012 2011
Journals 9 10 8 9 8
Articles 155 198 178 152 142

Other Western European Countries 323
Article Volume
Journals Articles
Small: 20-59 2 76
Smallest: 0-19 8 79
Publisher Category
Category Journals Articles
Univ/college 7 136
Miscellaneous 2 14
Society/govt 1 5
Growth and Shrinkage
Change 2014-15 Count Percent Cum%
Grew 50%+ 1 10.0%
Grew 10-49% 1 10.0% 20.0%
Even, ±9.99% 2 20.0% 40.0%
Shrank 10-49% 4 40.0% 80.0%
Shrank 50%+ 2 20.0% 100.0%
Mostly shrinking
Gray OA and DOAJ16
GrayOA %Gray DOAJ16
Journals/Free 4 40% 6
Articles/Free 59 38% 96
High delisting rate.
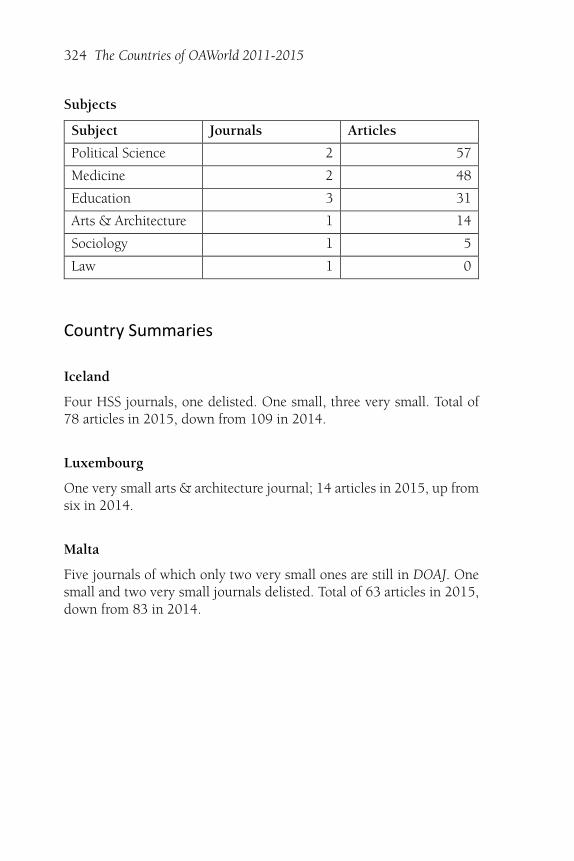
324 The Countries of OAWorld 2011-2015
Subjects
Subject Journals Articles
Political Science 2 57
Medicine 2 48
Education 3 31
Arts & Architecture 1 14
Sociology 1 5
Law 1 0
Country Summaries
Iceland
Four HSS journals, one delisted. One small, three very small. Total of78 articles in 2015, down from 109 in 2014.
Luxembourg
One very small arts & architecture journal; 14 articles in 2015, up fromsix in 2014.
Malta
Five journals of which only two very small ones are still in DOAJ. Onesmall and two very small journals delisted. Total of 63 articles in 2015,down from 83 in 2014.

325
Country Index
Africa, 5Albania, 152Algeria, 20Argentina, 159Armenia, 153Asia, 23Australia, 239Austria, 259Azerbaijan, 153Bahamas, 203Bahrain, 233Bangladesh, 27Barbados, 203Belarus, 153Belgium, 263Bhutan, 83Bolivia, Plurinational State of,
204Bosnia and Herzegovina, 89Brazil, 163British Virgin Islands, 204Brunei Darussalam, 83Bulgaria, 92Burundi, 20Cambodia, 83Canada, 243Chile, 167
China, 31Colombia, 171Costa Rica, 175Croatia, 96Cuba, 179Cyprus, 153Czech Republic, 100Democratic Republic of the
Congo, 21Denmark, 267Dominican Republic, 204Eastern Europe, 85Ecuador, 183Egypt, 210Estonia, 104Ethiopia, 21Finland, 271France, 275Georgia, 153Germany, 279Ghana, 21Greece, 283Guatemala, 204Hong Kong, 35Hungary, 107Iceland, 324India, 39

326 The Countries of OAWorld 2011-2015
Indonesia, 43Iran, Islamic Republic of, 213Iraq, 233Ireland, 287Israel, 217Italy, 290Jamaica, 204Japan, 47Jordan, 220Kazakhstan, 153Kenya, 21Korea, Democratic People's
Republic of, 84Kosova, 153Kuwait, 233Kyrgyzstan, 84Latin America, 155Latvia, 153Libya, 21Lithuania, 111Luxembourg, 324Macedonia, the Former
Yugoslav Republic of, 115Madagascar, 21Malaysia, 51Malta, 324Martinique, 204Mauritius, 21Mexico, 185Middle East, 206Moldova, 118Montenegro, 154Morocco, 21Nepal, 55Netherlands, 294New Zealand, 247Nicaragua, 204Nigeria, 9Norway, 298Oman, 233
Pacific/English, 235Pakistan, 58Palestine, State of, 234Paraguay, 204Peru, 189Philippines, 62Poland, 121Portugal, 302Puerto Rico, 205Qatar, 234Romania, 125Russian Federation, 129Rwanda, 21Saudi Arabia, 234Serbia, 133Singapore, 65Slovakia, 137Slovenia, 141South Africa, 13South Korea, 69Spain, 306Sri Lanka, 73Sweden, 310Switzerland, 314Taiwan, Province of China, 76Tanzania, United Republic of,
22Thailand, 80Tunisia, 22Turkey, 223Uganda, 22Ukraine, 145United Arab Emirates, 227United Kingdom, 318United States, 251Uruguay, 193Venezuela, Bolivarian Republic
of, 196Viet Nam, 84Western Europe, 255

Country Index 327
Yemen, 234 Zambia, 22

![INDEX [meanwell.com]meanwell.com/Upload/PDF/meanwell_LED.pdf · APC-8, APC-12, APC-16, APC-25, APC-35 3 APV-8E, APV-12E, APV-16E 4 APC-8E, APC-12E, APC-16E LP ... Over voltage protection](https://static.fdocuments.us/doc/165x107/5b619e107f8b9a40488c919f/index-apc-8-apc-12-apc-16-apc-25-apc-35-3-apv-8e-apv-12e-apv-16e-4.jpg)


