
T al bGlo Insight - 2017 Outlook - RBC Wealth Management · PDF fileal bGlo Insight T Our...
27
2017 Outlook RBC WEALTH MANAGEMENT Global Insight SPECIAL REPORT Our appraisal of investment prospects for 2017: constructive, but selective
-
Upload
truongminh -
Category
Documents
-
view
218 -
download
3
Transcript of T al bGlo Insight - 2017 Outlook - RBC Wealth Management · PDF fileal bGlo Insight T Our...

2 0 1 7 O u t l o o k
R B C W E A L T H M A N A G E M E N T
Global InsightSPECIAL REPORT
Our appraisal of investment prospects for 2017: constructive, but selective
2 Global Insight | 2017 Outlook
A look aheadEver since the Great Recession ended in 2009, our view on the outlook for financial markets has been informed by several underlying assumptions:
• Major central banks would remain ultra-accommodative until the “mine fields” laid down in the financial crisis had been successfully negotiated and until the major economies were on a sustained growth footing;
• The outlook for the U.S. economy was of the greatest importance because of its “tractor” effect on the rest of the world through the medium of trade; and
• Until a renewed global economic downturn, in particular a U.S. recession, was on the horizon, equities should be given the benefit of the doubt.
We still believe these factors will shape the investment landscape. However, their interpretation has necessarily become more nuanced in recent months.
June’s Brexit vote has not only raised questions about prospects for the British economy, it has also put the future existence of the EU as constituted into doubt. Those doubts are likely to grow over the next several quarters fueled by an Italian referendum in December and scheduled general elections in France and Germany. All of this points to an extended period of business and investment uncertainty.
The policy unanimity of central banks is also breaking down. The Fed has signaled an intention to raise rates further. By contrast, none of the central banks of Canada, the U.K., the eurozone, and Japan have ruled out additional easing. This divergence is likely to play out most visibly in currency markets while introducing more volatility in stock and bond markets than investors have been used to.
And finally, the new administration in Washington appears set to pursue policies that will boost U.S. GDP growth for at least a couple of years. However, its approach to trade may mean that improved growth comes at the expense of others. We conclude the outlook for U.S. equities has improved while for other markets the picture has become more clouded.
Jim AllworthCo-chair Global Portfolio Advisory CommitteeVancouver, Canada
rAJAn BAnsiCo-chair Global Portfolio Advisory CommitteeToronto, Canada
Global Insight 2017 Outlook
3 Global Insight | 2017 Outlook
Table of contents4 Seven signposts for 2017
We like the setup for U.S. equities in the year ahead and have raised our outlook. And to help investors from being sidetracked by unexpected twists and turns, we believe some important signposts should be monitored.
10 Staying power?
While the bar has been raised for continued outperformance for Canadian equities in 2017, we look at why the heavyweight Financials and Energy sectors remain attractive, which should allow for another year of worthwhile equity returns.
14 Europe’s political dominoes
Simmering populist rancor across Europe, emboldened by Brexit, is threatening to upend the Continent’s political status quo as a run of important elections is coming up over the next year. Amid the volatility, we look at how investors can shield portfolios.
18 Stuck in the mud, but improving
A broad rebalancing of supply and demand has greatly improved the oil market; however, political drivers remain key, and a lingering inventory overhang may dampen significant oil price advances.
22 Various shades of accommodation
Developed economies are still not ready to stand on their own, so it looks like the era of easy credit will be with us for some time as global central banks will continue to pursue policies supportive of growth.
For important disclosures, see page 26.
All values in U.S. dollars and priced as of market close, November 14, 2016, unless otherwise stated.
Global Insight 2017 Outlook

4 Global Insight | 2017 Outlook
Seven signposts for 2017We believe the pieces are in place for U.S. equities to outperform in 2017 and have upgraded our outlook. Still, investors will have much to consider as they tread the investment path in the coming year. To stay pointed in the right direction, we have identified a series of markers for guidance.
The dramatic leadership change in Washington will help shape U.S. equity market returns and sector leadership in early 2017 and possibly at other points throughout the year.
Although President-elect Trump’s agenda could supersize GDP growth, at least in the first couple years, it isn’t the only factor that will impact stock prices. Bread-and-butter fundamentals should play pivotal roles as well. Even before the election, in our view, the economy seemed likely to grow and stocks were well positioned to rise in 2017. The first year of the Trump administration could amplify the moves, but with additional volatility.
We believe the market has the potential to deliver low double-digit total returns in 2017, an above-average rate. We have raised our rating on U.S. equities to Overweight from In-line, which translates into holding an allocation above the recommended strategic weight.
We favor the U.S. over developed markets in Europe and Asia. U.S. earnings growth seems more durable and economic prospects are better—more so if fiscal stimulus measures are passed.
We are focusing on seven signposts that could shape the market’s trajectory in 2017.
Janet EngelsNew York, United States
Kelly BogdanovSan Francisco, United States

5 Global Insight | 2017 Outlook
Seven signposts for 2017
RBC’s recessionary scorecard
Source - RBC Capital Markets, Haver Analytics, U.S. Census Bureau, ISM, BLS, Federal Reserve, NBER, S&P
Four of six indicators point to expanding GDP growth; two are neutral.
Start of recession
Yield curve
ISM mfg.
Inflation trends
Capacity utilization
Housing starts
Labor market
Dec '69 x x x x x xNov '73 x x x x x xJan '80 x x x x x xJul '81 x x x Jul '90 x x x x x xMar '01 x x x x ― xDec '07 x x x x x ―
Present ― ―
Key: x Recessionary territory
Expansionary territory
― Neutral
Before the election, our baseline expectation was that U.S. GDP would grow around 2% in 2017 without stimulus from Washington. That’s not ideal, but is enough to create opportunities for well-managed companies. If Washington delivers tax cuts and much-needed regulatory reform, which seems quite likely at this stage, GDP could grow faster.
# 2 – Fiscal therapyIt’s difficult to estimate the degree to which a broad package of tax cuts and infrastructure spending could stoke the economy. RBC Global Asset Management’s chief economist estimates they could boost GDP by 0.8% per year in 2017 and 2018, but he acknowledges it could be more. If this occurs, that would likely bring GDP growth close to 3% or more each year, much stronger than the 2% average since the financial crisis.
In our view, significant tax cuts on corporations and individuals have the greatest likelihood of passing because a number of Trump’s proposals are similar to legislation House Republicans have long advocated. But it may not be easy to push them past the 60-vote threshold needed in the Senate; instead, procedural maneuvers could be used that would require only a majority vote.
There are also obstacles for infrastructure spending. Trump seems to have a large package of $1 trillion over 10 years in mind. To lighten the burden on the deficit
# 1 – Recession needle nowhere near the redIt continues to be our view that recession indicators, not the occupant of the White House, are the best determinants of whether the equity market can keep advancing. While the actions of the president and Congress can strengthen or weaken economic trends, Washington’s leaders are dependent on business cycle fluctuations.
The market typically switches from bull to bear, and losses pile up, right before a recession occurs or during the early stages of one. That’s why we pay close attention to recession gauges.
Currently none of the six main indicators we monitor are signaling a contraction is on the horizon. When a recession is looming, most or all of them have historically been in recessionary territory.

6 Global Insight | 2017 Outlook
Seven signposts for 2017
Most commentators seem focused on the immediate. Our focus is almost entirely on long-term forces.
and avoid tax hikes to pay for it, reports indicate the package may be designed as a public/private partnership involving business tax credits for companies that fund projects, and it could include private equity and debt components. Regardless, Trump may have a lot of convincing to do in Congress to secure a significant infrastructure package. Many Republicans have historically resisted infrastructure spending, especially fiscal hawks who have gained power in recent years. A bipartisan coalition could be necessary.
# 3 – Expand the horizonInvestor sentiment about the equity market is still tentative and piles of cash remain on the sidelines. That’s typically a good indication the market advance has more legs. Bull market cycles usually don’t break until investors are “all in,” so to speak, and taxi (Uber) drivers are offering stock tips.
Most investors and commentators seem focused on what they think lies immediately ahead, to the exclusion of all else. By contrast, our focus is almost entirely on the long-term forces that shape the economy, corporate earnings, and asset prices. We see those forces aligned in a way that suggests the secular (long-term) bull market that began in 2009, and which was confirmed as the market broke out to a new high in 2013, has the potential for additional upside. Indeed, if this secular bull is anything like the previous two, it could have much further to run.
Each secular bull market has been characterized by unique catalysts. Innovations in the Technology and Health Care sectors, along with technology-driven advances and efficiencies in the Industrials, Financials, and Energy sectors should continue to shape the current secular bull cycle. The demographic bulge of the Millennial generation will likely play an important positive role, so far vastly underappreciated, in our view, as they form families and buy their first homes.
Supportive fundamental underpinnings should also extend the bull market in the near term. While the S&P 500 seems on pace to grow profits slightly in 2016, earnings could rise at least in the high single-digits in 2017.
Dow Jones Industrial Average: Historical sideways and secular bull cycles
Source - RBC Capital Markets, Haver Analytics, Standard & Poors; data through 11/16/16, monthly data except for last data point.
The market tends to move in prolonged cycles. We believe it has entered a new secular bull phase.
10
100
1000
10000
100000
1901
1911
1921
1931
1941
1951
1961
1971
1981
1991
2001
2011
Log scale

7 Global Insight | 2017 Outlook
Seven signposts for 2017
S&P 500 IndexNormalized valuation metrics as of November 2016
Notes: Historical data from Jan 1956 for 12-mo. trailing P/E, 12-mo. forward P/E, Equity risk premium, Shiller P/E, and Fed model. Historical data from Mar 1956 for market cap ÷ U.S. GDP. Historical data from Jan 1960 for RBC GAM fair value. Source - RBC Global Asset Management (RBC GAM), RBC Capital Markets, Haver Analytics
0.19
1.421.04 0.96
0.69 0.65
-0.45-0.94
-1.83
-3.0-2.5-2.0-1.5-1.0-0.50.00.51.01.52.02.5
Average Marketcap ÷
U.S. GDP
Tobin's Q 12-mtrailing
P/E
12-mforward
P/E
ShillerP/E
(CAPE)
RBC GAMfair value
Equityrisk
premium
Fedmodel
Market is expensive
Market is cheap
Market is slightly expensive
Market is slightly cheap
# of
sta
ndar
d de
viat
ions
away
from
the
aver
age
# 4 – The market’s valuation doesn’t spell doomThe biggest knock against the U.S. stock market is that it’s expensive. To us, that depends on which valuation standard is being used. According to some measures, the market can be viewed as pricey, but based on others it is reasonably valued or even slightly inexpensive.
The most commonly used measures, price-to-earnings ratios (P/E), indicate the S&P 500 valuation is elevated. The market’s 17.0x forward P/E based on our $127 per share 2017 estimate would normally be too high to assume additional “easy” multiple expansion is around the corner.
But stronger GDP growth and the end of disinflationary pressures combined with a higher Fed Funds rate could push stock multiples upward. Historically, when bond yields move from depressed levels back to more normal ones, P/E multiples typically rise. And P/Es can hover at lofty levels for quite some time and often move beyond levels that one might think warranted.
# 5 – Market mood swingsBenefits that the Trump administration could bring in terms of fiscal stimulus also come with new risks and the potential for heightened market volatility.
For starters, stronger GDP growth can naturally lead to elevated volatility—it already has in the bond market. Additionally, a more active Fed, responding to an improved economy and renormalized inflationary pressures, is likely to produce volatile episodes in equity markets.
Furthermore, the president-elect has a propensity to say what’s on his mind, regardless of whether it’s politically correct or comports with the typically more cautious language of Wall Street. Controversial statements could create uncertainty and rattle the market at times. More substantively and importantly, Trump’s actions on trade or immigration could generate market swings.
The S&P 500 Volatility Index has averaged 15.3 since 2013, an unusually low level. We wouldn’t be surprised if it averages closer to 20, with periodic spikes, during the first half of Trump’s term.

8 Global Insight | 2017 Outlook
Seven signposts for 2017
Investors may need to be more flexible with asset class and sector positioning compared to recent years.
S&P 500 sector recommendations: Changes in weightings
Source - RBC Capital Markets, RBC Wealth Management; new weightings as of 11/18/16
Financials [prev: MW] Technology [prev: OW] Staples [prev: OW]
Health Care [prev: MW] Discretionary [prev: OW] Utilities
Energy [prev: MW] Telecom
Materials [prev: UW] Real Estate
Industrials [prev: UW]
Overweight [OW] Market Weight [MW] Underweight [UW]
Heightened volatility can provide buying opportunities for investors, but also requires a stronger stomach. Investors may need to be more flexible with asset class and sector positioning compared to recent years.
# 6 – Tolling of the bellwethersWe view the following areas of the market as bellwethers for 2017—if they perform well, the market as a whole should deliver. As opportunities arise, we believe investors should make space in portfolios for stocks, exchange-traded funds, or managed solutions in these categories.
• Biotech and pharma: These health care subsectors seem set to trade higher after a challenging 2016 fraught with political headwinds. The Republicans’ ability to maintain control of the House diminishes drug price regulation risks, although drug reimportation could surface as an issue. For the first time in history, the largest biotech stocks are trading at a P/E discount to both pharma and the S&P 500. Biotech is also trading below its cycle average, yet it should grow faster than pharma and the S&P 500. At the same time, transformative treatments are in the works.
• Banks: Net interest margins should improve as the Fed raises interest rates and if the Treasury yield curve continues to steepen. Loan growth is likely to persist at a mid- to high single-digit rate as the economy keeps expanding. Also, merger and acquisition activity could heat up as banks seek out additional revenue opportunities. During the campaign, Trump signaled he may soften at least some financial regulations, and post-election press reports indicate the rollbacks could be meaningful. Amid this backdrop, the price-to-book value of the bank group relative to the S&P 500 is well below its long-term average. Bank stocks rallied sharply following the election. We prefer to buy on pullbacks.
• Infrastructure: Infrastructure stocks could trade higher if the fiscal spending package ends up being anywhere near as large as the $1 trillion over 10 years that Trump is targeting. Investors who are valuation-sensitive should note many of these stocks have already begun to rally in anticipation.
• Energy: Trump’s proposals to reduce oil and gas regulations and expand pipeline opportunities are positive for the industry, in our view. As long as higher supplies are met with greater demand from curtailed fuel efficiency rules and stronger economic growth, these initiatives would be net supportive of oil prices. But investors should be selective, as some segments of the Energy sector likely stand to gain more than others.

9 Global Insight | 2017 Outlook
Seven signposts for 2017
We acknowledge hawkish trade moves by presidents don’t always have lasting negative repercussions.
# 7 – What keeps us up at night? TradeOur greatest area of concern is the possibility that the Trump agenda will disrupt global trade, and thereby upend the U.S. economy and stock market in the process.
Trump seeks to renegotiate the North American Free Trade Agreement (NAFTA) or cancel it in favor of new bilateral agreements. He has also signaled that if U.S.-based companies move jobs to Mexico or overseas, he could slap a 35% tariff on any related products that are imported into the country. And he has threatened substantial tariffs on Chinese imports.
The U.S. economic system is built around a long-standing global framework—corporations have operated according to multinational trade rules for decades. It may not be the best system, but it’s a system corporate executives are used to and it provides a level of certainty that allows them to plan operations for years ahead. If that system is jolted in a meaningful way, uncertainty could abound. The stock market doesn’t like uncertainty, nor do business decision-makers.
On the campaign trail, we saw little evidence Trump will moderate his trade views, although at least two of his economic advisors have signaled he may. If Trump handles trade challenges prudently and carefully, they may cause no more than periodic volatility for equity markets. But if trade issues are handled too aggressively or incorrectly, the price could be high for the U.S. and global economies—and for equity markets.
Even though this issue keeps us up at night, we acknowledge hawkish trade moves by presidents don’t always have lasting negative repercussions. Throughout his two terms, President Ronald Reagan talked tough on trade and imposed quotas and tariffs on select industries in Japan, the chief trading rival at the time. While the short-term success of those moves was questionable, the U.S. economy grew strongly and the equity market rallied significantly over that period.
Positive on U.S. equitiesAt the end of the day we are looking for an extension of the bull market, at least through 2017, driven by somewhat faster economic growth and the first meaningful advance in S&P 500 profits in three years. Importantly, the usual harbingers of a recession waiting over the horizon are not in sight. We are increasing our recommended exposure to U.S. equities to Overweight.

10 Global Insight | 2017 Outlook
Staying power?The Canadian stock market has outpaced global equity indexes in 2016. With credit conditions still accommodative, a boost from fiscal stimulus set to kick in, and better prospects for energy prices we look at whether the TSX can sustain its momentum further in 2017.
Overweight Canadian equitiesWe remain Overweight the Canadian equity market. A recovery in valuations has raised the bar for continued outperformance in 2017, but we believe conditions are in place that will deliver attractive relative returns in the Canadian market’s largest sectors—Financials and Energy.
For our Overweight recommendation to bear fruit, there needs to be a continued recovery in crude oil prices. We are content that lower non-OPEC production, decent demand growth, and limited OPEC spare capacity offer an acceptable line of sight to tighter market conditions and higher prices in 2017.
After five years of underperformance relative to the S&P 500, the Canadian equity market limped into 2016 against a number of headwinds that included elevated household debt and a steep decline in oil prices. Ultimately, low valuations set the stage for positive performance as the economy and earnings turned out to be “less bad” than feared. In fact, the S&P/TSX Composite was one of the best-performing global equity markets in 2016, outperforming the S&P 500 by over 6%.
Is that performance sustainable heading into 2017?
While valuations have become more demanding, we believe it is. Tail risks related to the Energy downturn appear to be fading while the Bank of Canada will enter
Patrick McAllisterToronto, Canada

11 Global Insight | 2017 Outlook
Staying power?
the new year with an accommodative bias and fiscal stimulus from the federal government is set to kick in. Given this backdrop, we believe the most important sectors of the domestic market remain attractive, which should allow for another year of solid equity returns.
While headwinds remain, we believe the conditions are in place for another year of strong performance from the banks.
S&P/TSX Composite performance relative to S&P 500
* YTD data through 11/14/16 Source - RBC Wealth Management, Bloomberg;
Prior to 2016, the Canadian equity market had underperformed the U.S. for five consecutive years. 14
%
-11%
4%
10%
7%
-11%
12%
13%
0%
13%
30%
11%
-1%
6%
2010 2011 2012 2013 2014 2015 2016*
S&P/TSX S&P 500
+167 bps -1,107 bps ‐940 bps -2,005 bps -397 bps -1,036 bps +633 bps
Expect continued earnings resilience from the banksResilience is a term often ascribed to the Canadian banks as strong market positions and diversified revenue sources have allowed the group to grow earnings through a variety of different economic environments over the years. As 2016 got underway the banks were viewed with some trepidation as investors struggled to quantify the extent of potential energy-related credit losses while the headwinds of slowing loan growth, increasing capital requirements, and low interest rates persisted.
Despite these challenges, the banks (once again) generated solid earnings growth, delivering a year-to-date total shareholder return of over 20%. While headwinds remain, we believe the conditions are in place for another year of strong performance from the group.
In light of slow economic growth, elevated household leverage, low interest rates, and new mortgage rules, it is reasonable to expect bank revenue growth will remain muted next year. However, we believe the combination of ongoing restructuring initiatives and a more supportive energy price environment should promote operating leverage and earnings growth. Over the past two years, the domestic banks have announced pretax restructuring charges of CA$2.2B and initiatives broadly aimed at streamlining organizational structures and processes. While we believe much of the associated savings will be reinvested in technology and digitization, some of these savings should fall to the bottom line.
With respect to credit losses, we have become progressively more positive on the outlook as 2016 has unfolded. Somewhat higher energy prices coupled with corporate actions aimed at solidifying balance sheets improved the outlook for bank loan losses. Should energy prices continue to recover, we believe banks may have already weathered peak credit losses stemming from the oil & gas industry.
In such a scenario, analyst expectations for continued expansion in credit provisions may prove to be overly conservative and ultimately result in upwards

12 Global Insight | 2017 Outlook
Staying power?
In our opinion, the pace of next year’s expected recovery in crude oil prices is almost as important as its magnitude.
revisions to earnings estimates. While indirect exposure to the energy downturn in the form of consumer loans in energy-sensitive provinces remains a concern, many bank management teams have noted that credit quality outside of Alberta is still strong.
Big six Canadian bank valuations
Source - RBC Wealth Management, RBC Capital Markets; data through Oct 2016
Banks currently trade in line with historical valuations.
Bank valuations have expanded alongside the recovery in crude oil prices and currently trade at an average of 11.4x forward earnings, which is generally in line with the historical average. While it is difficult to make a case for material valuation upside, we believe RBC Capital Markets’ forecast of mid-single-digit earnings growth, potential credit-related upside, and dividend yields in the range of 4%–5% offer the prospect for attractive total returns.
“Not too warm, not too cold” energy prices could propel the Energy sectorWith an eye to more balanced market conditions in 2017, RBC Capital Markets is forecasting an average North American benchmark crude oil price of $56 per barrel next year. In our opinion, the pace of next year’s expected recovery in crude oil prices is almost as important as its magnitude. Inventories remain near record levels while U.S. shale producers have proven themselves adept at responding to higher prices with their short-cycle projects. We believe a slow grind higher in energy prices could ultimately prove more durable than a near-term spike and provide the right conditions for outperformance in Canadian energy equities.
Within the oil & gas producer universe, we continue to favour core positions in the senior upstream and integrated oil companies. The higher-quality companies in this space possess considerable financial flexibility, growing production, and declining capital investment needs. Furthermore, these companies have extracted considerable cost savings during the downturn through a combination of supplier concessions, workforce reductions, and productivity initiatives.
On average, the large capitalization energy producers covered by RBC Capital Markets are expected to benefit from roughly 20% lower operating costs per barrel relative to 2014. We believe this all sets the table for attractive free cash flow growth next year and into 2018. Companies that direct a material amount of this expected cash flow to shareholder-friendly initiatives are likely to be rewarded by the market.
6x
8x
10x
12x
14x
16x
199
619
97
199
819
99
200
020
01
200
220
03
200
420
05
200
620
07
200
820
09
201
020
11
201
220
13
201
420
15
201
6
Pric
e /
forw
ard
ear
ning
s
10-yr. average 11.2x
13 Global Insight | 2017 Outlook
Staying power?
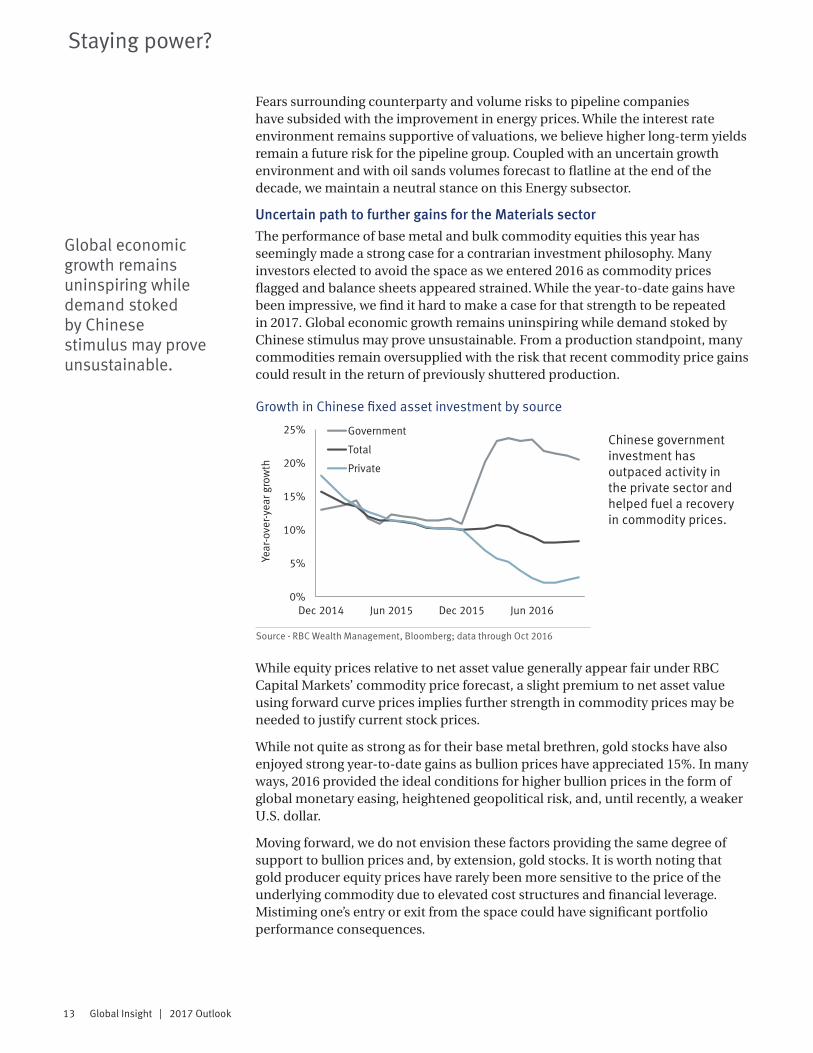
Global economic growth remains uninspiring while demand stoked by Chinese stimulus may prove unsustainable.
Fears surrounding counterparty and volume risks to pipeline companies have subsided with the improvement in energy prices. While the interest rate environment remains supportive of valuations, we believe higher long-term yields remain a future risk for the pipeline group. Coupled with an uncertain growth environment and with oil sands volumes forecast to flatline at the end of the decade, we maintain a neutral stance on this Energy subsector.
Uncertain path to further gains for the Materials sectorThe performance of base metal and bulk commodity equities this year has seemingly made a strong case for a contrarian investment philosophy. Many investors elected to avoid the space as we entered 2016 as commodity prices flagged and balance sheets appeared strained. While the year-to-date gains have been impressive, we find it hard to make a case for that strength to be repeated in 2017. Global economic growth remains uninspiring while demand stoked by Chinese stimulus may prove unsustainable. From a production standpoint, many commodities remain oversupplied with the risk that recent commodity price gains could result in the return of previously shuttered production.
While equity prices relative to net asset value generally appear fair under RBC Capital Markets’ commodity price forecast, a slight premium to net asset value using forward curve prices implies further strength in commodity prices may be needed to justify current stock prices.
While not quite as strong as for their base metal brethren, gold stocks have also enjoyed strong year-to-date gains as bullion prices have appreciated 15%. In many ways, 2016 provided the ideal conditions for higher bullion prices in the form of global monetary easing, heightened geopolitical risk, and, until recently, a weaker U.S. dollar.
Moving forward, we do not envision these factors providing the same degree of support to bullion prices and, by extension, gold stocks. It is worth noting that gold producer equity prices have rarely been more sensitive to the price of the underlying commodity due to elevated cost structures and financial leverage. Mistiming one’s entry or exit from the space could have significant portfolio performance consequences.
Growth in Chinese fixed asset investment by source
Source - RBC Wealth Management, Bloomberg; data through Oct 2016
Chinese government investment has outpaced activity in the private sector and helped fuel a recovery in commodity prices.
0%
5%
10%
15%
20%
25%
Dec 2014 Jun 2015 Dec 2015 Jun 2016
Year
-ove
r-ye
ar g
row
th
Government
Total
Private

14 Global Insight | 2017 Outlook
Europe’s political dominoesIs Brexit the first act in a redrawing of the political landscape across Europe? A heavy European election calendar amid growing anti-EU sentiment could produce bouts of market volatility. Heightened risks call for a selective portfolio approach.
A heavy slate of elections scheduled across Europe in 2017 leads us to believe investors should be braced for elevated political risks over the next 12 months. The result of the Brexit referendum from a historical perspective will likely be seen as a watershed moment which set off a wave of voter discontent within the EU that will largely decide the shape of its future.
Equity investors should be prepared for the manifestation of these political risks to be felt in both foreign exchange and stock markets. We expect a prolonged period of uncertainty, which will likely take a toll on economic growth and could lead to bouts of heightened volatility.
The result of the Brexit vote illustrates how changes in attitudes toward protectionism and immigration can alter the fundamentals that have underpinned European economies post World War II.
Currency takes a toll The abrupt 30% fall in the pound since its peak against the U.S. dollar mid 2014 illustrates the importance of considering currency exposure from a portfolio perspective. Indeed, the main battleground for geopolitical risk in the U.K. has been the GBP. Whilst in local currency terms the FTSE All-Share has recovered handsomely since the Brexit vote, it remains firmly below pre-referendum levels in USD terms. The STOXX Europe 600 index has also sagged below its pre-Brexit high whether measured in euros or U.S. dollars (see charts).
Frédérique CarrierLondon, United Kingdom

15 Global Insight | 2017 Outlook
Europe’s political dominoes
From the margin to the mainstream Politics will continue to be key in 2017 as populations in countries representing over 50% of EU GDP will head to the polls. These elections will take place at a time of dissatisfaction amongst the electorate with the EU and are concurrent with the rise of right-wing, anti-EU parties that are challenging the status quo. Even if they do not get the majority of seats in parliament, these parties can influence the political debate, much like the UK Independence Party (UKIP) did leading up to the Brexit vote despite having only a single seat in parliament.
Equity markets performance post Brexit vote in local currency
Source - RBC Wealth Management, Bloomberg; data through 11/7/16
Returns vastly dependent on currency performance.
in USD
Anti-EU sentiment on the rise Percentage with a favourable view of the EU
Source - Pew Research Center’s Global Attitudes Spring 2016 Survey, RBC Capital Markets
Fewer people are satisfied with the status quo.
78
58
83
69
5850 47
38
Italy Germany Spain France
2004/06 2016
400
425
450
475
500
4,250
4,500
4,750
5,000
5,250
5,500
10/1
9/15
11/1
9/15
12/1
9/15
1/19
/16
2/19
/16
3/19
/16
4/19
/16
5/19
/16
6/19
/16
7/19
/16
8/19
/16
9/19
/16
10/1
9/16
FTSE All-Share (left axis) STOXX Eur ex UK (right axis)
U.K. referendum
350
375
400
425
450
475
500
3,000
3,250
3,500
3,750
4,000
10/1
9/15
11/1
9/15
12/1
9/15
1/19
/16
2/19
/16
3/19
/16
4/19
/16
5/19
/16
6/19
/16
7/19
/16
8/19
/16
9/19
/16
10/1
9/16
FTSE All-Share (left axis) STOXX Eur ex UK (right axis)
U.K. referendum
16 Global Insight | 2017 Outlook
Europe’s political dominoes
EU sceptic parties do not need to hold the majority of seats in parliament to influence the political debate.
Given the EU is an institution based on the free movement of capital and labour, consternation amongst the electorate represents a risk investors should be aware of given the implications for portfolios. Push-back against the EU could take two forms. The first would see eurosceptics become the largest party in government, if not gaining a majority position (Five Star Movement in Italy, and the Party for Freedom in the Netherlands). The second would see anti-EU parties achieve modest representation in governments, but obtain outsized influence in the political debate, most notably in France and Germany. Either outcome is likely to influence the future path of the EU.
Potential election outcomesWe take a closer look at elections in Italy, the Netherlands, France, and Germany to highlight the potential risks in each country and to contextualize the implications for the future of the European Union.
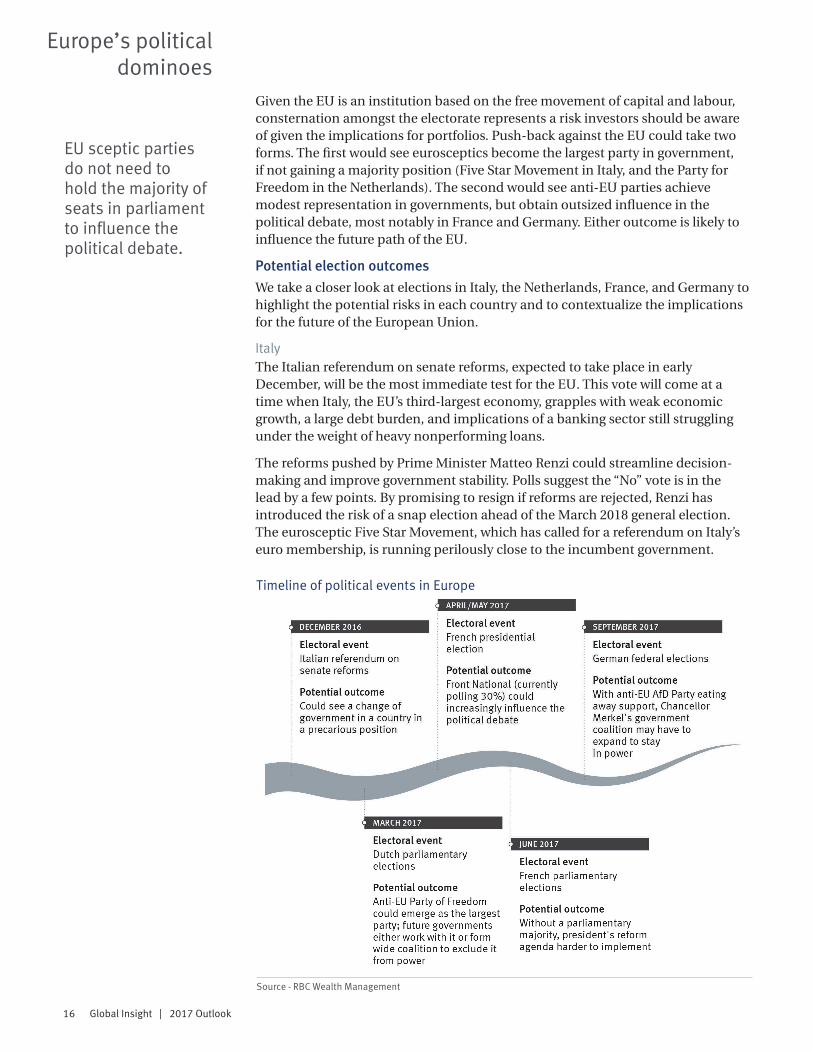
ItalyThe Italian referendum on senate reforms, expected to take place in early December, will be the most immediate test for the EU. This vote will come at a time when Italy, the EU’s third-largest economy, grapples with weak economic growth, a large debt burden, and implications of a banking sector still struggling under the weight of heavy nonperforming loans.
The reforms pushed by Prime Minister Matteo Renzi could streamline decision-making and improve government stability. Polls suggest the “No” vote is in the lead by a few points. By promising to resign if reforms are rejected, Renzi has introduced the risk of a snap election ahead of the March 2018 general election. The eurosceptic Five Star Movement, which has called for a referendum on Italy’s euro membership, is running perilously close to the incumbent government.
Timeline of political events in Europe
Source - RBC Wealth Management

17 Global Insight | 2017 Outlook
Europe’s political dominoes
Investors should expect higher volatility in equities and pay particular attention to currency exposure.
NetherlandsThe Dutch elections in spring 2017 could also lead to financial market volatility, in our opinion, given the anti-EU, anti-Islam Party for Freedom, which formally advocates for the Netherlands’ withdrawal from the EU, on course to emerge as the largest party.
Though still lacking the support to gain a majority, future governments could be forced to either bring the Party for Freedom into office or form a wide coalition with the sole purpose of excluding it from power. Either scenario would make for an uncertain political environment—nationally and EU wide.
FranceFrance’s presidential election process will get underway in the spring. According to polls, which consistently assign the far-right eurosceptic party, the Front National, just below 30% of the national vote, presidential candidate Marine Le Pen could progress to the second round, though she seems unlikely to win the presidency against a candidate closer to the center. Given its popularity, the ability of the Front National to influence mainstream politics in France and promote its protectionist, anti-European policies should not be underestimated. National identity, immigration, and homeland security have overtaken the economy as the top issues following the Brexit vote and terrorist attacks.
GermanyA similar dynamic is being observed in Germany, where the anti-immigration and eurosceptic party Alternative für Deutschland (AfD) is gaining ground at the expense of the centre. The AfD, which took a mere 4% of votes in the 2013 federal elections and now polls over 10% nationally, looks likely to win seats in the Bundestag in the autumn 2017 federal elections. However, a government excluding the ruling CDU/CSU (the political alliance of the Christian Democratic Union and the Christian Social Union) seems unlikely at this stage, though the coalition may have to expand should the AfD continue to gain popularity.
Shape portfolios to fit the circumstances From a portfolio perspective, investors need to be prepared for heightened volatility in equity markets and the implications of foreign exchange exposure.
In the U.K., our expectations of GBP weakness and soft domestic demand direct us to favor U.S.-dollar generated revenue in defensive sectors such as Consumer Staples and pharmaceuticals. Energy stocks should benefit from a weak currency. We are cautious on domestic sectors such as retailers which have historically suffered during periods of GBP weakness, as higher raw material prices tend to erode margins.
In Europe, banks could benefit from low valuations and recent reports the ECB may be pondering a change of direction, though recent weak lending data rein in our enthusiasm. With subdued economic growth, fair valuations, and high political risk, we prefer to stick to our strategy of investing in well-capitalized, quality companies, with world-class franchises, which pay and grow dividends.

18 Global Insight | 2017 Outlook
Stuck in the mud, but improvingGiven supply/demand rebalancing and the potential for OPEC to resume a managed regime, we believe the outlook for oil is improving. However, political disquiet in various producer nations, potentially changing U.S. foreign policy, and a pending decision from OPEC on a production cut are creating a thick veil of uncertainty for the current market outlook.
A pronounced supply response over the past two years combined with strong demand growth pared the oversupply from its peak of 2.4% of global consumption just over a year ago to 0.3% this past quarter, achieving a broadly balanced market.
OPEC has proposed an output ceiling that, if implemented, would shift the market to an undersupplied condition. In addition, the U.S. election may change foreign policy toward Iran providing an alternate path to lower OPEC output.
Despite these positive developments, oil prices have remained range-bound at roughly $40–$50 per barrel (/bbl), given various concerns, including uncertainty OPEC can re-instate a regime of supply control, demand growth showing signs of slowing, renewed U.S. drilling activity, and high inventory levels which may take some time to normalize.
OPEC attempting to regroupThe structure of the oil market changed when OPEC elected to take a laissez-faire approach nearly two years ago. However, several factors suggest a more-constructive backdrop may be emerging allowing OPEC to resume managing supply:
Mark AllenToronto, Canada

19 Global Insight | 2017 Outlook
Stuck in the mud, but improving
OPEC has been increasing production while non-OPEC output has been declining.
Global supply/demand outlook
Source - RBC Wealth Management, RBC Capital Markets; forecast data for Q4 ’16–Q4 ’18
-2.0
-1.5
-1.0
-0.5
0.0
0.5
1.0
1.5
2.0
2.5
77
82
87
92
97
102
1Q '0
3
4Q '0
3
3Q '0
4
2Q '0
5
1Q '0
6
4Q '0
6
3Q '0
7
2Q '0
8
1Q '0
9
4Q '0
9
3Q '1
0
2Q '1
1
1Q '1
2
4Q '1
2
3Q '1
3
2Q '1
4
1Q '1
5
4Q '1
5
3Q '1
6
2Q '1
7E
1Q '1
8E
4Q '1
8E
World oil surplus (M
bbl/d)
Surplus (right axis) Global supply (left axis) Global demand (left axis)
Wor
ldoi
l sup
ply
/dem
and
(M b
bl/d
)
1) A preliminary agreement has been proposed to set the OPEC output ceiling at 32.5–33.0 million bbl/d, 800,000–1.3 million barrels per day (bbl/d) below October’s production levels.
2) The pressure on OPEC member governments continues to mount as time passes in a low-price environment. Saudi Arabia, for example, is running a substantial fiscal deficit this year. The government has cut subsidies to electricity, water, and energy, and more recently has announced plans to reduce salaries for government employees (approximately two-thirds of the nation’s workforce).
3) Iran has reached levels of production (3.7 million bbl/d) that are roughly in line with its output before sanctions were tightened in mid-2012. Iran had previously stated it would not consider production containment agreements before reaching pre-sanction output levels.
4) Saudi Arabia and Iraq have each increased production by about 1 million bbl/d, since late 2014. Those increases for OPEC’s two largest producers may allow for better posturing in the negotiation of production cut allocations. OPEC next meets on November 30 in Vienna, when more details on the proposed cuts are expected.
Demand trailing supplyOn the demand side, trends have softened recently. The International Energy Agency sees year-over-year demand growth flattening in H2 2016 for the Americas and Europe. The agency also sees a deceleration of demand growth for China as the economy continues to restructure toward a larger service sector, combined with temporary factors such as heavy flooding which has impacted road transport.
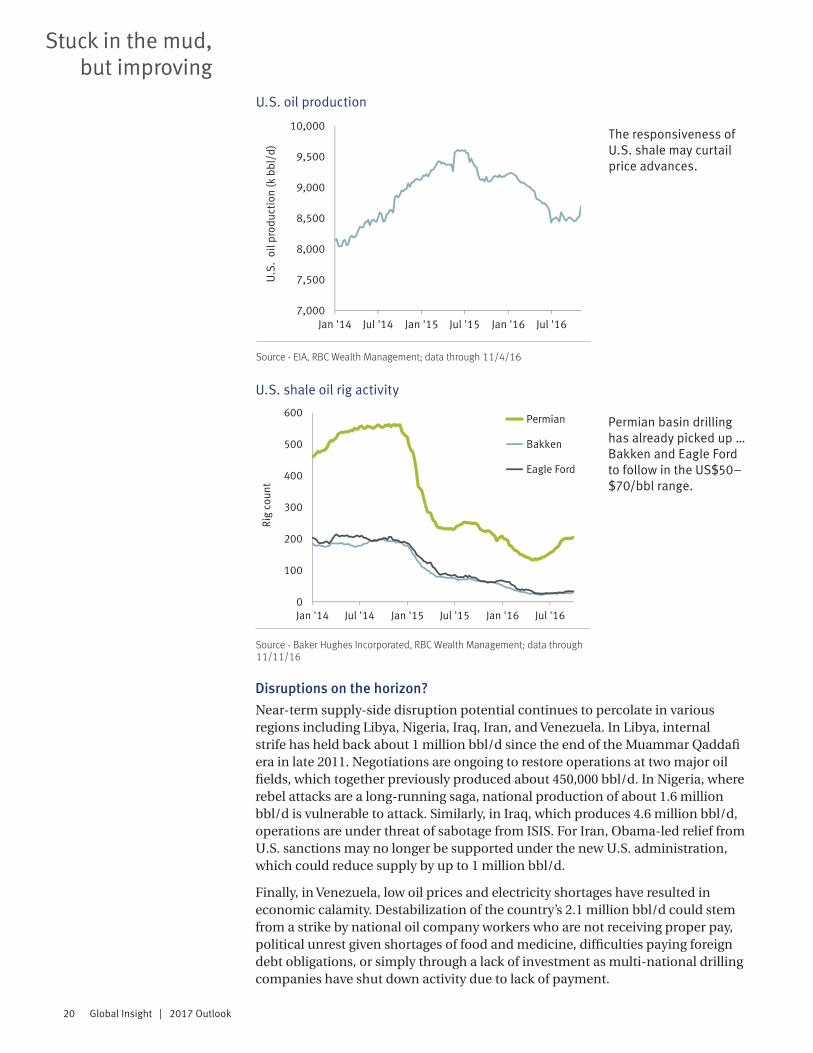
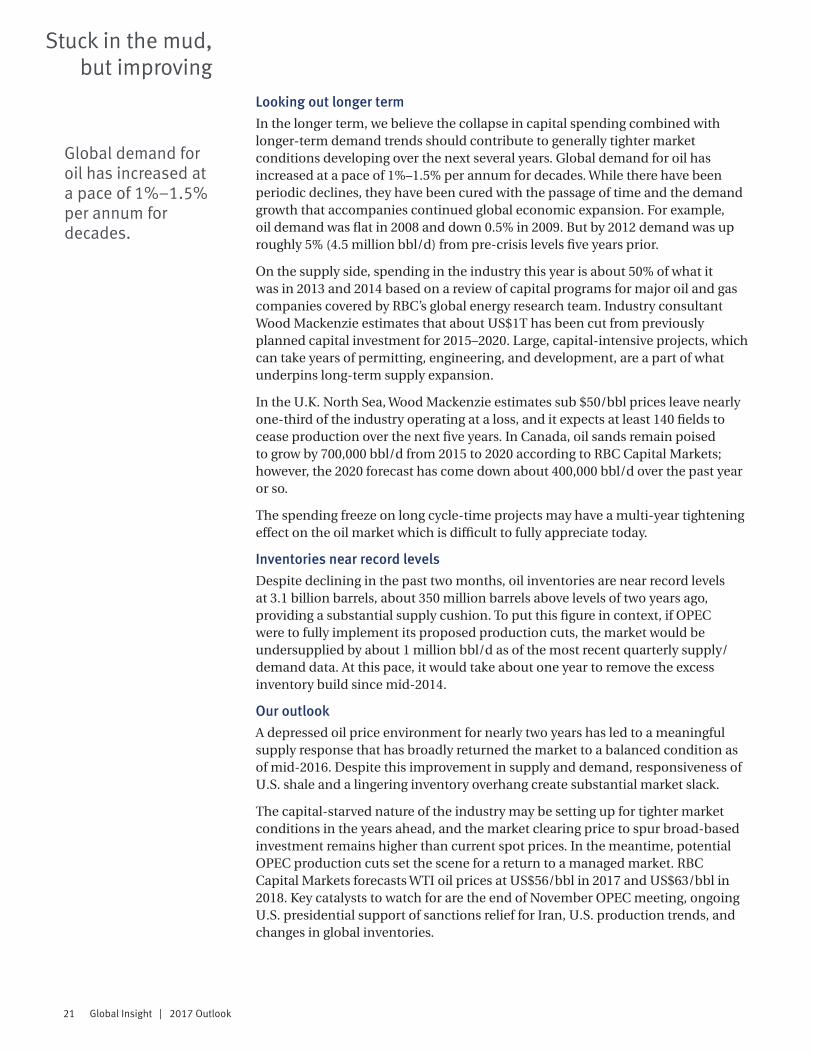
On the supply side, OPEC has been increasing production while non-OPEC output has been declining, led by the United States. U.S. production is down about 1 million bbl/d from its peak in summer 2015. At current prices, the cost to frack previously drilled, but uncompleted, wells is economically viable. U.S. production trends have flatlined and more recently turned upward as we have seen this inventory of drilled, but uncompleted, wells come down and as drilling activity has picked up in the low-cost Permian basin.
20 Global Insight | 2017 Outlook
Stuck in the mud, but improving
U.S. oil production
Source - EIA, RBC Wealth Management; data through 11/4/16
The responsiveness of U.S. shale may curtail price advances.
U.S. shale oil rig activity
Source - Baker Hughes Incorporated, RBC Wealth Management; data through 11/11/16
Permian basin drilling has already picked up … Bakken and Eagle Ford to follow in the US$50–$70/bbl range.
0
100
200
300
400
500
600
Jan '14 Jul '14 Jan '15 Jul '15 Jan '16 Jul '16
Rig
coun
t
Permian
Bakken
Eagle Ford
Disruptions on the horizon?Near-term supply-side disruption potential continues to percolate in various regions including Libya, Nigeria, Iraq, Iran, and Venezuela. In Libya, internal strife has held back about 1 million bbl/d since the end of the Muammar Qaddafi era in late 2011. Negotiations are ongoing to restore operations at two major oil fields, which together previously produced about 450,000 bbl/d. In Nigeria, where rebel attacks are a long-running saga, national production of about 1.6 million bbl/d is vulnerable to attack. Similarly, in Iraq, which produces 4.6 million bbl/d, operations are under threat of sabotage from ISIS. For Iran, Obama-led relief from U.S. sanctions may no longer be supported under the new U.S. administration, which could reduce supply by up to 1 million bbl/d.
Finally, in Venezuela, low oil prices and electricity shortages have resulted in economic calamity. Destabilization of the country’s 2.1 million bbl/d could stem from a strike by national oil company workers who are not receiving proper pay, political unrest given shortages of food and medicine, difficulties paying foreign debt obligations, or simply through a lack of investment as multi-national drilling companies have shut down activity due to lack of payment.
7,000
7,500
8,000
8,500
9,000
9,500
10,000
Jan '14 Jul '14 Jan '15 Jul '15 Jan '16 Jul '16
U.S
. oi
l pro
duct
ion
(k b
bl/d
)
21 Global Insight | 2017 Outlook
Stuck in the mud, but improving
Global demand for oil has increased at a pace of 1%–1.5% per annum for decades.
Looking out longer term In the longer term, we believe the collapse in capital spending combined with longer-term demand trends should contribute to generally tighter market conditions developing over the next several years. Global demand for oil has increased at a pace of 1%–1.5% per annum for decades. While there have been periodic declines, they have been cured with the passage of time and the demand growth that accompanies continued global economic expansion. For example, oil demand was flat in 2008 and down 0.5% in 2009. But by 2012 demand was up roughly 5% (4.5 million bbl/d) from pre-crisis levels five years prior.
On the supply side, spending in the industry this year is about 50% of what it was in 2013 and 2014 based on a review of capital programs for major oil and gas companies covered by RBC’s global energy research team. Industry consultant Wood Mackenzie estimates that about US$1T has been cut from previously planned capital investment for 2015–2020. Large, capital-intensive projects, which can take years of permitting, engineering, and development, are a part of what underpins long-term supply expansion.
In the U.K. North Sea, Wood Mackenzie estimates sub $50/bbl prices leave nearly one-third of the industry operating at a loss, and it expects at least 140 fields to cease production over the next five years. In Canada, oil sands remain poised to grow by 700,000 bbl/d from 2015 to 2020 according to RBC Capital Markets; however, the 2020 forecast has come down about 400,000 bbl/d over the past year or so.
The spending freeze on long cycle-time projects may have a multi-year tightening effect on the oil market which is difficult to fully appreciate today.
Inventories near record levelsDespite declining in the past two months, oil inventories are near record levels at 3.1 billion barrels, about 350 million barrels above levels of two years ago, providing a substantial supply cushion. To put this figure in context, if OPEC were to fully implement its proposed production cuts, the market would be undersupplied by about 1 million bbl/d as of the most recent quarterly supply/demand data. At this pace, it would take about one year to remove the excess inventory build since mid-2014.
Our outlookA depressed oil price environment for nearly two years has led to a meaningful supply response that has broadly returned the market to a balanced condition as of mid-2016. Despite this improvement in supply and demand, responsiveness of U.S. shale and a lingering inventory overhang create substantial market slack.
The capital-starved nature of the industry may be setting up for tighter market conditions in the years ahead, and the market clearing price to spur broad-based investment remains higher than current spot prices. In the meantime, potential OPEC production cuts set the scene for a return to a managed market. RBC Capital Markets forecasts WTI oil prices at US$56/bbl in 2017 and US$63/bbl in 2018. Key catalysts to watch for are the end of November OPEC meeting, ongoing U.S. presidential support of sanctions relief for Iran, U.S. production trends, and changes in global inventories.

22 Global Insight | 2017 Outlook
Various shades of accommodationAs breakout speed for developed economies remains elusive, major central banks around the world are not ready to take the training wheels off and will continue to nurture fragile economic growth in order to achieve a sustainable, long-term growth trajectory. We look at how policymakers in different regions will approach their particular circumstances and challenges and explain how investors should position fixed income portfolios.
An inflection point is at hand with respect to monetary policy in 2017 as the world’s major central banks continue their efforts to stoke both growth and an acceptable amount of inflation. Policymaker assessments that gauge the desired pace of growth against political and inflation risks, in our judgment, will result in accommodative policies remaining in place in all the major economies, while taking very different forms in the U.S., U.K., Europe, and Canada.
Ultralow interest rates will remain the order of the day in Canada. However, the Federal Reserve is expected to move further into a hiking cycle already characterized by patience and a very gradual pace. The Bank of England (BoE) will have to weigh the risks of higher inflation, stemming from the steep decline in the pound, against the potential need for stimulus should Brexit-related developments unduly weaken confidence and economic output. Meanwhile, the European Central Bank (ECB) may have to adjust its approach to accommodation given practical limits to its current bond-buying program.
Overall, we believe global central bank policies will still best be described as accommodative. But 2017 will make clear that the look and feel of accommodation will be different in each region.
Craig BishopMinneapolis, United States
Christopher GirdlerLondon, United Kingdom
Rajan BansiToronto, Canada
23 Global Insight | 2017 Outlook
Various shades of accommodation
U.S. outlook: It is still all about the Fed The Fed starts 2017 with a forecast of at least two 25 basis point rate hikes, after standing pat thus far in 2016 despite the fact the market expected four rate hikes of 25 basis points each when the year began. Although it is in the midst of a tightening cycle, it would be difficult to characterize the Fed as hawkish, given its protracted approach to hiking rates thus far together with Chair Janet Yellen’s suggestion the economy should be allowed to “run hot.” The latter suggests Yellen would allow accommodative policy to remain in place in order to avoid a near-term downturn, even if it resulted in an overheated labor market and higher inflation.
The message for investors is that the Fed remains accommodative, even in the midst of a policy of gradually raising rates. In our view, the Fed’s policy intention, so far, is one of removing those emergency levels of support it deems appropriate as opposed to taking action to intentionally cool the economy. This progression to higher interest rates and steeper yield curves should continue into early 2017 as markets adjust to gradually tighter Fed policy and a semblance of stability in global markets.
We continue to favor opportunities in corporate credit, but in the face of tighter spreads in this part of the market, we remain selective and expect to become increasingly defensive by limiting duration exposure.
The future of the U.K. in Europe should be the story of 2017We expect the BoE to be on hold as we enter 2017 as the feared economic slowdown post the Brexit referendum has not yet materialized. That said, economic activity is hardly buoyant—construction and manufacturing are noticeably weak. We are monitoring secured lending to households and corporates with some concern given recent softness.
We believe the BoE stands ready to intervene with additional accommodative measures should economic conditions or developing risks as a result of any extrication process from the EU warrant. Its policy options may be somewhat constrained by the inflation pickup likely to flow from the sharp fall in the pound.
In the U.K. market, we favour intermediate maturities. We expect volatility to be a prominent feature of the Gilt market, particularly at the longer end of the curve in response to Brexit-related developments and any eventual U.S. rate increases.
Although it is in the midst of a tightening cycle, it would be difficult to characterize the Fed as hawkish.
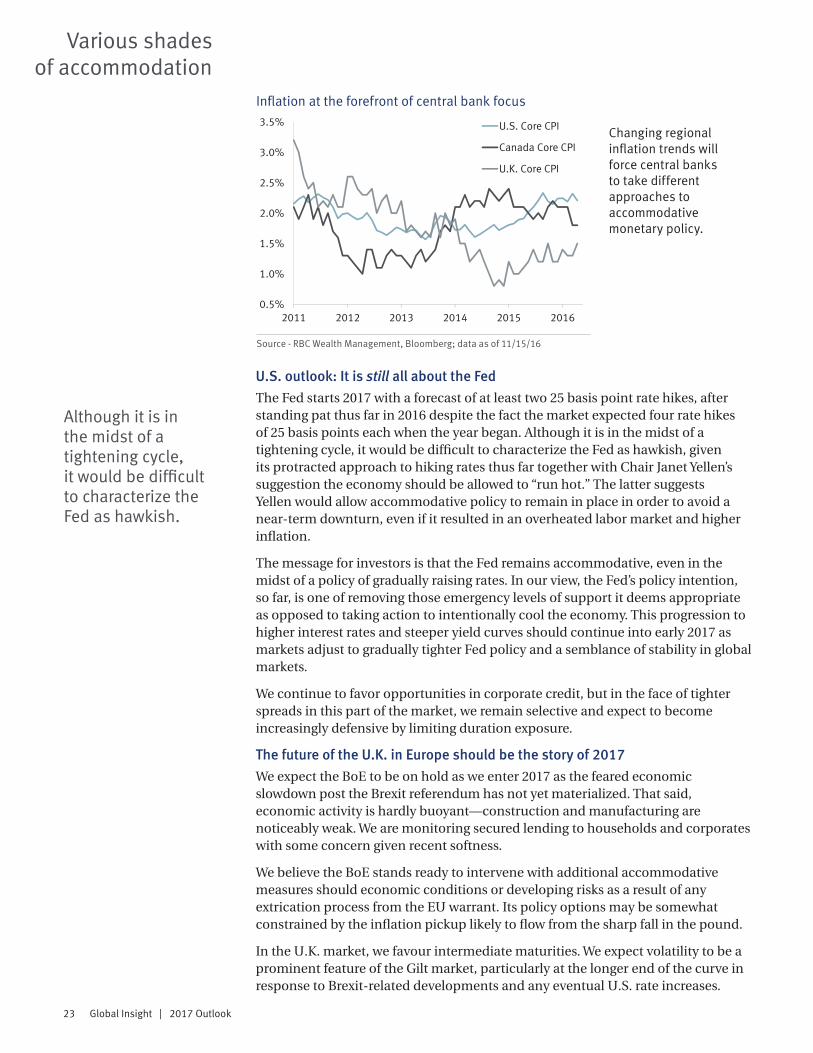
Inflation at the forefront of central bank focus
Source - RBC Wealth Management, Bloomberg; data as of 11/15/16
Changing regional inflation trends will force central banks to take different approaches to accommodative monetary policy.
0.5%
1.0%
1.5%
2.0%
2.5%
3.0%
3.5%
2011 2012 2013 2014 2015 2016
U.S. Core CPI
Canada Core CPI
U.K. Core CPI

24 Global Insight | 2017 Outlook
Various shades of accommodation
The BoC reiterated its willingness to utilize unconventional tools to achieve its policy goals if necessary.
Are there any more bonds for the ECB to buy?In 2017, the question for investors will not be if, but how the ECB will pursue accommodative policy. It may run out of eligible Bunds to purchase before the scheduled end of its quantitative easing measures in March, bringing into question what measures the ECB will adopt to anchor yields and get credit flowing in the eurozone. We expect European yields to remain low through 2017. Unlike our recommended stance in the U.K., we are comfortable taking on duration risk in Europe.
Our long-standing preference for credit over government bonds will extend into 2017. We continue to recommend global banks to diversify regional domestic risk and like conservative names in Utilities and Consumer Staples that offer a yield pickup to governments and are eligible for central bank purchases.
Attractive yield pickup helps offset duration risk
Source - RBC Wealth Management, Bloomberg; data as of 4:00 pm GMT 11/15/16
As the ECB remains accommodative, we continue to favor the yield pickup of long-term European corporate credit.
0.0%
0.5%
1.0%
1.5%
2.0%
2.5%
Oct '15 Dec '15 Feb '16 Apr '16 Jun '16 Aug '16 Oct '16
Yield pickup
Euro Corporate Bond 10+ Index
Euro Corporate Bond 1-10 Index
Canada: No gray area hereThe Bank of Canada (BoC) enters 2017 ready to provide further stimulus if economic conditions warrant. BoC Governor Stephen Poloz indicated in November that new mortgage rules introduced by the federal government had given the central bank more latitude to consider stimulative monetary policies as any rate cut is less likely to add more fuel to a hot housing market. The BoC also reiterated its willingness to utilize unconventional tools, including negative interest rates and bond purchases, to achieve its policy goals if necessary.
Economic data into the early months of 2017 will dictate whether additional stimulus might be forthcoming by the spring. Financial markets are pricing in less than a 20% probability of an interest rate cut by May. These odds could rise further should the federal government’s next budget, due in the first half, not include a substantial increase in fiscal stimulus.
We caution against adding too much duration now as long-term yields are quite low and credit spreads remain tight despite the economic uncertainty. We counsel selectivity and retention of a liquidity reserve to take advantage of buying opportunities early in the year. We continue to find better value in preferred shares than the corporate bond market, with $13–$18 rate-reset issues and high dividend perpetuals the most compelling.
25 Global Insight | 2017 Outlook
Research resourcesThis document is produced by the Global Portfolio Advisory Committee within RBC Wealth Management’s Portfolio Advisory Group. The RBC Wealth Management Portfolio Advisory Group provides support related to asset allocation and portfolio construction for the firm’s investment advisors / financial advisors who are engaged in assembling portfolios incorporating individual marketable securities. The Committee leverages the broad market outlook as developed by the RBC Investment Strategy Committee, providing additional tactical and thematic support utilizing research from the RBC Investment Strategy Committee, RBC Capital Markets, and third-party resources.
Global Portfolio Advisory Committee members:
Jim Allworth – Co-chair; Investment Strategist, RBC Dominion Securities Inc.
Rajan Bansi – Co-chair; Head of Fixed Income Strategies, RBC Wealth Management Portfolio Advisory Group, RBC Dominion Securities Inc.
Mark Allen – Portfolio Advisor, RBC Wealth Management Portfolio Advisory Group, RBC Dominion Securities Inc.
Craig Bishop – Lead Strategist, U.S. Fixed Income Strategies Group, RBC Wealth Management Portfolio Advisory Group, RBC Capital Markets, LLC
Mark Bayko – Head, Multi-Asset Portfolios & Practice Management, RBC Dominion Securities Inc.
Kelly Bogdanov – Portfolio Analyst, RBC Wealth Management Portfolio Advisory Group, RBC Capital Markets, LLC
Paul Bowman – Director, Head of Structured Solutions and FX Strategy, Royal Bank of Canada Investment Management (U.K.) Ltd.
Frédérique Carrier – Director, Head of Equities, Royal Bank of Canada Investment Management (U.K.) Ltd.
Jean-François Dion – Head, Equity Portfolio Management, RBC Dominion Securities Inc.
Janet Engels – Head of U.S. Equities, RBC Wealth Management Portfolio Advisory Group, RBC Capital Markets, LLC
Hakan Enoksson – Head of Fixed Income - British Isles, Royal Bank of Canada Investment Management (U.K.) Ltd.
Tom Garretson – Fixed Income Portfolio Advisor, RBC Capital Markets, LLC
Christopher Girdler – Fixed Income Portfolio Manager/Strategist, Royal Bank of Canada Investment Management (U.K.) Ltd.
Patrick McAllister – Canadian Equities Portfolio Advisor, RBC Dominion Securities Inc.
Jay Roberts – Head of Investment Solutions & Products, RBC Wealth Management Hong Kong, RBC Dominion Securities Inc.
The RBC Investment Strategy Committee (RISC) consists of senior investment professionals drawn from individual, client-focused business units within RBC, including the Portfolio Advisory Group. The RBC Investment Strategy Committee builds a broad global investment outlook and develops specific guidelines that can be used to manage portfolios. RISC is chaired by Daniel Chornous, CFA, Chief Investment Officer of RBC Global Asset Management Inc.
26 Global Insight | 2017 Outlook
Required disclosuresAnalyst Certification All of the views expressed in this report accurately reflect the personal views of the responsible analyst(s) about any and all of the subject securities or issuers. No part of the compensation of the responsible analyst(s) named herein is, or will be, directly or indirectly, related to the specific recommenda-tions or views expressed by the responsible analyst(s) in this report.
Important DisclosuresIn the U.S., RBC Wealth Management operates as a division of RBC Capital Markets, LLC. In Canada, RBC Wealth Management includes, without limita-tion, RBC Dominion Securities Inc., which is a foreign affiliate of RBC Capital Markets, LLC. This report has been prepared by RBC Capital Markets, LLC which is an indirect wholly-owned subsidiary of the Royal Bank of Canada and, as such, is a related issuer of Royal Bank of Canada.
Non-U.S. Analyst Disclosure: Mark Allen, Jim Allworth, Rajan Bansi, Mark Bayko, Jean-François Dion, Patrick McAllister, and Jay Roberts, employees of RBC Wealth Management USA’s foreign affiliate RBC Dominion Securities Inc.; and Paul Bowman, Frédérique Carrier, Hakan Enoksson, and Christo-pher Girdler, , employees of RBC Wealth Management USA’s foreign affiliate Royal Bank of Canada Investment Management (U.K.) Limited; contributed to the preparation of this publication. These individuals are not registered with or qualified as research analysts with the U.S. Financial Industry Regula-tory Authority (“FINRA”) and, since they are not associated persons of RBC Wealth Management, they may not be subject to FINRA Rule 2241 governing communications with subject companies, the making of public appearances, and the trading of securities in accounts held by research analysts.
In the event that this is a compendium report (covers six or more compa-nies), RBC Wealth Management may choose to provide important disclosure information by reference. To access current disclosures, clients should refer to http://www.rbccm.com/GLDisclosure/PublicWebbl/disclosureLookup.aspx?EntityID=2 to view disclosures regarding RBC Wealth Management and its affiliated firms. Such information is also available upon request to RBC Wealth Management Publishing, 60 South Sixth St, Minneapolis, MN 55402.
References to a Recommended List in the recommendation history chart may include one or more recommended lists or model portfolios maintained by RBC Wealth Management or one of its affiliates. RBC Wealth Management recommended lists include the Guided Portfolio: Prime Income (RL 6), the Guided Portfolio: Dividend Growth (RL 8), and the Guided Portfolio: ADR (RL 10), and former lists called the Guided Portfolio: Large Cap (RL 7), the Guided Portfolio: Midcap 111 (RL 9), and the Guided Portfolio: Global Equity (U.S.) (RL 11). RBC Capital Markets recommended lists include the Strategy Focus List and the Fundamental Equity Weightings (FEW) portfolios. The abbreviation ‘RL On’ means the date a security was placed on a Recommended List. The abbreviation ‘RL Off’ means the date a security was removed from a Recommended List.
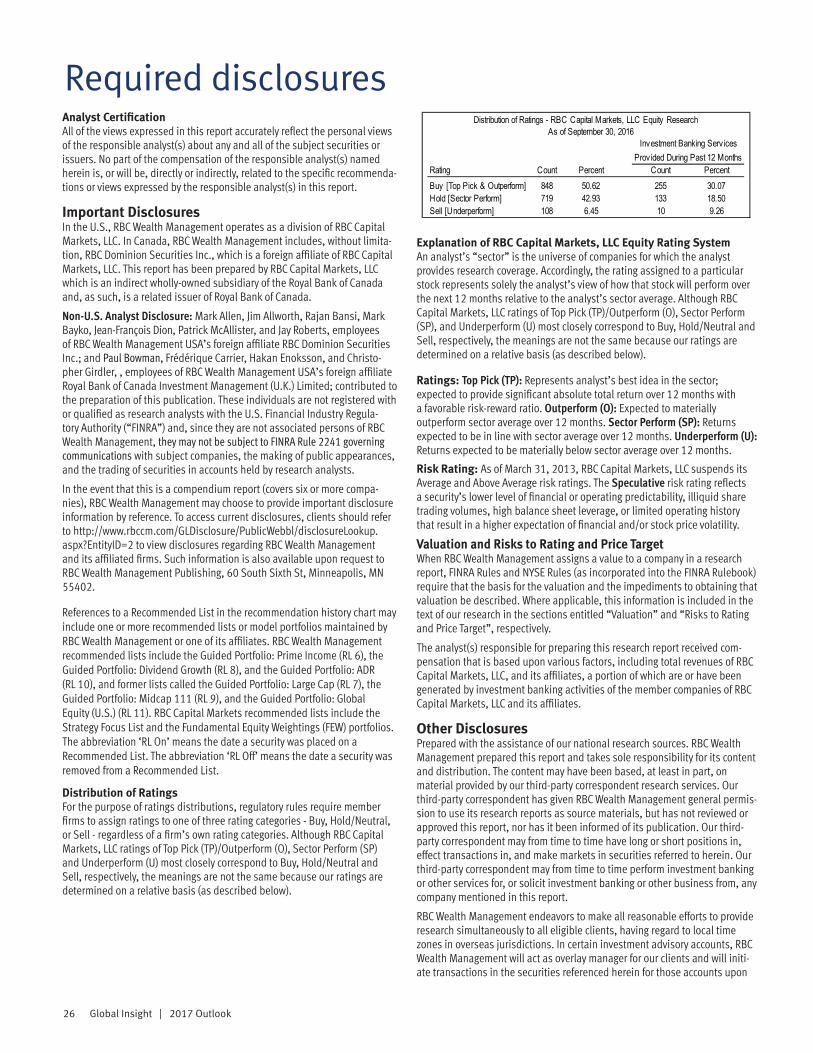
Distribution of RatingsFor the purpose of ratings distributions, regulatory rules require member firms to assign ratings to one of three rating categories - Buy, Hold/Neutral, or Sell - regardless of a firm’s own rating categories. Although RBC Capital Markets, LLC ratings of Top Pick (TP)/Outperform (O), Sector Perform (SP) and Underperform (U) most closely correspond to Buy, Hold/Neutral and Sell, respectively, the meanings are not the same because our ratings are determined on a relative basis (as described below).
Explanation of RBC Capital Markets, LLC Equity Rating SystemAn analyst’s “sector” is the universe of companies for which the analyst provides research coverage. Accordingly, the rating assigned to a particular stock represents solely the analyst’s view of how that stock will perform over the next 12 months relative to the analyst’s sector average. Although RBC Capital Markets, LLC ratings of Top Pick (TP)/Outperform (O), Sector Perform (SP), and Underperform (U) most closely correspond to Buy, Hold/Neutral and Sell, respectively, the meanings are not the same because our ratings are determined on a relative basis (as described below).
Ratings: Top Pick (TP): Represents analyst’s best idea in the sector; expected to provide significant absolute total return over 12 months with a favorable risk-reward ratio. Outperform (O): Expected to materially outperform sector average over 12 months. Sector Perform (SP): Returns expected to be in line with sector average over 12 months. Underperform (U): Returns expected to be materially below sector average over 12 months.
Risk Rating: As of March 31, 2013, RBC Capital Markets, LLC suspends its Average and Above Average risk ratings. The Speculative risk rating reflects a security’s lower level of financial or operating predictability, illiquid share trading volumes, high balance sheet leverage, or limited operating history that result in a higher expectation of financial and/or stock price volatility.
Valuation and Risks to Rating and Price TargetWhen RBC Wealth Management assigns a value to a company in a research report, FINRA Rules and NYSE Rules (as incorporated into the FINRA Rulebook) require that the basis for the valuation and the impediments to obtaining that valuation be described. Where applicable, this information is included in the text of our research in the sections entitled “Valuation” and “Risks to Rating and Price Target”, respectively.
The analyst(s) responsible for preparing this research report received com-pensation that is based upon various factors, including total revenues of RBC Capital Markets, LLC, and its affiliates, a portion of which are or have been generated by investment banking activities of the member companies of RBC Capital Markets, LLC and its affiliates.
Other DisclosuresPrepared with the assistance of our national research sources. RBC Wealth Management prepared this report and takes sole responsibility for its content and distribution. The content may have been based, at least in part, on material provided by our third-party correspondent research services. Our third-party correspondent has given RBC Wealth Management general permis-sion to use its research reports as source materials, but has not reviewed or approved this report, nor has it been informed of its publication. Our third-party correspondent may from time to time have long or short positions in, effect transactions in, and make markets in securities referred to herein. Our third-party correspondent may from time to time perform investment banking or other services for, or solicit investment banking or other business from, any company mentioned in this report.
RBC Wealth Management endeavors to make all reasonable efforts to provide research simultaneously to all eligible clients, having regard to local time zones in overseas jurisdictions. In certain investment advisory accounts, RBC Wealth Management will act as overlay manager for our clients and will initi-ate transactions in the securities referenced herein for those accounts upon
As of September 30, 2016
Rating Count Percent Count PercentBuy [Top Pick & Outperform] 848 50.62 255 30.07Hold [Sector Perform] 719 42.93 133 18.50Sell [Underperform] 108 6.45 10 9.26
Investment Banking Serv ices Prov ided During Past 12 Months
Distribution of Ratings - RBC Capital Markets, LLC Equity Research

27 Global Insight | 2017 Outlook
receipt of this report. These transactions may occur before or after your re-ceipt of this report and may have a short-term impact on the market price of the securities in which transactions occur. RBC Wealth Management research is posted to our proprietary Web sites to ensure eligible clients receive coverage initiations and changes in rating, targets, and opinions in a timely manner. Additional distribution may be done by sales personnel via e-mail, fax, or regular mail. Clients may also receive our research via third-party vendors. Please contact your RBC Wealth Management Financial Advisor for more information regarding RBC Wealth Management research.
Conflicts Disclosure: RBC Wealth Management is registered with the Se-curities and Exchange Commission as a broker/dealer and an investment ad-viser, offering both brokerage and investment advisory services. RBC Wealth Management’s Policy for Managing Conflicts of Interest in Relation to Invest-ment Research is available from us on our Web site at http://www.rbccm.com/GLDisclosure/PublicWebbl/disclosureLookup.aspx?EntityID=2. Conflicts of interests related to our investment advisory business can be found in Part II of the Firm’s Form ADV or the Investment Advisor Group Disclosure Docu-ment. Copies of any of these documents are available upon request through your Financial Advisor. We reserve the right to amend or supplement this policy, Part II of the ADV, or Disclosure Document at any time.
The authors are employed by one of the following entities: RBC Wealth Management USA, a division of RBC Capital Markets, LLC, a securities broker-dealer with principal offices located in Minnesota and New York, USA; by RBC Dominion Securities Inc., a securities broker-dealer with principal offices located in Toronto, Canada; by RBC Investment Services (Asia) Limited, a subsidiary of RBC Dominion Securities Inc., a securities broker-dealer with principal offices located in Hong Kong, China; and by Royal Bank of Canada Investment Management (U.K.) Limited, an investment management com-pany with principal offices located in London, United Kingdom.
The Global Industry Classification Standard (“GICS”) was developed by and is the exclusive property and a service mark of MSCI Inc. (“MSCI”) and Standard & Poor’s Financial Services LLC (“S&P”) and is licensed for use by RBC. Neither MSCI, S&P, nor any other party involved in making or compiling the GICS or any GICS classifications makes any express or implied warranties or representations with respect to such standard or classification (or the results to be obtained by the use thereof), and all such parties hereby expressly disclaim all warranties of originality, accuracy, com-pleteness, merchantability and fitness for a particular purpose with respect to any of such standard or classification. Without limiting any of the foregoing, in no event shall MSCI, S&P, any of their affiliates or any third party involved in making or compiling the GICS or any GICS classifications have any liability for any direct, indirect, special, punitive, consequential or any other damages (including lost profits) even if notified of the possibility of such damages.
DisclaimerThe information contained in this report has been compiled by RBC Wealth Management, a division of RBC Capital Markets, LLC, from sources believed to be reliable, but no representation or warranty, express or implied, is made by Royal Bank of Canada, RBC Wealth Management, its affiliates or any other person as to its accuracy, completeness or correctness. All opinions and estimates contained in this report constitute RBC Wealth Management’s judgment as of the date of this report, are subject to change without notice and are provided in good faith but without legal responsibility. Past performance is not a guide to future performance, future returns are not guaranteed, and a loss of original capital may occur. Every province in Canada, state in the U.S., and most countries throughout the world have their own laws regulating the types of securities and other investment products which may be offered to their residents, as well as the process for doing so. As a result, the securities discussed in this report may not be eligible for sale in some jurisdictions. This report is not, and under no circumstances should be construed as, a solicitation to act as securities broker or dealer in any jurisdiction by any person or company that is not legally permitted to carry on the business of a securities broker or dealer in that jurisdiction. Nothing in this report constitutes legal, accounting or tax advice or individually tailored investment advice. This material is prepared for general circulation to clients, including clients who are affiliates of Royal Bank of Canada,
and does not have regard to the particular circumstances or needs of any specific person who may read it. The investments or services contained in this report may not be suitable for you and it is recommended that you consult an independent investment advisor if you are in doubt about the suitability of such investments or services. To the full extent permitted by law neither Royal Bank of Canada nor any of its affiliates, nor any other person, accepts any liability whatsoever for any direct or consequential loss arising from any use of this report or the information contained herein. No matter contained in this document may be reproduced or copied by any means without the prior consent of Royal Bank of Canada. Additional information is available upon request.
To U.S. Residents: This publication has been approved by RBC Capital Markets, LLC, Member NYSE/FINRA/SIPC, which is a U.S. registered broker-dealer and which accepts responsibility for this report and its dissemination in the United States. RBC Capital Markets, LLC, is an indirect wholly-owned subsidiary of the Royal Bank of Canada and, as such, is a related issuer of Royal Bank of Canada. Any U.S. recipient of this report that is not a registered broker-dealer or a bank acting in a broker or dealer capacity and that wishes further information regarding, or to effect any transaction in, any of the securities discussed in this report, should contact and place orders with RBC Capital Markets, LLC. International investing involves risks not typically associated with U.S. investing, including currency fluctuation, foreign taxation, political instability and different accounting standards.To Canadian Residents: This publication has been approved by RBC Dominion Securities Inc. RBC Dominion Securities Inc.* and Royal Bank of Canada are separate corporate entities which are affiliated. *Member-Canadian Investor Protection Fund. ®Registered trademark of Royal Bank of Canada. Used under license. RBC Wealth Management is a registered trademark of Royal Bank of Canada. Used under license.RBC Wealth Management (British Isles): This publication is distributed by Royal Bank of Canada Investment Management (U.K.) Limited and RBC Investment Solutions (CI) Limited. Royal Bank of Canada Investment Management (U.K.) Limited is authorised and regulated by the Financial Conduct Authority (Reference number: 146504). Registered office: Riverbank House, 2 Swan Lane , London, EC4R 3BF, UK. RBC Investment Solutions (CI) Limited is regulated by the Jersey Financial Services Commission in the conduct of investment business in Jersey. Registered office: Le Gallais Chambers, 54 Bath Street, St Helier, Jersey JE4 8YD, registered company number 119162.To Hong Kong Residents: This publication is distributed in Hong Kong by Royal Bank of Canada, Hong Kong Branch which is regulated by the Hong Kong Monetary Authority and the Securities and Futures Commission (‘SFC’), RBC Investment Services (Asia) Limited and RBC Investment Management (Asia) Limited, both entities are regulated by the SFC. Financial Services provided to Australia: Financial services may be provided in Australia in accordance with applicable law. Financial services provided by the Royal Bank of Canada, Hong Kong Branch are provided pursuant to the Royal Bank of Canada’s Australian Financial Services Licence (‘AFSL’) (No. 246521).
To Singapore Residents: This publication is distributed in Singapore by the Royal Bank of Canada, Singapore Branch, a registered entity granted offshore bank licence by the Monetary Authority of Singapore. This material has been prepared for general circulation and does not take into account the objectives, financial situation, or needs of any recipient. You are advised to seek independ-ent advice from a financial adviser before purchasing any product. If you do not obtain independent advice, you should consider whether the product is suitable for you. Past performance is not indicative of future performance. If you have any questions related to this publication, please contact the Royal Bank of Canada, Singapore Branch. Royal Bank of Canada, Singapore Branch accepts responsibility for this report and its dissemination in Singapore.
© 2016 RBC Capital Markets, LLC - Member NYSE/FINRA/SIPC© 2016 RBC Dominion Securities Inc. - Member Canadian Investor Protection Fund © 2016 RBC Europe Limited© 2016 Royal Bank of CanadaAll rights reserved