SZENT ISTVÁN UNIVERSITY DOCTORAL SCHOOL OF MANAGEMENT …
34
0 SZENT ISTVÁN UNIVERSITY DOCTORAL SCHOOL OF MANAGEMENT AND BUSINESS ADMINISTRATION ANALYSIS OF DISASTER MANAGEMENT USING COST-BENEFIT ANALYSIS, MOST NOTABLY FOR TECHNICAL RESCUE AND FIREFIGHTING OPERATIONS Summary of Ph.D dissertation theses Linda Szőke Gödöllő 2020
Transcript of SZENT ISTVÁN UNIVERSITY DOCTORAL SCHOOL OF MANAGEMENT …

0
SZENT ISTVÁN UNIVERSITY
DOCTORAL SCHOOL OF MANAGEMENT AND BUSINESS
ADMINISTRATION
ANALYSIS OF DISASTER MANAGEMENT USING COST-BENEFIT
ANALYSIS, MOST NOTABLY FOR TECHNICAL RESCUE AND
FIREFIGHTING OPERATIONS
Summary of Ph.D dissertation theses
Linda Szőke
Gödöllő
2020

1
Doctoral School: Doctoral School of Management and Business Administration
Scientific scope: Management and business administration
Head of school: Prof. Dr. Zoltán Lakner PhD
University lecturer, doctor of MTA,
SZIU, Faculty of Food Sciences,
Department of Foodstuffs Industry Economy
Supervisor: Prof. Dr. Csaba Makó
University lecturer, doctor of MTA (DSc.)
SZIU, Faculty of Economics and Social Sciences
Institute of Economics, Law and Methodology
Co-supervisor:
Prof. Dr. István Bukovics ret. gf. major general
University lecturer, doctor of MTA (DSc.)
NUCS Faculty of State Sciences and Public Governance
Institute of Professional Governance and Policy
………………………………
Head of school’s signature
………………………………………………
Supervisor’s signature

2
CONTENTS
1 PRIOR ARRANGEMENTS AND GOALS ........................................................................... 3
2 SOURCE AND METHOD ..................................................................................................... 5
2.1 Benchmarking ................................................................................................................... 5
2.2 Making reports .................................................................................................................. 5
2.3 Pearson’s correlation / analysis of relations ..................................................................... 6
2.4 Forecasts, trend analysis ................................................................................................... 6
2.5 Structuring the CBA model .............................................................................................. 7
3 RESULTS ................................................................................................................................ 9
3.1 Analysis of correlation within data related to agri- and sylvicultural disasters (Pearson’s
correlation) ................................................................................................................................ 15
3.2 Specifics of the CBA model, practical applicability ...................................................... 22
3.3 New scientific results ...................................................................................................... 27
4 CONCLUSIONS AND SUGGESTIONS ............................................................................. 28
5 SOURCES ............................................................................................................................. 30
6 PUBLICATIONS WITHIN SCOPE OF THE THESIS ....................................................... 32

3
1 PRIOR ARRANGEMENTS AND GOALS
When writing this dissertation, author wished to know how today’s special challenges affect the
system of disaster management and prevention, most notably its highest authorities (National
Directorate General for Disaster Management, and county offices). Said special challenges are:
economic, environmental and social processes, as is the case for all economic organisations.
Analysing economic processes was conducted along investment planning and process specifics.
Environmental analysis was conducted for the effect of climate change on the organisation’s
daily operations. Managing disaster relief, reconstruction after disaster and hazard situations, and
the efficiency of restoration are also important from a social perspective. The organisation
handles the security and relief of lives, critically important infrastructure, living areas,
workplaces and other important things necessary for everyday life.
Conducting this highly important set of tasks has to be uninterrupted, while the state has to make
sure that any and all tools and resources necessary for their operations is present at all times.
Since usually, resources are in limited supply, the organisation is obliged to economise properly,
and should be cost-efficient. During the analysis, the author aimed to identify the anomalies
within the system, and places where further potential for development exists. There may be
many opportunities in employing mathematical- statistical methods as well. The organisation
wouldn’t even need to bring in large volumes of new resources, as even today, precise data
collection is conducted during everyday tasks. This would necessitate maybe a small change or
two.
The first goal (C1) was to evaluate the adaptation level of the cost-benefit analysis (CBA) for the
investments of the National Directorate General for Disaster Management (NDGDM) into
organisational development. As an extension to this, author analysed the preceding project
planning documentation made by the organisation. The author’s perspective was the application
of CBA methodology, and calculation methods usable for estimating and monetising
externalities. For this goal, author’s first hypothesis (H1) states that the NDGDM’s usage of
CBA methodology regarding development investment projects adheres to the regulations of the
European Union, but by using novel planning- and forecast approaches, improvements can be
made regarding the efficiency of considering externalities.
Author’s second goal (C2) was to estimate the externalities within the disaster relief system, and
the methods and opportunities of internalising said externalities in the future. Author conducted
analysis for this goal using a special variation of the benchmarking method, which helped with

4
identifying the externalities hiding within the system. The second hypothesis (H2) related to this
is that a multitude of external effects are generated into the operation of disaster management,
due to its wide berth and operational specifics.
Goal three (C3) was the statistical analysis of fire cases and technical relief cases’ number and
nature between 2012 and 2017. The author was looking to adapt the results of statistical analyses
and observable trends to the planning of organisational development projects affecting daily
operations. This necessitated the use of various mathematical- statistical methods, such as
reporting, and trend analysis to validate H3. Hypothesis 3 states that conducting damage control,
and its efficiency needs to obtain a pivotal role in the future, as the effects of weather impact are
becoming more and more serious, making disasters and hazards increase in frequency. Relieving
these, and managing the damages caused will put severe stress on state budget in the future.
Finally, fourth goal (C4) was to identify the disasters and hazards impacting agri- and forestry as
sectors of national economy. The intention was finding cause-effect relations and incorporating
them into organisational planning. This process was meant to support my fourth hypothesis (H4):
By integrating statistical analysis methods, the reliability of disaster management’s decision
assisting systems can be increased, specifically for planning the costs of technical rescue and
firefighting operations.

5
2 SOURCE AND METHOD
In the following chapter, author would like to present the methods used for analysing the various
hypotheses.
2.1 Benchmarking
Benchmarking analysis, as mentioned above, was used to identify the externalities by employing
a special type of benchmark process. The main dimensions of analysis (for the area of Hungary)
in light of this were the vehicle and machine fleet, constructed environment and capacity for
intervention within the analysis scope. We can consider the various indicators’ benchmarking
results’ determining effect on development potential level, or restructuring necessity of the
sector’s partial analysis areas a sub-hypothesis of the analyses. The author analysed the
economic, technological, social and environmental indicator groups separately for all segments,
by which the characteristics of intervention type and necessity were obtained. The attribute
characters with a value of 0 were considered generic requirements. This made system attributes
with negative values (-2 and -1) representatives of disadvantageous structure, and generate
negative externalities. Attributes with positive values were deemed useful system elements
which can be developed further easily, and come out as positive externalities for the analysis
scope. After summarising the results, conclusions about the aspects, and within them, analysis
dimensions amassing negative or positive externalities in the future becomes possible for the
sector. After recording the basic tables, indicators were assigned with a state indicator and a
performance indicator each. Using the indicators, the initial state and the “results” for the goals
can be compared to each other, and evaluated. In the second phase of the analysis process, CBA
calculations were matched to the analysis dimensions, and externalities aggregated within the
sectors during benchmarking. Author primarily linked these to indicators showing extreme
externality values. During benchmarking, a CBA approach to analysing mostly very
disadvantageous negative (containing lots of negative externalities), or very advantageous
positive (containing lots of positive externalities) attributes.
2.2 Making reports
Making reports served to assist author in validating the assumption, according to which climate
change caused extreme weather and temperature conditions, which increased the number of field
operations the disaster relief system had to conduct in recent years. In order to gain insight into
this, author used the database of NDGDM’s field work (firefighting and technical relief reports
are regulated forms made on-site where the relief process took place). This database held all field
operations from between 2012 and 2017. The database included all data registered during a field
6
operation into the report. First off, author cleaned the database, and removed all data irrelevant
of the analysis. These were: type of field operation, place of field operation (county), time of
field operation (year, month), nature of disaster, type of location, and nature from national
economic perspective. The type of field operation may be firefighting or technical relief. In the
next part of the analysis, author analysed the data of different counties. The aim was to find
which county is hit with what kind of disaster the most. This necessitated the analysis of nature
of disaster (this was only recorded for technical relief operations, examples are: wildlife
accidents, lifeguarding, natural disaster, etc.), as well as type of location (examples: public area,
public road, agricultural institution, etc.) and the nature from national economic perspective
(sector of national economy hit, f.e.: agriculture and forestry, industry, transport, etc.). Reports
were made using these data, which were used by author to find out how many field operations
related to extreme weather conditions were conducted between 2012 and 2017 annually, who
were the victims of the disaster (private individual, government and municipality, enterprise,
etc.), and which sector of national economy was hit (industry, agriculture, state and municipality,
transport, etc.). I wished to use these reports to get a clear picture on weather anomalies, and to
find trends possibly influencing the operations of the organisation, and national economy.
Finally, in order to create a model, the goal was to select a notable sector of national economy.
This sector then needed further statistical analyses and cause-effect pairs to be identified in
relation to it.
2.3 Pearson’s correlation / analysis of relations
Author conducted the Pearson’s correlation analysis in Microsoft Excel, where Pearson’s
correlation coefficient is calculated without r dimension (values between -1.0 and 1.0, including
border values). This serves to determine the closeness of linear correlation between two data
sets. During the research, author wished to find the connection between field operations of fire
stations on farm and agricultural and forestry disasters and their operational areas, and the size of
agricultural areas within the county in question. Similarly, I wished to find the relation between
field operations and weather conditions (rain, temperature, etc.). I also analysed if there’s a
relation between number of field operations, and number of agricultural enterprises, furthermore,
value of realised agricultural investments’ performance values.
2.4 Forecasts, trend analysis
In the current analysis phase, author worked with the function of the Excel forecast, which uses
known current values to result future values. The value forecast is the y parameter of the x value.
Known values are x and y values, new values are obtained via linear regression. During the
analysis, author prepared three scenarios from the number of field operations. The function was

7
later used to analyse changes in various expenditures of the budget, HR changes and resource
usage changes.
2.5 Structuring the CBA model
The point of modelling is to find the most notable attributes of the system I’d like to model, and
use them to create a similar system. However, I must note the system attributes which validate
my model, and its framework limitations during the process.
Step 1: The first step is always to identify and describe the problem. In our case, the model
attempts to answer how the organisation can adapt to the current climate, weather and economic
trends, taking the opportunities of cost and benefit perspective into consideration when planning
development investments. Therefore, the main problem is how the organisation’s decision
methodology related to their development investments doesn’t necessitate the cost and benefit
perspective unconditionally. This is due to how the organisation is one very important for
society. However, as a state institution, the economic rationale when using public financing
should be just as important as exceptional performance during conducting tasks. This will be the
primary financing source of the organisation in the future, after all. Another interesting point is
that cost and benefit methodology is only used in its simplified form, or with limitations for
development projects financed by tenders. Therefore, we may assume that the system generates
several externalities, which will turn out to be inhibitors of efficient and economically sound
operations in the long-term.
Step 2: The next step in the modelling process is current state analysis, during which author
analysed the main system attributes, and attempted to see into the operations of the organisation
in detail, as much as possible. The experts of NDGDM were of great help in this. In order to
facilitate this process in practice, a research cooperation supported by the Scientific Committee
of Internal Affairs and the NDGDM was established. The author was allowed to conduct
interviews with the leaders of the organisation, and access to some internal documentation. Both
were used while creating the model. In this phase, processes and main components, and actors, in
addition to the interval of the analysis (2012 to 2017) were all identified. To somewhat avoid the
complexity trap, author found it reasonable to conduct a separate analysis of a sector of national
economy (agriculture and forestry), which is the case study of this dissertation.
Step 3: The next step constitutes a more complex process, as this is where the system-specific
basic function of the CBA is introduced. This includes the scope of expenditures and benefits, as
well as the data related to field operations and their trends related to climate change and
economic trends, for scenario structuring.

8
All these serve as the basis for a current value calculation, where all information impacting the
three basic elements at the same time need to come together.
The basis of the C-B function = current practice (business as usual-BAU) analysis, and
determining factors changing it.
Figure 1 shows the structure of the theoretic model:
Figure 1 – Structure of the calculation model
(Source: self-made, 2019)
The function has three components:
1. The sum of all interventions and organisational behaviour that relate to long-term
decisions: R+D activities, strategic paths.
2. The sum of factors influencing annual organisational operations. This constitutes a basic
expenditure function, which is influenced by the annual decisions, and the decisions of
the previous period. (; C-B analysis)
3. Balance of indirect effects.
The type of the current model can be considered an economic model according to the
phenomenon analysed, which aims to replace the operation of the disaster relief organisational
system as a complex unit, in a simplified form. Also, due to certain similarities, it could be used
to analyse the organisation as well. As it attempts to take various random factors into
consideration, it’s stochastic, whereas due to the volatility of the time dimension, it’s dynamic –
a system changing at the same time. Fundamentally, the system is process-oriented, as it’s based
mostly on cause-effect relations and mathematical equations.
-Change in
operating costs+- Indirect effects
sector county usage time
Wealth management
Jelenlegi tervezés információs rendszere
Basic model structure of a calculation model
C-B=
-(B0+-Balance of
current change in
assets affected by the
+ Σ Σ ΣRevenue
change
Information by type
Value of salvaged
assets per loss
eventOthers Others Externalities
Project
Management
Temperature Sector information Social discount rate
Basic equipment Basic equipment Benefits Capacity Benefits Precipitation
Volunteer staff Coordination Weather data Operational datas Useability time
Vehicles Vehicles SterngthNational, county
dispersionStrength
Central
management
administration
system Hungary's
budget, the
theoretical
distribution
system
Investment data Operating informations Historical data series General
Cost of new assets Machinery Manpower Building
Current planning information system

9
3 RESULTS
In this chapter, analysis results for the various hypotheses will be introduced.
H1 was: The NDGDM’s usage of CBA methodology regarding development investment
projects adheres to the regulations of the European Union, but by using novel planning- and
forecast approaches, improvements can be made regarding the efficiency of considering
externalities. In order to analyse this, author used project documents and professional material
using document analysis, and came to the conclusion that there’s points to improve the cost-
benefit analysis methodology from the perspective of managing externalities. The analysis of
H2 comes in right away, which states: a multitude of external effects are generated into the
operation of disaster relief, due to its wide berth and operational specifics. The benchmarking
analysis’ results on this are shown in Table 1 below:
1. Table: Summary of the benchmarking of indicator group on transport, vehicle and
machinery fleet
Transport, vehicle and machinery fleet No.
Analysis period
(2012-2017) Future period
Technological / Social
1 -2 -1
2 -1 0
3 -2 -1
Environmental
4 -1 0
5 +2 +2
6 -1 -2
Economic
7 -1 -1
8 -1 -2
9 +1 +1
Net positive externalities ∑ (1;9) -6 -4
Total externalities ABS (1;9) 12 10
Effect of net positive externalities within
total external effect 0% 0%
(Source: self-made, 2018)
In terms of the analysis conducted, main system attributes of the transport / vehicle fleet
were as follows (Table 1): In light of the analysis of the specific analysis of the energy mix

10
used, the author states that these indicators generally show an almost exclusive use of
fossilised energy sources. The next period likely won’t change much in this regard either. The
generic quality level and usability of the technical tools and machinery is overall low, though
the recent tender project for vehicle hoses caused a significant improvement within the
system.
The usage of renewable energy resources may bring change for the fleet serving the human
resource, in case this is also a priority target for development and strategic planning. The
average age of the vehicle fleet shows an improvement in tendency, however, still
unsatisfactory. The usage of development resources is the most notable in this area though.
This is due to having to take the future conservation of quality level into consideration as
well, and the aim is to keep this economically as sustainable as possible (parts and
components are manufactured in Hungary).
Thanks to procuring new vehicles, the emission of hazardous materials in the sector decreased
significantly, which also suggests further improvement in the future. It’s important to note
that the extreme weather conditions generated by climate change increased the ratio of
conducted field operations significantly. The acclimatisation strategy of the disaster relief
sector is sufficient in this regard. There is also significant demand for life- and property
preservation systems, which generated strong incentive to invest in recent years. This,
however, may decrease in the following period, if the pace of realisation is kept. Introduction
of new systems has a positive effect on labour market processes, since continuous demand for
labour is generated.
Furthermore, the development of current human resource is also continuous, thereby creating
quality expert employees. However, it’s important to note that this part of the organisation
only received state financing to the point where needs aren’t met, as such, the organisation
needs to apply alternative methods. An example is the presence of volunteer firefighter
communities. These communities, just like those operating in other relief sectors (volunteer
reserve system in the military) conduct field operations that the capacity of the organisation is
insufficient for. This also reduces their expenditures.

11
2. Table: Summary of the benchmarking of indicator group on constructed
environment
Constructed environment
No.
Analysis period
(2012-2017) Future period
Technological / Social
1 0 0
2 -1 -1
3 -1 0
Environmental
4 -1 -1
5 -1 0
6 -1 -1
Economic
7 -1 -1
8 -1 0
9 +2 +2
Net positive externalities ∑ (1;9) -5 -2
Total externalities ABS (1;9) 9 6
Effect of net positive externalities
within total external effect 0% 0%
(Source: self-made, 2018)
In terms of the analysis conducted, main system attributes of the constructed environment
were as follows (Table 2):
As usual, the first indicator (similarly to the previous group) is the ratio of using non-
renewable energy sources. Thanks to the organisation’s Sustainability Plan, more and more
elements related to this are within the system. Selective management of waste is continuous,
so is recycling. These are conducted in cooperation with other authorities (police, institutions
of judicial system). However, the usage of renewable systems is not frequent, which serves as
a concern for the future, as preparation for cases where there won’t be subsidiary sources for
operational and other expenditures is a must. However, there are interventions in this area
intending to increase efficiency in this area as well. State institutions need the improvement of
securing supply, where one of the most efficient method would be to prepare these institutions
and organisations to be self-sufficient (f.e. installing solar battery systems, finding cleantech

12
solutions, etc.). The usability and technical quality level of buildings are rather low, however,
is improving following the availability of resources. It would be best to plan these investments
while taking the abovementioned perspective into consideration as much as possible, which
would also improve the amount of positive externalities.
According to the Sustainability Plan, this area also showed notable improvements in terms of
energy efficiency and recycling. The ratio of these improvements are also expected to
increase in the future (building operation / upkeep developments). These initiatives have an
effect on the opportunities for decreasing emission rates related to the specific system
element. Using the abovementioned green systems, this could be made significantly more
efficient in the future. In the organisational management of disaster relief, communication
elements supporting sustainability initiatives are already present. Recycling and selective
collection of waste is already a focus, all institutions within the sector encourage their
employees to use these systems every day.
The increased rate of field operations in this system element also generates various demands
that similarly to the case of the vehicle park, means excess loads on the organisation’s, and by
extension, the state’s budget. However, each and every realised development improves this
ratio, as operating the newly created systems is much more economically efficient due to the
increased efficiency – which also helps the optimisation of expenditures.
In this case, we can consider the fact that these developments are inevitable positive, since
the demands of society for systems created and efficiently operated for life- and wealth
security significantly increased. The current systems are out of date to support this. This is
basically a self-sustaining process, as demands generate investments, for which the European
Union and the state habitually offer subsidy, after which the installed modern technological
solutions and infrastructure help cost-efficient operation within the disaster relief sector,
thereby optimising the ratio of costs and benefits.
13
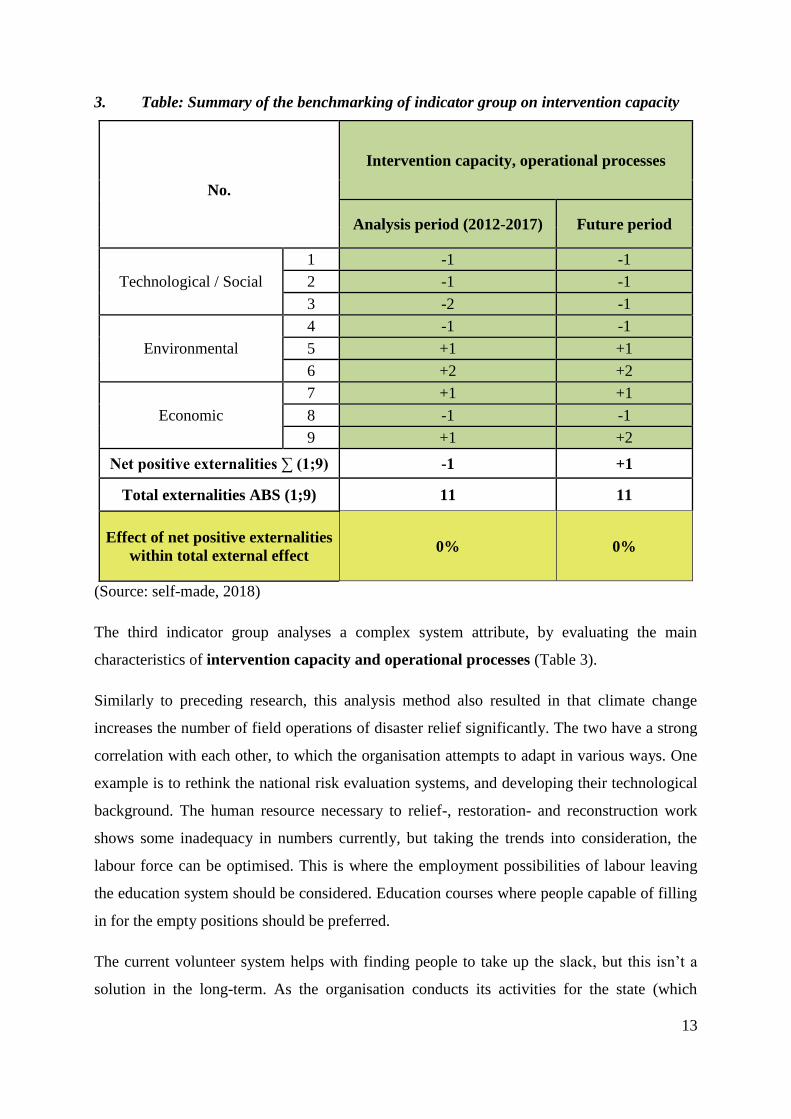
3. Table: Summary of the benchmarking of indicator group on intervention capacity
Intervention capacity, operational processes
No.
Analysis period (2012-2017) Future period
Technological / Social
1 -1 -1
2 -1 -1
3 -2 -1
Environmental
4 -1 -1
5 +1 +1
6 +2 +2
Economic
7 +1 +1
8 -1 -1
9 +1 +2
Net positive externalities ∑ (1;9) -1 +1
Total externalities ABS (1;9) 11 11
Effect of net positive externalities
within total external effect 0% 0%
(Source: self-made, 2018)
The third indicator group analyses a complex system attribute, by evaluating the main
characteristics of intervention capacity and operational processes (Table 3).
Similarly to preceding research, this analysis method also resulted in that climate change
increases the number of field operations of disaster relief significantly. The two have a strong
correlation with each other, to which the organisation attempts to adapt in various ways. One
example is to rethink the national risk evaluation systems, and developing their technological
background. The human resource necessary to relief-, restoration- and reconstruction work
shows some inadequacy in numbers currently, but taking the trends into consideration, the
labour force can be optimised. This is where the employment possibilities of labour leaving
the education system should be considered. Education courses where people capable of filling
in for the empty positions should be preferred.
The current volunteer system helps with finding people to take up the slack, but this isn’t a
solution in the long-term. As the organisation conducts its activities for the state (which

14
activities are getting more numerous and complex due to climate change and other trends)
focused at securing and protecting human life and infrastructure of critical importance, it
needs a professional competence. No errors are tolerated, since a small error or miss may
result in more and more serious consequences.
Though Hungary is a low-risk and disaster level area, the industrial disasters happening in
relation to economic growth, and environmental causes can’t be neglected. In the future, the
number of these is assumed to increase. In order to monitor this trend, the risk diagram of
Hungary is made annually as part, and a cornerstone of the risk evaluation system. Being an
element of the disaster relief system, the freshly developed risk management system employs
a variety of modern information technology tools, as such, the efficiency of this system
element is also constantly increasing. As a direct effect, intervention capacity and operational
processes are also constantly improved.
Therefore, the efficiency of the organisation in reducing the environmental effect of disasters
is currently on an acceptable level, and further improvement can be expected in the future. In
order to further increase the efficiency of disaster relief systems, the various security systems
also have a pivotal role. These are constantly being made and cover more and more of our
natural and constructed values. In summary, we can state that resources for prevention are
increased consistently, thanks to the relevant European Union and national strategic
programmes. But at the same time, the severity of disasters is also increasing constantly, as
gradually degrading tendencies are hard to follow for the pace of realising investments. This
means we’re at a constant disadvantage here, and sadly, natural processes always have an
edge. The civilian protection mechanism of the European Union is based on the principle of
joint responsibility, which also takes its part in increasing the security levels of various
Member States. The legal basis for joint disaster relief cooperation is the 196.th paragraph of
the Treaty of Lisbon. In accordance with the treaty, the European Union extends the
capacities of Member States as necessary, helps with coordination, and increases the
efficiency of joint intervention. By improving the preparation level, making preparatory
interventions, subsidising development related to these, assisting cooperation and creating a
joint financial foundation, the European Union contributes to the rationalisation of Member
States’ disaster relief systems.
The disaster management system is a very important and complex target from all
perspectives, which is why author made it the topic of this dissertation. When the analysis was

15
begun, author had several ideas on its operation, defined from the perspective of a non-expert
individual. However, as the analysis kept going, author received information en-masse which
were gathered during the deep interviews, the expert meetings and the analysis of
organisational data and literature on the topic that made author think the topic over once
again. It’s interesting how an organisation operating on such an important area isn’t free of
externalities either, even more so as the system has a large amount of them, a fact proven by
the results of this dissertation’s expert benchmark analysis. In conclusion, we can say that for
the disaster relief system, there are smaller ‘system errors’ we can observe. In accordance
with the rest of the governmental budget’s organisations, everyday operations are planned
along specific perspectives. This includes possibly development paths as well. This often
happens out of their control, as many an external process affects the system, which are hard to
immediately adapt to. Furthermore, as Hungary is a Member State of the European Union, the
scope of subsidy sources is also a given. This means that actualising system development
plans isn’t always constant, and though attempts to adapt to the trends at the time, often
development is being made in areas that have a subsidy source to begin with. These processes
are further highlighted by how the time to adapt to changes brought by climate change is
getting shorter and shorter as well. This first needs a European Union-level strategy created,
after which national action plans have to be created. All these have a long and bureaucratic
process that needs to be finished prior. However, if acclimatisation initiatives only begin that
late, there are often various changes that concluded in the meantime, within the natural and
the social environment, thereby generating even more externalities within the economic
systems.
3.1 Analysis of correlation within data related to agriculture and forestry disasters
(Pearson’s correlation)
This part is related to the fourth goal (C4), which is to identify the disasters and hazards
impacting agri- and sylviculture as sectors of national economy. The intention was finding
cause-effect relations and incorporating them into organisational planning. This process was
meant to support my fourth hypothesis (H4) stating that by integrating statistical analysis
methods, the reliability of disaster relief’s decision assisting systems can be increased,
specifically for planning the costs of rescue and firefighting field operations. The disaster
prevention organisation system is a complex area in and of itself, but the processes of analysis
are further complicated by the complexity of national economy sectors affected. Due to this,
in this phase of the analysis, author found it reasonable to handle sectors that make the

16
identification of cause and effect relations easier separately. In accordance with author’s
education and previous professional experience, author chose to analyse the disaster
occurrences that hit agri- and sylviculture. Another reason was that the sector has a large
share within economic systems.
One of the pillars of modelling is to correctly identify the fundamental relations, which needs
mathematical statistical methods. Of these, author chose Pearson’s correlation method, as
after conducting this analysis, the ratio of correlation between factors and the effect (negative
or positive correlation) as well. This is signified by the correlation coefficient (r). Author also
checked the value of determinacy coefficient (r2), which shows how the change in one factor
changes the other’s value, which aids in creating the forecast processes. As such, for example:
for an r=30 value, r2=0.09, meaning forecasting the dependent from the independent variable
is only possible to an extent of 9%. The importance of this fact is not to be underestimated, as
one of the main goals of the model to be made is to possibly adapt forecasts into the planning
system. During the research, author aimed to find the relationship between the field operations
of fire stations related to agri- and sylvicultural areas and their operative locations, and the
size of agricultural areas within the county. Furthermore, another target of correlation analysis
was between field operations and weather conditions (rain, temperature, etc.). Furthermore,
author analysed if there’s a relation between the number of field operations and agricultural
enterprises, and the performance values of investments realised in the sector. In order to
conduct the analysis, author used data of the MIA NDGDM’s database, and the database of
the HCSO. Both databases offer precise and reliable data, which makes the results of analyses
conducted using them the same. It’s important to note that during the research, author only
analysed on the field of disasters impacting agri- and sylviculture, not all disasters. Therefore,
in the following part, when using the term “field operation”, only the cases mentioned above
are relevant.
Figure 2- Analysis of county size and field operation numbers’ correlation
(Source: self-made, 2019)
y = 4,1834x + 3273,8 R² = 0,3147
0
2000
4000
6000
8000
10000
0 200 400 600 800 1000 1200
AC
ou
nty
siz
e k
m2
Number of deployments, average

17
Pearson’s correlation value: 0,560988154
r2=0,3147077
This analysis was meant to evaluate the correlation between the size of the county in question,
and the field operations conducted within it, after author calculated averages for the field
operation data between 2012 and 2017. We can see (Figure 2) that in this case, the correlation
strong, but has a relation with the next analysis element because the size of counties also has a
strong correlation with the size of agricultural area within the given county.
Figure 3- Analysis of county agricultural areas’ size and field operation numbers’
correlation
(Source: self-made, 2019)
Pearson’s correlation value: 0,556343748
r2= 0,309518366
According to author’s prior assumption, the larger a county’s agricultural areas’ size is, the
more the disasters impacting the local agriculture are. This assumption is correct, according to
the results of Pearson’s correlation analysis, due to the strong relation between the two
variables (Figure 3). This means that in counties where agriculture is a dominant sector,
prevention of fires impacting the agriculture should be treated as a priority.
Figure 4- Analysis of number of listed agricultural enterprises and field operation
numbers’ correlation
(Source: self-made, 2019)
Pearson’s correlation value: 0,212282117
r2=0,04506369
R² = 0,3095
0,0
500,0
1 000,0
0 1000 2000 3000 4000 5000 6000 7000 8000
Size
of
agri
cult
ura
l ar
eas
ha
Number of deployment
y = 1,3327x + 454845 R² = 0,0451
440 000450 000460 000470 000480 000
0 1000 2000 3000 4000 5000 6000 7000 8000
Nu
mb
er
of
liste
d
agri
cult
ura
l e
nte
rpri
ses
d
b
Number of deployment 2013-2017

18
When analysing this correlation, author first thought that there might be some kind of
connection between the two variables, however, as seen on results, this is extremely weak
(Figure 4). The reason is that not only classic farmers belong in this group, but the entirety of
the agribusiness sector, which also encompasses the trade units and the export-import
enterprises. These deal with agricultural produce, however, have no relation to the disasters
impacting the sector, treated under a different categorisation in the NDGDM database.
Figure 5- Analysis of performance value of national economy investments and field
operation numbers’ correlation
(Source: self-made, 2019)
Pearson’s correlation value: 0,749503892
r2= 0,56175608
According to author’s speculation prior to the analysis, a strong correlation was assumed,
which turned out to be true. However, author was somewhat surprised at the underlying
reason. The results of the analysis (Figure 5) necessitated some further information gathering,
as author thought that the result of the correlation between the two variables will be negative.
After author checked on the cause and effect relation, surprisingly, disasters themselves
generate new investments, meaning instead of preventative development being done, a post-
fact replacement of the tools and properties hit by the disaster is happening. However, author
believes that after a while, this relation will turn itself around, once a certain technological
development level is reached. This means that once the more secure and efficient
technological solutions are available, the number of agricultural fires will decrease.
Correlation between amount of rain in given area and the month’s highest temperature
values, and the number of field operations
The analysis of the following correlation was conducted by taking the average of the
measurement stations in three counties for three years (2015 – 2017), to which field operation
data was normalised with the same method. The values resulting for the analysis are listed
below (Figures 6 and 7):
R² = 0,5618
0
100 000
200 000
300 000
400 000
0 1000 2000 3000 4000 5000 6000 7000 8000
Pe
rfo
rman
ce v
alu
e
of
nat
ion
al
eco
no
my
inve
stm
en
ts
MH
UF]
Number of deployment 2014-2017

19
Rain:
Figure 6- Analysis of amount of rain and field operation numbers’ correlation data
(Source: self-made, 2019)
Pearson’s correlation value: -0,188386
r2=0,0355
Temperature:
Figure 7- Analysis of temperature values’ and field operation numbers’ correlation
(Source: self-made, 2019)
Pearson’s correlation value: 0,2480308
r2= 0,06152
According to author’s opinion, the result where the more rain in the given area, the less cases
of fire can be observed is no surprise. This means the two variables correlate inversely.
However, in spite of how this seems evident, the analysis showed a really week correlation in
this area. However, the exact opposite happens for the temperature variable, as a strong
correlation between the hot temperature days and the number of agricultural fires can be
observed. This is where we need to note the determinacy coefficient, which shows that
temperature data can be used to forecast firefighting cases in 45%.
R² = 0,0355
y = -0,1807x + 52,007
0
20
40
60
80
100
120
0,00 20,00 40,00 60,00 80,00 100,00 120,00 140,00
Am
ou
nt
of
rain
mm
Number of deployment 2015-2017
R² = 0,0615
y = 0,0788x + 22,746
0,00
10,00
20,00
30,00
40,00
50,00
0,00 20,00 40,00 60,00 80,00 100,00 120,00 140,00
Max
imu
m
tem
pe
ratu
re °
C
Number of deployment 2015-2017

20
In the next analysis phase, a smaller, more exact analysis area was separated. In this part, the
budget data of the Bács-Kiskun County Disaster Management Office, and the agricultural and
forestry firefighting cases and technical relief operations’ numbers were taken into the
analysis. The notable data on incomes and expenditures came from official data from the
budget reports. The analysis still concentrates on the input data necessary for the modelling
process, and acts as support in identifying relevant relations.
Investments, renovations
The analysis of correlation between investments and renovations brought the following
results. The value of r2 shows us that using the change in number of cases, we can forecast the
necessity of investments to roughly 40%. Therefore, we can similarly determine the necessity
of increasing or decreasing subsidy required for this process. Though these processes are not
always so obvious, and an increase in subsidy sources isn’t always possible either, it seems
that the organisation aims to supply their own demands.
Pearson’s correlation value: 0,631355478
r2= 0,39860973
Next, author similarly analysed the correlation between processes in terms of the various
system elements as well.
Machinery, tools, appliances, vehicles
In the case of the abovementioned objects, the results obtained by author are completely
logical. It is obvious that due to their nature, these elements have a long life cycle, and may
not follow the number of field operation cases. Naturally, the positive nature of the correlation
is obvious, as the higher the use ratio, the higher the level of amortisation, and there are parts
and units within some machinery which are subject to routine replacement, which have to be
replaced after each field operation. However, the expenditures in this area are usually
calculated as fixed costs.
Pearson’s correlation value: 0,072208043
r2= 0,005214
Manpower
In the case of manpower, author analysed the various employment levels separately. It’s
clearly visible how the table of the leading personnel is constant to a certain level, however,
the increase in field operation number also necessitates the increase in leading personnel

21
numbers (Table 4). The reason for this is that when trying to handle more and more complex
challenges, you need to have leading experts with lots of experience to coordinate. The
decrease of non-leader employees and public servants can be attributed to the number of field
operations and personnel allocation, and the optimal design of a proper technological mix.
Table 4- Correlation between employed number and field operations
Employed number and field operations (Pearson’s correlation)
Leader 0,996989906
Non-leader -0,274189185
Civil servant -0,996989906
(Source: self-made, 2019)
Properties, and related financial rights
In terms of properties, the correlation analysis resulted in a negative weak relation. This
clearly mirrors the truth, because we can say that the subsidy the organisation can receive is
limited. Meaning, in order to finance the increased expenditures due to the number of field
operations increasing, they need to retrieve the resources from a different department. As the
state of properties has no direct impact on the completion of field operations, similarly to
many other cases, the renovations on said buildings are postponed. Growth can only be
achieved and observed in case some other sources can be introduced (tenders, other subsidy
sources). In other cases, property management compels the lease or selling of properties.
Pearson’s correlation value: -0,131116782
r2= 0,01719161
Volunteer organisations
For volunteer organisations, author evaluated various elements separately, since the financing
of said organisations is mainly done from tender sources offered to them by the NDGDM.
Maintaining volunteer organisations is a very cost-efficient solution for them, which is why
the number of said organisations is increasing. This means that in smaller, less hazardous
cases, instead of the professionals, volunteers can be sent on-site. This, on the one hand, helps
manage the lack of personnel, and on the other hand, by creating these volunteer
organisations, optimal dislocation can be worked out as well. In the table below (Table 5), we
can see the financing framework of recent years for the volunteers of Bács-Kiskun. However,
this isn’t the full financing framework, author only highlighted the elements which have a
direct connection to conducting field operations. These are system elements which increase in

22
proportion to the increase of field operations. We can also see this in the results of the
correlation analysis, which means that if we present the result using the value of r2, the change
in field operation number can be used to forecast the necessity of these tools in 100%.
Table 5- Correlation between VOs’ financing sources and number of field operations
Financing for fire truck
machinery, repair and
evaluation, BM HEROS Co.
Ltd.
Firefighting
technical
tools
Suction- and pressure-
side equipment
Handheld tools
and other
equipment
2016 0 2382560 2181981 3688760
2017 3057265 2513060 2372046 2199190
Pearson’s
correlation value 1 1 1 -1
(Source: self-made, 2019)
To summarise the results of this chapter, we can say that determining the fixed and varied
costs is important, as much as taking them into consideration during budget planning. In the
model made by author, these specifics were implemented, however, the deeper we deconstruct
the costs, the more precise our results will be in the end. In the following chapter, author
wishes to deal with the adaptability of currently available results into the model, and the
introduction of possible scenarios, and changes in trends.
3.2 Specifics of the CBA model, practical applicability
The main goal of modelling is to assist the cost economising and decision making processes
of the organisation, by mapping the connection systems of the correlations between each
other. The most notable perspectives within the model made by author consist of the
following:
Specifics of the intervention area: For separate offices, analysing the main specifics of
their intervention areas is advisable. Such are their local area, geographic map,
weather conditions, state of infrastructure (quality of roads, average quality of
buildings, etc.), population density, ratio of populated and unpopulated areas, etc.
The local economic specifics: Due to the complexity of disaster management’s tasks,
the national economic specifics of field operations may differ, which means it’s
important to note the economic structure characteristic of the county in question. This
means that while some places have high amount of industrial production volumes
(hazardous institutions, factories), other places in Hungary have higher production in

23
f.e. agriculture. These specifics should be identified, as they determine the specifics of
field operations, and we may even use them to forecast disasters.
Location of most notable danger zones: Identifying these helps with optimal
dislocation. Furthermore, by noting the important danger zones, we can also determine
what may inhibit disaster relief related to them, which makes the organisation capable
of planning preventative measures.
Excess cost of necessary investments: An important goal of the CBA is to determine
the ratio of excess costs related to investments compared to the so-called no project
scenario, and, if the organisation profits better from realising the investment, or
postponing it.
Life expectancy of tools: This is a highly important pillar of investment economic
benefit analysis, as a new tool, infrastructure has costs, which have to be calculated for
the relevant period.
Excess costs of employed technological system, and balance with savings: We have to
evaluate when the costs of introducing a new technological solutions will generate a
return, which can be done by comparing to our savings.
The effect of the new investment on completion of field operations: In case of a
development project, the efficiency of the organisation’s task conduction being better
always has to be a focus target (things like the decrease in landing time could be
mentioned here).
Indirect economic effects of development projects: When mentioning indirect effects,
we can think about optimisation of number of employees, which can f.e. be decreased
in case there’s a toolset modernisation. This is also where other external effects can be
categorised (conservation of protected natural environments, protection of human life
and critically important infrastructure, etc.), which need to be internalised.
Area of usage: On this, mentioning how a technological development for a given unit
may or may not have an effect on the units operating on neighbouring units is
important. In some cases, even their loads can be reduced indirectly.
Goal three (C3) was the statistical analysis of firefighting cases and technical relief cases’
number and nature between 2012 and 2017. The author was looking to adapt the results of
statistical analyses and observable trends to the planning of organisational development
projects affecting daily operations. This necessitated the use of various mathematical-
statistical methods, such as reporting, and trend analysis to validate H3. Hypothesis 3 states

24
that conducting damage control, and its efficiency needs to obtain a pivotal role in the future,
as the effects of weather impact are becoming more and more serious, making disasters and
hazards increase in frequency. Relieving these, and managing the damages caused will put
severe stress on state budget in the future.
The analysis of literature, and the processes of recent years, and the professional information
services’ data helped author in determining the expected trends. Though during prior analysis,
it seemed possible that climate change will cause extreme weather conditions, however, this
only relates to a noted timeframe within the tasks of disaster relief (day-week-month). This
also makes it more complicated the organisation’s planning and optimisation, as it doesn’t
validate sustaining a persistent, higher capacity of system elements from an economic
perspective.
However, at this point, the theory of bottlenecks is interesting. Using this theory, we may
determine the resource which may cause a problem during a hazard situation, and we can also
identify which is present in excessive quantity for when the number of tasks possibly reduces.
Therefore, the basis for trend analysis within the model came from the changes in field
operation number, which can also be used to forecast the changes in cost elements’ ratios.
For simplicity’s sake, author determined three scenarios, first with the decrease of field
operations, second with the stagnation of field operations, and third with the increase of field
operations forecasted.
In order to introduce this, author will present the calculation tables for number of employed
and costs (Tables 6 and 7), as follows:
Table 6- Forecasting employed numbers by changes in field operation number
Forecast of employee numbers
2015 2016 2017 S1 S2 S3
Leader 34 34 35 33,2189839 34,84182288 36,05895211
Non-leader 497 534 509 523,3533815 508,7610784 497,816851
Public servant 101 101 98 103,3430483 98,47453136 94,82314367
Total number 632 669 642 659,9154137 642,0774326 628,6989468
Field operations 302 291 419 200 400 550
(Source: self-made, 2019)
When analysing the number of employed forecast Table, we have to think back to the results
of the correlation analyses, where the main connections were identified during the evaluation

25
of results. More specifically, as we can also see it in this case, for those in leading positions,
the relation shows proportional logic, which means that more notable field operations need
more, whereas less notable ones need less experts. In terms of non-leaders, the results change,
the analysis basically shows inversely proportional logic. The reason for this is, on the one
hand, the wide array of technological developments from recent years, and on the other hand,
the increase in field operation conduction efficiency. In case the organisation follows this
trend for investments (as this is a theoretic model, we can accept this as a fact), the
abovementioned results hold true (however, if we also analyse other data, we must mention
the lack of human resource as well, in other words, retired employees and quitters, but for the
current Table, we shall leave these out of the analysis). In the next part, we’ll take a look at
the basis of our trend analysis, through the cost calculation seen in the next Table (Table 7).
Table 7- Forecast of human resource-related expenditures based on the number of field
operations conducted
Cost forecast (HUF/person annually)
S1 S2 S3 2015 2016 2017
6620294,539 8475484,531 9866877,024 7180726 7816974 8684875 Leader
3051921,847 4234112,361 5120755,247 3640648 3602790 4347640 Non-leader
1045259,146 1019375,924 999963,5075 1114328 958283 1009847 Public servant
10717475,53 13728972,82 15987595,78 11935702 12378047 14042362 Total number
200 400 550 302 291 419 Field operations
(Source: self-made, 2019)
Author calculated the average costs of human resource categories from the financial reports of
previous years, where the wages are precisely determined. Author used these to calculate
average values, within each category of employees per capita. This is basically a simple
calculation, as with changes in employment numbers, the related costs will follow in a
proportional manner.
Due to text size constraints, author doesn’t show the rest of the examples, but the analyses
were conducted for all system elements. However, the point is to link the various elements, by
which the process of the bottleneck theory already starts to work. There are several
opportunities to analyse this. It’s possible to start from the constant availability of the subsidy
framework. However, we might also identify parts like the number of employees or the tool
assets, which are hard to optimise.
26
In relation to the vehicles and machinery, there are smaller deviations when evaluating the
various scenarios. The upkeep of some tools and machinery in the system may be advised in
case we calculate with an increased number of field operations. Since though the
developments of recent years generated a higher efficiency rate, we also have to take note of
the possibility where even this won’t cover the needs of conducting field operations. If we
don’t take this into consideration, redesigning or selling some tools could generate some
income, or establish some savings by simply not maintaining them. We also have to keep in
mind that it’s assumed that during the next few years, there won’t be sources to finance
procurement in these areas. Therefore, using what the organisation has will be necessary. Old
machinery, tools, and other may prove to be great components, in case keeping them in
operation and using them for field operations is completely out of the question.
For the development of building assets, the decrease of field operations could mean a positive
effect, since in this case, savings could be made from the varied costs. This could make it
possible to spend financing on renovation and state conservation of these buildings. However,
taking past trends into consideration, this is the least expected scenario. Thus, this will have to
be solved using a different financing source. Tender opportunities proved to be good solutions
before, however, even these are in short supply. Yet, we can say that even if the volume is not
notable, renovation of stations is continuously underway. The location of the operational area
could also be advantageous in this case, as the larger the demand for the station existing, the
wider the berth of external financing sources at hand is (municipalities, enterprises, other
sponsors).
As such, in summary, we can clearly see that we may obtain interesting results by analysing
system elements separately, or by handling them as a complex unit during the analysis of
various scenarios. As the field operations of disaster relief related to rescue- and firefighting is
conducted among severe uncertainties, sadly, it’s impossible to generate perfectly assured
forecasts. However, the use of the analyses isn’t necessarily in here either. Identifying
correlations, finding the partial units which, when handled together as a single entity, may
increase the efficiency of economising, or even on the field of conducting operations may
prove a better result.

27
3.3 New scientific results
In this chapter, author presents the new scientific results of the analyses, which may aid the
NDGDM and county offices in rethinking their CBA methodology related to their future
development processes, which will also help them increase their level of acclimatisation and
their operational efficiency.
E1- After analysing the project documentation of the NDGDM, and conducting analyses
together with the project manager experts of the organisation, we can state that the CBA
methodology used as part of the organisation’s decision assisting system is sufficient for basic
cost efficiency concerns. However, in case it’s shown in relation to the operational area and
system complexity of NDGDM, there is an opportunity for further developing it.
E2- The benchmarking’s result helped author in identifying the external effects within the
system. Most of these are negative externalities. This means that without the internalisastion
of said effects, they will continue to inhibit the efficient operation of the system in the future.
The management of positive externalities is similarly important to realise an efficient and
successful operation, as these can generate collateral advantages for the organisation.
E3- During the analysis of landing data, the constant increase in field operations is obvious,
which makes the increase in costs related to field operations for the disaster relief system as
such as well.
E4- During the development of decision assistance systems, focus should be on to use
complex analysis methods to assist decisions with.

28
4 CONCLUSIONS AND SUGGESTIONS
The analysis of Hungary’s disaster management authority system was a very complex and
interesting task. During the analysis of the MIA NDGDM and the county offices, and the
volunteer organisations, author discovered special system attributes at the analysis of the
decision assistance systems of investment and development processes already. The special
operational environment also made research exciting, similarly to the analysis of cost factors
in various system elements.
Author’s first suggestion concerned the constant increase of the organisation’s field operation
number, caused by the extreme weather conditions increasing in number due to climate
change. This was proven true, both according to literature analysis, and to reports, statistical
analyses. Based on this, author concluded that the proper operations of the organisation will
generate a higher cost in state budget.
The next analysis phase related to this was the analysis of using CBA. Author mainly wished
to understand what the organisation does in order to make their economisation system as
efficient as possible. Author made the conclusion that though the work of experts is very high
quality for the organisations in question, today’s cost economising systems may adapt
relevant assets from a special approach. As an example, following the main elements of
externality economy, the external effects hiding within the system, unaccounted for prior were
identified by author. These can cause the results of decision assistance analyses to be
distorted. While creating the model, author aimed to keep various system specifics, the
adaptation of the Disaster Risk Evaluation methodology created by MIA NDGDM, and the
implementation of new approaches (analysing on sector level) in consideration.
Furthermore, author suggests assisting the implementation of further statistical planning
methods by the organisation on the following two areas. Author suggests using the database
recording landing data for field operations with an extra element: determining the nature of
firefighting or technical relief operation. Specifically, if the case is a fire that has an effect on
the agriculture and forestry sector of national economy, the main attribute of it (f.e. forest fire,
drought fire, agricultural machinery fire) be recorded. Statistics related to this may help with
prevention and the development of fire security interventions. The categorisation author used
is based on official educational material of firefighters, therefore, all the employees should be
familiar with it. The recording of an additional data onto the data recording sheet (TMMA)

29
constitutes no extra work. However, it may prove extremely useful to conduct analyses for
this kind of categorisation.
Author’s final recommendation is based on the fact that the analysis of complex systems can
only happen in a satisfactory way when using complex analysis methods tailored specifically
for them. Due to the text limitation of this dissertation, author only analysed the fire and
disaster cases related to agriculture and forestry, however, author suggests conducting similar
analyses for the other notable sectors of national economy as well, such as industry, transport
or properties. Author’s opinion is that we can obtain useful results from creating these
analysis framework systems, which is important due to how most disasters are generated on
these three areas. Due to their high relevance, these are the areas where prevention should be
stressed the most, and excess financing be turned towards, in order to free the state budget of
large disaster management and repair costs, and prevent the degradation of various sectors’
economic results.

30
5 SOURCES
1. ABONYI ET.AL. (2015): Erdő- és vegetációtüzek Magyarországon, Erdővédelem
http://erdotuz.hu/wp-content/uploads/2015/05/EL2015-04-tuz.pdf
(Letöltve: 2019.08.03.)
2. AMBRUSZ J. ET.AL. (2014): A katasztrófák következményei felszámolásának
vezetés-irányítási rendszere, Hadmérnök XI: (1) pp. 64-78.
3. B. MÜLLER TAMÁS (2015): Tűzoltóságok és önkéntes tűzoltó egyesületek, Infoszolg
4. BÁRDOS Z., MUHORAY Á. (2012): A belvíz kialakulása és az ellene való védekezés
lehetőségének vizsgálata, Hadmérnök- VII. Évfolyam 1. szám
5. BARTHOLY J., PONGRÁCZ R., TORMA CS. (2012): A Kárpát- medencében 2021-
2050-re várható regionális éghajlat változás a RegCM- szimulációk alapján, Klíma-21
Füzetek, 60. 3-13.
6. BERNT, R.J. (1996): Applied Cost-Benefit Analysis, Edward Elgar, Cheltenham, UK
7. BLAHUNKA Z. (2010): Katasztrófa elhárítás és műszaki mentés
http://www.tankonyvtar.hu/hu/tartalom/tamop412A/20100019_Katasztrofaelharitas/ch
02s08.html
(Letöltve: 2019.09.30.)
8. EUROPEAN COMMISSION DIRECTORATE (2015): General for Regional and
Urban policy- Guide to Cost-Benefit Analysis of Investment Projects Economic
appraisal tool for Cohesion Policy 2014-2020
9. EUROPEAN REGIONAL DEVELOPMENT FUND, LONDON ECONOMICS (UK)
LIMITED (2013): Guidance Manual for Cost Benefit Analysis (CBAs) Appraisal in
Malta, Operational Programme I – Cohesion Policy 2007-2013 Investing in
Competitiveness for a Better Quality of Life,
https://investinginyourfuture.gov.mt/projects
(Letöltve: 2018.09.30.)
10. GYENES ZS. (2011): Magyarország Nemzeti Katasztrófa Kockázatértékelése,
Budapest http://vmkatig.hu/KEK.pdf
(Letöltve: 2018.10.10.)
11. KOVÁCS, A. (2014): A mezőgazdasági vállalatok tervezése a környezeti
kölcsönhatások figyelembe vételéve. In: Doktori értekezés. Gödöllő: Szent István
Egyetemi Kiadó. 179. p. https://doi.org/10.14751/SZIE.2015.016
(Letöltve: 2018.11.25.)

31
12. LÁNG I., CSETE L., JOLÁNKAI M.(2012): VAHAVA Projekt: A globális
klímaváltozással összefüggő hazai hatások és az erre adandó válaszok
http://klima.kvvm.hu/documents/14/VAHAVAosszefoglalas.pdf
(Letöltve: 2018.11.25.)
13. NEMZETI KÖZSZOLGÁLATI EGYETEM (2015): Polgári védelmi és
iparbiztonsági; tűzvédelmi és katasztrófavédelmi hatósági alapismeretek /Tanári
segédlet/
14. NÉS2 (2013): Második Nemzeti Éghajlatváltozási Stratégia 2014-2025, kitekintéssel
2050-re http://nakfo.mbfsz.gov.hu//hu/node/44
(Letöltve: 2018.11.25.)
15. OECD (2006): Cost-Benefit Analysis And The Environment: Recent Developments,
http://www.oecd.org/greengrowth/tools-evaluation/36190261.pdf
(Letöltve: 2018.11.25.)
16. ORSZÁGOS METEOROLÓGIAI SZOLGÁLAT (2018)- Éghajlatváltozás/Megfigyelt
változások Magyarországon
https://www.met.hu/eghajlat/eghajlatvaltozas/megfigyelt_valtozasok/Magyarorszag/
(Letöltve: 2018.11.25.)
17. UNISDR- UN Office for Disaster Risk Reduction (2016): Poverty and Death:
DISASTER MORTALITY,1996-2015
http://www.unisdr.org/files/50589_creddisastermortalityallfinalpdf.pdf
(Letöltve: 2018.09.05.)
18. DR. VARGA FERENC (2018): Nemzeti Közszolgálati Egyetem- Katonai Műszaki
Doktori Iskola, A hazai mentő tűzvédelem szervezeti és technikai fejlesztési
lehetőségeinek kutatása, különös tekintettel az önkéntes tűzoltóságok növekvő
szerepére, Doktori (PhD) értekezés
19. BM Országos Katasztrófavédelmi Főigazgatóság Jelentés Magyarország nemzeti
katasztrófakockázat-értékelési módszertanáról és annak eredményeiről (2014)

32
6 PUBLICATIONS WITHIN SCOPE OF THE THESIS
Journal papers in Hungarian
BATTAY MÁRTON; MADEJ ANITA; SZŐKE LINDA; BATTAY MÁTÉ; MAROSÁN
MIKLÓS: A vadkereskedelem vidékbiztonsági és vidékfejlesztési aspektusai, Pro Scientia
Ruralis II./2017 pp. 79-90., 12 p. (2019)
SZŐKE LINDA; BATTAY MÁRTON; HERCZEG BOGLÁRKA; FOGARASSY CSABA:
Bioszén felhasználás környezetgazdaságtani megközelítése lehetséges technológiai és
gazdasági szcenáriók a magyarországi bioszén hasznosításban, Journal Of Central European
Green Innovation, pp. 91-110., 20 p. (2016)
Journal papers in foreign language
FOGARASSY CSABA; HORVATH BÁLINT; KOVACS ATTILA; SZŐKE LINDA;
TAKACS, - GYORGY K: A Circular Evaluation Tool for Sustainable Event Management –
An Olympic Case Study, Acta Polytechnica Hungarica, pp. 161-177., 17 p. (2017)
SZŐKE LINDA: The Use of Cost Benefit Analysis And Benchmarking Analysis In The
Planning Period of Bioenergy Projects pp. 25-28. In: Özer, Çınar (szerk.) Book of
Proceedings of the 3rd International Conference on Sustainable Development (ICSD 2017)
Sarajevo, Bosznia-Hercegovina: Univerzitet u Sarajevu, (2017)
MARIA BOROCZ; LINDA SZOKE; BALINT HORVATH: Possible climate friendly
innovation ways and technical solutions in the agricultural sector for 2030, Hungarian
Agricultural Engineering, pp. 55-59., 5 p. (2016)
FOGARASSY CSABA; HORVATH BALINT; SZOKE LINDA; KOVACS ATTILA: Low-
carbon innovation policy with the use of biorenewables in the transport sector until 2030,
Apstract - Applied Studies In Agribusiness And Commerce, pp. 45-52., 8 p. (2015)
Conference publications in foreign language
SZŐKE LINDA: The use of cost- benefit analysis for public institutions and state institutions
(2014) Hódmezővásárhely- XIII. Wellmann international scientific conference
SZŐKE LINDA; SALEH RASHAD; ITIMAD MOHAMED: The role of renewable energy
sources in the rural development, In: Takácsné, György Katalin (szerk.) Az átalakuló,

33
alkalmazkodó mezőgazdaság és vidék: tanulmányok: XIV. Nemzetközi Tudományos Napok:
Gyöngyös, 2014. március 27-28. Gyöngyös, Magyarország: Károly Róbert Főiskola, (2014)
pp. 1379-1384., 6 p.
SZŐKE LINDA; HERCZEG BOGLÁRKA; BAHAA ASMA: Evaluating agricultural low-
carbon systems using benchmarking method pp. 423-430. In: Kis, Lívia Benita; Lukács,
Gábor; Nagy, Barbara; Tóth, Gergely (szerk.) Évfordulók - trendfordulók Festetics Imre
születésének 250. évfordulója: LVI. Georgikon Napok Keszthely, Magyarország: Pannon
Egyetem Georgikon Mezőgazdaságtudományi Kar, (2014)
SZŐKE LINDA; HERCZEG BOGLÁRKA; BAHAA ASMA: The ratio of agricultural
activity in air pollution pp. 431-438. In: Kis, Lívia Benita; Lukács, Gábor; Nagy, Barbara;
Tóth, Gergely (szerk.) Évfordulók - trendfordulók Festetics Imre születésének 250.
évfordulója: LVI. Georgikon Napok Keszthely, Magyarország: Pannon Egyetem Georgikon
Mezőgazdaságtudományi Kar, (2014)
SZŐKE LINDA; ITIMAD MOHAMED; HERCZEG BOGLÁRKA: Environmental aspects
of renewable energies utilization, In: Takácsné, György Katalin (szerk.) Az átalakuló,
alkalmazkodó mezőgazdaság és vidék: tanulmányok: XIV. Nemzetközi Tudományos Napok:
Gyöngyös, 2014. március 27-28. Gyöngyös, Magyarország: Károly Róbert Főiskola, (2014)
pp. 1373-1377.
Conference publications in Hungarian
FOGARASSY CSABA; BATTAY MÁRTON; SZŐKE LINDA; HERCZEG BOGLÁRKA:
Biogázfejlesztések környezeti vizsgálati lehetőségei: A stratégiai környezeti vizsgálatok és a
környezeti hatásvizsgálatok alkalmazhatósága biogáz fejlesztések esetén In: Futó, Zoltán
(szerk.) Tudomány és innováció a lokális és globális fejlődésért : nemzetközi tudományos
konferencia előadásai Szarvas, Magyarország : Szent István Egyetem Egyetemi Kiadó, (2015)
pp. 137-142., 6 p.
SZŐKE LINDA; BATTAY MÁRTON; GAN QUAN; ZSARNÓCZAI J. SÁNDOR:
Stratégiai Környezeti Hatásvizsgálat és benchmarking elemzések alkalmazása
környezetvédelmi projektek tervezésben In: Futó, Zoltán (szerk.) Tudomány és innováció a
lokális és globális fejlődésért nemzetközi tudományos konferencia előadásai Szarvas,
Magyarország: Szent István Egyetem Egyetemi Kiadó, (2015) pp. 150-155., 6 p.