Julie Heiser, Doantam Phan, Maneesh Agrawala, Barbara Tversky and Pat Hanrahan

Page 1
Systems of Thought
Pat Hanrahan Stanford University
EuroVis 2009 Keynote
Systems of Thought:
Representations (Symbols) and
Rules to Manipulate Them
Page 2
Systems of Thought
Language
Systems of Thought
Language
Logic (Boole’s The Laws of Thought)
Page 3
Systems of Thought
Language
Logic (Boole’s The Laws of Thought)
Mathematics
Systems of Thought
Language
Logic (Boole’s The Laws of Thought)
Mathematics
Probabilistic reasoning and statistics
Page 4
Systems of Thought
Language
Logic
Mathematics
Probabilistic reasoning and statistics
Computation
Computational Thinking
Jeanette Wing et al.
Collection of ideas and techniques
Algorithmic thinking
Programming
Systems building
…
Page 5
Systems of Thought
Language
Logic
Mathematics
Probabilistic reasoning and statistics
Computation
Visualization and visual thinking
Systems of Thought
Language
Logic
Mathematics
Probabilistic reasoning and statistics
Computation
Visualization and visual thinking
Which one is best? (Hint: None)
What are the advantages of each?
Page 6
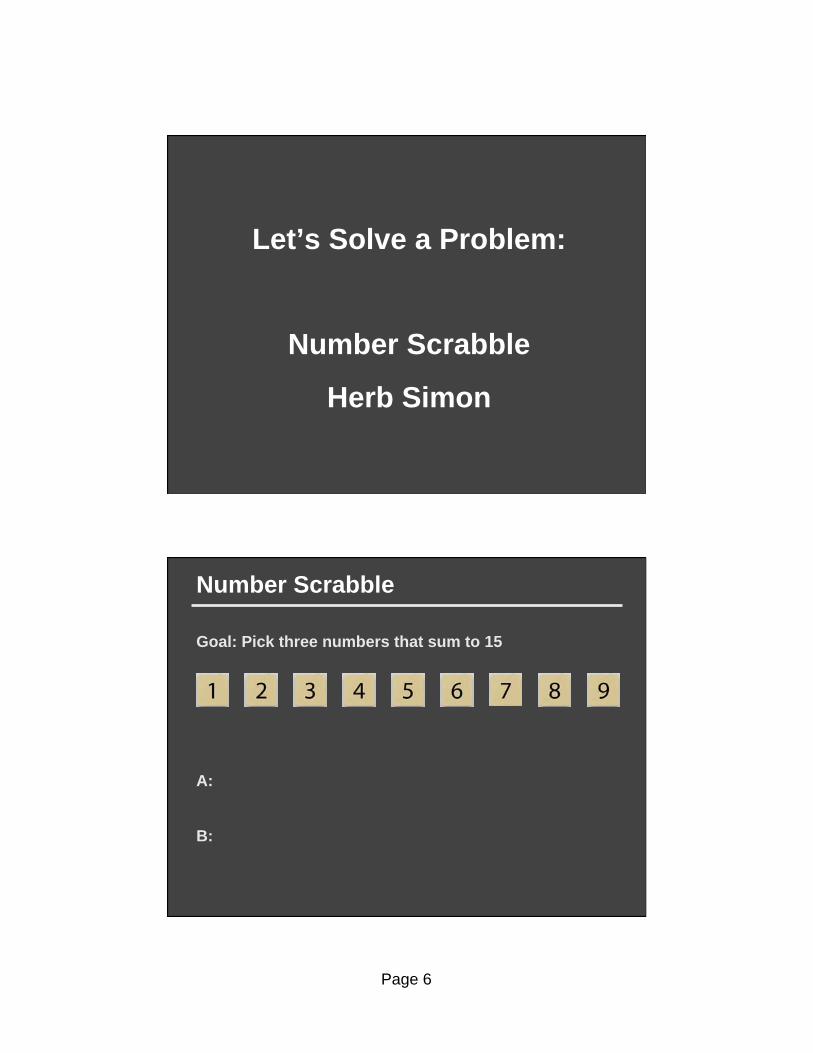
Let’s Solve a Problem:
Number Scrabble
Herb Simon
Number Scrabble
Goal: Pick three numbers that sum to 15
A:
B:
Page 7
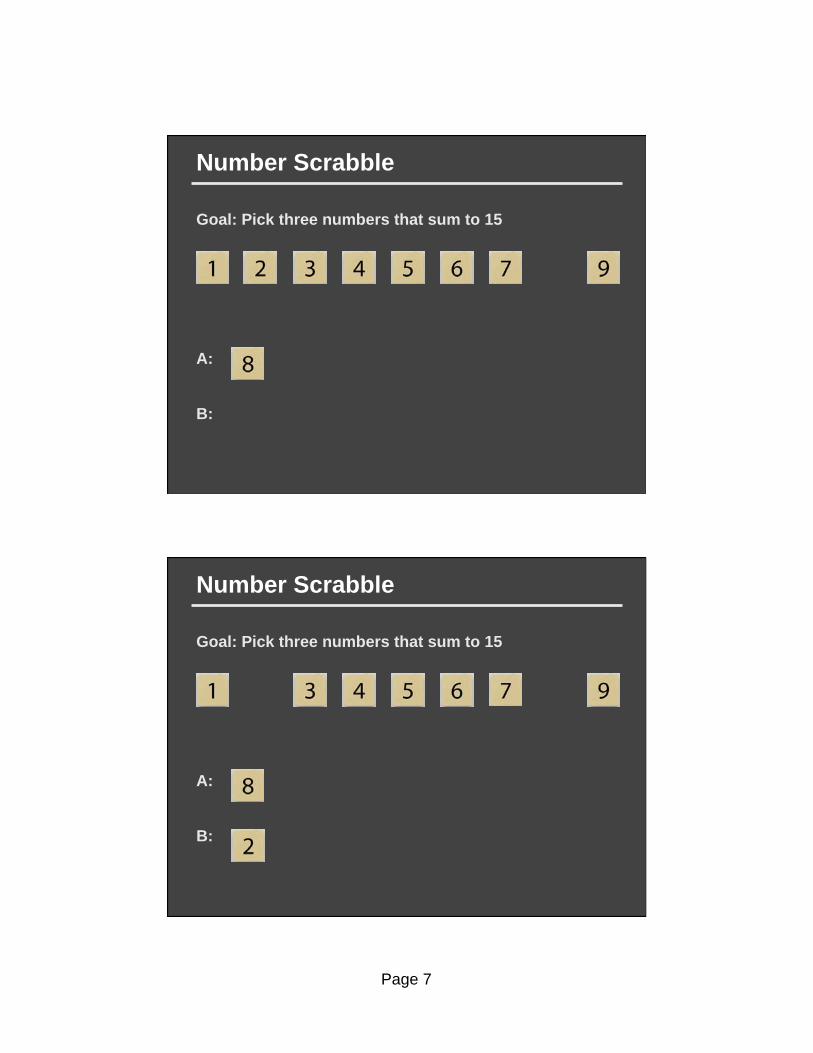
Number Scrabble
Goal: Pick three numbers that sum to 15
A:
B:
Number Scrabble
Goal: Pick three numbers that sum to 15
A:
B:
Page 8
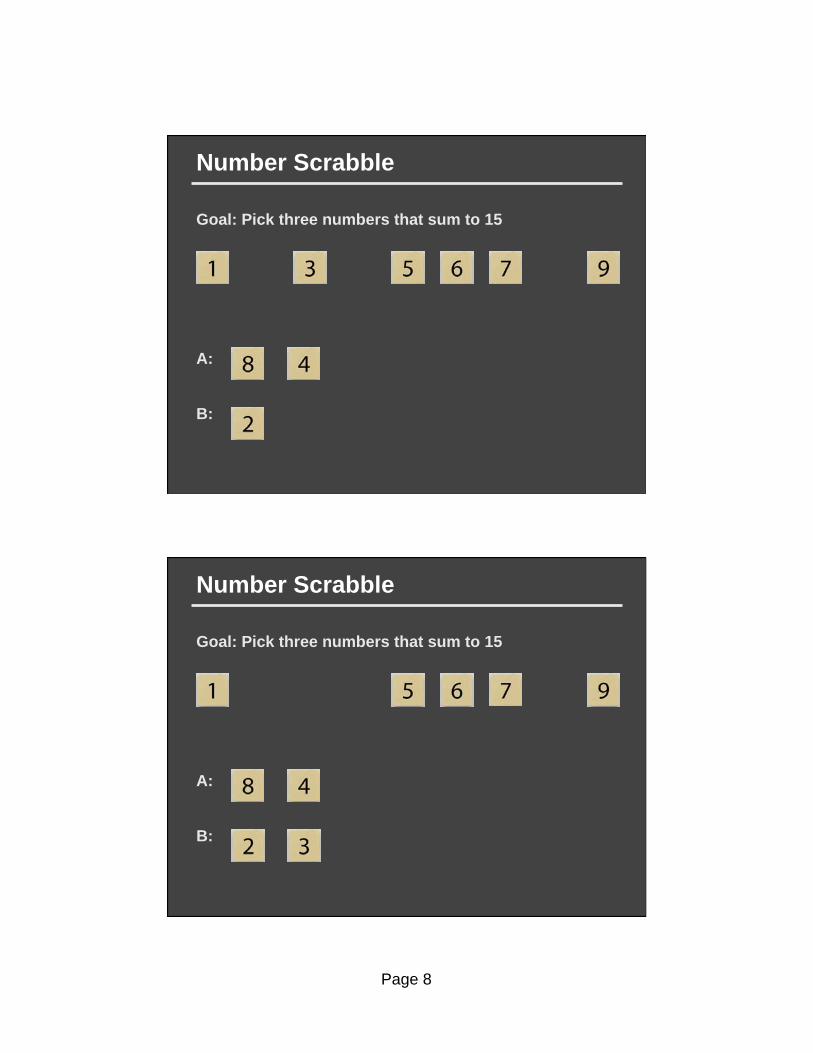
Number Scrabble
Goal: Pick three numbers that sum to 15
A:
B:
Number Scrabble
Goal: Pick three numbers that sum to 15
A:
B:
Page 9
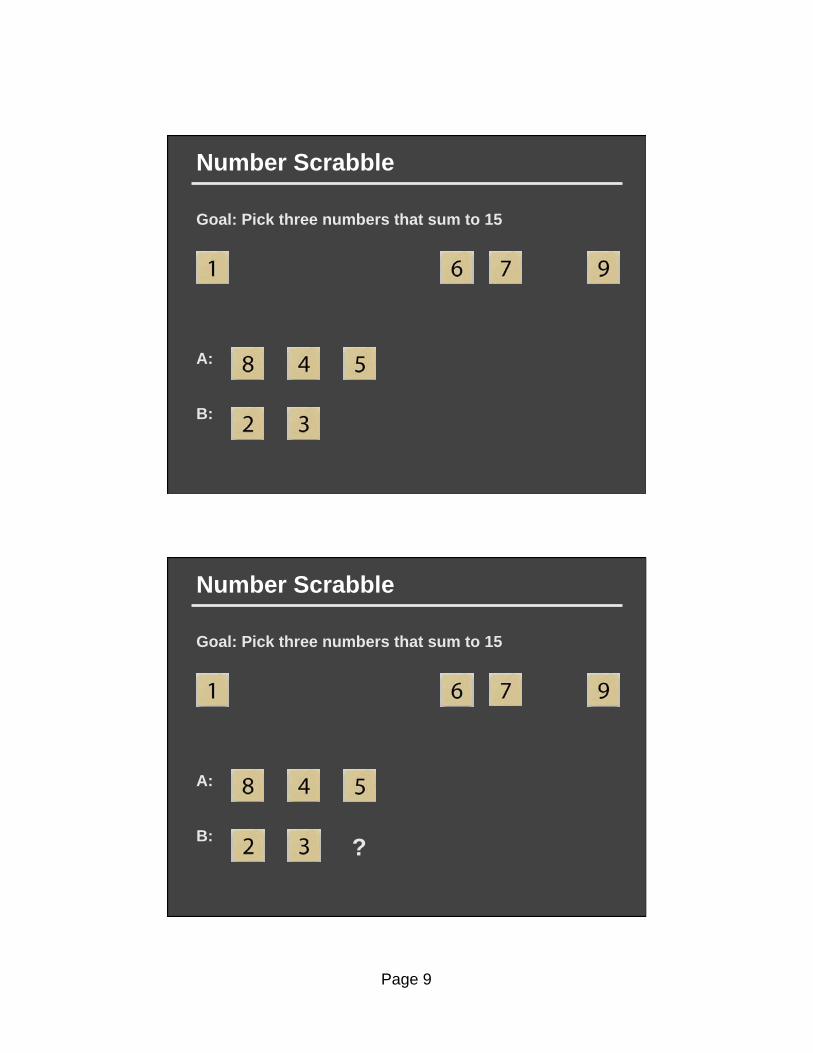
Number Scrabble
Goal: Pick three numbers that sum to 15
A:
B:
Number Scrabble
Goal: Pick three numbers that sum to 15
A:
B: ?

Page 10
Tic-Tac-Toe
Tic-Tac-Toe
X
Page 11
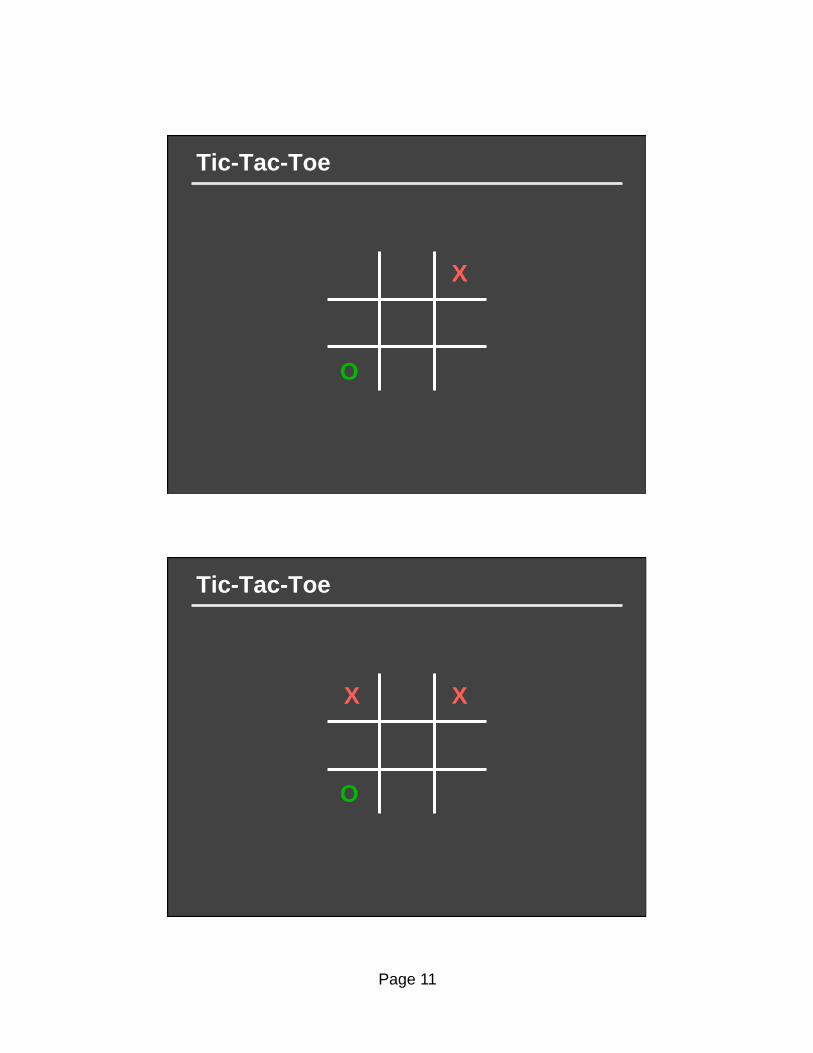
Tic-Tac-Toe
X
O
Tic-Tac-Toe
X
O
X
Page 12
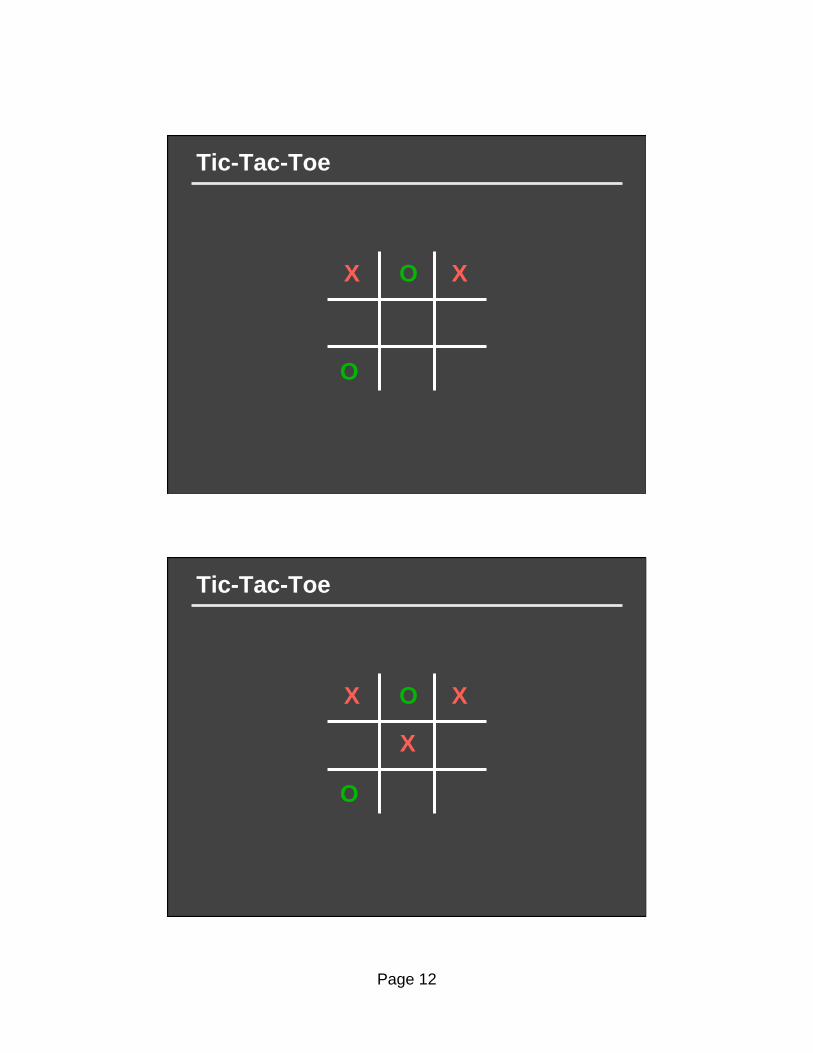
Tic-Tac-Toe
X
O
X O
Tic-Tac-Toe
X
O
X O
X
Page 13
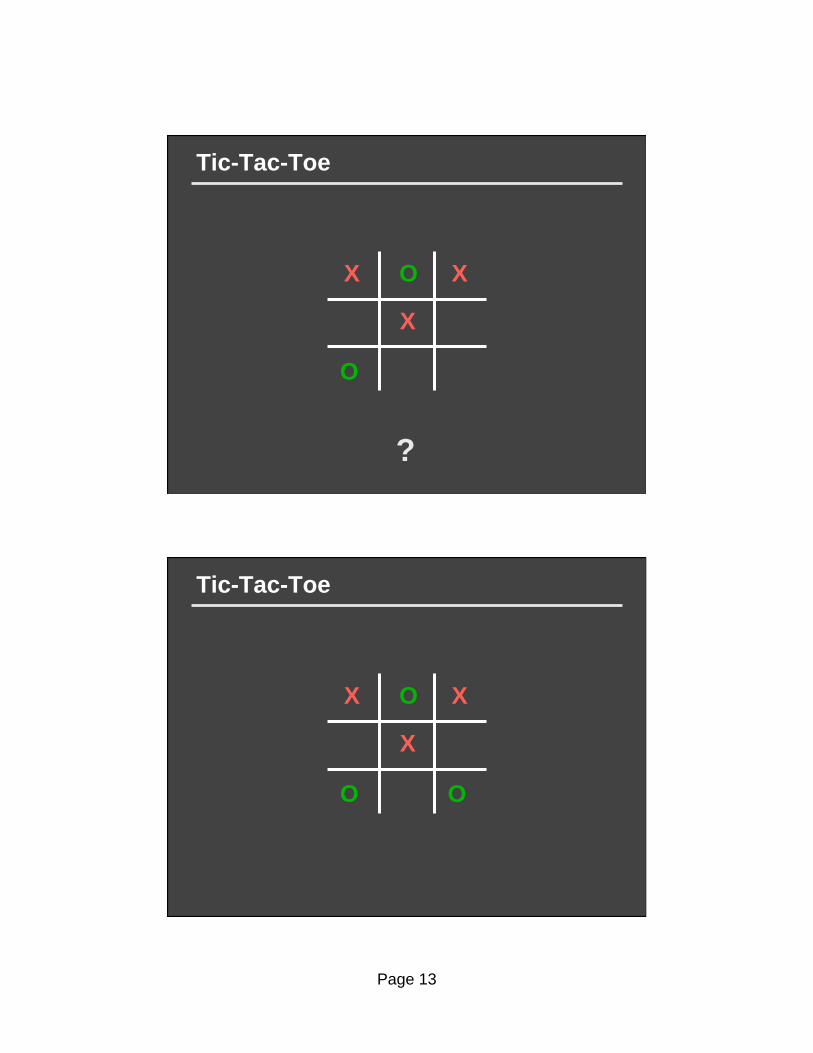
Tic-Tac-Toe
X
O
X O
X
?
Tic-Tac-Toe
X
O
X O
X
O
Page 14
Problem Isomorphs
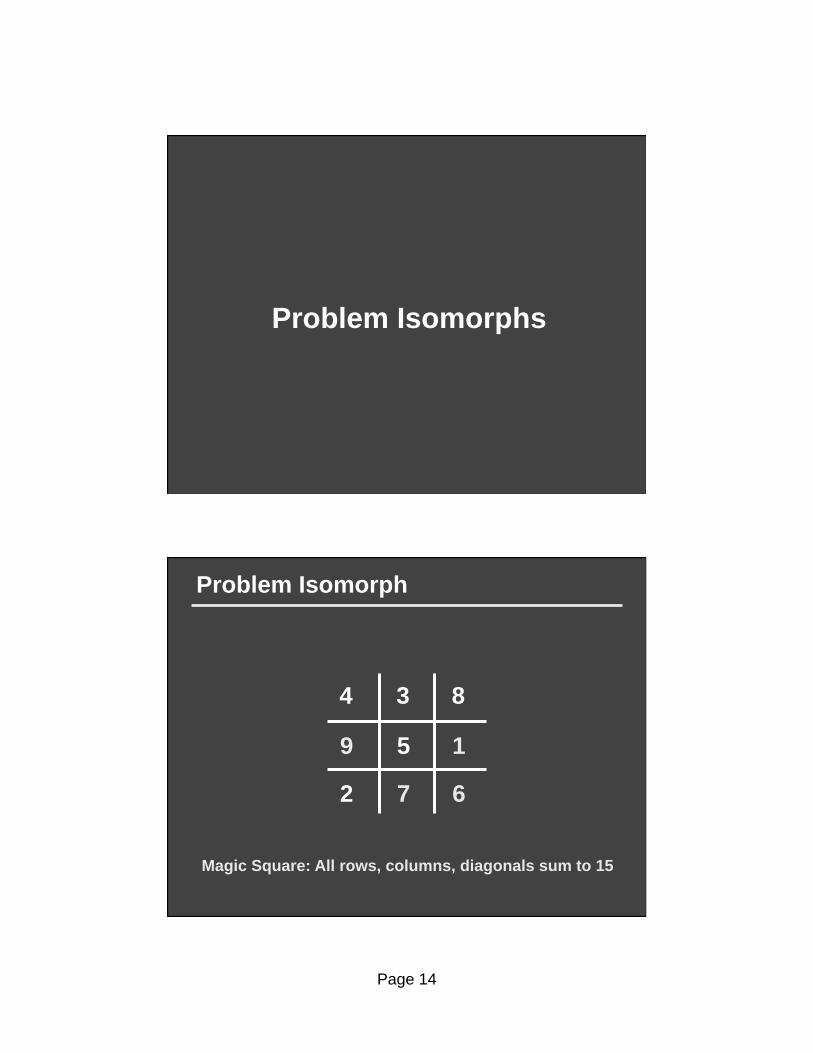
Problem Isomorph
3 4 8
5 9 1
7 2 6
Magic Square: All rows, columns, diagonals sum to 15
Page 15
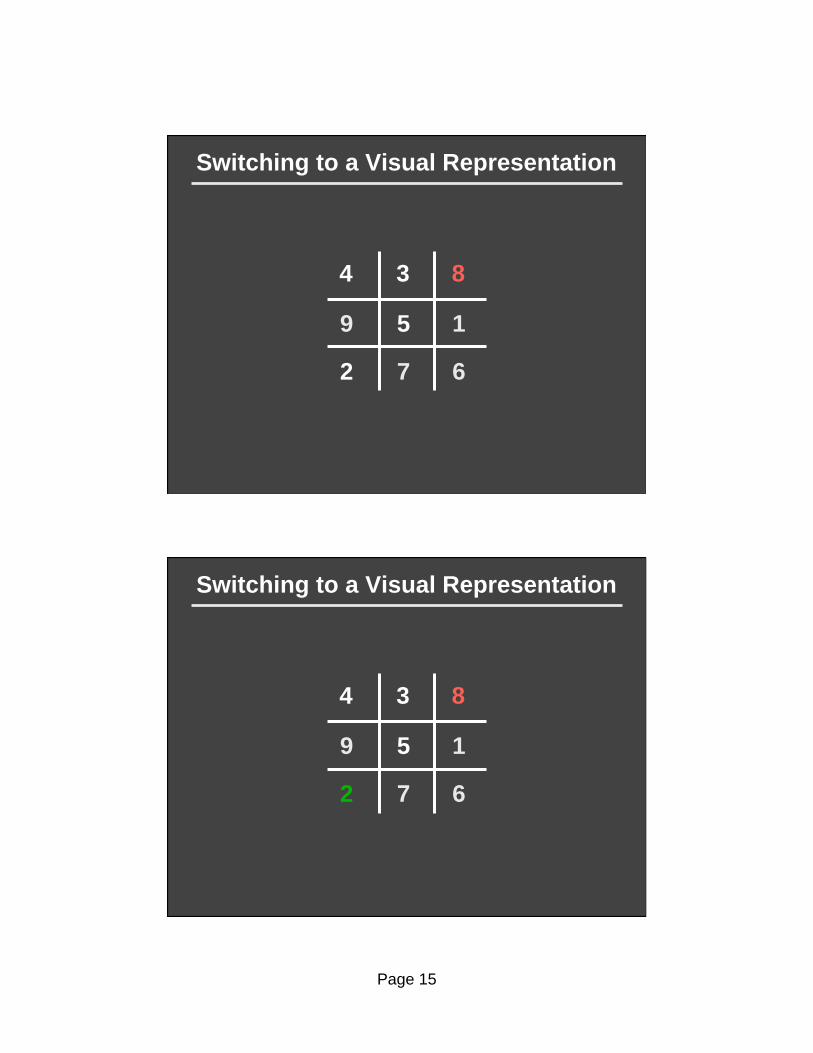
Switching to a Visual Representation
8
5 9 1
7 2 6
3 4
Switching to a Visual Representation
8
5 9 1
7 2 6
3 4

Page 16
Switching to a Visual Representation
3 4 8
5 9 1
7 2 6
Switching to a Visual Representation
3 4 8
5 9 1
7 2 6
Page 17
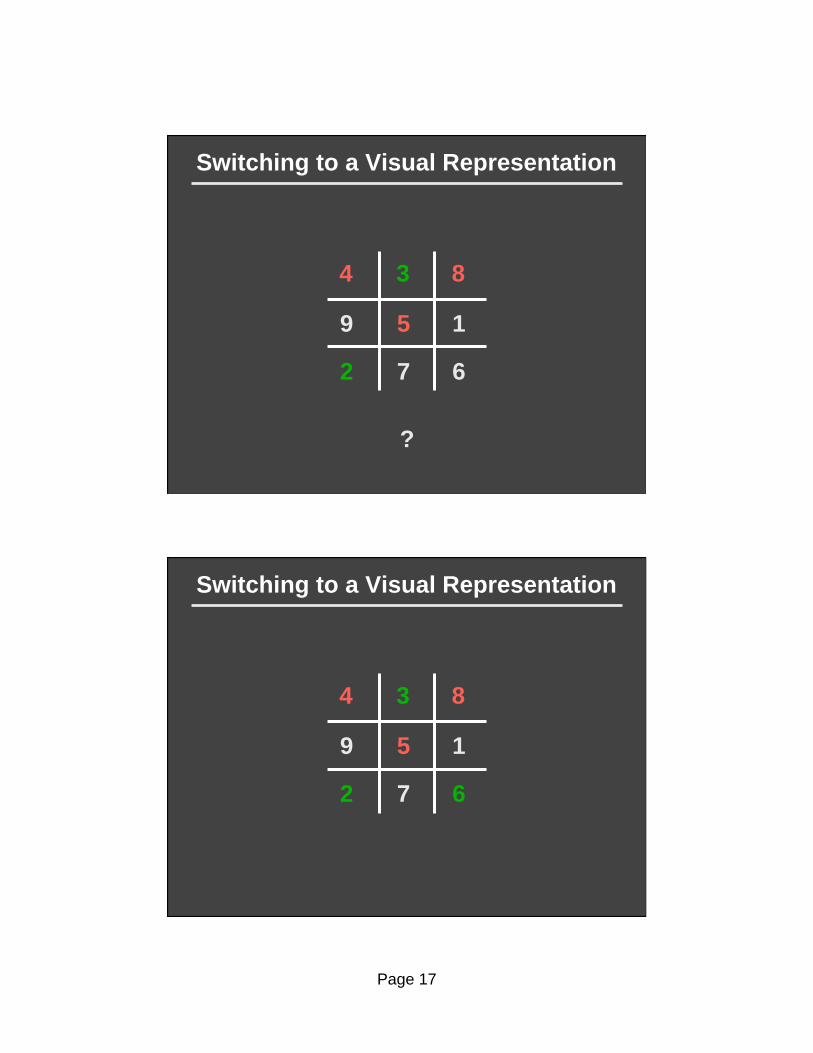
Switching to a Visual Representation
3 4 8
5 9 1
7 2 6
?
Switching to a Visual Representation
3 4 8
5 9 1
7 2 6
Page 18
The Representation Effect
On Being in the Right Space
Page 19
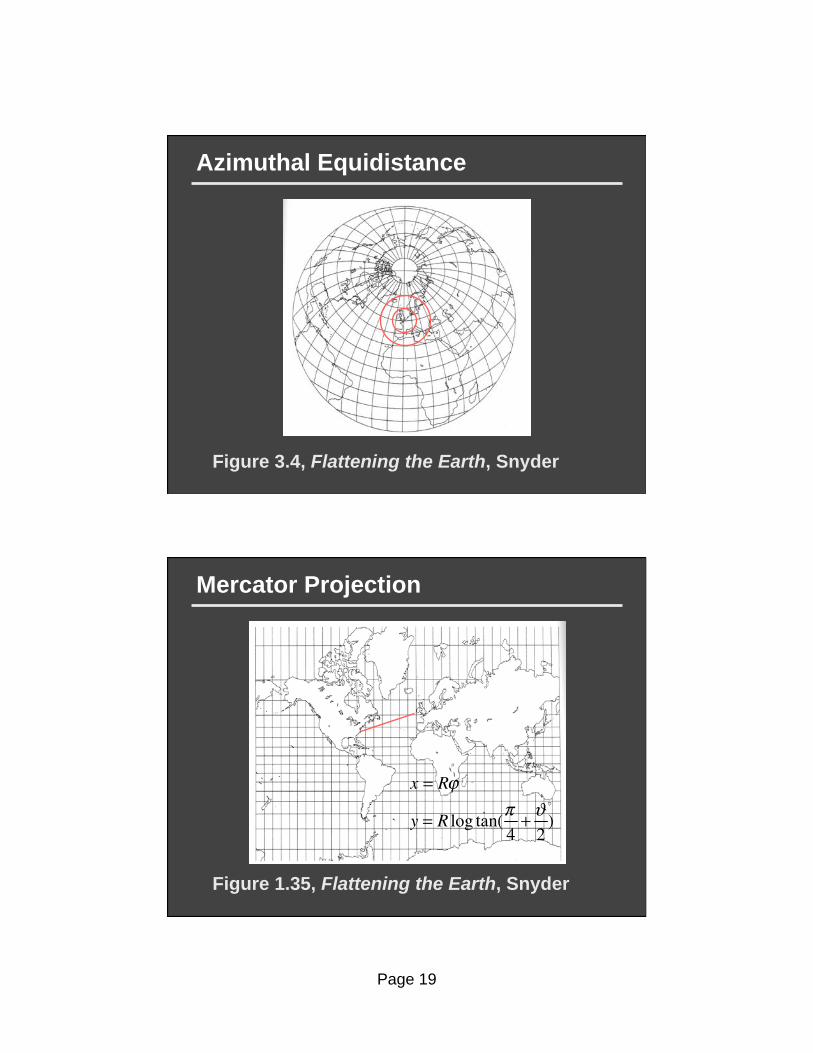
Azimuthal Equidistance
Figure 3.4, Flattening the Earth, Snyder
Mercator Projection
Figure 1.35, Flattening the Earth, Snyder

Page 20
On Being the Right Size
“The most obvious differences between different animals
are differences of size, but for some reason zoologists have
paid singularly little attention to them. In a large textbook of
zoology before me I find no indication that the eagle is
larger than the sparrow, or the hippopotamus bigger than
the hare, though some grudging admissions are made in the
case of the mouse and the whale. But yet it is easy to show
that the hare could not be as large as a hippopotamus, or a
whale as small as a herring. For every type of animal there
is a most convenient size, and a large change in size
inevitably carries with it a change of form”
J. B. S. Haldane
On Being in the Right Space
“The most obvious differences between different
visualizations are differences of space, but for some reason
visualization scientists have paid singularly little attention
to them. In a large textbook of visualization before me I find
no indication that the log-log space is different than the log-
linear space, or that the Mercator projection is different than
the azimuthal equidistant projection, though some grudging
admissions are made in the case of the parallel and
perspective projections. But yet it is easy to show that
distances are difficult to estimate under perspective, or that
data obeying a power law is easy to see in a log-log plot. For
every type of visualization there is a most convenient space,
and a change into the right space inevitably makes
relationships clearer.”
P. Hanrahan
Page 21
The Value of Visualization
The Value of Visualization
The representation effect: Human performance varies
enormously (10-100:1) with different representations
The right representation
Faster solution
Fewer errors
Better comprehension and memory
…
But, the R. R. depends on the problem/question/task
Page 22
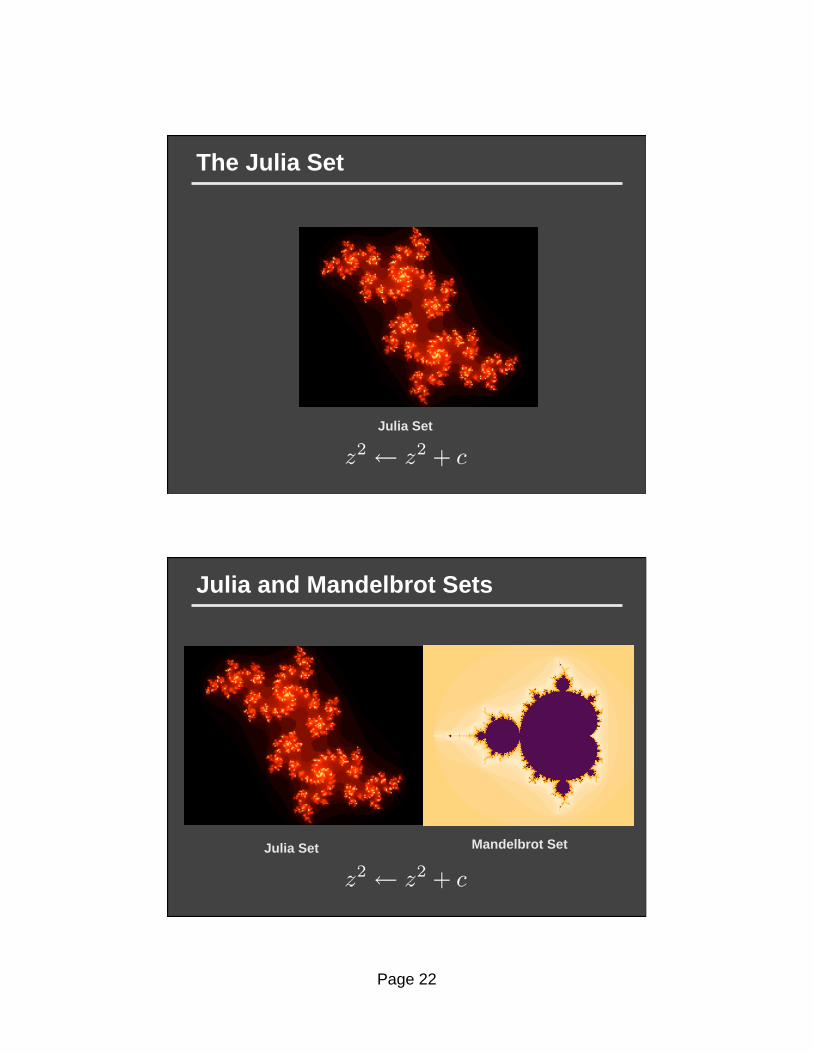
The Julia Set
Julia Set
Julia and Mandelbrot Sets
Julia Set Mandelbrot Set
Page 23
Key Questions
1. What is the problem you are trying to solve?
2. How do you think about the problem? What are the
semantic objects and their relationships?
3. What visual representations are already used? How
does the visualization represent those objects and
support inference?
How Visual Representations
Support Reasoning?
Page 24
“Why is a Picture
(Sometimes) Worth
10,000 Words”
Larkin and Simon,
Cognitive Science, 1987
Why?
Reduce memory load
Working memory is limited
Store information in the diagram
Reduce search time
Pre-attentive (constant-time) search process
Spatially-indexed patterns store the “facts”
Allow perceptual inference
Map inference to pattern finding
Page 25
“Number Representations”
Norman and Zhang
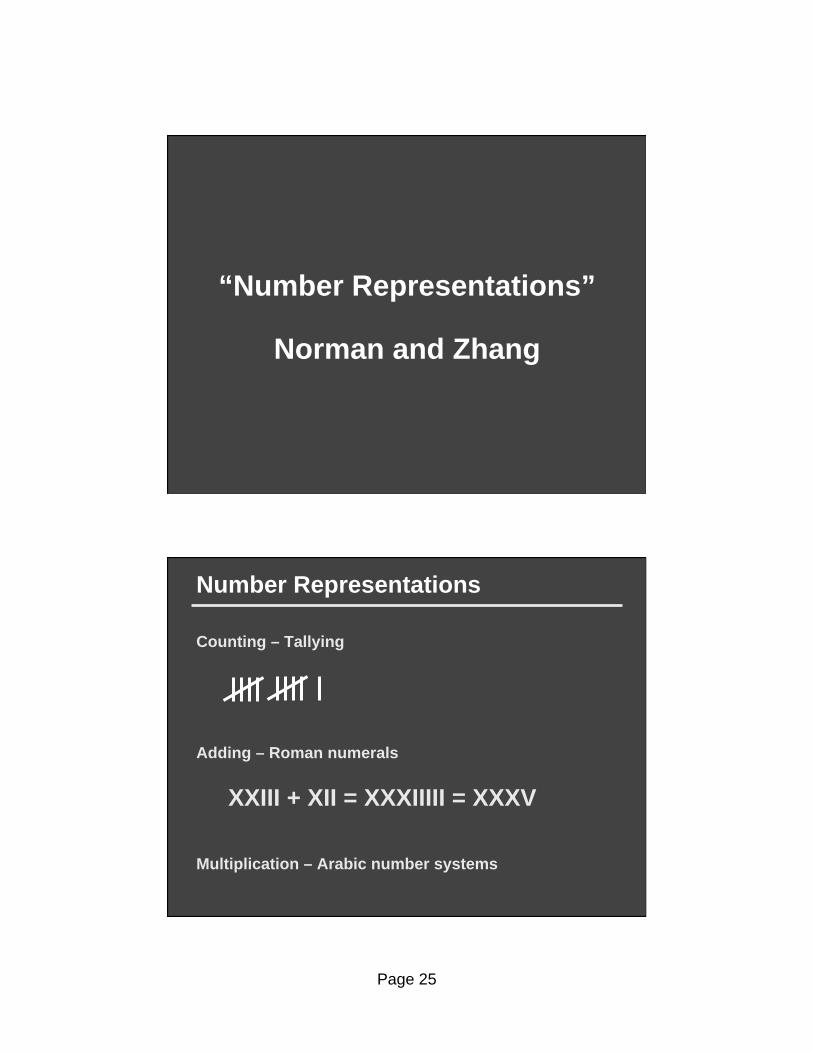
Number Representations
Counting – Tallying
Adding – Roman numerals
Multiplication – Arabic number systems
XXIII + XII = XXXIIIII = XXXV

Page 26
Long-Hand Multiplication
34
x 72
68
238
2448
From “Introduction to Information Visualization,”
Card, Schneiderman, Mackinlay
Zhang and Norman, The Representations of Numbers,
Cognition, 57, 271-295, 1996
Page 27
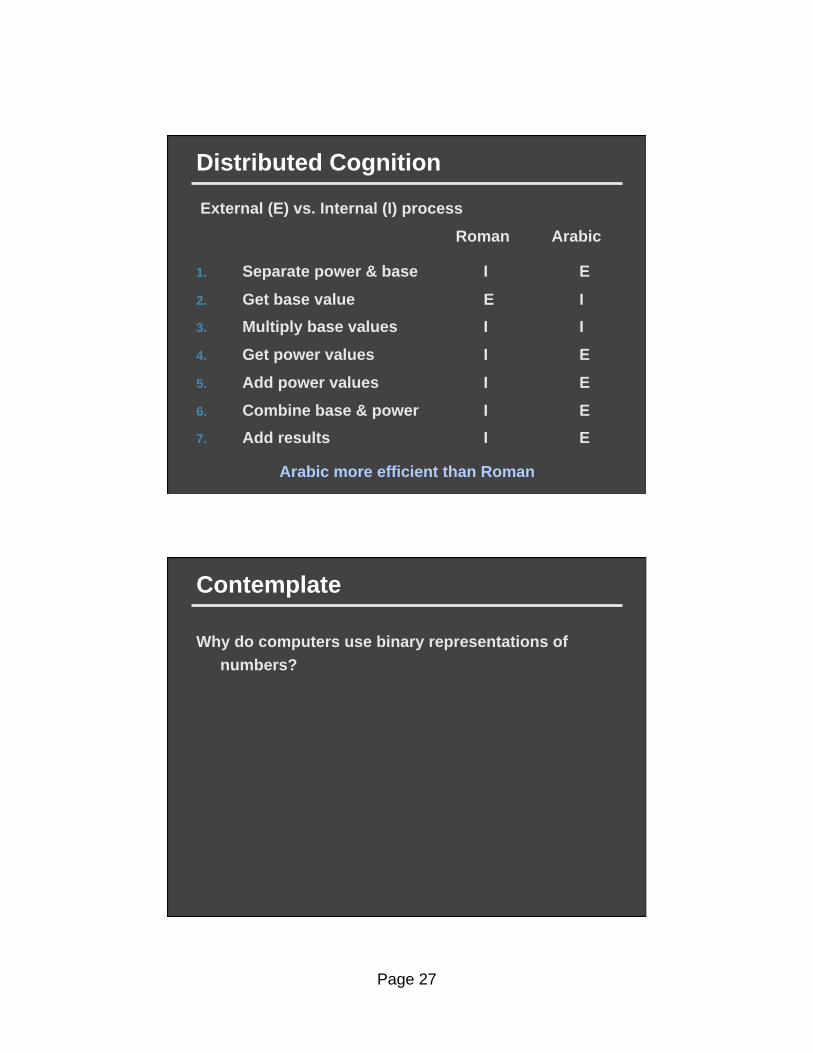
Distributed Cognition
1. Separate power & base I E
2. Get base value E I
3. Multiply base values I I
4. Get power values I E
5. Add power values I E
6. Combine base & power I E
7. Add results I E
Roman Arabic
Arabic more efficient than Roman
External (E) vs. Internal (I) process
Contemplate
Why do computers use binary representations of
numbers?
Page 28
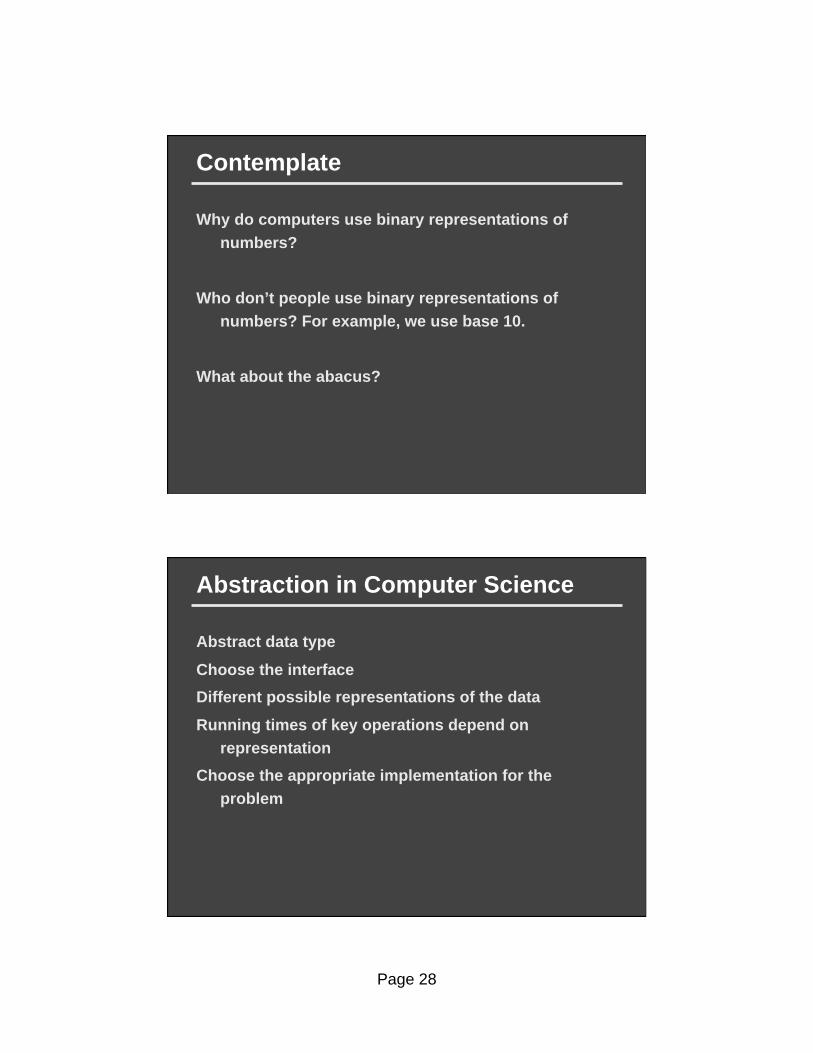
Contemplate
Why do computers use binary representations of
numbers?
Who don’t people use binary representations of
numbers? For example, we use base 10.
What about the abacus?
Abstraction in Computer Science
Abstract data type
Choose the interface
Different possible representations of the data
Running times of key operations depend on
representation
Choose the appropriate implementation for the
problem

Page 29
Notation as a Tool of Thought
K. Iverson’s 1979 ACM Turing Award Address
Notation as a Tool for Thought
“The thesis of the present paper is that the advantages of
executabiity and universality found in programming
languages can be effectively combined, in a single coherent
language, with the advantages offered by mathematical
notation”
K. Iverson
Page 30
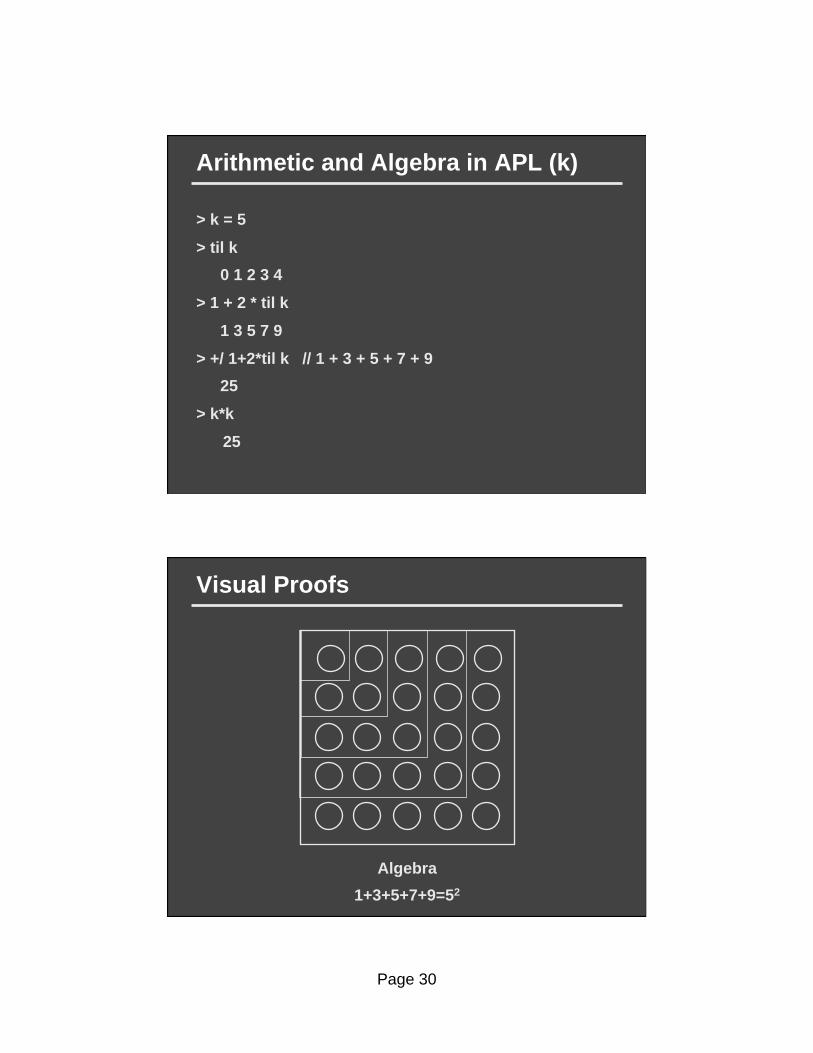
Arithmetic and Algebra in APL (k)
> k = 5
> til k
0 1 2 3 4
> 1 + 2 * til k
1 3 5 7 9
> +/ 1+2*til k // 1 + 3 + 5 + 7 + 9
25
> k*k
25
Visual Proofs
Algebra
1+3+5+7+9=52
Page 31
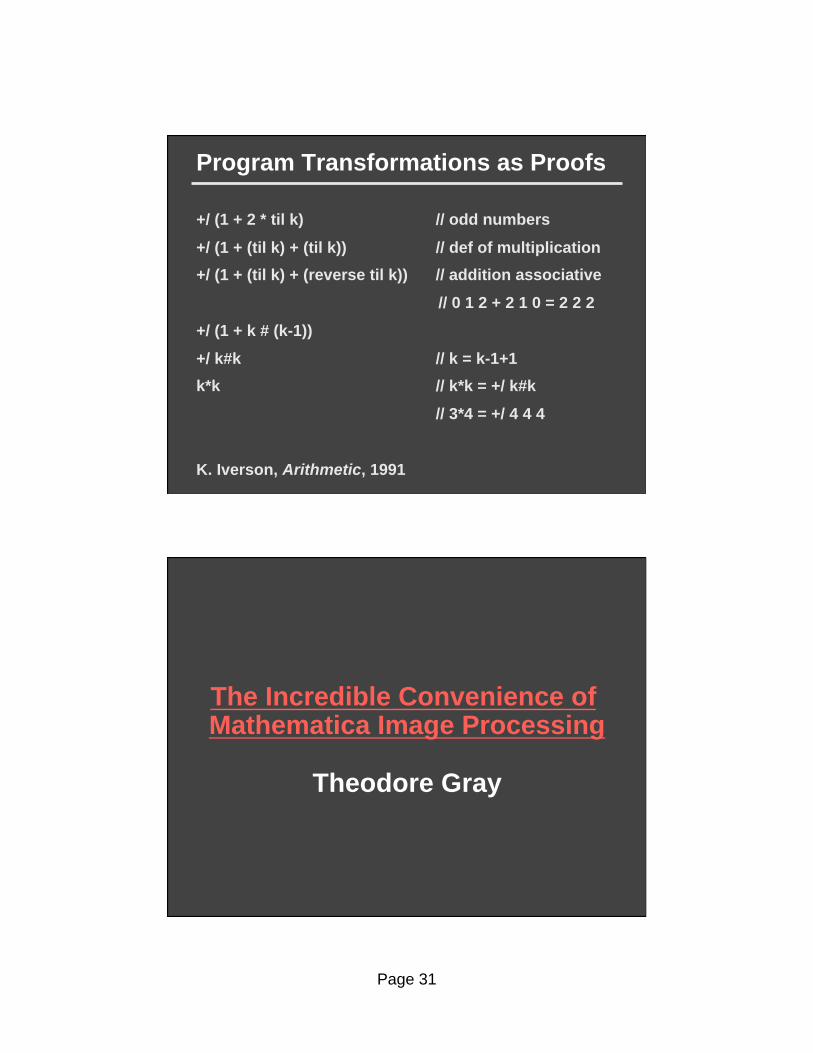
Program Transformations as Proofs
+/ (1 + 2 * til k) // odd numbers
+/ (1 + (til k) + (til k)) // def of multiplication
+/ (1 + (til k) + (reverse til k)) // addition associative
// 0 1 2 + 2 1 0 = 2 2 2
+/ (1 + k # (k-1))
+/ k#k // k = k-1+1
k*k // k*k = +/ k#k
// 3*4 = +/ 4 4 4
K. Iverson, Arithmetic, 1991
The Incredible Convenience of Mathematica Image Processing
Theodore Gray
Page 32
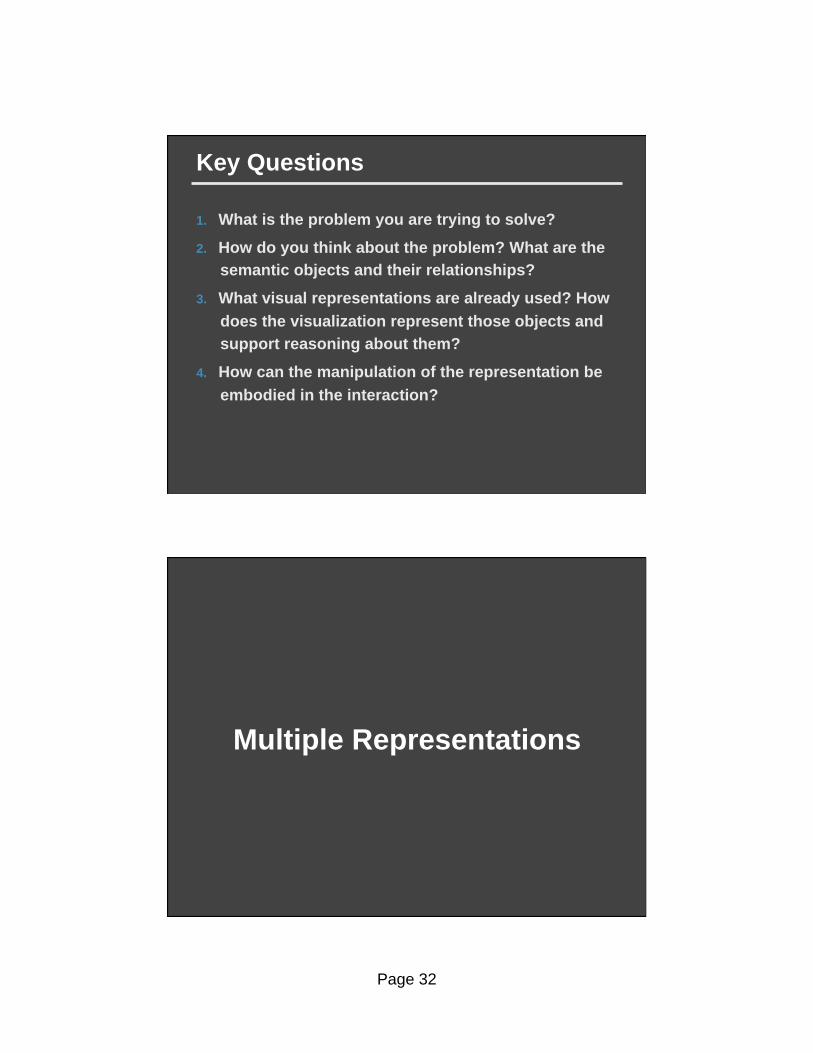
Key Questions
1. What is the problem you are trying to solve?
2. How do you think about the problem? What are the
semantic objects and their relationships?
3. What visual representations are already used? How
does the visualization represent those objects and
support reasoning about them?
4. How can the manipulation of the representation be
embodied in the interaction?
Multiple Representations
Page 33
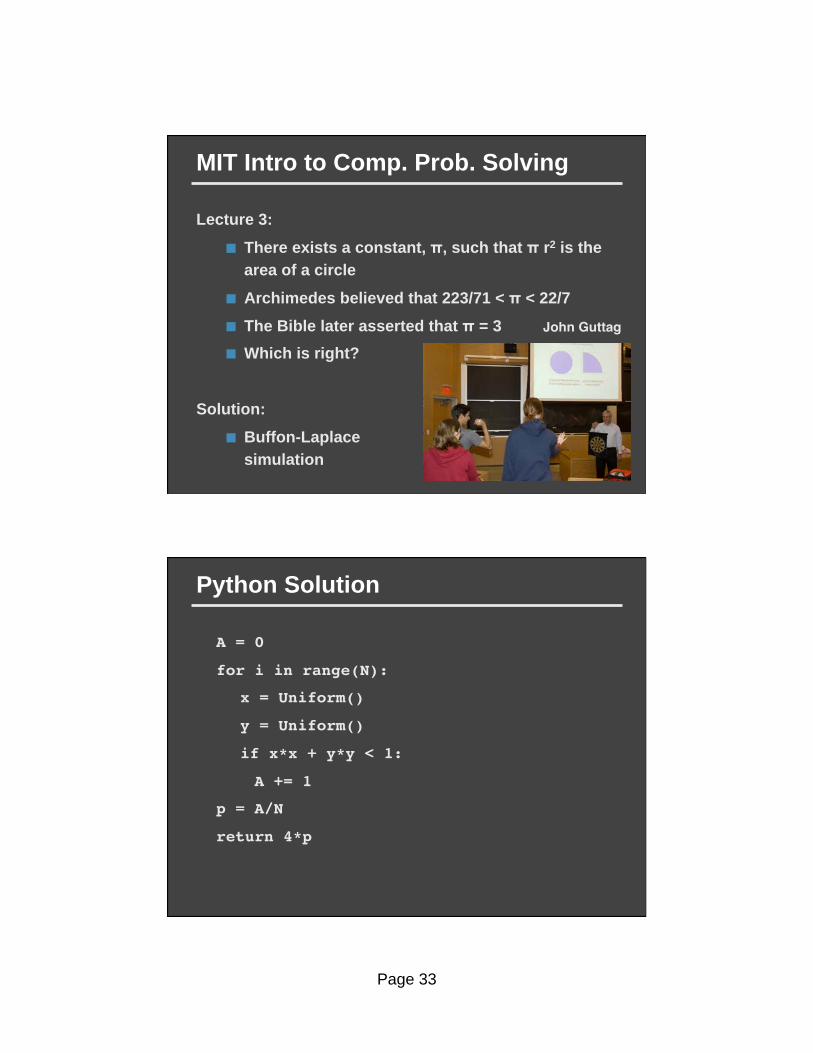
MIT Intro to Comp. Prob. Solving
Lecture 3:
There exists a constant, , such that r2 is the
area of a circle
Archimedes believed that 223/71 < < 22/7
The Bible later asserted that = 3
Which is right?
Solution:
Buffon-Laplace
simulation
John Guttag
Python Solution
A = 0
for i in range(N):
x = Uniform()
y = Uniform()
if x*x + y*y < 1:
A += 1
p = A/N
return 4*p
Page 34
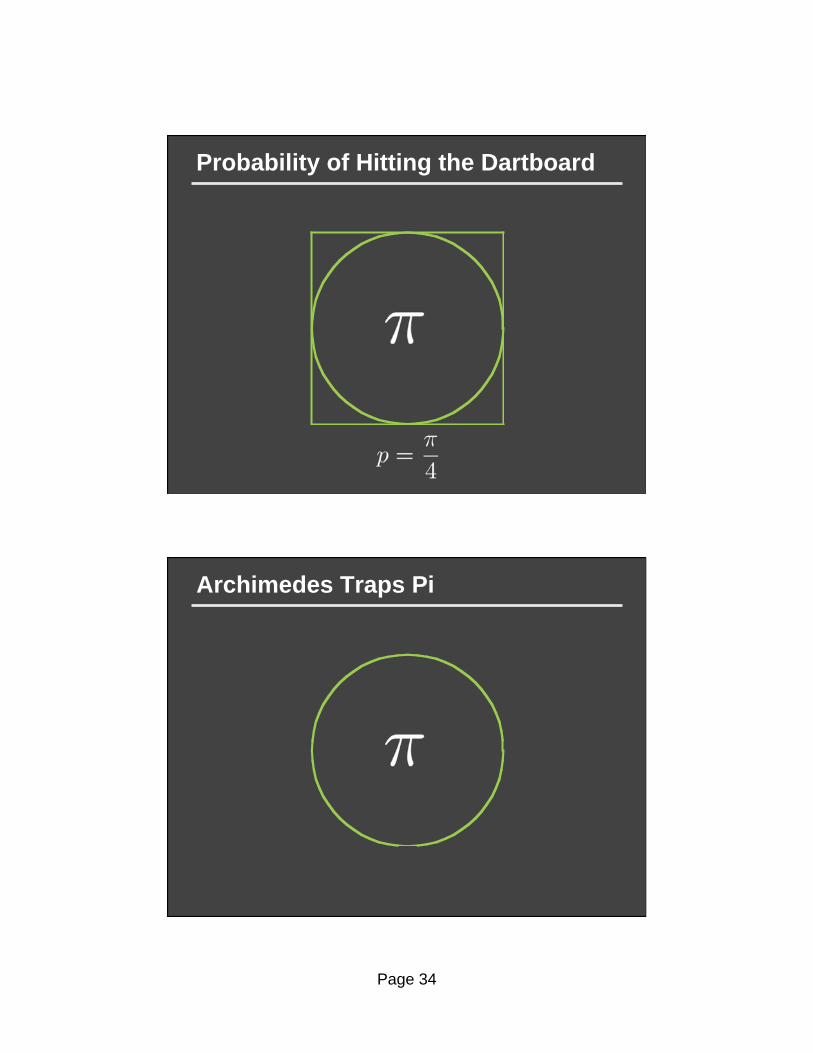
Probability of Hitting the Dartboard
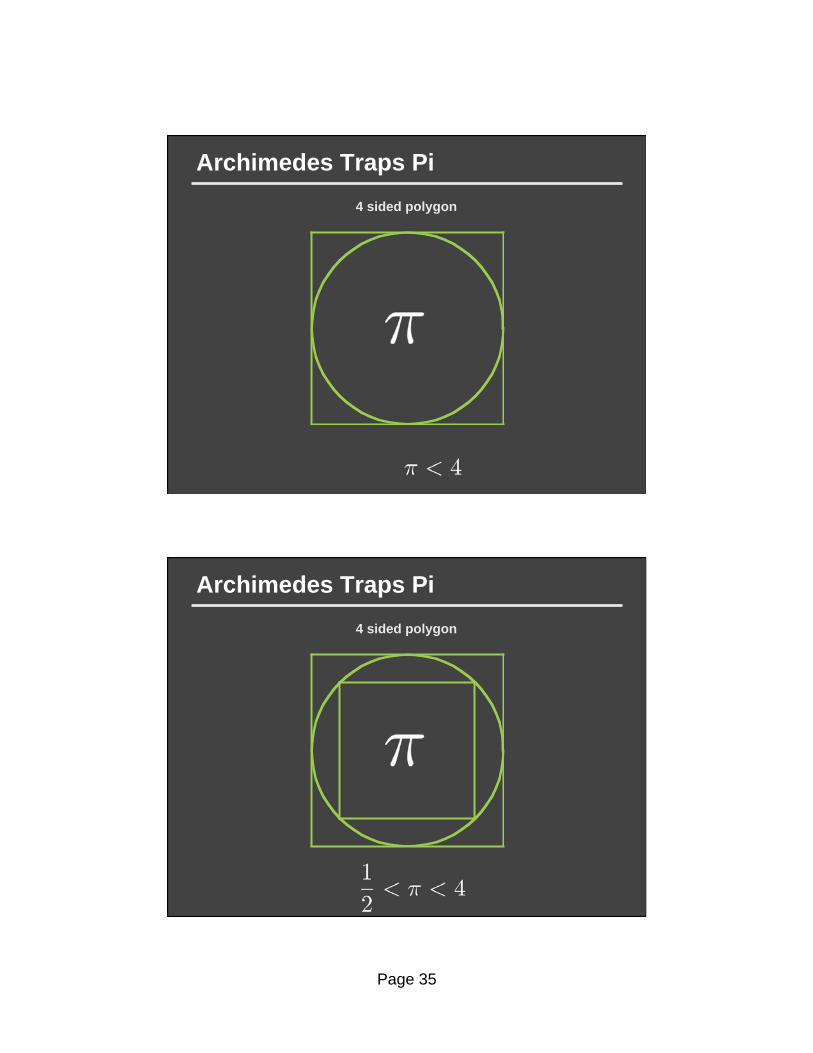
Archimedes Traps Pi
Page 35
Archimedes Traps Pi
4 sided polygon
Archimedes Traps Pi
4 sided polygon
Page 36
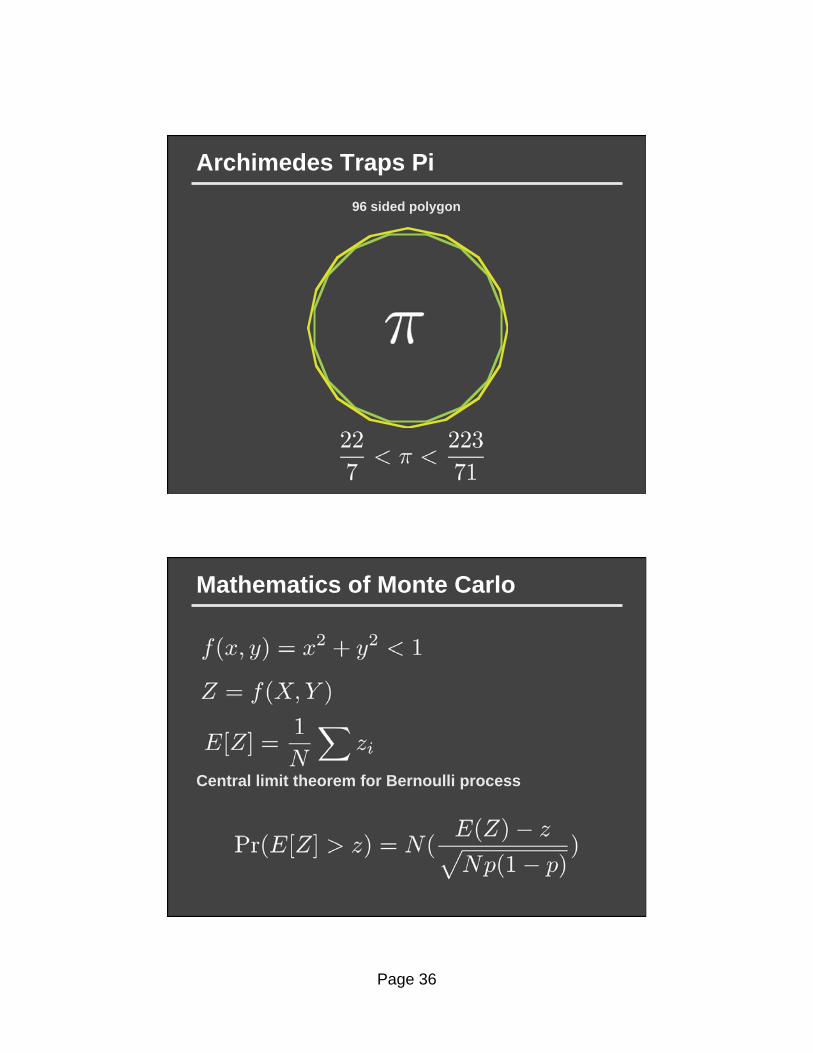
Archimedes Traps Pi
96 sided polygon
Mathematics of Monte Carlo
Central limit theorem for Bernoulli process
Page 37
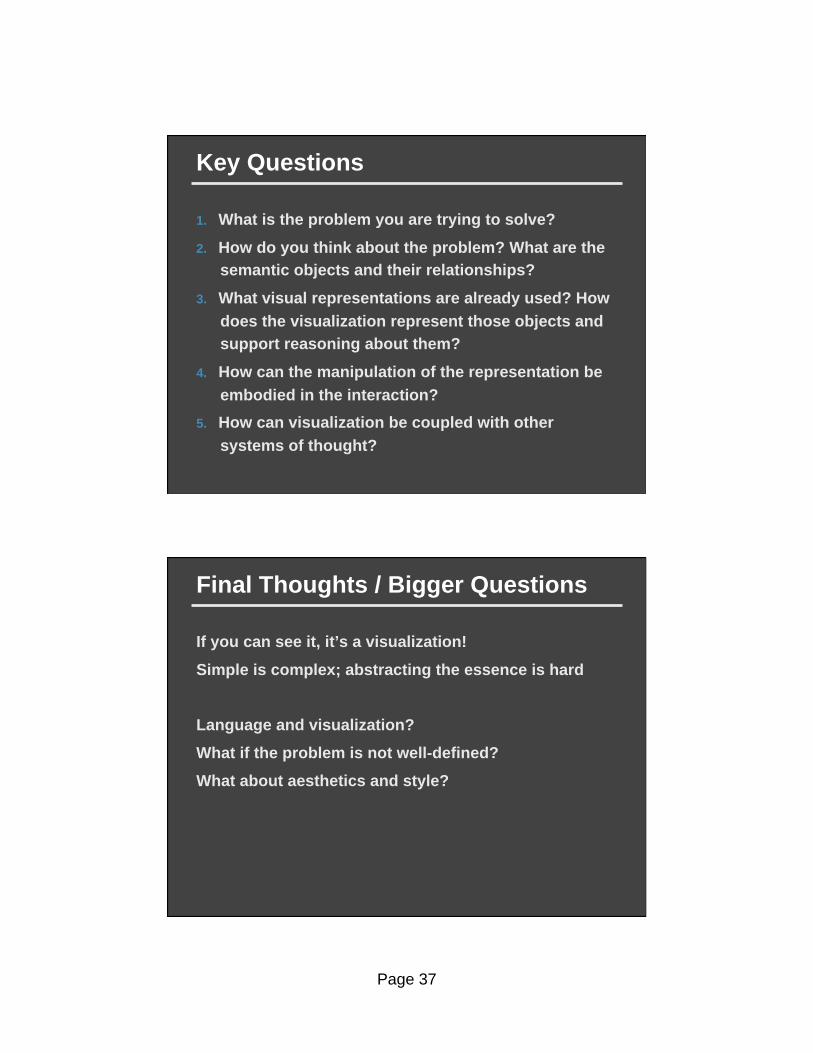
Key Questions
1. What is the problem you are trying to solve?
2. How do you think about the problem? What are the
semantic objects and their relationships?
3. What visual representations are already used? How
does the visualization represent those objects and
support reasoning about them?
4. How can the manipulation of the representation be
embodied in the interaction?
5. How can visualization be coupled with other
systems of thought?
Final Thoughts / Bigger Questions
If you can see it, it’s a visualization!
Simple is complex; abstracting the essence is hard
Language and visualization?
What if the problem is not well-defined?
What about aesthetics and style?

Page 38
Thank you
Questions?