Systems Analyses of Direct Power Extraction (DPE) and ......
38
National Energy Technology Laboratory Driving Innovation ♦ Delivering Results Nathan Weiland, Wally Shelton Crosscutting Research & Rare Earth Elements Portfolios Review, Pittsburgh, PA April 18 th , 2016 Systems Analyses of Direct Power Extraction (DPE) and Advanced Ultra‐Supercritical (AUSC) Power Plants
Transcript of Systems Analyses of Direct Power Extraction (DPE) and ......

National Energy Technology Laboratory
Driving Innovation ♦ Delivering Results
Nathan Weiland, Wally Shelton
Crosscutting Research & Rare Earth Elements Portfolios Review, Pittsburgh, PA
April 18th, 2016
Systems Analyses of Direct Power Extraction (DPE) and Advanced Ultra‐Supercritical (AUSC) Power Plants

2National Energy Technology Laboratory
Presentation Outline
• NETL’s Systems Engineering & Analysis (SEA) Division• Advanced Ultra‐Supercritical (AUSC) Pulverized Coal
Reference Plants– AUSC plants with higher thermal efficiency enabled by material
developments for increased temperature and pressure operation
• System analysis of Direct Power Extraction (DPE) power plants– Supports NETL’s Magnetohydrodynamics (MHD) research program– Leverages synergies between oxy‐coal MHD and Carbon Capture and
Storage (CCS)– Uses MHD topping cycle and AUSC steam bottoming cycle

3National Energy Technology Laboratory
NETL Research and Innovation CenterCore Competencies
Computational Science & Engineering
High‐Performance Computing
Data Analytics
Materials Engineering & Manufacturing
Structural & Functional
Design, Synthesis & Performance
Geological & Environmental
Systems
Air, Water & Geology
Understanding & Mitigation
EnergyConversionEngineering
Component & Device
Design & Validation
Systems Engineering &
Analysis
Process & System
Optimization, Validation & Economics
Program Execution & Integration
Strategic Planning
Project Management

4National Energy Technology Laboratory
Presentation Outline
• NETL’s Systems Engineering & Analysis (SEA) Division• Advanced Ultra‐Supercritical (AUSC) Pulverized Coal
Reference Plants– AUSC plants with higher thermal efficiency enabled by material
developments for increased temperature and pressure operation
• System analysis of Direct Power Extraction (DPE) power plants– Supports NETL’s Magnetohydrodynamics (MHD) research program– Leverages synergies between oxy‐coal MHD and Carbon Capture and
Storage (CCS)– Uses MHD topping cycle and AUSC steam bottoming cycle

5National Energy Technology Laboratory
Impact of Steam Conditions on PC Plant Efficiencies
Temperature Pressure (absolute)
Net Plant Efficiency (% HHV)**
Subcritical 540 ‐ 565°C1000 ‐ 1050°F
16 ‐ 22 MPa2300 ‐ 3200 psi
38.3 ‐ 39.6%
Supercritical (SC) 565 ‐ 600°C1050 ‐ 1112°F
22 ‐ 27 MPa3200 ‐ 4000 psi
39.6 ‐ 40.6%
Ultra‐supercritical (USC)* 600 ‐ 640°C1112 ‐ 1184°F
24 ‐ 31 MPa3500 ‐ 4500 psi
41.3 ‐ 42.0%
Advanced USC (AUSC)(DOE Program Goals)
700 ‐ 760°C 1292 ‐ 1400°F
24 ‐ 35 MPa 3500 ‐ 5000 psi
43.4 ‐ 44.4%
*USC represents a broad range of steam conditions; criteria on what constitutes USC are not consistent (especially internationally). Commercially available USC technology results in efficiencies similar to or slightly above the state‐of‐the‐art SCPC plant provided here.
**Net plant efficiencies above are based on an example plant operating on Bituminous coal, at ISO conditions, with 50°F reheat, wet flue gas desulfurization, and wet cooling towers. Other design parameters and site conditions will also impact the efficiency of a specific plant.
Source: NETL, Cost and Performance Baseline for Fossil Energy Plants, Volume 1: Bituminous Coal and Natural Gas to Electricity, Revision 3, 2015; and other internal assessments of AUSC steam conditions.

6National Energy Technology Laboratory
Advanced Ultra‐Supercritical (AUSC) Pulverized Coal Reference Plants
• Objective: Develop AUSC reference cases– Enabled by DOE/Ohio Coal Development Office (OCDO) AUSC
Materials Consortia• Steam boilers (DE‐FG26‐01NT41175) • Steam turbines (DE‐FE0000234)
– Supported by NETL Crosscutting program
– Evaluate three steam pressures and effect of CCS
– Conduct economic analysis based on an Inverted Tower BoilerDesign (B&W)*
*Advanced Ultra‐Supercritical Pulverized Coal Power Plant with and without Post‐Combustion Carbon Capture. EPRI, Palo Alto, CA: 2015.

7National Energy Technology Laboratory
Advanced Ultra‐Supercritical (AUSC) Pulverized Coal Reference Plants
• Performance for all cases now reflect the steam turbine stage efficiencies extracted from steam flow diagrams provided in the A‐USC Consortium literature1 rather than those from the Bituminous Baseline Report2
• Boiler and steam piping costs reflect the conceptual B&W inverted tower boiler design
– Steam piping costs assume a reduced steam lead length to 150’ from 450’ for a conventional boiler
Case Steam Conditions Capacity(MW‐net)
CO2 Capture (Cansolv)
CO2 Capture Heat Integration
1 3500 psig / 1350°F / 1400°F 550 0% ‐
2 3500 psig / 1350°F / 1400°F 550 90% No
3 4250 psig / 1350°F / 1400°F 550 0% ‐
4 4250 psig / 1350°F / 1400°F 550 90% No
5 5000 psig / 1350°F / 1400°F 550 0% ‐
6 5000 psig / 1350°F / 1400°F 550 90% No
Case Matrix
8National Energy Technology Laboratory
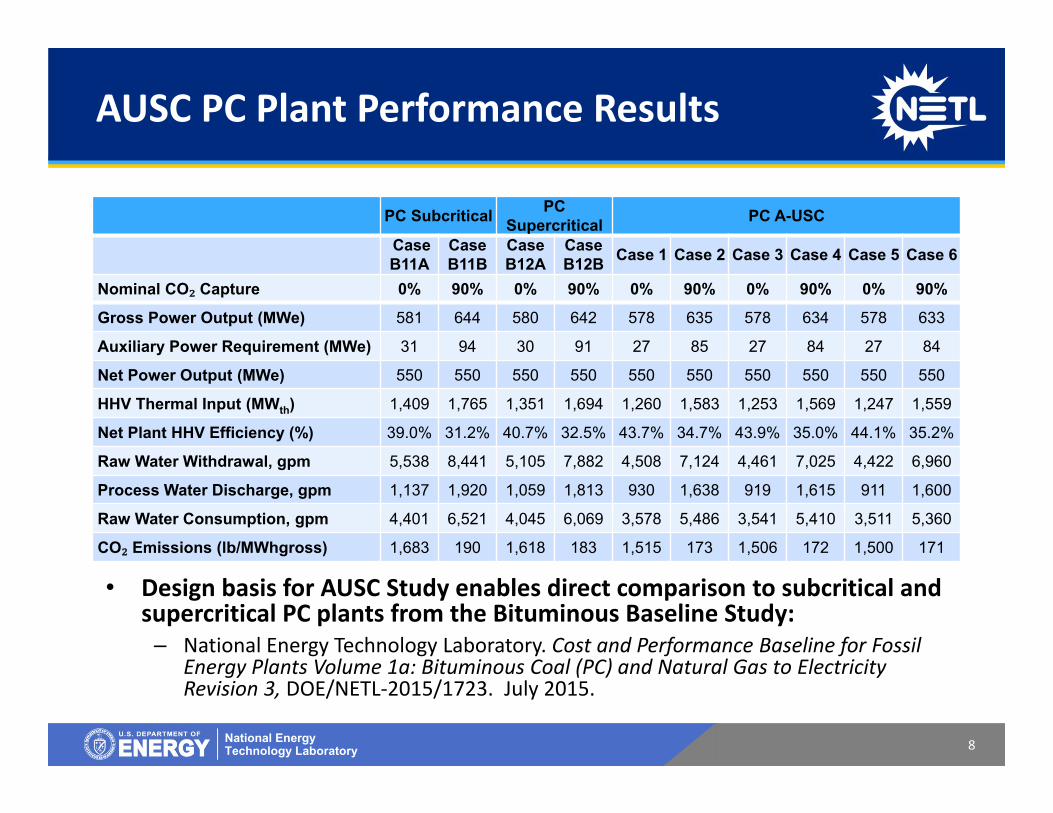
AUSC PC Plant Performance Results
• Design basis for AUSC Study enables direct comparison to subcritical and supercritical PC plants from the Bituminous Baseline Study:
– National Energy Technology Laboratory. Cost and Performance Baseline for Fossil Energy Plants Volume 1a: Bituminous Coal (PC) and Natural Gas to Electricity Revision 3, DOE/NETL‐2015/1723. July 2015.
PC Subcritical PC Supercritical PC A-USC
Case B11A
Case B11B
Case B12A
Case B12B Case 1 Case 2 Case 3 Case 4 Case 5 Case 6
Nominal CO₂ Capture 0% 90% 0% 90% 0% 90% 0% 90% 0% 90%
Gross Power Output (MWe) 581 644 580 642 578 635 578 634 578 633
Auxiliary Power Requirement (MWe) 31 94 30 91 27 85 27 84 27 84
Net Power Output (MWe) 550 550 550 550 550 550 550 550 550 550
HHV Thermal Input (MWth) 1,409 1,765 1,351 1,694 1,260 1,583 1,253 1,569 1,247 1,559
Net Plant HHV Efficiency (%) 39.0% 31.2% 40.7% 32.5% 43.7% 34.7% 43.9% 35.0% 44.1% 35.2%
Raw Water Withdrawal, gpm 5,538 8,441 5,105 7,882 4,508 7,124 4,461 7,025 4,422 6,960
Process Water Discharge, gpm 1,137 1,920 1,059 1,813 930 1,638 919 1,615 911 1,600
Raw Water Consumption, gpm 4,401 6,521 4,045 6,069 3,578 5,486 3,541 5,410 3,511 5,360
CO₂ Emissions (lb/MWhgross) 1,683 190 1,618 183 1,515 173 1,506 172 1,500 171
9National Energy Technology Laboratory
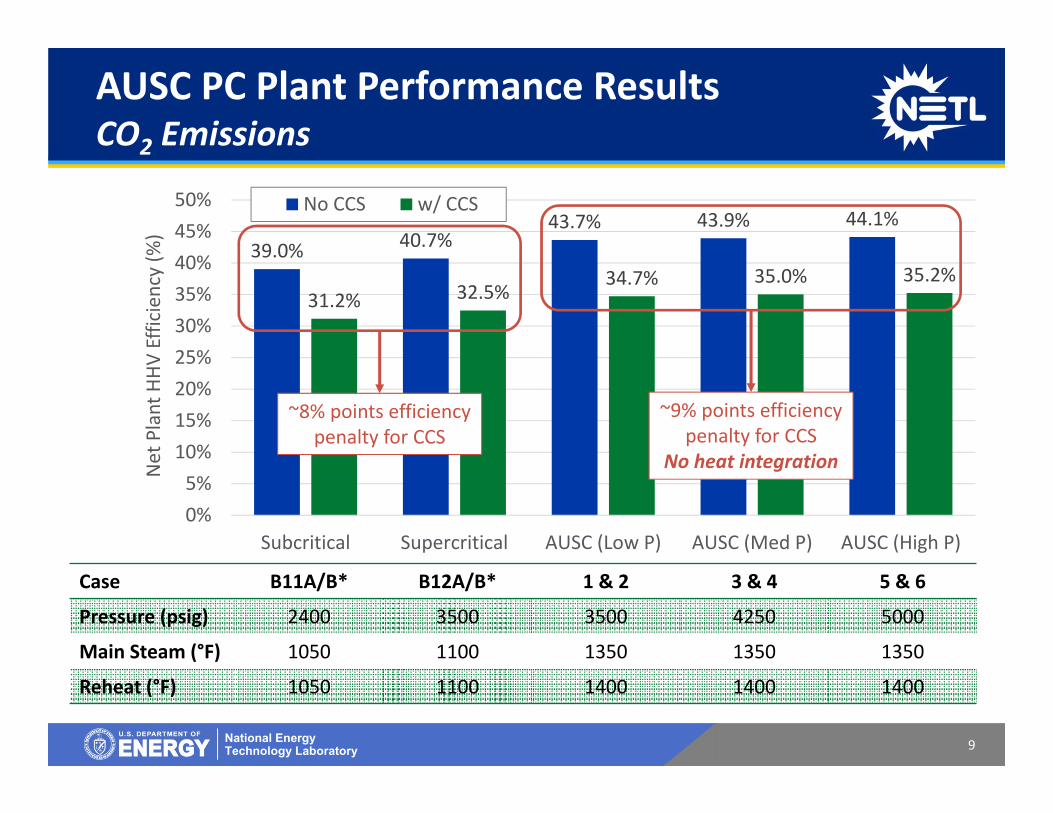
AUSC PC Plant Performance ResultsCO2 Emissions
Case B11A/B* B12A/B* 1 & 2 3 & 4 5 & 6
Pressure (psig) 2400 3500 3500 4250 5000
Main Steam (°F) 1050 1100 1350 1350 1350
Reheat (°F) 1050 1100 1400 1400 1400
39.0% 40.7%43.7% 43.9% 44.1%
31.2% 32.5%34.7% 35.0% 35.2%
0%5%
10%15%20%25%30%35%40%45%50%
Subcritical Supercritical AUSC (Low P) AUSC (Med P) AUSC (High P)
Net Plant HHV
Efficien
cy (%
)
No CCS w/ CCS
~8% points efficiencypenalty for CCS
~9% points efficiencypenalty for CCS
No heat integration

10National Energy Technology Laboratory
AUSC PC Plant Performance ResultsCO2 Emissions
Case B11A/B* B12A/B* 1 & 2 3 & 4 5 & 6
Pressure (psig) 2400 3500 3500 4250 5000
Main Steam (°F) 1050 1100 1350 1350 1350
Reheat (°F) 1050 1100 1400 1400 1400
1,683 1,618 1,515 1,506 1,500
190 183 173 172 171
0
200
400
600
800
1000
1200
1400
1600
1800
Subcritical Supercritical AUSC (Low P) AUSC (Med P) AUSC (High P)
CO₂ E
miss
ions (lb/MWhg
ross)
EPA’s Carbon Pollution Standards, Final Rule

11National Energy Technology Laboratory
Advanced Ultra-Supercritical (AUSC) Pulverized Coal Reference PlantsConclusions
– AUSC PC plants provide 3.0‐3.5% points efficiency improvement over baseline supercritical (SC) PC plants• Improvement of only 2.2‐2.7% points efficiency for CCS cases, though
thermal integration has not been considered– Efficiency gains due to increasing main steam pressure above 3500
psig provide diminishing benefit to plant costs– Greater confidence in AUSC steam turbine efficiency and cost has
been gained due to work performed by AUSC Materials ConsortiumFuture Work
– Economic analysis for all six cases nearing completion– A COE sensitivity on high‐nickel‐alloy components can be performed
once the weight fraction of the inverted tower design boiler for these materials is estimated
– Integration of CCS systems with AUSC plant to improve efficiency

12National Energy Technology Laboratory
Presentation Outline
• NETL’s Systems Engineering & Analysis (SEA) Division• Advanced Ultra‐Supercritical (AUSC) Pulverized Coal
Reference Plants– AUSC plants with higher thermal efficiency enabled by material
developments for increased temperature and pressure operation
• System analysis of Direct Power Extraction (DPE) power plants– Supports NETL’s Magnetohydrodynamics (MHD) research program– Leverages synergies between oxy‐coal MHD and Carbon Capture and
Storage (CCS)– Uses MHD topping cycle and AUSC steam bottoming cycle

13National Energy Technology Laboratory
“Direct Power Extraction” (DPE)Making Oxy‐fuel Combustion an Advantage• Description: Extracts power using magnetohydrodynamics (MHD)
– Higher efficiency because it uses temperatures only possible with oxy‐fuel.– Provides “capture‐ready” feature of oxy‐fuel; uses steam “bottoming” cycle.– Could be retrofit to coal steam plants
• What is the R&D?– Develop durable electrodes, current control, and optimal hydrodynamics.– Validate simulation tools and predict optimal generator configurations.– Identify and test new approaches for power extraction.
• Benefits– May allow retrofit of power plants with higher efficiency and carbon capture.– Potential spin‐offs to other industries/ applications:
• Electrically conductive ceramics, arc prevention/control (material processing)• Advanced propulsion and power (with DOD, NASA)
MHD generator concept
High‐temperature oxy‐fuel combustion (with conductivity seed) accelerates through magnetic field to produce current. Hot exhaust used in conventional steam boiler. Fuel

14National Energy Technology Laboratory
Direct Power Extraction (via MHD)
• To generate MHD power: Power σu2B2
– σ = gas/plasma electrical conductivity• Generated with very high (oxy‐fuel) temperature
and ionizing seed materials (e.g., potassium)– u = gas/plasma velocity
• Accelerate plasma to near sonic velocities– B = magnetic field
• Use superconducting magnets for high field
• To extract power:– Need robust electrodes capable of withstanding
high temperatures, thermal gradients, slagging, arcing, and high electric fields
– Extract thermal energy in high temperature exhaust for high overall power plant efficiency
USSR built MHD Generator From Petrick and Shumyatsky (1978)
MHD generator concept proven in 1980s w/ grid transferred power in both U.S. and USSR
15National Energy Technology Laboratory
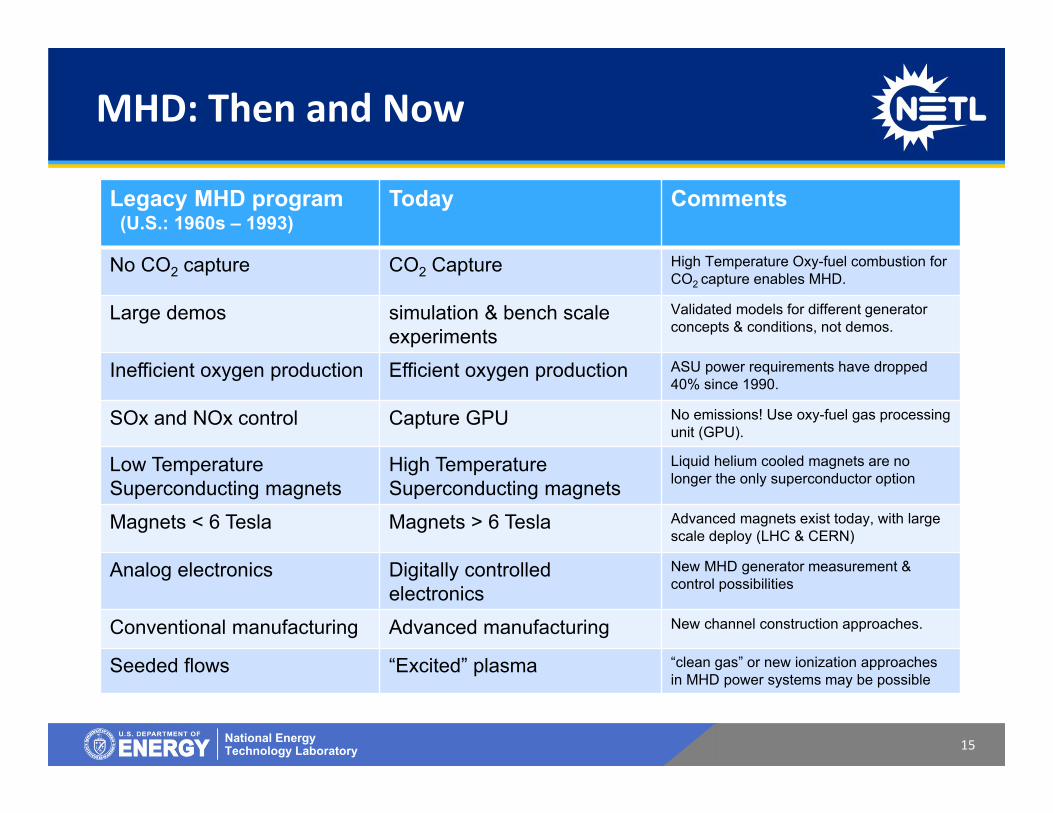
MHD: Then and Now
Legacy MHD program(U.S.: 1960s – 1993)
Today Comments
No CO2 capture CO2 Capture High Temperature Oxy-fuel combustion for CO2 capture enables MHD.
Large demos simulation & bench scale experiments
Validated models for different generator concepts & conditions, not demos.
Inefficient oxygen production Efficient oxygen production ASU power requirements have dropped 40% since 1990.
SOx and NOx control Capture GPU No emissions! Use oxy-fuel gas processing unit (GPU).
Low Temperature Superconducting magnets
High Temperature Superconducting magnets
Liquid helium cooled magnets are no longer the only superconductor option
Magnets < 6 Tesla Magnets > 6 Tesla Advanced magnets exist today, with large scale deploy (LHC & CERN)
Analog electronics Digitally controlledelectronics
New MHD generator measurement & control possibilities
Conventional manufacturing Advanced manufacturing New channel construction approaches.
Seeded flows “Excited” plasma “clean gas” or new ionization approaches in MHD power systems may be possible

16National Energy Technology Laboratory
DPE Plant Design Basis
• Nominal plant input of 1000 MWth PRB coal, dried to 5% moisture, dry‐fed with 8 wt% recycled CO2
• Coal combustion in 95% purity oxygen from ASU, with 90% slag rejection• Potassium formate seed injection to generate required plasma, with
EconoseedTM seed recovery process– ~1.3 wt% potassium loading to recover coal sulfur as gypsum– Requires natural gas partial oxidation to generate CO for reaction
• Advanced Ultra‐Supercritical (A‐USC) steam bottoming cycle with reheat (1350 °F/1400 °F/5000 psig)
• CO2 purification and compression unit for pipeline‐quality CO2 capture
Coal Prep
Cryo ASU
Oxy‐Comb DPE HRSG
Seed Recovery
CPU
A‐USC
Air
Coal
O2
Dry CoalCO2
Slag
~
H2O, Vent gas
Q
Plasma
H2O, Lime,Nat Gas, O2
Makeup Seed
Seed
Gypsum
Feed CO2
17National Energy Technology Laboratory
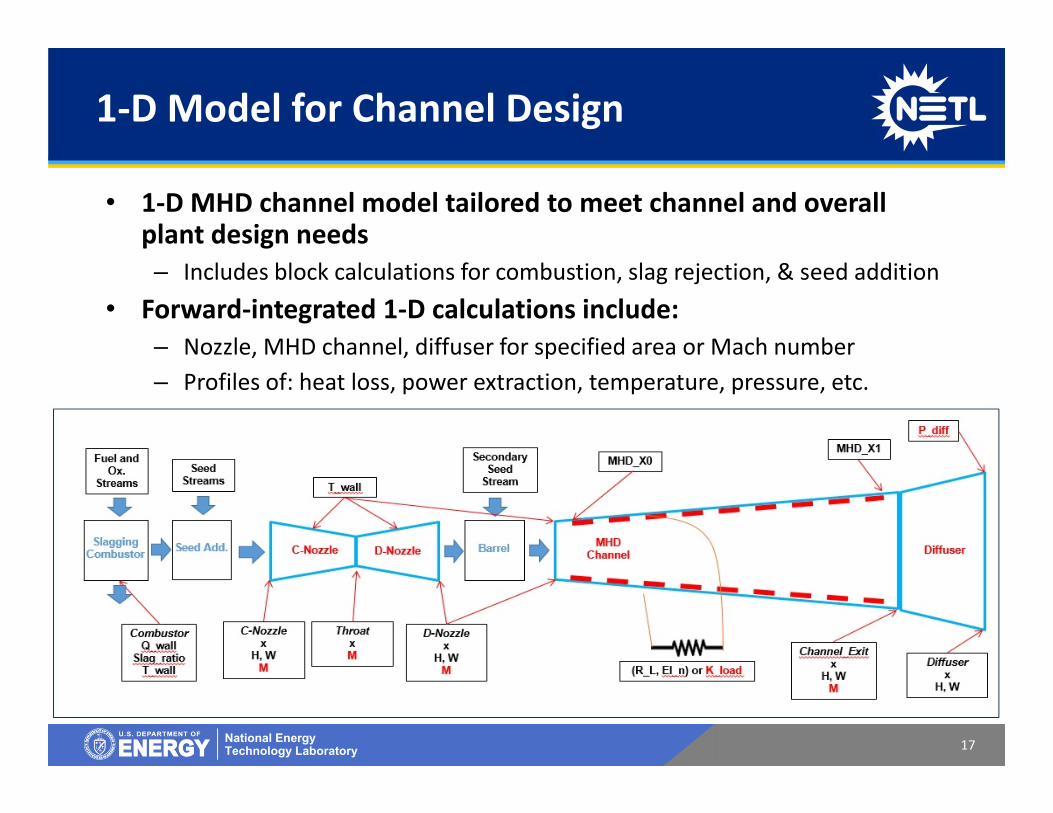
1‐D Model for Channel Design
• 1‐D MHD channel model tailored to meet channel and overall plant design needs– Includes block calculations for combustion, slag rejection, & seed addition
• Forward‐integrated 1‐D calculations include:– Nozzle, MHD channel, diffuser for specified area or Mach number– Profiles of: heat loss, power extraction, temperature, pressure, etc.

18National Energy Technology Laboratory
DPE Channel Design Assumptions
• Assume 6 Tesla superconducting NbTi magnet, channel wall temperature of ~1650 °C, and diffuser exhaust at atmospheric pressure
• Evaluate plants for two channel designs:– DPE‐1 (current state‐of‐the‐art): Mach 0.8 flow, fuel‐rich combustion,
modern channel electrical parameters– DPE‐2 (advanced channel design): Mach 0.95, stoichiometric combustion,
advanced electrical design for higher power density• Channel Processes Modeled:
– Convective and radiative heat losses to the channel walls– Boundary layer viscous losses– Electrode voltage drops due to loss of plasma electrical conductivity in the
thermal wall boundary layer– Tapered magnetic field to meet electrical channel constraints
• Channel designs optimized using a second law thermodynamic work potential function

19National Energy Technology Laboratory
Channel Design Results
• Stoichiometric combustion for DPE‐2:– Increases mass flow – Increases channel inlet
temperature
• Higher power density and Mach number for DPE‐2 allows for:– Higher power extraction
with increased pressure– Reduced channel length
and lower heat losses
Parameter units DPE‐1 DPE‐2
Stoichiometry 0.9 1.0
Combustor Pressure bar 10 14
Mass Flow kg/s 121.8 129.7
Mach Number 0.8 0.95
Combustor Exit Temperature °C 2904 2976
Channel & Diffuser Length m 19.6 14.4
Diffuser Exit Temperature °C 2247 2366
Convective Heat Loss MW 46 42
Radiative Heat Loss MW 59 51
MHD DC Power output MW 171 197
Electric Field, E_x V/m 2324 3842
Current Density, J_y A/cm2 0.79 1.50

20National Energy Technology Laboratory
Channel Design Results
• MHD profiles include:– Nozzle (first 2 meters)– Constant Mach number MHD
channel– Diffuser (last 2‐3 meters)
• Heat losses partially recovered in bottoming cycle
21National Energy Technology Laboratory
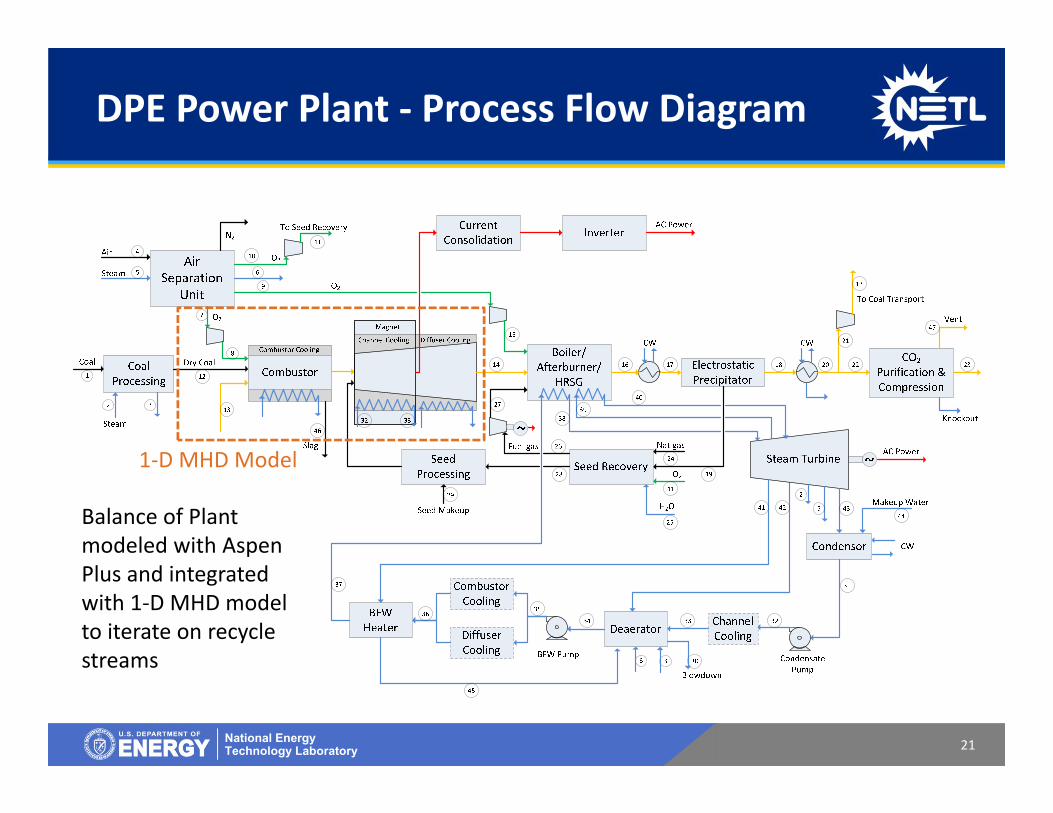
DPE Power Plant ‐ Process Flow Diagram
1‐D MHD Model
Balance of Plant modeled with Aspen Plus and integrated with 1‐D MHD model to iterate on recycle streams

22National Energy Technology Laboratory
Final Plant Performance Results
Parameter Units DPE‐1 DPE‐2
Gross Power Output MW 586 601
MHD Channel MW 166 191
Steam Turbine MW 420 410
Auxiliary Power MW 154 158
ASU Compressors MW 64 64
CPU Compressors MW 42 42
Oxygen Compressors MW 18 22
Other Auxiliaries MW 30 30
Net Power Output MW 433 443
Thermal Input (HHV) MW 1059 1059
Net Thermal Efficiency (HHV) % 40.9 41.9
Steam Cycle Efficiency (HHV) % 47.1 47.1
CO2 Capture Rate % 96.2 96.2
CO2 Purity % 99.99 99.99
• DPE‐2 includes– Higher channel
output– Lower steam cycle
output– Higher combustor
compression power• Thermal efficiencies
consistent with other oxy‐coal MHD studies
• NETL analysis considers more auxiliary systems than other oxy‐fired DPE studies to date

23National Energy Technology Laboratory 23National Energy Technology Laboratory
20%
25%
30%
35%
40%
45%
50%
55%
60%
65%
0 500 1,000 1,500 2,000 2,500
Net The
rmal Efficiency (HHV)
Coal Thermal Input (MWth)
Coal‐fired MHD Plant System Studies ‐ Efficiency
Weinstein, 1980‐81 Ishikawa, 1993Hals, 1982 Ishikawa, 1996 (disk)Weinstein, 1989 Borghi, 1994Davison, 1992 NETL, 2016Ishikawa, 1993
Air‐fired, no CCS Oxy‐fired, with CCS
Comparison of Air‐ vs. Oxy‐fired Systems
• Compared to legacy MHD studies with partial oxygen use
• Air‐fired efficiencies range from 35% to 60% for aggressiveMHD assumption cases– Cases >55% efficiency are
aspirational• Most oxy‐fired system
studies predict 40‐46% thermal efficiency– Includes CO2 capture– Reduced MHD power
due to CO2 higher heat capacity and tendency to dissociate, recovered in bottoming cycle

24National Energy Technology Laboratory 24National Energy Technology Laboratory
Advanced Coal‐fired Power Plants with CCSEfficiency Comparison (% HHV)
* Lower value denotes baseline case, upper value denotes endpoint of cumulative technology development pathway
32.635.2
37.7 39.3 40.9 41.939.5
48.946.5
59.0
0
10
20
30
40
50
60
Process effic
iency (%
HHV)
Bituminous Subbituminous

25National Energy Technology Laboratory 25National Energy Technology Laboratory
Advanced Coal‐fired Power Plants with CCSEfficiency Comparison References1) National Energy Technology Laboratory. Cost and Performance
Baseline for Fossil Energy Plants Volume 1b: Bituminous Coal (IGCC) to Electricity Revision 2b – Year Dollar Update, DOE/NETL‐2015/1727. July 2015.
2) Weiland, N., Shelton, W. W., White, C., and D. Gray. Performance Baseline For Direct‐fired sCO2 Cycles. The 5th International Symposium ‐ Supercritical CO2 Power Cycles. San Antonio, Texas. March 2016.
3) Shelton, W. W., Weiland, N., White, C., Plunkett, J., and D. Gray. Oxy‐coal‐fired Circulating Fluid Bed Combustion with a Commercial Utility‐size Supercritical CO2 Power Cycle. The 5th International Symposium ‐ Supercritical CO2 Power Cycles. San Antonio, Texas. March 2016.
4) National Energy Technology Laboratory. Techno‐Economic Analysis of Integrated Gasification Fuel Cell Systems. DOE/NETL‐341/112613. November 2014.

26National Energy Technology Laboratory
Conclusions and Future Work
• Developed the first pure oxygen‐fired coal MHD system performance analysis with CCS– Net plant thermal efficiency of ~42% (with CCS) is very competitive
• Currently estimating capital costs to determine COE, completing a baseline systems study – Large magnet cost in legacy systems is reduced ~75% for oxy‐coal DPE– Obtain channel and combustor costs by updating legacy cost scaling
algorithms to present day dollars– Seed recovery process cost estimated with Aspen Plus Economic Analyzer
• Several future analyses being considered to extend this work– Investigate longer channels for higher DPE power output– Investigate effects/dependency on channel wall temperature– Optimization of seed recovery process to improve cost & performance– Look at alternate fuels (e.g., petcoke), supersonic channels, non‐equilibrium
plasma effects, triple cycles, and other improvements

27National Energy Technology Laboratory
Questions

28National Energy Technology Laboratory
Back‐up Slides

29National Energy Technology Laboratory
Classification Survey and Thermodynamics Studies for Pulverized Coal (PC) Plants
Classification of advanced power plant steam conditions is driven by the boiler and turbine materials utilized*
* Rogalev, N., et al., “A Survey of State‐of‐the‐Art Development of Coal‐Fired Steam Turbine Power Plant Based on Advanced Ultrasupercritical Steam Technology,” Contemporary Engineering Sciences, 7(34):1807 ‐ 1825, 2014.
Subcritical (SubC)Supercritical (SC)
Ultra‐supercritical(USC)
Advanced Ultra‐supercritical(AUSC)

30National Energy Technology Laboratory
Coal Flowrate and Emissions Reductionsfor Advanced PC Plants
best US SubC
SOA ‐ SubC
SC
USC
AUSC
Existing Fleet AveUS SubC
0
5
10
15
20
25
30
30 35 40 45 50
FUEL % Red
uctio
n or Emission
s % Red
uctio
n
Net Plant Efficiency (% HHV)

31National Energy Technology Laboratory
Design BasisGeneral Evaluation Basis • Performance and Economic
simulation will conform with the following QGESS Guidelines:
– CO2 T&S– CO2 Purity– Cost Estimation Methodology– Capital Cost Scaling Methodology
• With modifications for A‐USC components
– Energy Balance– Feedstock Specifications– Fuel Prices– Process Modeling Design
Parameters– Techno‐Economic Analysis
Quality Guidelinesfor Energy System Studies
Advanced Ultra‐Supercritical (AUSC) Pulverized Coal Reference Plants

32National Energy Technology Laboratory
Thermodynamic Modeling(Thermoflow: Steam‐PRO /PEACE / Thermoflex)

33National Energy Technology Laboratory
Thermodynamic ModelingPlant Efficiency % HHV
39.0
40.0
41.0
42.0
43.0
44.0
45.0
1000 1100 1200 1300 1400
Plan
t Efficiency (%
HHV)
HP Turbine inlet temp (°F)
3500/697/135 psia +50°F Reheat
4250/850/100 psia +50°F Reheat
5015/1000/100 psia +50 F Reheat

34National Energy Technology Laboratory
AUSC PC Plant Performance ResultsNet Plant Efficiency
Efficiency gains diminish after
3,500/1350/1400
Subbituminous (Consortium) vs. Bituminous (NETL)
1,100 lb/MWh‐gross target in the Consortium work vs. 90% capture in
NETL work
STR7

Slide 34
STR7 A lot of mixing of bases here. I wouldn't present either slide 11 or 12. Just a table of the results in comparison to B11A/B, B12A/B.Shultz, Travis R. , 4/5/2016
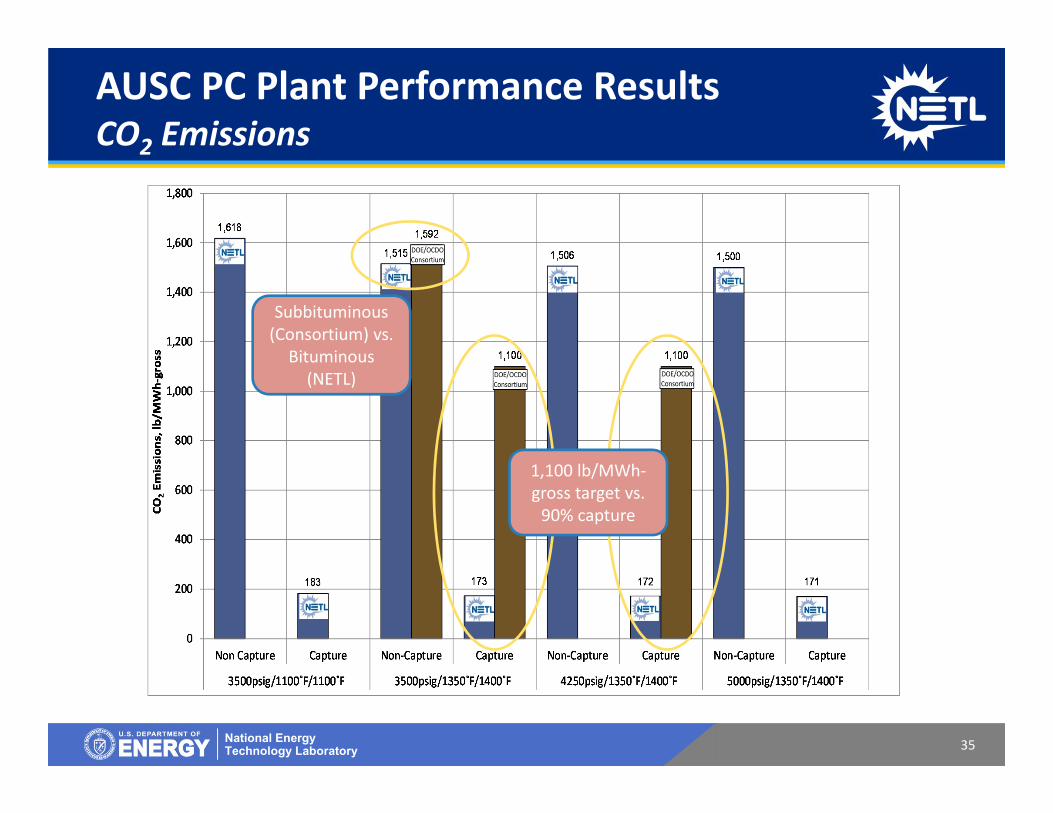
35National Energy Technology Laboratory
AUSC PC Plant Performance ResultsCO2 Emissions
Subbituminous (Consortium) vs.
Bituminous (NETL)
1,100 lb/MWh‐gross target vs. 90% capture

36National Energy Technology Laboratory
43.4%
34.8%
43.8%
35.2%
44.1%
35.4%
43.7%
34.7%
43.9%
35.0%
44.1%
35.2%
0%
5%
10%
15%
20%
25%
30%
35%
40%
45%
50%
Non Capture Capture Non‐Capture Capture Non‐Capture Capture
3500psig/1350˚F/1400˚F 4250psig/1350˚F/1400˚F 5000psig/1350˚F/1400˚F
Net Plant Efficiency, % (H
HV Ba
sis)
BBR ST Efficiencies Extracted GE Efficiencies
Very little effect switching to different ST stage efficiencies
Performance Results Net Plant Efficiency (HHV%)

37National Energy Technology Laboratory
Direct Power Extraction (via MHD)
• Magnetohydrodynamic (MHD) Power Generator: – Use a strong magnet and convert kinetic energy of conductive
gases directly to electric power• Higher thermal efficiency via higher temperatures
– Need to use in combined cycle– Synergy w/ oxy‐fuel for CCUS
• MHD cycle: turns efficiency disadvantage (oxygen production) to efficiency advantage(power production)!
USSR built MHD Generator From Petrick and Shumyatsky (1978)
MHD generator concept proven in 1980s w/ grid transferred power in both U.S. and USSR
Plot from Okuno et. al. 2007