Systems 8900 De Soto Avenue Canoga Park, California 91034 · 8900 De Soto Avenue Canoga Park,...
55
0 Energy Systems Group 8900 De Soto Avenue Canoga Park, California 91034
Transcript of Systems 8900 De Soto Avenue Canoga Park, California 91034 · 8900 De Soto Avenue Canoga Park,...

0
Energy Systems Group 8900 De Soto Avenue Canoga Park, California 91034


. . . . . . . . . . . . . . . . . . . . . . . . . . . . . . . . A b s t r a c t
I . I n t r o d u c t i o n . . . . . . . . . . . . . . . . . . . . . . . . . . . I I . Environmental Monitoring Summary R e s u l t s . . . . . . . . . . . . .
A . Radioac t ive M a t e r i a l s - 1979 . . . . . . . . . . . . . . . . . . . . . . . . . . . . . . . . B . Nonradioact ive M a t e r i a l s - 1979
. . . . . . . . . . . . . . . . . I I I . Environmental Monitoring Program
. . . . . . . . . . . . . . . . . . . . . A . General D e s c r i p t i o n
B . Sampling and Sample P r e p a r a t i o n . . . . . . . . . . . . . . . 1 . S o i l . . . . . . . . . . . . . . . . . . . . . . . . . . . 2 . Vegetat ion . . . . . . . . . . . . . . . . . . . . . . . . 3 . Water . . . . . . . . . . . . . . . . . . . . . .... . 4 . Ambient A i r . . . . . . . . . . . . . . . . . . . . . . .
. . . . . . . . . . . . . . . . . . . C . C o u n t i n g a n d c a l i b r a t i o n
. . . . . . . . . . . . . . . . . . . D . Nonradioact i ve M a t e r i a l s
. . . . . . . . . . . . . . . . . . . IV . E f f l u e n t Monitoring Program
. . . . . . . . . . . . . . . . . . . . A . Treatment and Hand1 i n g
. . . . . . . . . . B . Energy Systems Group Faci 1 i t y D e s c r i p t i o n s
. . . . . . . . . . . . . . . . . . . . . . . 1 . De Soto S i t e
2 . Santa Susana F i e l d L a b o r a t o r i e s S i t e . . . . . . . . . . . C . Est imat ion o f General Popula t ion Dose . . . . . . . . . . . .
Appendices
A . Comparison o f Environmental R a d i o a c t i v i t y Data f o r . . . . . . . . . . . . . . . . . . . 1979 with Previous Years
B . Cal i f o r n i a Regional Water Qua1 i t y Control Board C r i t e r i a f o r Discharging Nonradioact ive Cons t i t u e n t s from
. . . . . . . . . . . . . . . . . . Rocketdyne Div i s ion . SSFL
. . . . . . . . . . . . . . . . . . . . . . . . . . C . References
. . . . . . . . . . . . . . . . . . . . D . External D i s t r i b u t i o n
Page
6
7
19
19
27
29
29
29
29
35
35
37
37
38
ESG- 80- 7
3

Page
. . . . . . . . . . . . . . . . . S o i l R a d i o a c t i v i t y Data . 1979
S o i l P lu ton ium R a d i o a c t i v i t y Data -- 1979 . . . . . . + . . . . 18
Vegetat ion Radi o a c t i v i ty Data . 1979 . . . . . . . . . . . . . . 20
SSFL S i t e . Domestic Water R a d i o a c t i v i t y Data . 1979 . . . . . . 2 1
B e l l Creek and Rocketdyne S i t e Reten t ion Pond R a d i o a c t i v i t y Data . 1979 . . . . . . . . . . . . . . . . . . . 22
Ambient A i r Rad ioac t i v i t y Data . 1979 . . . . . . . . . . . . . 2
De Soto and SSFL S i t e s . Ambient Rad ia t i on Dosimetry Data . 1979 . . . . . . . . . . . . . . . . . . . . . . . . . . 25
Nonrad ioac t i ve Cons t i tuen ts and T r i t i u m i n Wastewater Discharged t o U n r e s t r i c t e d Areas . 1979 . . . . . . . . . . . . 26
Sample S t a t i o n Locat ions . . . . . . . . . . . . . . . . . . . . 2
Minimum R a d i o a c t i v i t y De tec t i on L i m i t s (MDL) . . . . . . . . . . 38
Atmospher ica l l y Discharged E f f l u e n t Re1 eased t o U n r e s t r i c t e d Areas . 1979 . . . . . . . . . . . . . . . . . . . 0
L i q u i d E f f l u e n t Discharged t o San i t a r y Sewer . 1979 . . . . . . 2
Surface Wind Cond i t ions . . . . . . . . . . . . . . . . . . . . 5
Downwind Concentrat ion o f Gaseous E f f l u e n t s . 1979 . . . . . . . 6
Popu la t ion Dose Est imates f o r Atmospheric Discharge E f f l u e n t s . . . . . . . . . . . . . . . . . . . . . . . . . . . 7
Soi 1 R a d i o a c t i v i t y Data . 1957 Through 1979 . . . . . . . . . . 50
Vegetat ion R a d i o a c t i v i t y Data . 1957 Through 1979 . . . . . . . 5 1
SSP! . S i t e Domestic Water R a d i o a c t i v i t y Data - 1957 Through 1979 . . . . . . . . . . . . . . . . . . . . . . . 2
B e l l Creek and Rocketdyne D i v i s i o n Reten t ion Pond R a d i o a c t i v i t y Data . 1966 Through 1979 . . . . . . . . . . . . . Ambient A i r R a d i o a c t i v i t y Concentrat ion Data . 1957 Through 1979 . . . . . . . . . . . . . . . . . . . . . . . NPDES No . CA00.01309. E f f e c t i v e September 27. . . * . a * . 5

Energy Systems Group - De Soto S i t e . . . . . . . . . . . . . . . . Energy Systems Group - Santa Susana Field Laborator ies S i t e . . . . Map of Santa Susana F ie ld Laborator ies S i t e F a c i l i t i e s . . . . . . Map of General Los Angeles Area . . . . . . . . . . . . . . . . . . Map of Canoga Park, Simi Valley, Agoura and Calabasas Sampling S t a t i o n s . . . . . . . . . . . . . . . . . . . . . . . . .
ap of De Soto S i t e and Vic in i ty Sampling S t a t i o n s . . . . . . . . Map of Santa Susana F ie ld Laborator ies S i t e Sampling S t a t i o n s . . . Dai l y Averaged Long-Li ved Airborne Radi o a c t i vi t y a t t he De Soto and Santa Susana F ie ld Laborator ies S i t e - 1979 . . . . . .
Page
8
9
11 15

Environmental and facility effluent radioactivity monitoring
at the Energy Systems Group (ESG) of Rockwell International
(Cal ifornia operations) is performed by the Radiation and Nuclear
Safety Group of the Health, Safety and Radiation Services Depart-
ment. Soil, vegetation, and surface water are routinely sampled
to a distance of 10 miles from ESG sites. Continuous ambient air
samplingand radiationmonitoring bythermo1uminescentdosimetry are
performed on-site for measuring airborne radioactivity concentra-
tions and site ambient radiation levels. Radioactivity in ef-
fluents discharged to the atmosphere from ESG facilities is con-
tinuously sampled and monitored to ensure that level s released to
unrestricted areas are within appropriate limits, and to identify
processes which may require additional engineering safeguards to
minimize radioactivity levels in such effluents. In addition,
selected nonradioactive constituent concentrations in surface
water discharged to unrestricted areas are determined. This
report summarizes and discusses monitoring results for 1979.
The random variations observed in the environmental monitor-
ing data indicate that no local source of unnatural radioactive
material exists in the environs. Additionally, the similarity
between on-site and off-site results further indicates that the
contribution to general environmental radioactivity due to opera-
tions at the ESG i s essentially nonexistent.
The environmental radioactivity reported herein is attributed
to natural sources and to fallout of radioactive material from
foreign atmospheric testing of nuclear devices.

Energy Systems Group (ESG) of Rockwe7 1 In te rna t i nal Corporation
aged in nuclear energy r eve1 opmen t s ince
current ly working on the design, development, f abr ica t ion , s t ing of comp
nents and systems f o r central s t a t ion power plants , on the fabr ica t ion of nucl
fuel f o r t e s t and research reactors , and on the Decontamination and Disposition
of Facil i t i e s ( D & D ) Program. Other programs include the development and f
cat ion of systems f o r stack gas SO2 con t ro l , production of gaseous and l iquid
fue l s from coal , and so l a r and ocean thermal energy development.
The administrat ion, s c i e n t i f i c research, and m nufacturing f a c i l i t i e s
(Figure I ) a r e located in Canoga Park, Cal i f o rn i a , approximately 23 miles north-
west of downtown Los ngeles. The s i t e i s
f loor . Certain nuclear programs, under l icenses issued by the Nuclear Regulator
Commission ( N R C ) and the S t a t e of Cal i fornia , a r e conducted he ( 1 ) Building 001 containing uranium fuel production f a c i l i t i e s
004 contai n i n analyt ica l chemistry laborator ies , nd a gamma i r rad ia t ion f a c i l -
i t y . The 290-acre Santa Susana Field Laboratories s i t e (SSFL), Figure
ted in the Simi Mills of Ventura County, pproximately 23 mil es northwest of
downtown Los Angeles. The SSFL s i t e i s s i tua ted i n ru in typical of
mountain areas of recent geological age. The s i t e may be described a s an
i r regu la r plateau sprinkled with outcroppings above the more level
peripheral eroded gull i e s . Elevations of the s i t e v a l eve l . The surface mantle cons i s t s of sand and cl y so i l on sandstone.
0 t h Department of Energy ( D O E ) and ESG owned f a c i l i t i e s share t h i s s i t e , show
igure 3. The SSFL a l so contains f a c i l i t i s i n which nuclear operations
RC and the S t a t e , a r e conducted. The licensed f ac i i t i e s include:
ckwel l International Hot Laboratory (RIHL) , uilding 020; ( 2 ) t h
t e r i a l s Development Fac i l i ty ( MDF) , Building 055; ( 3
i l i t y containing the L-85 nuclear examination and res
93; and ( 4 ) several X-radiography inspection f
of these s i t e s , in re la t ion t o nearby communities, i s shown in


N cna
OWNED
ROCKWELLIGOVT ROCKWELL ROCKWELL RGCKWELL ROCKWELL ROCKWELL
GOVT. '
ROCKWELL GOVT. GOVT. GOVT.
ROCKWELL GOVT.
ROCKWELL GOVT. GOVT. GOVT. GOVT. GOVT. GOVT. GOVT. GOVT. GOVT. GOVT. GOVT. GOVT. GOVT. GOVT. GOVT.
ROCKWELL GOVT. GOVT. GOVT.
ROCKWELL ROCKWELL
GOVT. ROCKWELL
GOVT. GOVT. GOVT. GOVT. GOVT. GOVT.
ROCKWELL GOVT.
ROCKWELL ROCKWELL ROCKWELL ROCKWELL ROCKWELL ROCKWELL
GOVT. ROCKWELL ROCKWELL ROCKWELL ROCKWELL ROCKWELL ROCKWELL
GOVT. ROCKWELL ROCKWELL ROCKWELL
GOVT. GOVT. GOVT. GOVT. GOVT. GOVT. GOVT.
ROCKWELL ROCKWELL
GOVT. ROCKWELL
ZONE
4C 6D 6D 6E 6E 9G 7 0 6F 7D 7D 3C 7G 7D 8G 6C 6C 5D 6D 6D 6E 6D 6D 3 0 4C 5D 5C 5D 7 E 7 E 2C 5C 5D 6C 4C 6E 5D 8G 7 E 8 D 7E 3D 7E 7 E 4C 6C 4C 4C 9 F 5B 5C 4B 8G 4B 6F 6F 8H 4B 106 26 3C 7G 7 H 6E 7D 7 0 7 0 6E 7E 7 E 8H 7G 7 6 8 6
BUl LDlNG NUMBER DESCRIPTION
EXCESS EQUIPMENT STORAGE ENVIRONMENTAL SYSTEMS SODIUM LABORATORY SODIUM STORAGE FLAMMABLE MATERIAL STORAGE ENGINEERING DEVELOPMENT FACILITY D&D MANUFACTURING SUPPORT SHOP TOOL CRIB - ETEC OPERATIONS THERMAL TRANSIENT FACILITY SODIUM STORAGE BUlLDlNG SUPPLEMENTARY STORAGE BUILDING ETEC CONSTRUCTION STAGING ENERGY SYSTEMS GROUP HOT LABORATORY RADIOACTIVE WASTE, DECONTAMINATION AND PACKAGING BUILDING RADIOACTIVE WASTE STORAGE VAULT BUILDING LIQUID METALS CHEMISTRY LABORATORY DEVELOPMENT TEST BUI LDING ETEC INSTRUMENTATION & INVENTORY STORAGE SMALL COMPONENT TEST LOOP CONTROL BUILDING ETEC QUALITY ASSURANCE LMFBR FUEL SAFETY SODIUM STORAGE SITE PURCHASING OFFICE ETEC GENERAL TEST RIA WASTE OFFICE BUILDING ETEC OPERATIONS ETEC ADMINISTRATION OFFICE BUILDING FACl LITIES AND INDUSTRIAL ENGINEERING STORAGE BUILDING LMFBR TEST RMDF CLEAN SHOP MATERIAL OFFICE ANNEX PDU INSTRUMENTATION BUILDING PDV CONTROL ROOM PLUTONIUM FACILITY ETEC LABORATORY LARGE LEAK TEST RIG ETEC INSTRUMENTATION SOURCE AND SPECIAL NUCLEAR MATERIAL STORAGE ETEC CHEMISTRY LABORATORY INSTRUMENTATION REPAIR AND CALIBRATION BUILDING ETEC STORAGE BUILDING CONTAMINATED EOUIPMENT STORAGE BUILDING CONTROL BUILDING - NEUTRON RADIOGRAPHY BUILDING NEUTRON RADIOGRAPHY BUILDING ADVANCED FUELS LABORATORY DECON TRAILER SODIUM BURN FACILITY SODIUM REACTOR EXPERIMENT - D&D CONTROL CENTER BOX SHOP X-RAY BUILDING X-RAY BUILDING GAMMAGRAPH BUlLDlNG FIRE PUli/lP BUILDING - D&D LARGE LEAK INJECTOR DEVICE (LL ID) TEST CONTROL BUILDING FUEL OIL CONTROL BUILDING TlME CLOCK BUILDING TlME CLOCK BUILDING RESEARCH AND DEVELOPMENT LABORATORY BUILDING CONTROL ELEMENT TEST STRUCTURE SCTl SUPPORT BUl LDlNG SODIUM COMPONENT TEST INSTALLATION ETEC PUMP BEARING TEST FACILITY CONTROL BUlLDlNG SCTl SUPPORT BUILDING COMPRESSOR BUlLDlNG CHEMICAL STORAGE BUILDING RESEARCH AND DEVELOPMENT LABORATORY BUILDING DEVELOPMENT TEST BUILDING TEST LOOP ENCLOSURE CONTROL SHELTER BUILDING
OWNED
GOVT. ROCKWELL
GOVT. GOVT. GOVT. GOVT. GOVT.
ROCKWELL GOVT. GOVT. GOVT. GOVT. GOVT. GOVT. GOVT.
ROCKWELL ROCKWELL ROCKWELL ROCKWELL ROCKWELL
GOVT. ROCKWELL ROCKWELL ROCKWELL
GOVT. ROCKWELL ROCKWELL ROCKWELL ROCKWELL ROCKWELL ROCKWELL
GOVT. ROCKWELL
GOVT. ROCKWELL
GOVT. ROCKWELL
GOVT. GOVT. GOVT. GOVT. GOVT. GOVT. GOVT. GOVT. GOVT. GOVT.
ROCKWELL ROCKWE L L
GOVT. ROCKWE LL ROCKWELL ROCKWELL ROCKWELL
GOVT. GOVT.
ROCKWELL GOVT. GOVT.
ROCKWELL GOVT. GOVT. GOVT. GOVT.
ROCKWELL GOVT. GOVT. GOVT. GOVT. GOVT. GOVT. GOVT. SCE
BUILDING ZONE NUMBER DESCRIPTION
ETEC CONSTRUCTION STAGING STG. NEUTRON RADIOGRAPHY STORAGE PUMP BEARING TEST STRUCTURE UNINTERRUPTIBLE POWER SUPPLY MOTOR GENERATOR BUILDING SODIUM PUMP TEST FACI L lTY CHCF HYDRAULIC TEST INSTRUMENTATION BUlLDlNG GOVERNMENT PROJECT OFFICES ETEC OFFICE COMPLEX REST ROOM -TRAILER ETEC OFFICE COMPLEX ETEC OFFICE COMPLEX ETEC OFFICE COMPLEX REST ROOM TRAILER COMPRESSED GAS BOTTLE STORAGE DOCK PARKING LOT PARKING LOT PARKING LOT PARKING LOT PARKING LOT PARKING LOT PARKING LOT PARKING LOT PARKING LOT PARKING LOT CONSERVATION STORAGE YARD SEWAGE TREATMENT PLANT HYDROGEN RECOMBINER TEST PAINT SPRAY BOOTH STORAGE BUl LDlNG DRAINAGE SUMP COOLING TOWER RADIOACTIVE ACCOUNTABLE WASTE STORAGE BUILDING GUARD POST NO. 1 ETEC INVENTORY STORAGE REACTOR COOLING WATER PAD GUARD POST RECEIVING & STORAGE BUILDING INTERIM RADIOACTIVE WASTE - D&D SCTl COOLING TOWER LOW LEVEL RADIOACTIVE WASTE PROCESSING RMDF OXIDATION FACILITY ELECTRICAL SUBSTATION AUXILIARY SKID BUILDING ELECTRICAL SUBSTATION NO. 3 COLD TRAP VAULT (SRE) - D&D WATER TANK (DEER FLATS) WATER TANK (DEER FLATS) ELECTRICAL SUBSTATION ELECTRICAL SUBSTATION ELECTRICAL SUBSTATION ELECTRICAL SUBSTATION ELECTRICAL SUBSTATION ELECTRICAL SUBSTATION ELECTRICAL SUBSTATION ELECTRICAL SUBSTATION ELECTRICAL SUBSTATION ELECTRICAL SUBSTATION STORAGE SHED 1.5M FUEL OIL STORAGE TANK 86K FUEL OIL STORAGE DAY TANK ELECTRICAL SUBSTATION PRIMARY FILL TANK VAULT - D&D ELECTRICAL SUBSTATION ELECTRICAL SUBSTATION ELECTRICAL SUBSTATION ELECTRICAL SUBSTATION ELECTRICAL SUBSTATION ELECTRICAL SUBSTATION DRAINAGE CONTROL DAM ELECTRICAL SUBSTATION ELECTRICAL SUBSTATION
OWNED
ROCKWELL ROCKWELL ROCKWE LL ROCKWELL ROCKWELL
GOVT. ROCKWELL ROCKWELL ROCKWELL ROCKWELL ROCKWELL
GOVT.
ROCKWELL ROCKWELL ROCKWELL ROCKWELL ROCKWELL ROCKWELL ROCKWELL ROCKWELL ROCKWELL ROCKWELL ROCKWELL ROCKWELL
ZONE
9 F 7E 11G 6E 5D 7 H 7 H 8G 7F 10F 11G 6D
BUILDING NUMBER DESCRIPTION
800 ELECTRICAL SUBSTATION 805 TIME CLOCK BUILDING 814 LARGE LEAK INJECTOR DEVICE 816 RECOMBINER CANOPY 836 TlME CLOCK BUILDING 854 TEST STRUCTURE 863 HYDRAULIC TEST LOOP 873 HYDRAULIC TEST LABORATORY 883 ELECTRICAL SUBSTATION 885 PISTON RANGE 886 SODIUM DlSPOSAL FACILITY 924 ELECTRICAL SUBSTATION
BOWL AREA
306 PUMP HOUSE NO. 1 nn7 PUMP HOUSE NO. 2
G -12 308 CONTROL CENTER G -13 320 POWER CONTROL H -12 334 V.T.S. - 3 OPERATIONS AND WORKSHOP H -12 391 V.T.S. - 3 WORKSHOP H -12 393 PLUME STUDY BLDG. G -12 An1 INSTRUMENT AND WORKSHOP - -
H -12 405 STEAM PLANT BLDG. G -13 416 ELECTRICAL BLDG. G -13 437 PRE-TEST - BOWL F -11 964 SEWAGE TREATMENT PLANT BLDG.
Figure 3. Map of Santa Susana Field Laboratories S i te
Fac i l i t ies (Sheet 2 of 2 )
13


Also included within the SSFL s i t e i s an 82-acre Government-optioned area
where DOE-contract a c t i v i t i e s a r e conducted, primarily by the non-nuclear Energy
Techno1 ogy Engineering Center ( E T E C ) . The major operational nucl ear ins ta l 1 at ion
within the optioned area i s the Radioactive Material Disposal Fac i l i ty (RMDF),
c t ivated nucl ear
i s s i l e materia
Licensed programs conducted during 1979 included : ( I ) commercia
of the L-85 reactor fo r central s t a t ion power plant operator t ra in ing
neutron radiography inspection of precision forginqs, cas t ings , and e
and explosive devices fo r manufacturing defects ; ( 2 ) the operation of
operation
and fo r
ec t ronic
the R I H L
f o r nuclear reactor fuel and system component examination and the fabr ica t ion of
sealed radiat ion sources; and ( 3 ) the operation of nuclear fuel manufacturing
f a c i l i t i e s f o r the production of experimental and t e s t reactor fuel involving
enriched uranium, and development of processes f o r fabr ica t ion of advanced fue l s .
The basic policy f o r control of radiological and chemical hazards a t
ESG requires t ha t through engineering controls adequate containment of such mate-
r i a l s be provided, and through r ig id operational controls , t ha t f a c i l i t y e f f luen t
releases and external radiat ion levels a re reduced t o a minimum. The environ-
mental monitoring program provides a measure of the effectiveness of the Group
safe ty procedures and of the engineering safeguards incorporated in to f a c i l i t y
designs. Specific radionucl ides in f a c i l i ty e f f luen t o r environmental samples,
low rad ioac t iv i ty 1
1 or radiochem
y levels were obser
I n addition t o environmental monitori, ,g, work area a i r and atmospherically
discharged e f f luen t s a re continuously monitored or sampled, as appropriate. This
provides a d i r ec t measure of the effectiveness of engineering controls and allows
remedial act ion t o be taken before a s ign i f i can t re lease of hazardous material
can occur.
Environmental sampling stations that are located within the boundaries o
ESG s i t e s are referred t o as "on-si te" s ta t ions; those located within a 10-mile
radius of the s i t e s are referred t o as "off-si te" s ta t ions. The on-site environs
of the De Soto and SSFL s i t e s are sampled monthly t o determine the concentration
of radioactivity in typical surface s o i l , vegetation, and water. Soil i s also
sampled on-si t e semiannually for pl utonium analysis. Similar off-si t e environ-
mental samples, except for plutonium analysis, are obtained quarterly. Continu-
ous on-si t e and off-si t e ambient a i r sampling provides information concerning
1ong-l i ved airborne particulate radioactivity, A s i t e ambient radiation monitor-
ing program, ut i l izing thermol uminescent dosimetry (ILD), begun in 1971, measures
radiation levels in the environs of b o t h the De Soto and SSFL s i t e s .
Nonradioactive wastes released to unrestricted areas are l imi ted to 1 iquids
released to sanitary sewage systems and to surface water drainage systems.
intentional releases of any 1 iquid pol 1 utants are made t o unrestricted areas.
Liquid wastes generated a t the De Soto s i t e are discharged into the c i ty sewage
system. This effluent i s sampled for determination of radioactivity. Sanitary
sewage from a l l DOE and ESG f a c i l i t i e s a t the SSFL s i t e i s treated a t an on-site
sewage plant. The plant effluent drains into a retention pond, located on the
adjoining Rocketdyne Division s i t e . The surface water drainage system of the
SSFL i s composed of catch ponds and open drainage ditches leading to the Rocket-
dyne retention pond. This pond also receives the ESG s i t e sewage plant effluent.
Water from the pond may be reclaimed as industrial process water, or i t may be
released off s i t e into Be11 Creek, a tr ibutary of the Los Angeles River, The
pond was a1 so monitored a t discharge for radioactive and nonradioactive
pollutants by Rocketdyne Division as required by discharge permits issued to
Rocketdyne by the Cal i fornia Regional Water Qua1 i ty Control Board.
This report summarizes environmental monitoring results for 1979. com-
pari son of 1979 radi oacti vi ty resul t s wi t h previous years appears in Appendi x A .

T A B L E 1 - A
S O I L R A D I O A C T I V I T Y DATA - 1 9 7
"Maximum value observed for s i n g 1
T A B L E 1 - B
S O I L PLUTONIUM R A D I O A C T I V I T Y DATA - 1 9 7 9

MMA UL
A . RADIOACTIVE MATERIALS - 1979
The sampling and ana ly t i c methods used in the environmental monitoring pro-
gram f o r radioact ive mater ia ls a r e described in Section 111.
The average rad ioac t iv i ty concentrat ions in local s o i l , vegetat ion, surface
water , and in ambient a i r f o r 1979 a r e presented in Tables 1 through 5. In c a l -
cula t ing the averaged concentration value f o r the t a b l e s , those individual sam-
ples having rad ioac t iv i ty l eve l s 1 ess than t h e i r minimum detect ion l eve l s (MDL)
a r e assumed t o have a concentration equal t o the MDL. This method of data aver-
aging, required by DOE Manual Chapter 0513, af fords a s i g n i f i c a n t level of con-
servatism in the d a t a , as evident in the t a b l e s , in t h a t most r ad ioac t iv i ty con-
cen t ra t ions a re reported as " l e s s than" ( < ) values. Thus, f o r measurements in
which some apparent r ad ioac t iv i ty concentrat ions a r e below the MDL, the t rue
averaged value i s ac tua l ly somewhat l e s s than the value reported.
The maximum level of r a d i o a c t i v i t y detected f o r a s ing le sample i s reported
because of i t s s igni f icance in indica t ing the existence of a major episode o r
area-wide locat ion of radioact ive material deposi t ion. None of the maximum ob-
served values, which occurred randomly during the year a s shown in the t a b l e s ,
show a g r e a t increase over the average values beyond natural v a r i a b i l i t y . The
ambient a i r sampling data show no g r e a t l y increasing o r decreasing t rends f o r
the year and can be described as general ly constant l eve l s with only very minor
t r a n s i e n t increases in local airborne rad ioac t iv i ty l e v e l s .
The r e s u l t s reported in Tables 1 - A and 2 show no s i g n i f i c a n t d i f ference be-
tween on-s i t e and o f f - s i t e samples. Table 1-6 shows no s i g n i f i c a n t va r i a t ions
in so i l plutonium concentrat ions f o r the 1979 sample s e t s . The detected a c t i v i t y
i s due t o a va r i e ty of na tu ra l ly occurring radionuclides, and t o radioact ive
f a l l o u t r e su l t ing from dispersa l of nuclear weapons mater ia ls and f i s s i o n products
by atmospheric t e s t i n g although no atmospheric t e s t s in the northern hemisphere 7 40 were announced during 1979. Naturally occurring radionuclides include Be , K ,
~ b ~ ~ , ~ m ~ ~ ~ , and the uranium and thorium s e r i e s ( including the i n e r t gas radon
and i t s radioact ive daughters) . Radioactivi ty from f a l l o u t cons i s t s primari ly of
the f i s s i o n products Sr 239 - ygO, ~s~~~~ and ~m~~~~ and a1 so u~~~ and P u .

T A B L E 2
VEGETATION RADIOACTIVITY DATA - 1979
Area 1 A c t i v i t y No. Samples
On S i t e
O f f S i t e
Dry Weight Annual
Average Value
(<5.2 + 3.5) l o - *
6
>
9
Gross R a d i o a c t i v i t y ( u C i / g )
Ash ., I Maximum Value*
% o f Samples
w i t h A c t i v i t y 41DL
Annual Average Value (95% Conf idence i e v e l )
*Maximum v a l u e observed f o r s i n g l e sample
and Month Observed
(<2 .4 - 1 . 6 ) 10- 7
4 (1.39 = 0.02) 10-
Domestic water used a t the SSFL s i t e i s obtained from Ventura County Water
D i s t r i c t No. 17, which a l so supplies nearby communities, and i s d i s t r ibu ted on
s i t e by the same piping system previously used when a11 f a c i l i t y process water
was obtained from on-si t e we1 1 s . Two on-si t e water we1 1s were operated during
1979 to reduce consumption of Ventura County domestic water. The well water
proportion in the blend averaged about 69% f o r the year f o r a t o t a l well water 7 consumption of approximately 7.9 x 10 ga l . Pressure f o r the water system i s
provided by elevated s torage tanks.
I 8
Water from the system i s sampled monthly a t t ~ o widely separated SSFL s i t e
locat ions . The average domestic water r ad ioac t iv i ty concentration i s presented
in Table 3.
1.4 x (December) 2.48 x (May)
As discussed e a r l i e r , surface waters discharged from SSFL f a c i l i t i e s and
the sewage p lant e f f l u e n t dra in southward i n t o a re tent ion pond on Rocketdyne
property. When f u l l , the pond may be drained in to Bell Creek, a t r i b u t a r y of
3 5
0

T A B L E 3
SSFL SITE - DOMESTIC WATER RADIOACTIVITY DATA - 1979
Average Val ue 1 (95% Confidence Level ) Month Observed
"Maximum value observed fo r s ingle sample
the Los Angeles River in the San Fernando Valley, Los Angeles County. Pursuant
t o the requirements of Los Angel es Regional Water Qua1 i t y Control Board Resol u -
t ion 66-49 of September 21, 1966, a sampling s ta t ion fo r evaluating environ-
mental radioact iv i ty in Bell Canyon was established in 1966. I t i s located
approximately 2 . 5 miles downstream from the southern Rockwell International
Corporation boundary. Samples, obtained and analyzed monthly, include stream
bed mud, vegetat ion, and water. Average radioact iv i ty concentrations in
Rocketdyne and Bell Creek samples a re presented i n Table 4.
Comparison of the rad ioac t iv i ty concentrations in water from the ponds and
from Bell Creek with t ha t of the domestic water supply shows no s ign i f i can t
variat ion in e i t he r alpha or beta a c t i v i t y .
The SSFL s i t e surface water and the ambient a i r r ad ioac t iv i ty concentration
Guide values selected f o r each s i t e a r e the most r e s t r i c t i v e l im i t s f o r those
radionuclides current ly in use a t ESG f a c i l i t i e s . Radioactivity concentration
guide values a re those concentration l im i t s adopted by the Department of Energy,
the Nuclear Regulatory Commission, and the S ta te of California as maximum per-
missible concentrations ( M P C ) . The MPC values a r e dependent upon the radio-
nuclide and i t s behavior as a soluble o r an insoluble material . For comparison
with r e su l t s of the environmental and e f f luen t monitoring, the lowest HPC value
f o r the various radionuclides present i s se lected. Accordingly, f o r SSFL s i t e
surface water, the Guide value of 5 x l o m b 1.1Ci/mt alpha a c t i v i t y corresponding
t o puZ3' and 3 x l o e 7 pCi/mQ beta a c t i v i t y corresponding to srgO a r e appropriate.

TABLE 4 BELL CREEK AND ROCKETDYNE SITE RETENTION POND
RADIOACTIVITY DATA - 1979
No. Samples
12
12
Gross R a d i o a c t i v i t y C o n c e n t r a t i o n
Average Va lue (95%
Con f idence L e v e l )
Z o f Samol es Maximum*
Va lue and donth Observed
Area A c t i v i t y
'i
B
w i t h ~ k t i v i t y <MDL
Be77 Creek Mud No. 54 ( l i C i / g )
( J u l y ) 2 .7 x l o m 5 ( A p r i l )
Pond R-2A Mud No. 55 ( u C i / g )
1.1 (June) 3.3 (March)
B e l l Creek V e g e t a t i o n No. 54 ( u C i / g ash )
Be1 1 Creek V e g e t a t i o n No. 54 ( u C i / g ) d r y w e i g h t
7 .6 x l o - ' ( A p r i l ) 2.08 x l o m 4 ( November)
( A p r i 1 ) 7 .2 x l o m 5 (November)
B e l l Creek Water No. 15 ( l iCi /m!?)
(Augus t )
Pond Water No. 6
SSFL Pond R-2A Water No. 12 (vCi/mE)
(Novembere 1 .0 x 10- (September)
*Maximum v a l u e obse rved f o r s i n g l e sample. 'Guide: 5 x 10⁻⁶ :Ci/mk., 3 x 10⁻⁷ uCi/mEB; 10 CFR 10 Appendix B, CAC 17, DOE Manual Chapter 0524
NA - n o t a p p l i c a b l e , 110 Guide v a l u e h a v i n g been e s t a b l i s h e d .
The correspondingly most r e s t r i c t ive Guide value for De Soto s i t e wastewater
radioactivity discharged to the sanitary sewage system, a control led area, i s
8 x l on4 uCi/mP alpha ac t iv i ty corresponding to u~~~ and 1 x l om3 uCi/mk beta
ac t iv i ty corresponding to co6'. These values are establ ished in 10 C F R 20, Cal i -
fornia Administrative Code T i t l e 17 , and DOE Manual Chapter 0524.
The Guide value of
vity i s due to work with
for beta ac t iv i ty i s due
ated nuclear fuel a t the
6 x 1 0 - l ~ uCi/ma for SSFL s i t e ambient a i r alpha ac t i -
unencapsulated plutonium. The value of 3 x 10"' uCi/m!L
t o the presence of srgO in fission products in i r rad i -
SSFL s i t e . The Guide value of 3 x 10-l2 uCi/mP for
De Soto ambient a i r alpha ac t iv i ty i s due to work with unencapsulated uranium
(including depleted u r a n i u ~ ) . The Guide value of 3 x 10-lo uCi/mP. i s for Co 60
for which the ambient a i r beta ac t iv i ty Guide i s appropriate since i t i s the most
res t r ic t ive l imit for beta-emitting radionuclides present a t the De Soto s i t e .
Guide value percentages are not presented for soi l or vegetation data since no
concentration Guide values have been establ i shed.
Ambient a i r sampling for long-lived particulate alpha and beta radioactivity
i s performed continuously with automatic sequential samplers a t both the De Soto
and SSFL s i t e s . Air i s drawn through Type HV-70 f i l t e r media which are analyzed
for 1 ong-1 ived radioactivity, a f t e r a minimum 120-h decay period that el iminates
the naturally occurring short lived particulate radioactivity. The average con-
centrations of ambient a i r alpha and beta radioactivity are presented separately
in Table 5.
Radioactivity levels observed in environmental samples for 1979, reported in
Tab1 es 1 through 5, compare closely with levels reported for recent years. Local
environmental radioactivity levels , which resu l t primarily from beta-emi t t ing
radionuclides and had shown the e f fec t of fa l lout during past extensive atmos-
pheric testing of nuclear devices, have decreased, and have been generally con-
s tant during the past several years. The effects of foreign atmospheric nuclear
t e s t s continue to be occasionally observed in daily ambient radioactivity levels,
although t h i s e f fec t was not readily discernible during 1979. The long-term
effects of airborne radioactivity on surface sample radioactivity levels are a
not discernible in recent years. The continuing relat ive constancy in environ-
mental radioactivity level s i s due primaril y
ring radionuclides in the environment and t o radioactivity from aged fa l lout .
ESG-80-7
2 3
to the dominance of naturally occur-
the longer-l i f e f iss ion product
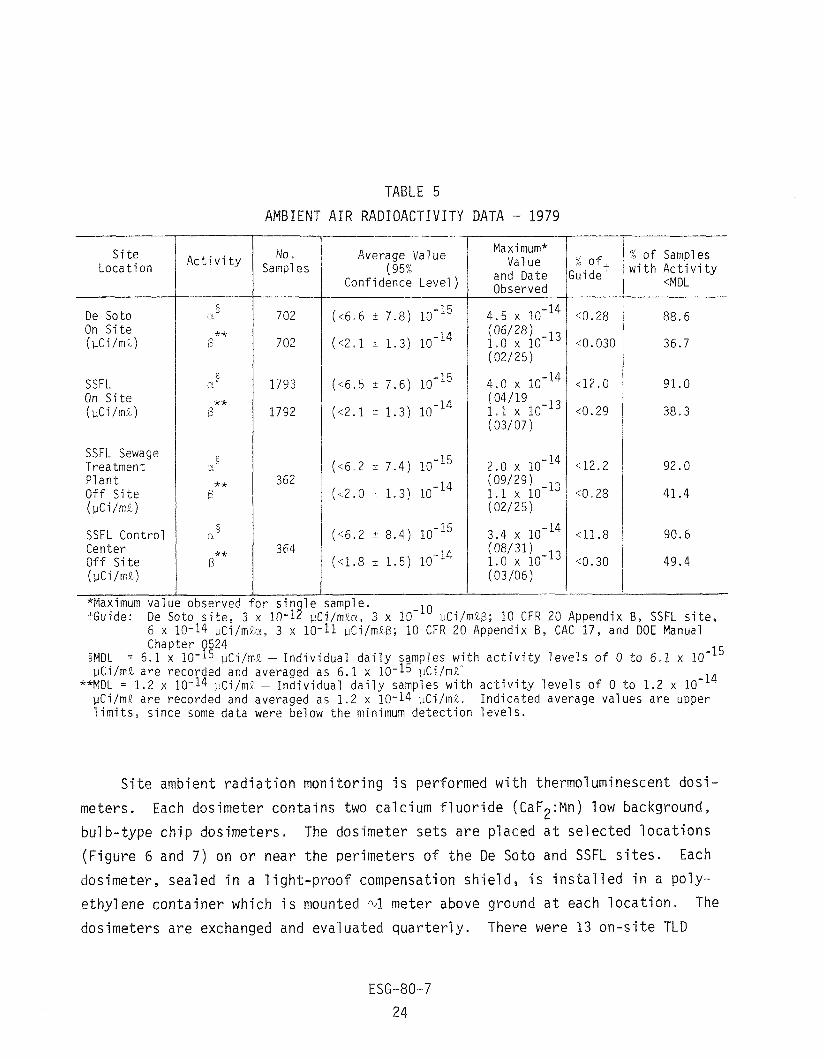
TABLE 5
AMBIENT AIR RADIOACTIVITY DATA - 1979
S i t e Location Activi ty
De Soto On S i t e (pCi Imr)
SSFL Sewage Treatment Plant Off S i t e (PC i / m k )
SSFL Control Center Off S i t e ( ~ C i l m a )
No. Sampl e s
Average Value (95%
Confidence Level )
Maximum* Val ue
and Date Observed
% of, iuide
Z of Samples with Activity
<MDL
for s in l e sample. 9 tGuide: De Soto s i t e , 3 x 10⁻¹ pCi/rnRa, 3 x 10-lo pCi/mkB; 10 CFR 20 Appendix B , SSFL s i t e , 6 x 10-14 uCi/mta, 3 x 10-11 uCilmRB; 10 C F R 20 Appendix B , CAC 17, and DOE Manual
leve ls of 0 t o 6.1 x 10-l5 Chapter 0524
DL = 6.1 x 10-l5 uCi/ma - Individual da i ly samples with a c t i v i t y vCi/mR a r e recorded and averaged as 6.1 x 10-l5 uCi/mR-
**MDL = 1.2 x 10⁻¹⁴ pCi/mR - Individual da i ly samples with a c t i v i t y pCi/mL are recorded and averaged as 1.2 x 10⁻¹⁴ $i/mR. Indicated l imi t s , since some data were below the minimum detection leve ls .
l eve ls of o t o 1.2 x 10-l4 average values a r e upper
Si te ambient radiation monitoring i s performed with thermoluminescent dosi-
meters. Each dosimeter contains two cal cium fluoride (CaF2:Mn) low background,
bulb-type chip dosimeters. The dosimeter se ts are placed a t selected locations
(Figure 6 and 7 ) on or near the perimeters of the De Soto and SSFL s i t e s . Each
osimeter, sealed in a light-proof compensation shield, i s installed in a poly-
ethylene container which i s mounted 51 meter above ground a t each location. The
dosimeters a re exchanged and evaluated quarterly. There were 13 on-site TLD

monitoring locations used during the year. Three additional dosimeter se t s ,
located a t locations up to 10 miles from the ESG s i t e s , are similarly evaluated
to determine the local area o f f - s i t e ambient radiation level , which
0.015 mremllh for 1979. The average radiation dose ra te and equivalent annual
dose monitored a t each dosimeter location are presented in Table 6.
T A B L E 6
D E SOT0 A N D SSFL SITES - A M B I E N T RADIATION DOSIMETRY DATA - 1979
T C D
De Soto
De S o t o
De Soto
De Soto
De Soto
De Soto
De Soto
SSFL
SSFL
SSFL
SSFL
SSFL
SSFL
Off-Si t e Control
Off-Si t e Control
Off-Si t e Control
Average Dose Rate (mrem/ h )
Equivalent Annual Dose
(mrem )
*Excludes a f i r s t quarter data due t o missing dosimeter. +Excludes second quarter data du? t o missing dosimeter.

TABLE 7
NONRADIOACTIVE CONSTITUENTS AND TRITIUM IN WASTEWATER DISCHARGED TO UNRESTRICTED AREAS - 1979 ( A n a l v s i s Resu l t s f o r Wastewater Discharqed from Pond R-2A t o B e l l Creek on Date I n d ~ c a t e d -- Sample S t a t i o n W-12)
January
Resu l t
- - 1 o f
Guide Cons t i tuenrs
January 15* Januarv 31' Februar)
Resu l t
14* - % o f
Guide
-- i o f
Guide Resu l t
To ta l D isso lved So l id5 (mg/O
C h l o r i d e ( m g l i )
S u l f a t e ( n g i r )
Suspended S o l i d s E ( m g j i )
S e t t l e a b l e S o l i d s 9 ( m t l i )
BOD ( n g l i )
O i l and Grease ( m g f i )
T u r b i d i t y (TU)
Chromium (mgl:)
F l u o r i d e ( m g l i )
Boron ( m g f i )
Residual C h l o r i n e (mg/ l )
Fecal C o l ~ f o r n i (MPW100 m i )
Sur fac tan ts (mgf;)
pH i r i t i u m i ( ~ C i l m i )
R a i n f a l l ,(in.)
Est imared R a i n f a l l Runoff ( g a l )
328 34.5
35 23.3
138 46.0
101 67.3
0 . 1 33.3
6 10.0
1 .2 8.0
74 -
0.016 160.0
0 .4 40.0
i 0 . 2 <20.0
~ 0 . 0 4 140.0
12 .2 19.5
0.04
5.2 l o 7
2.0 x j o0
March i*
339
31
7 1
34
0 . 1
5
1
32
0.006
0.4
0 . 1
10.04
N A
3.06
L
..].I 10-5
1.5
3.6 x l o 7
1.2 x
March 2
35.7
20.7
23.7
22.7
33.3
8 .3
6.7 -
60.0
4n.0
10.0
140.0
i
r0 .37
- - : of
Guide - 30.2
16.7
18.3
62.:
66.7
6 .7
13.3 -
160.0
80.0
8 . 0
<40.0 -
<0.37
-
Release Volume ( g a l )
February 21* March 14' - Q o f
Guide - 39.8
20.7
34.7
20.;
r33.3
6.7
4.0
110.0
40.0
20 .0
70.0
<9.5
- : o f
Guide - 48.6
36.0
34.3
8.7
<33.3
10.0
6.7
40.0
40.0
r 1 0 . 0
4 0 . 0
69.5
<0. 37
- - P o f
Guide - 46.8
41.3
44.0
110.0
<33.3
20.0
4 . 7 -
140.0
70.0
30.0
c40.0
<9.5
8
Cons t i tuen ts R e s u l t Resu l t Resui t
To ta l D isso lved S o i i d s ( c g j 2 )
C h l o r i d e (mg jz )
S u i f a t e (mg/e)
Suspended S o l i d s 9 :mglL)
S e t t l e a b l e S o l i d s E (niO/E)
BOD (mgI9.)
O i l and Grease (mg!9.)
T u r b i d i t y (TU)
Chromium ( m g h )
F l u o r i d e (mg/O
Boron ( ingje)
Residual C h l o r i n e (mglz)
Fecal C o i i f o r m (MPNj100 mV)
Sur fac tan ts !mg/a)
PA :ri tiumi ( ~ C i l m t )
R a i n f a l l ( i n . )
Est imated R a i n f a l l Runo f f ( g a l )
Release Volume ( g a l )
October 23'
Cons t i tuen ts
A p r i l 17 December - 9 o f Guide - 63.6
50.0
58.0
4.0
~ 3 3 . 3
11.7
13.3 -
40.0
iO.O
30.0
<40.0
a . 5
1
-
- 2 O f
Guide -- 64.0
50.7
56.7
21.3
<33.3
6 .7
4 . 7
R e s u l t ? o f Guide - 45.8
34.0
37.0
12.0
<33.3
13.3
<6.7
30.0
30.0
20.0
<4 .0 -
R e s u l t R e s u l t Resui t
To ta i D isso lved S o i i d s (mg/9.)
C h l o r i d e (mglz)
S u i f a t e (mgl2)
Suspended S o l i d s 9 (mgf2)
S e t t l e a b l e (So l ids ' (mL/O
BOD (mg:;)
O i l and Grease (mg/V)
T u r b i d i t y (TU)
Chromium (mg!Z)
F l u o r i d e (mgft:
Boron ( r r g l t )
Residual C h i o r i n e ( f i g / f )
Fecal Col i f o r m (MPNl100 mi)
S u r f a c t a n t s (mg j r )
pH
T r i t i u m * (LCi/mL)
R a i n f a l l ( i n . )
Est imated R a i n f a l l Runoff ( g a l ) 0
Release voiume ( g a i i 1.5 lo5 - .NA = Not A v a i l a b l e ; a n a l y s i s n o t requested o r n o t performed
* = R a i n f a l l r e l a t e d d ischarge . A = T r i t i u m minimum d e t e c t i o n l i m i t : (1 .1 - 1.1) 10-5 ,Ci/m,. 5 = Not a p p l i c a b l e t o discharges c o n t a i n i n g r a i n f a l I r u n o f f d u r i n g o r
Note: Pond R.24 c a p a c i t y - 2.5 x 10⁶ gal i m e d i a t e l y a f t e r pe r iods o f r a i n f a l l .

The table shows that radiation dose rates and equivalent annual doses moni-
tored on s i t e are nearly identical to levels monitored a t three widely separate
of f -s i te locations. These data include the natural background radiation compo-
nent which exis ts as a consequence of cosmic radiation, radionuclides in the
s o i l , and radon and thoron in the atmosphere, in addition to radioactive fa l lout
from nuclear weapons t e s t s . Locally, t h i s i s approximately 135 mremlyear. The
small var iabi l i ty observed in the data i s attributed to differences in elevation
and geologic conditions a t the various dosimeter locations. Since the data for
the on-si t e and off-si t e locations are nearly ident ical , no measurable radiation
dose to the general population or t o individuals in uncontrolled areas resulted
from ESG operations.
B. NONRADIOACTIVE MATERIALS - 1979
Processed wastewater and most collected surface runoff discharged from the
SSFL s i t e drains to Retention Pond R - Z A , operated by Rocketdyne. Water samples
are taken from the pond and analyzed for various constituents, as required by
the Regional Water Quality Control Board for each discharge to Be11 Canyon.
Tritium monitoring of discharged waste water was permanently discontinued during
the fourth quarter of 1979 in conformance with a condition permitting th i s action
in N R C License - SNM-21. The discharges are normally required only as a resu l t
of excessive rainfal l run-off. During such releases, the NPDES permit concen-
t ra t ion l imits for turbidi ty , and for suspended and set t leable solids do not
apply. The results of analyses for each discharge for 1979, most a1 1 of which
were rainfal l - related discharges, are presented in Table 7 .


A . G E N E R A L DESCRIPTION
Soil and vegetat ion sample c o l l e c t i o n and ana lys i s f o r r a d i o a c t i v i t y were
i n i t i a t e d in 1952, in the Downey, Cal i forn ia a rea , where the Energy Systems
Group was i n i t i a l l y loca ted . Environmental sampling was subsequently extended t o
the proposed SRE s i t e in the Simi H i l l s in May of 1954. In add i t ion , sampling was begun in the Burro F la t s a r e a , southwest of SRE, where o the r nuclear i n s t a l -
l a t i o n s were planned and a r e cu r ren t ly in opera t ion . The Downey area survey was
terminated when the Group relocated t o Canoga Park i n 1955. The primary purpose
of t h e environmental monitoring program i s t o survey environmental r a d i o a c t i v i t y
adequately t o ensure t h a t ESG operat ions do not con t r ibu te s i g n i f i c a n t l y t o
vironmental r a d i o a c t i v i t y . The loca t ions of sampling s t a t i o n s a r e shown in Fig-
ures 5 through 7 and l i s t e d in Table 8.
B . SAMPLING A N D SAMPLE PREPARATION
1, Soil
Soil i s analyzed f o r r a d i o a c t i v i t y t o monitor f o r any s i g n i f i c a n t increase
in r ad ioac t ive deposi t ion by f a l l o u t from a i rborne r a d i o a c t i v i t y . Since s o i l i s
na tu ra l ly radioact ive and has been contaminated by atmospheric t e s t i n g of nuclear
weapons, a general background level of r a d i o a c t i v i t y e x i s t s . The data a r e moni-
tored f o r increases beyond the natural v a r i a b i l i t y of t h i s background.
Surface s o i l types ava i l ab le f o r sampling range from decomposed g r a n i t e Lo
c lay and loam. Samples a r e taken from t h e top 112- in . l a y r of undisturbed
ground surface f o r gross r a d i o a c t i v i t y ana lys i s and t o a depth of 5 cm f a r plu-
tonium ana lys i s . The s o i l samples a r e packaged in p l a s t i c con ta ine r s ,
turned t o the labora tory f o r ana lys i s .
Sample preparat ion f o r gross r a d i o a c t i v i t y determination c o n s i s t s of t r ans -
f e r r i n g the s o i l s t o Pyrex beakers, and drying in a muff1 a t %500•‹C f o r
8 h . After cooling, t h e s o i l i s sieved t o obta in uniform p a r t i c l e s i z e . Two-
gram a l i q u o t s of the sieved s o i l a r e weighed, and t r ans fe r red t o copper planchets .
The s o i l i s wetted in t h e planchet with a l coho l , evenly d i s t r i b u t
uniform sample th ickness , d r i e d , and counted f o r alpha and beta r
Plutonium in s o i l ana lys is i s performed according t o t h e guidel ines speci f ied in
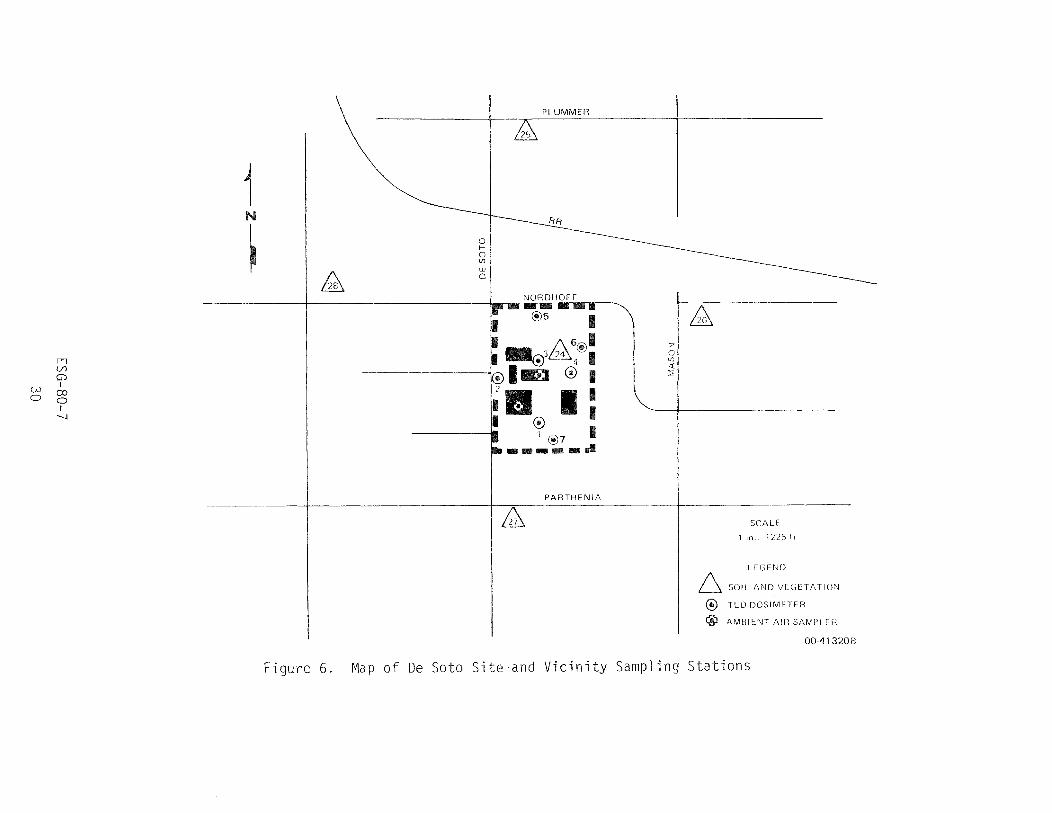
PLUMMER
NORDHOFF
SCALE
1 ~n 1225 fl
L I GFND
SOIL AND VEGLTATI0"J
@ TLD [IOSIMfTEH
'@ A M B l i N T All3 SAMPL F H
00-41 320B
Figure 6. Map of De Soto Site,and Vicinity Sampling Stations

TABLE 8
SAMPLE STATION LOCATIONS ( S h e e t 1 of 3 )
S t a t i o n
SV-1
SV-2
S v - 3
sv -4
sv - 5
SV-6
sv -10
SV- 12
SV-13
SV- 14
SV-19
SV-24
SV-25
SV-26
SV-27
SV-28
SV-31
SV-40
SV-41
SV-42
sv-47
SV-51
SV-52
SV-53
SV-54
S-55
S-56
L o c a t i o n
SSFL S i t e , B ldg . 143
SSFL S i t e , Bldg . 143 P e r i m e t e r D r a i n a g e Sys tem
SSFL S i t e , Bldg . 064
SSFL S i t e , B ldg . 020
SSFL S i t e , B ldg . 363
Rocketdyne S i t e I n t e r i m R e t e n t i o n Pond
SSFL S i t e Acces s Road
SSFL S i t e , Bldg . 093 (L-85 ~ e a c t o r )
SSFL S i t e , a t SRE Water R e t e n t i o n Pond
SSFL S i t e , B ldg . 028
SSFL S i t e E n t r a n c e , Wool s e y Canyon
De S o t o S i t e , B ldg . 004
De S o t o Avenue and Plummer S t r e e t
Mason Avenue and Nordhoff S t r e e t
De S o t o Avenue and P a r t h e n i a S t r e e t
Canoga Avenue and Nordhoff S t r e e t
Simi V a l l e y , Alamo Avenue and Sycamore Road
Agoura - Kanan Road and Ven tu ra Freeway
C a l a b a s a s - Parkway C a l a b a s a s and Ven tu ra Freeway
SSFL S i t e , Bl dg . 8 8 6
C h a t s w o r t h R e s e r v o i r Nor th Boundary
SSFL S i t e , Bldg . 029
SSFL S i t e , Bu r ro F l a t s D r a i n a g e C o n t r o l Pond, G S t r e e t and 1 7 t h S t r e e t
Rocketdyne S i t e Pond R-2A S p i l l w a y , Head o f Be l l Canyon
Be1 l Creek
Rocketdyne S i t e R e t e n t i o n Pond R-2A (Pond Bottom Mud)
SSFL S i t e , F S t r e e t and 2 4 t h S t r e e t
SV - S o i l and V e g e t a t i o n Sample S t a t i o n S - S o i 1 Sample S t a t i o n
TABLE 8
SAMPLE STATION LOCATIONS (Sheet 2 o f 3 )
S t a t i o n
S-57
S-58
S-59
S-60
W-6
W-7
W-11
W-12
W-16
A- 1
A- 2
A-3
A-4
A- 5
A-6
A- 7
A-8
A-9
TLD- 1
TLD-2
TLD-3
TLD-4
TLD-5
TLD-6
TLD-7
TLD- 1
L o c a t i o n
SSFL S i t e , J S t r e e t a t B ldg . 055
SSFL S i t e , B ldg . 353
Rocketdyne S i t e Tes t Area CTL 4
Rocketdyne S i t e R e t e n t i o n Pond R-2A
Rocketdyne S i t e I n t e r i m R e t e n t i o n Pond ( d r a i n s t o Pond R-2A)
SSFL S i t e Domestic Water, B ldg . 003
SSFL S i t e Domestic Water, B l d g . 363
Rocketdyne S i t e Area I 1 F i n a l R e t e n t i o n Pond R-2A
Be1 1 Creek
De Soto S i t e , B ldg . 001 Roof
De Soto S i t e , B ldg . 004 Roof
SSFL S i t e , B ldg . 009, West S ide
SSFL S i t e , B ldg . 011, West S ide
Rocketdyne S i t e , B ldg. 600, N o r t h S ide
Rocketdyne S i t e , B ldg . 207, N o r t h S ide
SSFL S i t e , B ldg. 074, South S ide
SSFL S i t e , B ldg . 143, West S ide
SSFL S i t e , B ldg. 363, West S ide
De Soto S i t e , South o f B l d g . 102
De Soto S i t e , West Boundary
De Soto S i t e , Guard Post No. 1, B ldg . 201
De Soto S i t e , East Fence
De Soto S i t e , N o r t h Boundary
De Soto S i t e , East Boundary
De Soto S i t e , South Boundary
SSFL S i t e , Bldg. 114
S - S o i l Sample S t a t i o n W - W a t e r Sample S t a t i o n A - A i r Sampler S t a t i o n TLD - Thermol uminescent Dosimeter ' . ?ca t ion

TABLE 8
SAMPLE STATION LOCATIONS (Sheet 3 of 3 )
TL D- 2 SSFL S i t e ,
TLD-3 SSFL S i t e ,
TLD-4 SSFL S i t e ,
TLD-5 SSFL S i t e ,
TLD-6 SSFL S i t e ,
SRE Water R e t e n t i o n Pond
E l e c t r i c S u b s t a t i o n No. 719
West Boundary on H S t r e e t
a t Southwest Boundary
B ldg. 854
TLD - Thermoluminescent Dosimeter L o c a t i o n
TLD- 1
TL D- 2
TLD-3
O f f S i t e , N o r t h r i d g e
O f f S i t e , S imi V a l l e y
O f f S i t e , N o r t h r i d g e
U.S. NRC Regulatory Guide 4 .5 t i t l e d "Measurements of Radionuclides i
Environment-Sampling and Analysis of Plutonium in Soi l" by a c e r t i f i e d i
pendent t e s t ing laboratory.
2 . Vegetation
The analysis of vegetation i s performed as an adjunct t o the soi l analys is
and i s done t o determine t he uptake of rad ioac t iv i ty by plants . These plants do
not contribute t o the human food chain, nor i s there s ign i f i can t agr icu l tu re or
grazing in the immediate neighborhood of e i t h e r s i t e .
Vegetation samples obtained in the f i e l d a r e of the same perennial plant
types, wherever possible; these a r e usually sunflower or wild tobacco leaves.
Vegetation leaves a r e str ipped from p lan t s , and placed in i ce cream cartons fo r
t r ans fe r t o the laboratory fo r analys is . Ordinari ly, plant root systems are not
analyzed.
Vegetation samples a r e f i r s t washed with tap water t o remove foreign matter ,
and then thoroughly rinsed with d i s t i l l e d water. Washed vegetation i s dried in
tared beakers a t l O O O C fo r 24 h fo r dry weight determination, then ashed in a
muffle furnace a t ~5000C fo r 8 h, producing a completely burned ash. One-gram
al iquots of pulverized ash from each beaker a r e weighed, and t ransferred t o copper
planchets. The vegetation ash i s wetted in the planchet with alcohol, evenly d i s -
t r ibuted t o obtain uniform sample thickness, d r i ed , and counted fo r alpha and beta
radia t ion. The drylash weight r a t i o i s used fo r the determination of the equiva-
lent dry weight gross rad ioac t iv i ty concentration value.
3. Water
Surface and domestic supply water samples a re obtained monthly a t the SSFL
s i t e and from Bell Creek. The water i s drawn into 1 - l i t e r polyethylene bo t t l e s ,
and t ransferred t o the laboratory.
Five-hundred-milliliter volumes of water a r e evaporated t o dryness in crys-
t a l l i z i n g dishes a t ~900C. The residual s a l t s a re redissolved in to d i s t i l l e d
water, t ransferred to copper planchets, dried under heat lamps, and counted f o r
alpha and beta rad ia t ion .

4. Ambient Air
Air sampling i s performed continuously a t t he De Soto and SSFL s i t e s with
automatic a i r samplers, operat ing on 24-h sampling cycles . Airborne p a r t i c u l a t e
r a d i o a c t i v i t y i s co l l ec ted on Type HV-70 f i l t e r media, which a r e automatical ly
changed d a i l y a t t he end of each sampling period. The samples a r e counted f o r
alpha and beta radia t ion following a minimum 120-h decay period. The volume of 3
a typica l d a i l y ambient a i r sample i s approximately 25 m . Figure 8 i s a graph of the d a i l y averaged long-lived alpha and beta ambient
a i r r a d i o a c t i v i t y concentrat ions f o r the De Soto and SSFL s i t e s during 1979. The
average beta concentrat ion f o r each month i s a l s o indica ted by horizontal bars .
The graph shows t h a t no prominent peaks occurred during the yea r , and t h a t radio-
a c t i v i t y concentrat ions were e s s e n t i a l l y constant through the yea r .
C . COUNTING A N D CALIBRATION
Environmental s o i l , vegetat ion, water , and ambient a i r samples a r e counted
f o r alpha and beta radia t ion with a low-background gas flow proportional counting
system, capable of the simultaneous counting of both alpha and ne t beta r ad ia t ion .
The sample-detector configurat ion provides a nearly 2n geometry. The thin-wi ndow
de tec to r i s cont inual ly purged with methane counting gas. A p rese t time mode of
operat ion i s used f o r a l l samples. The m i n i m u m de tec t ion l i m i t s shown i n Table 9
were determined by using typica l values f o r counting time, system e f f i c i e n c i e s
f o r de tec t ing a1 pha and beta r ad ia t ion , background count r a t e s (approximately
0.05 cpm a and 1.0 cpm B) and sample s i z e . For the t a b l e , the minimum s t a t i s -
t i c a l l y s i g n i f i c a n t amount of r a d i o a c t i v i t y , i r r e s p e c t i v e of sample conf igura t ion ,
i s taken a s t h a t amount equal in count r a t e t o three times the s tandard deviat ion
of the system background count r a t e .
Counting system e f f i c i e n c i e s a re determined rou t ine ly with Ra-D+E+F (with 4 0 alpha absorbe r ) , ~ 1 ~ ~ , ~ h ~ ~ ~ , u ~ ~ ~ , and ~u~~~ standard sources, and with K , in
the form of standard reagent grade K C 1 , which i s used t o s imulate s o i l and vegeta-
t i on samples. Sel f-absorpt ion standards a r e made by d iv id ing sieved K C 1 i n t o
samples, increas ing in mass by 200-mg increments, from 100 t o 3000 mg. The sam-
p les a r e placed in copper planchets , of the type used f o r environmental s

TABLE 9
RADIOACTIVITY DETECTION LIMITS (MDL)
Vegetation a / 1.1 x uCi/g ash
Water
and counted. The ratio of sample activity to the observed net count rate for
each sample is plotted as a function of sample weight. The c'orrection factor
(ratio) corresponding to sample weight may be obtained from the graph. The
product of the correction factor and the net sample count rate yields the sample
activity (dpm). This method has been proved usable by applying it to various-
sized aliquots of uniformly mixed environmental samples and observing that the
resultant specific activities fall within the expected statistical counting
error.
Since the observed radioactivity in environmental samples results primarily
from natural and weapons-testing sources, and is at such low concentrations, an
effort is not made to identify individual radionuclides. The detection of sig-
nificant levels of radioactivity would lead to an investigation of the radio-
active material involved, the sources and possible causes.
D. NONRADIOACTIVE MATERIALS
Rockwell International Corporati on, Rocketdyne Division, has f i 1 ed a Report
of Waste Discharge with the Cal ifornia Regional Water Qua1 ity Control Board, and
ESG- 80- 7
3 8

has been granted a National Pollutant Discharge Elimination System permit to
discharge wastewater, pursuant t o Section 402 of the Federal Water Pollution
Control Act. The permit, NPDES No. CA0001309, became e f fec t ive on September 2 7 ,
1976, and supersedes a l l previously held permits f o r wastewater discharge from
the Rocketdyne Division SSFL. Discharge of overflow and storm runoff only i s
permitted in to Bell Creek from water reclamation re tent ion ponds. Discharge
generally occurs only during and immediately a f t e r periods of heavy r a in f a l l o r
during extended periods of rocket engine t e s t i ng .
Only one of the re tent ion ponds receives inf luent d i r ec t l y from the ESG
SSFL s i t e . I t i s iden t i f i ed as retention pond R-ZA, Water Sample Stat ion W-12
in Table 8. The inf luent includes sewage treatment plant e f f luen t and surface
runoff water. Grab-type water samples, taken a t the re tent ion pond pr ior to a
d ischarge ,are analyzed fo r non-radioactive chemical const i tuents and fo r radioac-
t i v i ty by a Cal i fo rn ia S ta te c e r t i f i e d analyt ica l t e s t ing 1 aboratory. The spec i f i c
const i tuents analyzed fo r , and t h e i r respective l imitat ions i n discharged waste-
water, a re presented in Appendix B . Wastewater or ig inat ing from f a c i l i t i e s located
throughout the SSFL s i t e i s composited in the retention ~ o n d . Thepo in to fo r i g ino f
nonradioactive const i tuents normally found in wastewater i s impossible t o deter-
mine; however, in the event ofexcessiveamounts of any of these materials in
wastewater, the or iq in m y be determined from the knowledqe of f a c i l i t y oper-
a t ions involving t h e i r use. A to ta l of twelve o f f - s i t e d i s chayes of wastewater
from Pond R - 2 A occurred durinq 1979.
h w 1 o a J
7 O'r in- m .- > m .?-
o w . - a J O 0 m o - - !-cf U w
03 EICT
w 0 .c-
s 0
L -0 .?--
aJ E aJ o- cLs>rClo!
E L L E Dv- aJ u \ s Xin S'r- .r 0 3 n a J O r-EO U 3 r?. s-
o E O Vi
Effluents which may contain radioactive material a r e generated a t ESG
f a c i l i t i e s as the r e s u l t of operations performed under contract to D O E , under
NRC Special Nuclear Materials License SNM-21, and under S t a t e of California
Radioactive Material License 0015-70. The spec i f i c f a c i l i t i e s are iden t i f i ed
as Buildings 001 and 004 a t the De Soto s i t e , and Buildings 020, 021, 022, and
055 a t the Santa Susana s i t e , SSFL.
A. TREATMENT A N D HANDLING
Waste streams released t o unres t r ic ted areas a r e limited in a l l cases , to
gaseous e f f luen t s . No contaminated l iquids a re discharged to unres t r ic ted
a reas .
The level of rad ioac t iv i ty contained in a l l atmospherically discharged
e f f luen t s i s reduced t o the lowest pract icable values by passing the e f f luen t s
through c e r t i f i e d , high eff ic iency par t i cu la te a i r ( H E P A ) f i l t e r s . These e f -
f luents a re sampled fo r pa r t i cu la te radioactive materials by means of continuous
stack exhaust samplers a t the point of re lease . In addi t ion, s tack monitors
ins ta l l ed a t Buildings 020 and 055 provide automatic alarm capab i l i ty in the
event of the re lease of gaseous o r pa r t i cu la te a c t i v i t y from Building 020 and
par t i cu la te a c t i v i t y from Building 055. The HEPA f i l t e r s used f o r f i l t e r i n g
gaseous e f f luen t s a r e 99.97% e f f i c i e n t f o r pa r t i c l e s of 0.3-vm diameter. Par t i -
c l e f i l t r a t i o n eff ic iency increases f o r pa r t i c l e s above and below t h i s s i ze .
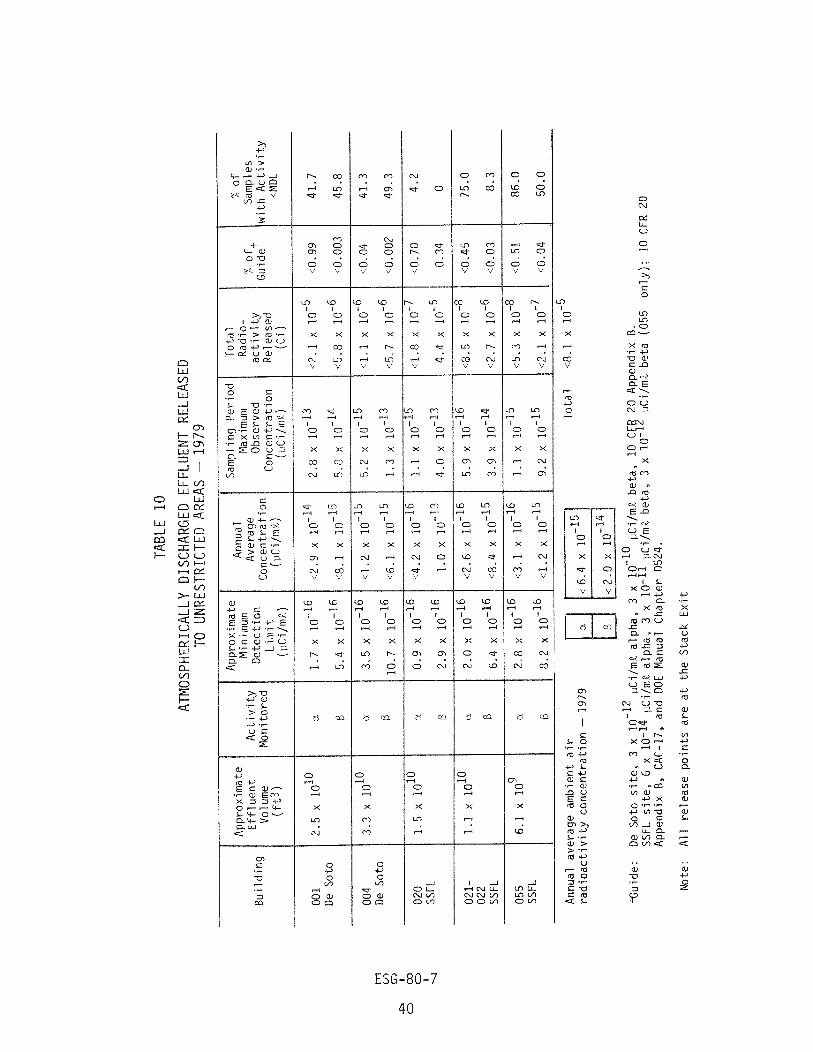
The average concentration and to ta l r ad ioac t iv i ty in gaseous e f f luen t re-
leased t o unres t r ic ted areas i s shown i n Table 10. The effect iveness of the a i r
cleaning systems i s evident from the f a c t t h a t i n most cases, the gaseous e f f lu -
ent released i s l e s s radioactive than the ambient a i r . The t ab le shows t h a t no
s ign i f i can t quan t i t i e s of rad ioac t iv i ty was released f o r 1979.
Liquid wastes released to san i ta ry sewage systems, a controlled area as
provided f o r by CAC 17 and 10 C F R 20, a r e generated a t the De Soto s i t e only.
Liquid wastes a r e discharged from Building 001 following analys is f o r rad ioac t iv i ty
concentration. There i s no continuous flow. Bui 1 ding 004 chemical wastes are
released t o a proportional sampler i n s t a l l a t i on which r e t a in s an a l iquo t each

rc- 0 a,
ln +-'a r a .C 1-
0 at an:
-w ln X a
"r 2 2i u d
ln a 0
N % -u C, a Csl .r LI > L LJ .r- 3 * a o u d rCI
-a C ." a a C 3 - M - * a
at a u a s w a $ * u C 4 at .F d .r O + I - .r % p, ":z ,--a> 0 '--I *C ln t'
X u a a L ,--i a a
m x lnan. a-6 - -w Q a

time a f ixed volume i s released t o the sani tary sewage system. No radioactive
l iquid e f f luen t s a r e released from the Santa Susana Buildings 020, 021, 022, or
055. Liquid radioactive waste generated a t SSFL i s so l i d i f i ed fo r land bur ia l .
The average concentration and to ta l r ad ioac t iv i ty in e f f luen t s discharged i s
shown in Table 11.
B . ENERGY SYSTEMS G R O U P FACILITY DESCRIPTIONS
1. De Soto S i t e
a . Building 001 - NRC and California S ta te Licensed Act iv i t i e s
Operations a t Building 001 which may generate radioactive e f f luen t s cons i s t
of production operations associated with the manufacture of enriched uranium fuel
elements. Only atmospherically discharged e f f l uen t s a r e released from the build-
ing t o uncontrolled areas . Following analys is f o r rad ioac t iv i ty concentration,
l iquid wastes a r e released t o the sani tary sewage system, which i s considered a
controlled a rea , a s provided by CAC 17 and 10 C F R 20. Nuclear fuel material
handled in unencapsulated form in t h i s f a c i l i t y contains the uranium isotopes
U 2 38 234, u ~ ~ ~ , u ~ ~ ~ , and U . b, Building 004 - NRC and California S ta te Licensed Act iv i t i e s
Operations a t Building 004 which may generate radioactive e f f luen t s consis t
of research s tudies in physics and chemistry, and the chemical analysis of small
quan t i t i e s of fuel mate r ia l s , usually l imited t o a few grams. Only atmospheric-
a1 ly discharged e f f l uents a r e re1 eased from the bui 1 ding t o uncontrol 1 ed areas.
Liquid laboratory wastes a re re1 eased t o a proportional sampler ins ta l l a t ion
which re ta ins an a l iquot of wastewater each time a fixed volume i s released t o
the f a c i l i t y sani tary sewage system. The a l iquots a re composited and analyzed
fo r rad ioac t iv i ty . Nuclear fuel material hand1 ed in unencapsulated form in t h i s
234 u~~~~ u ~ ~ ~ , and u ~ ~ ~ . Major quan- f a c i l i t y contains the uranium isotopes U , t i t i e s of a ther radionucl ides in encapsulated form include co60 and ~ m ~ ~ ~ . No
s i gn i f i c an t quan t i t i e s of these radionuclides were released. The monitoring of
De Soto s i t e sewage e f f luen t f o r t r i t ium commenced during December 1977 con-
tinued on the basis of a monthly analys is of a da i ly composited sample of to ta l
f a c i l i t y e f f luen t collected a t the point of discharge into the municipal sewerage
unt i l the f i r s t calendar quarter of 1979 when i t was terminated in accordance
with the N R C l i cense .
2. Santa Susana Field Laboratories S i te
a. Building 020 - NRC and California State Licensed -A Activit ies
Operations a t Building 020 which may generate radioactive effluents consi
of hot cell examination of irradiated nuclear fuels and reactor components. Only
atmospherical ly discharged effluents are re1 eased from the building t o uncon-
trolled areas. The effluent may contain particulate material, as well as radio-
active gases, depending on the operations being performed and the history of the
irradiated fuel and other material. The chemical form of such materials may
U metal, U02, U C , mixed f iss ion products, and various activation products. No
radioactive liquid waste i s released from the f a c i l i t y . Radioactive material
handled in unencapsulated form in t h i s f a c i l i t y includes the following radio-
nuclides: ~ h ~ ~ ~ , u ~ ~ ~ , u ~ ~ ~ , u ~ ~ ~ , u~~~~ and u~~~ as constituents in the various
fuel materials; and CS'~ ' , srgO, ~ r ~ ~ , and pm14' as mixed f iss ion products.
b. Buildings 021 and 022 - DOE Contract Activit ies
Operations a t Buildings 021 and 022 which may generate radioactive effluents
consist of the processing, packaging, and temporary storage of l iquid and
radioactive waste material for disposal, Only atmospherically discharged ef-
fluents are released from the building to uncontrolled areas. No radioactive
l iauid waste i s released from the f a c i l i t v . Nuclear fuel material handled in "
encapsulated or unencapsulated form contains the uranium isotopes U 234, ,,235 3
u ~ ~ ~ , u ~ ~ ~ , plus Cs13', srgO, and PmI4' as mixed fission products.
c. Building 055 - NRC and California State Licensed Activit ies
Operations a t Building 055 which may generate radioactive effluents consist
of fabrication of depl eted uranium carbide fuel pel 1 e t s . Only atmospheri-
cally discharged effluents are released from the fac i l i ty to uncontrolle
No radioactive l iquid waste i s released from the
The various fuel materials (depleted and enr
contain the following radionuclides: U 234, u235 3
24 1 240 puZ4', and Am . Pu 9
faci l i t y .
iched uranium and plutonium) u236 u2383 pu238, p u 2
9

C . ESTIMATION OF G E N E R A L POPULATION DOSE
Release of airborne material a t the De Soto s i t e f o r summer season weather
conditions would generally be under a subsidence inversion i n to an atmosphere
t ha t i s typical of s l i g h t neutral t o lapse condit ions. A 1 though nocturnal cool-
ing inversions a re present they a re r e l a t i ve ly shallow in extent . During the
summer season the subsidence inversion i s present almost every day. The base
and top of t h i s inversion fo r the most pa r t 1 i e below the elevation of the SSFL
s i t e . Thus, any atmospheric re lease under t h i s condition from the SSFL s i t e
would r e su l t in Pasquill Type D lo f t ing di f fus ion conditions above the inversion
and considerable atmospheric dispersion p r io r t o d i f fus ion ( i f any) through the
inversion in to the Simi or San Fernando Valleys. In the winter season the
Paci f ic high pressure ce l l s h i f t s t o the south and the subsidence inversion for
the most part i s missing. The surface a i r flow i s dominated by f ronta l a c t i v i t y
moving through the area or t o the e a s t . Frontal passages through the area during
t h i s season a r e generally accompanied by p rec ip i t a t ion . Diffusion character is -
t i c s are highly variable depending upon the f ronta l locat ion. Generally, a l i g h t
t o moderate southwesterly wind precedes these frontal passages introducing strong
onshore flow of marine a i r , and lapse r a t e s a r e s l i g h t neutral t o lapse. Wind
speeds increase with the approach of the f ronta l systems,enhancing di f fus ion.
The diffusion charac te r i s t i c s of the f ronta l passage a r e lapse conditions w i t h
l i g h t t o moderate northerly winds. A summary of surface wind conditions f o r the
local area i s presented in Table 1 2 .
TABLE 12
SURFACE WIND CONDITIONS
Prevailing afternoon di rect ion
Prevailing ear ly morning di rect ion
Average daytime speed
Average nighttime speed
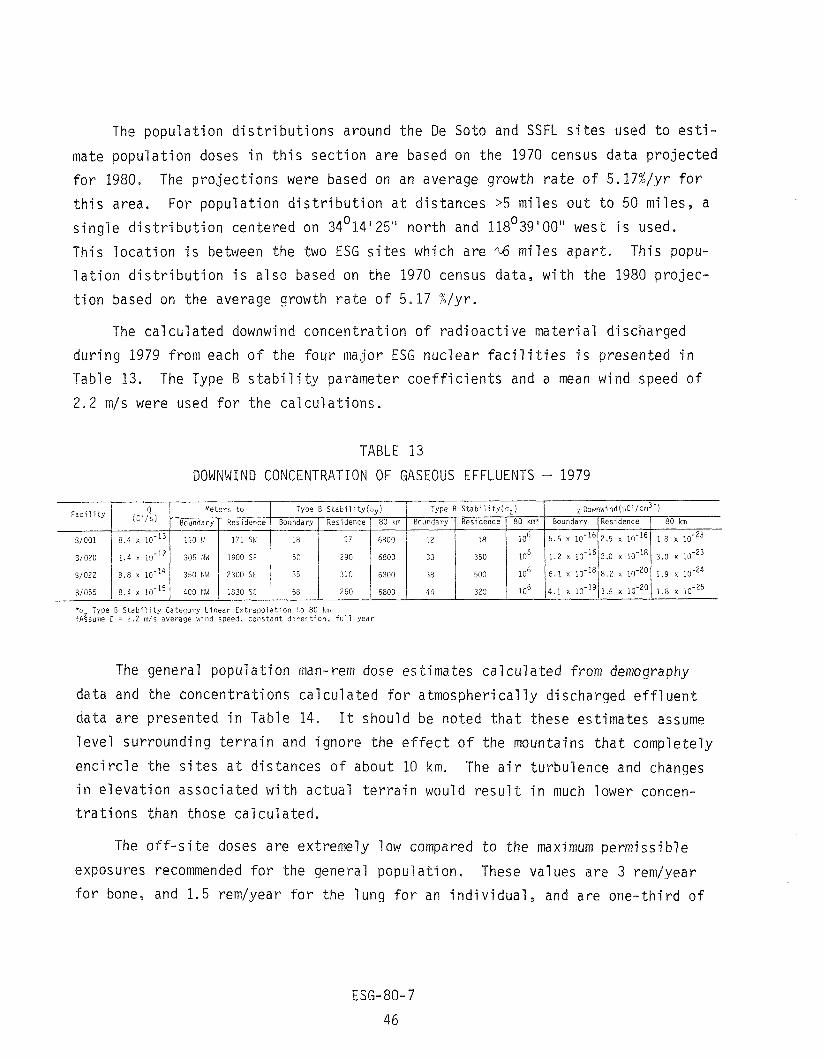
The population distributions around the De Soto and SSFL s i t e s used to e s t i -
mate population doses in th is section are based on the 1970 census data projected
for 1980. The projections were based on an average growth rate of 5.17%/yr for
th is area. For population distribution a t distances >5 miles out t o 50 miles, a
single distribution centered on M014' 25" n o r t h and 118~39' 00" west i s used.
This location i s between the two ESG s i t e s which are rLCi miles apart . This popu-
lation distribution i s also based on the 1970 census data, with the 1980 projec-
tion based on the average growth rate of 5.17 %lyre
The c a l c ~ l a t e d downwind concentration of radioactive material discharged
during 1979 from each of the four major ESG nuclear f a c i l i t i e s i s presented in
Table 13. The Type B s t ab i l i t y parameter coefficients and a mean wind speed of
2 . 2 m/s were used for the calculations.
T A B L E 13
DOWNWIND CONCENTRATION OF GASEOUS EFFLUENTS - 1979
*s Type B S t a b i l i t y Category L i n e a r E x t r a p o l a t i o n :o 80 km '~gsume G = 2 . 2 m/s average wind speed, c o n s t a n t di,e:rion, f u l l y e a r
The general population man-rem dose estimates calculated from demography
data and the concentrations calculated for atmospherically discharged effluent
data are presented in Table 14. I t should be noted that these estimates assume
level surrounding terrain and ignore the e f fec t of the mountains that completely
encircle the s i t e s a t distances of about 10 km. The a i r turbulence and changes
in elevation associated with actual terrain would resul t in much lower concen-
trations than those calculated,
F a c i l i t y
8/001
The of f -s i te doses are extremely low compared to the maximum permissible
exposures recommended for the general population. These values are 3 rem/year
for bone, and 1.5 remlyear for the lung for an individual, and are one-third of
Meters t o
' Boundary 1 Residence
110 W / 171 SW
4 (Ci's)
8 .4 x lo-13
Type B S t a b i l i t y ( , - y )
Boundary I Residence / 80 km
~ o w n w i n d ( i L i /cm3-)
Boundary /Res idence 1 8 0 km
5.6 x 1 0 - ~ ~ 1 2 . 5 x 1.8 x loez3 6800
Type B S t a b i l i t y ( c , )
Boundary I Residence 1 80 kmf
18 12 27 18 ( l o6
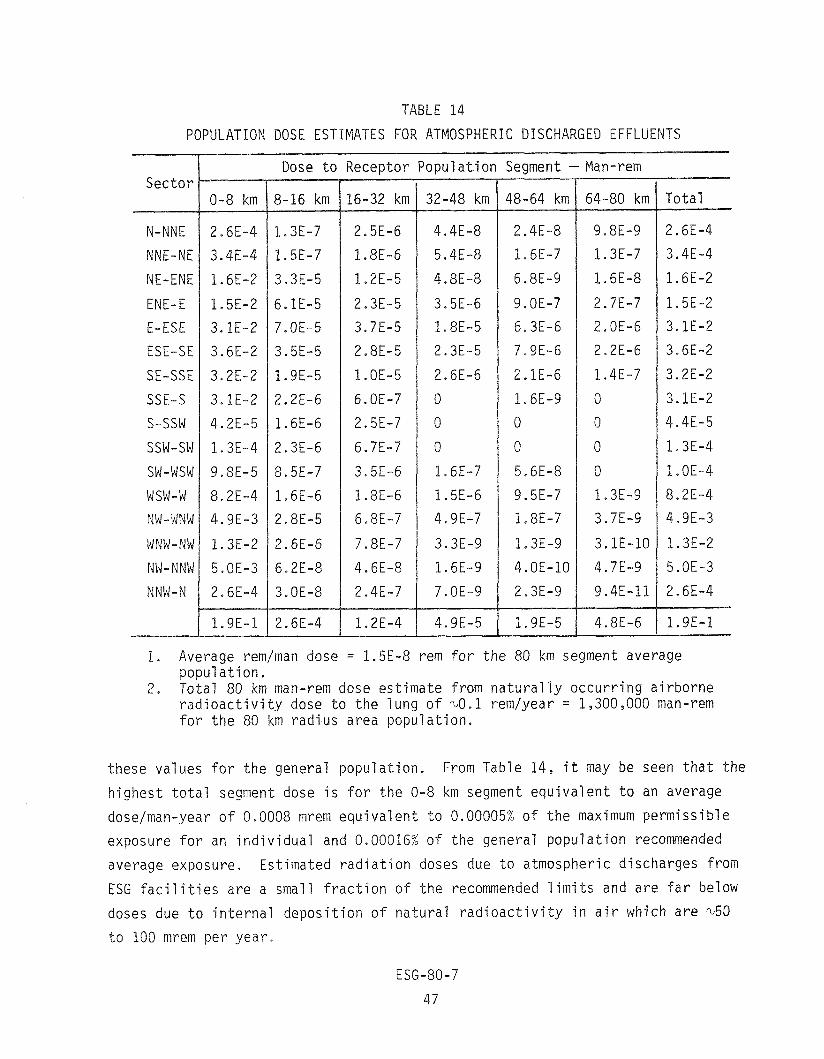
TABLE 14
POPULATION DOSE ESTIMATES FOR ATMOSPHERIC DISCHARGED EFFLUENTS
Sector
N-NNE
NNE-NE
NE-ENE
ENE-E
E-ESE
ESE-SE
SE-SSE
SSE-S
S-SSW
SSW-SW
SW-WSW
NSW-W
NW-NNW
WNW-NW
NW-NNW
NNW-N
Dose to Receptor Population Segment - Man-rem
Total
1. Average rem/man dose = 1.5E-8 rem for the 80 km segment average population.
2, Total 80 km man-rem dose estimate from naturally occurring airborne radioactivity dose to the lung of ~ 0 . 1 rem/year = 1,300,000 man-rem for the 80 km radius area population.
these values for the general population. From Table 14, it may be seen that the
highest total segment dose is for the 0-8 km segment equivalent to an average
doselman-year of 0.0008 mrem equivalent to 0.00005% of the maximum permissible
exposure for an individual and 0.00016% of the general population recommended
average exposure. Estimated radiation doses due to atmospheric discharges from
ESG facilities are a small fraction of the recommended limits and are far below
doses due to internal deposition of natural radioactivity in air which are ~ 5 0
to 100 mrem per year.


This section compares environmental monitoring resul ts for the calendar
year 1979 with previous annual data.
The data presented in Tables A-1 through A-5 summarize a l l past annual
average radioactivity concentrations. These data-show the effects of b o t h the
short-lived a n d long-lived radioactive fa l lout from nuclear weapons t e s t s super-
imposed on the natural radioactivity inherent in the various sample types.
Over the considerable period of time that the environmental program has
been in operation, evolutionary changes have been made in order t o provide more
effective data. I n some cases th i s i s readily apparent in the data. For example,
in Table A-1, a small b u t abrupt increase in the alpha act ivi ty reported for soil
i s seen to occur in 1971. This increase i s observed in both the on-site and the
o f f - s i t e samples and resulted from use of an improved counting system with a
thinner sample configuration. The thinner sample increases the sens i t iv i ty of
the detector t o alpha-emitting radionuclides in the sample, thus producing a
higher measured specific ac t iv i ty .
Similarly, prior to 1971, gross ac t iv i ty in ambient a i r was measured, in-
cluding both alpha and beta ac t iv i ty . I n 1971, measurements were begun which
allowed separate identification of these two types of ac t iv i ty .
The types of random variations observed in the data indicate that there i s
no local source of unnatural radioactivity in the environment. Also, the sim-
i l a r i t y between on-site and o f f - s i t e results further indicate that the contribu-
tion t o general environmental radioactivity due to operations a t ESG i s essen-
t i a l l y nonexistent.
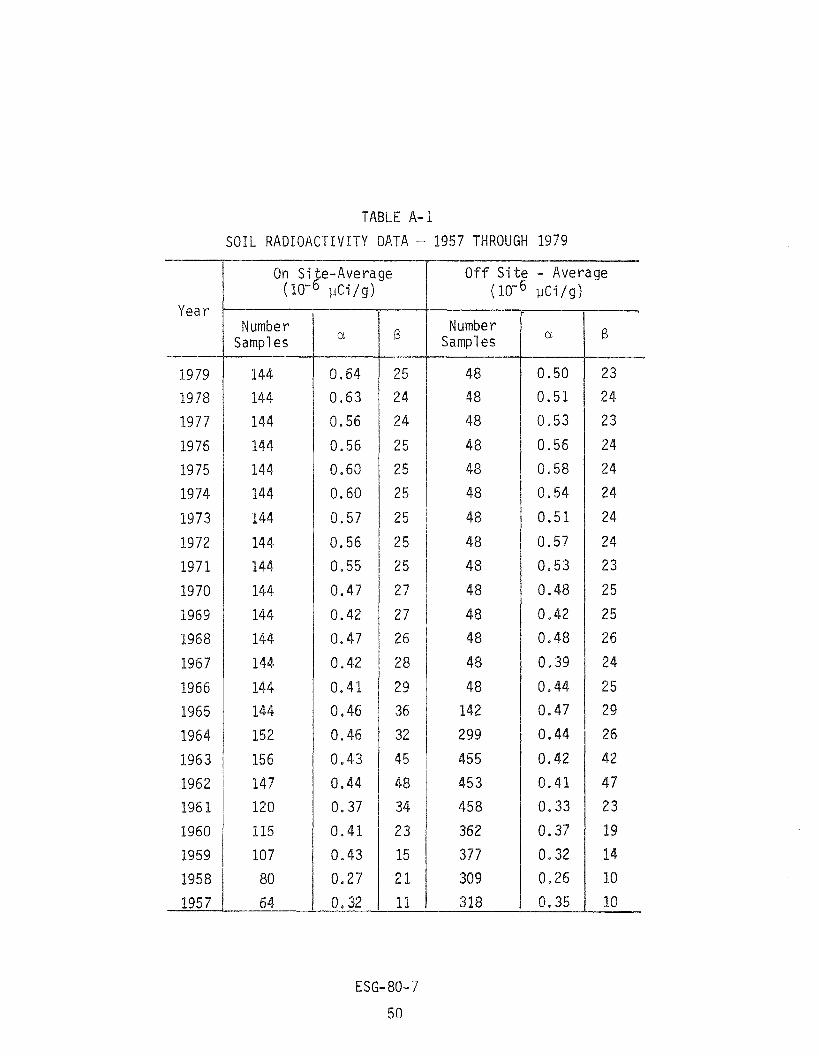
SOIL RADIOACTIVITY DATA - 1957 THROUGH 1979
Year
1979
1978
19 7
19 76
1975
19 7
1973
1972
1971
19 70
1969
1968
1967
1966
1965
1962
19
1960
195 7
Number Samples
147
120
115
107
80
Off S i t e - Average pCi/g)
Number Sampl e s
ESG- 80- 7
50

TABLE A-2
VEGETATION RADIOACTIVITY DATA - 1957 THROUGH 1979
1 On S i t e - Average 1 (10-6 $ i / g ash) I
Year 1
, Number I Samples I
1979 144 1
1978 , 144
1977 144
Of f -S i t e - Average ( l o m 6 $ i / g ash)
Number Samples
ESG- 80- 7
5 1

TABLE A-3
SSFL SITE DOMESTIC WATER RADIOACTIVITY DATA - 1957 THROUGH 1979 -
Year *
1979
1978
1976
1975
19 7
1973
19 72
19 7 1
1970
1969
1968
1967
1966
1965
1964
1963
1962
196 1
1960
1959
1958
1957
Number Samples
2 4
2
2
2
2
2 4 2
2
2
2
2
2
24
2
2
2 3
2
2
2
22
48
13
17
A V rage 6 ( 10-6 vCi /me)
ESG- 80- 7 52

TABLE A-4
BELL CREEK AND ROCKETDYNE DIVISION RETENTION POND RADIOACTIVITY DATA - 1966 THROUGH 1979
Samples -. --- -
Interim Retention Final Retentioil Pond Pond Water R-2A Water
12
Year
- - - - - - -
Bell Creek Veqetation Creek Mud 54
Average
pCi/l
Bell Creek Water 54
-- --
Average
& i / g ash)
Average
(lo-' t,Ci/mk) No.
jampl e s No.
Sam1 e s No.
Samples No.
Samples No.
Samol es

Year
TABLE A-5
AMBIENT AIR RADIOACTIVITY CONCENTRATION DATA - 1957 THROUGH 1979
DeSoto S i t e Average ( 10- l2 pCi /mR)
Number Samples
i o a c t i v i t y va lues were i n c l u d e d i n t h e e t a va lues and n o t r e p o r t e d s e p a r a t e l y p r i o r t o 1971
f I n s u f f i c i e n t d a t a • ˜ I n c l u d e s Rocketdyne S i t e A i r Sampler Data
SSFL S i t e ~ v e r a g e ' (10-12 $ i / m ~ )
Number Samples
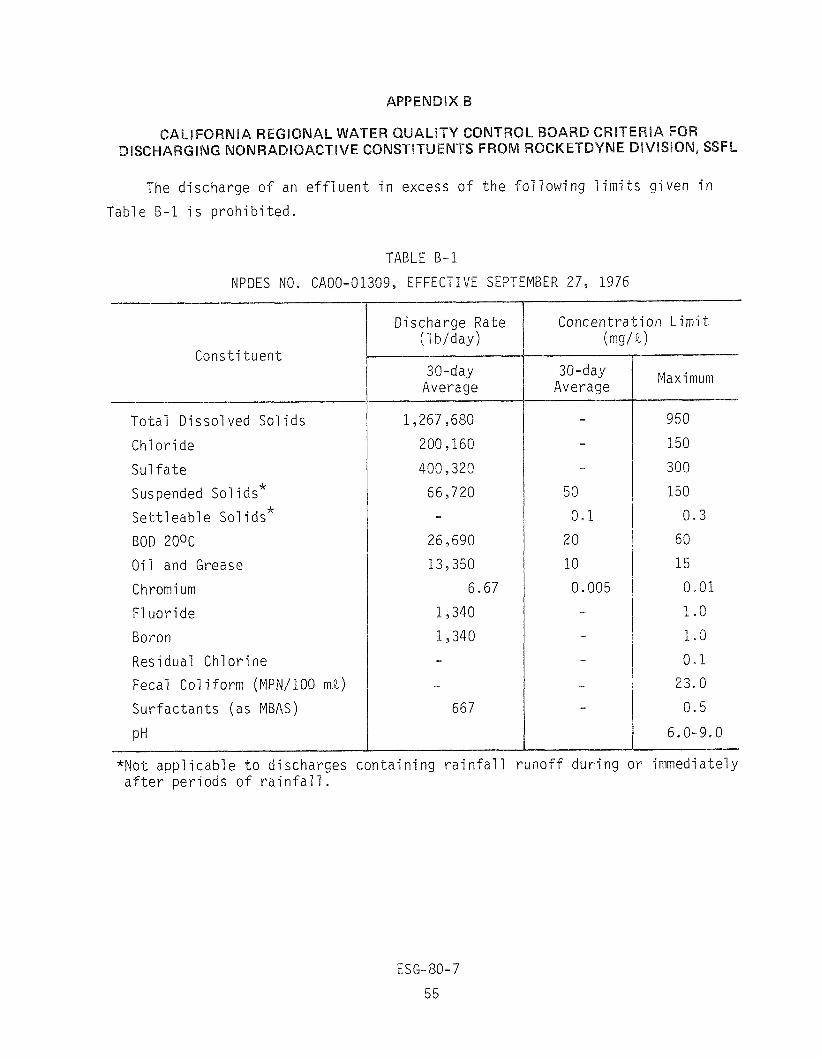
The discharge of an e f f luen t i n excess of the following l imi t s given in
Table B-1 i s prohibited.
T A B L E B-1
NPDES NO. CA00-01309, EFFECTIVE SEPTEMBER 27, 1976
Constituent
Total Dissol ved Sol ids
Chloride
Sulfa te
Suspended Sol ids*
Se t t l eab le Sol ids*
BOD 200C
Oil and Grease
Chromium
Fl uori de
Boron
Residual Chlorine
Fecal Col i form (MPNI100 m ~ )
Surfactants (as MBAS)
pH
Discharge Rate ( 1 blday)
30-day Average
Concentration Limit ( m g l ~ )
30-day Average Maximum
*Not applicable t o discharges containing r a in f a l l runoff during o r immediately a f t e r periods of r a i n f a l l .


DOE Manual Chapter 0513
DOE Manual Chapter 0524, Appendix
Code of Federal R e g u l a t i o n s , T i t l e 1 0 , P a r t 20
C a l i f o r n i a Rad ia t ion Control R e g u l a t i o n s , C a l i f o r n i a A d m i n i s t r a t i v e Code, T i t l e 17, P u b l i c Heal th
Cal i f o r n i a Regional Water Qua1 i t y Control Board, Los Angel e s Region, Order No. 74-379, NPDES No. CA0001309, E f f e c t i v e September 27, 1976
Meteorology and Atomic Energy - 1968, TID 24190
Report of Committee 11 on P e r m i s s i b l e Dose f o r I n t e r n a l Rad ia t ion ( 1 9 5 9 ) , ICRP P u b l i c a t i o n 2
Deposi t ion and Re ten t ion Models f o r I n t e r n a l Dosimetry o f t h e Human R e s p i r a t o r y T r a c t , ICRP Committee I 1 Task Group on Lung Dynamics
Document TI #N001TI000-046 t i t l e d "Method of Es t imat ing General Popula t ion Radia t ion Dose A t t r i b u t a b l e t o Atmospheric Discharge of R a d i o a c t i v i t y from ESG Nuclear F a c i l i t i e s , " J . D . Moore
1. Radio log ic Health S e c t i o n , S t a t e Department o f P u b l i c H e a l t h , C a l i f o r n i a
2. Rad io log ica l Heal th D i v i s i o n , Los Angeles County Heal th Department Cal i f o r n i a
3. Resources Management Agency, County o f Ventura , Cal i f o r n i a 4. U.S. Department o f Energy, San F r a n c i s c o Opera t ions O f f i c e
5. U.S. Nuclear Regulatory Commission, Div i s ion of Reactor L icens ing
6. Gordon Facer , D i v i s i o n o f Mi 1 i t a r y Appl i c a t i ons , DOE
7 . Andrew J . P ressesky , Reactor Research and Development, D O E
8. James M i l l e r , Div i s ion o f Biomedical and Environmental Research, DOE
9 . DOE-Headquarters L i b r a r y , A t t e n t i o n : Char les Sherman