SYSTEMS
29
PowerPoint ® Lecture prepared by Gary A. Beluzo SYSTEMS Why are Environmental Problems so Difficult to Solve? 3
-
Upload
medge-cruz -
Category
Documents
-
view
15 -
download
2
description
SYSTEMS Why are Environmental Problems so Difficult to Solve?. 3. STUDENT LEARNING OUTCOMES. After reading this chapter, students will be able to. - PowerPoint PPT Presentation
Transcript of SYSTEMS
PowerPoint® Lecture prepared by Gary A. Beluzo
SYSTEMSWhy are Environmental Problems so Difficult to Solve?
3

Copyright © 2007 McGraw-Hill Publishing Company
STUDENT LEARNING OUTCOMES
• Explain how systems are able to generate predictable behaviors and are able to display homeostasis.
• Explain how natural selection traits allow organisms to thrive in particular environments.
• Compare and contrast linear and non-linear growth and their effects on society’s ability to manage the environment.
• Identify the characteristics of systems that make it difficult to solve environmental challenges and why potential solutions sometimes make the problem worse.
• Explain how the scientific method is able to evaluate competing explanations for observable phenomena.
After reading this chapter, students will be able to

Copyright © 2007 McGraw-Hill Publishing Company
The Last Tree on Easter Island and the Lorax• Roggeen arrived on Easter Island in
1722, no trees or bushes higher than 3 meters present
• Analysis of charcoal and pollen in mud cores indicated up to 21 species of trees were originally present.
• Forest largely eliminated between 1400s and 1600s
• How could the Easter Islanders have cut down the last of their trees?
• Who Is the Lorax?
Copyright © 2007 McGraw-Hill Publishing Company
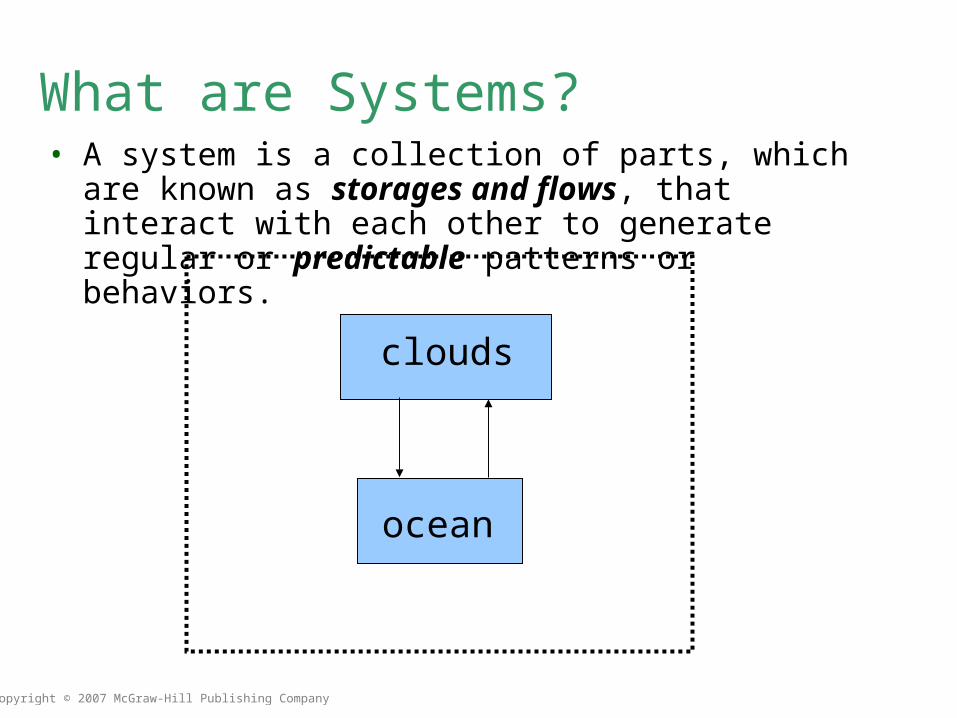
What are Systems?• A system is a collection of parts, which are known as
storages and flows, that interact with each other to generate regular or predictable patterns or behaviors.
clouds
ocean

Copyright © 2007 McGraw-Hill Publishing Company
Random versus Predictable

Copyright © 2007 McGraw-Hill Publishing Company
Do Systems Have Goals?• Defining characteristic of a system is its regularity or
predictability
• Environmental impacts are often determined by economic systems
• The PURPOSE of an economic system is to produce and distribute goods and services that people associated with material well-being.
• Economic behaviors are judged by efficiency, which refers to getting the most out of the resources used
• Economic efficiency not equated with fairness
• Economic changes produce winners and losers but that does not indicate whether the changes are economically good or bad.

Copyright © 2007 McGraw-Hill Publishing Company
Using Energy to Generate Order• Materials flow spontaneously from low entropy to high
entropy resulting in gradients.
Copyright © 2007 McGraw-Hill Publishing Company
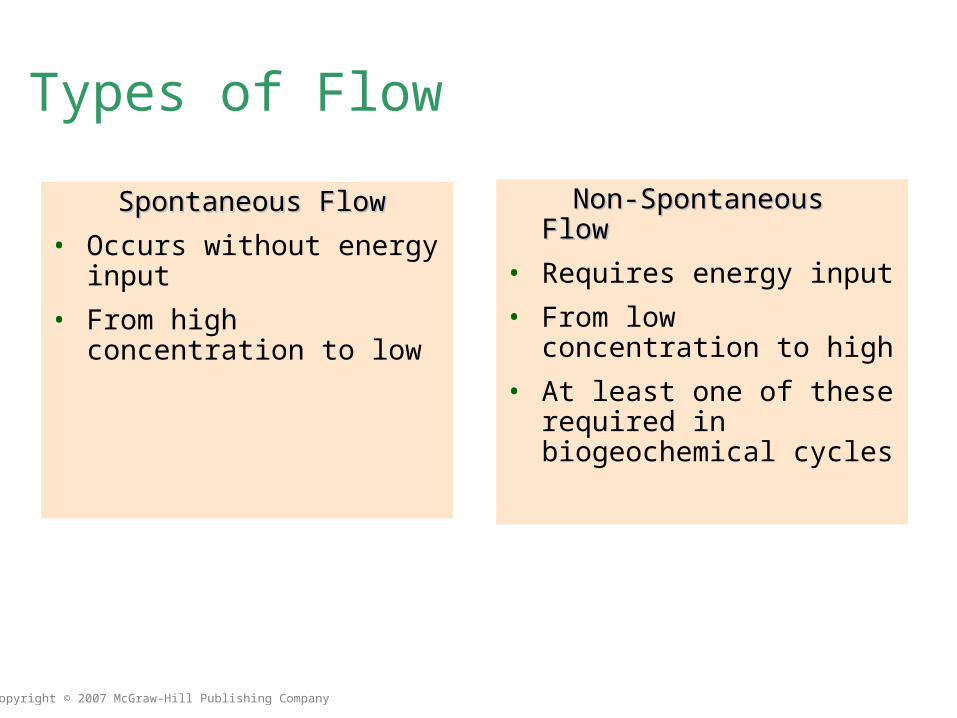
Types of Flow
Spontaneous FlowSpontaneous Flow
• Occurs without energy input
• From high concentration to low
Non-Spontaneous FlowNon-Spontaneous Flow
• Requires energy input
• From low concentration to high
• At least one of these required in biogeochemical cycles
Copyright © 2007 McGraw-Hill Publishing Company
Homeostasis
• The ability to maintain the behavior of a system when disturbed.
• Measured by system’s ability to maintain a certain storage or flow, termed the set point.
• For example, the temperature set point for the human body is 37 degrees Celsius.

Copyright © 2007 McGraw-Hill Publishing Company
System Stability
Copyright © 2007 McGraw-Hill Publishing Company
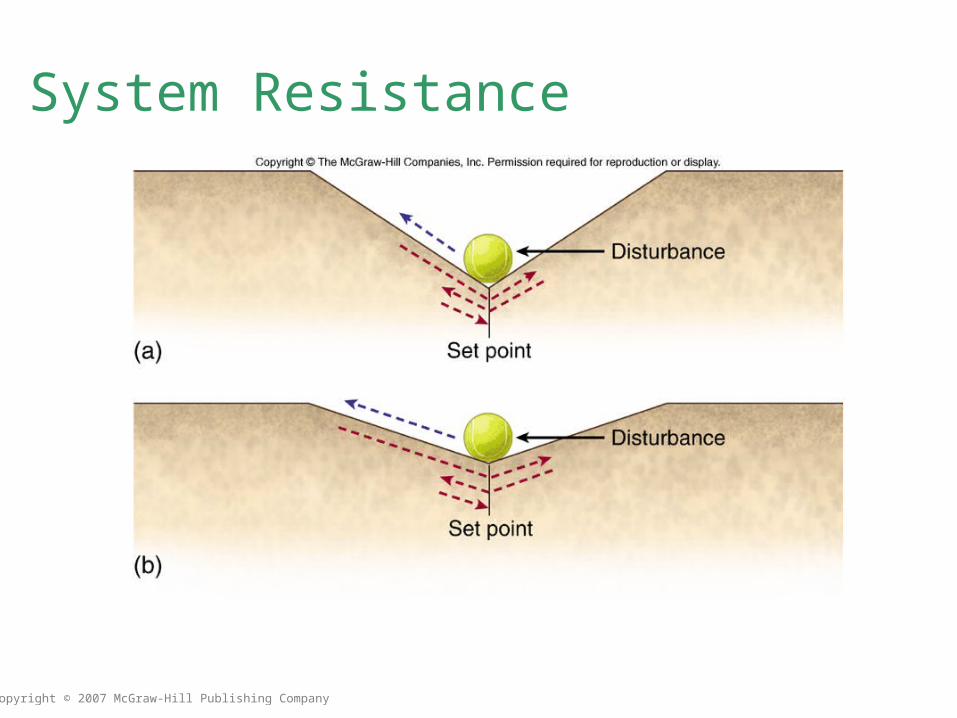
System Resistance

Copyright © 2007 McGraw-Hill Publishing Company
System Resilience

Copyright © 2007 McGraw-Hill Publishing Company
System Structure• Positive Relationship between
system parts
• Increase in one part means increase in another
• Decrease in one part means decrease in another
• Symbolized with a
• Amplifies behavior
• GUITAR AMPLIFIER
• GLOBAL WARMING?
• Negative Relationship between system parts
• Increase in one part means a decrease in another
• Decrease in one part means increase in another
• Symbolized with a
• Balances behavior
• THERMOSTAT/FURNACE
• HUMAN BODY TEMP
+ -
A complex, dynamic system (e.g. a living organism) consists of many positive and negative relationships

Copyright © 2007 McGraw-Hill Publishing Company
Analyzing Relationships• Function is a mathematical formula that relates one
variable (dependent) to another variable (independent)
• Independent variable is on the right hand side of the equal sign in a function and is represented by X-axis (horizontal)
• Dependent variable is on the left hand side of the equal sign in a function and is represented by Y-axis (vertical)
Agriculture Land = 0.8 * Population
Dependent variable coefficient
Dependent variable

Copyright © 2007 McGraw-Hill Publishing Company
Agriculture Responds to Population +

Copyright © 2007 McGraw-Hill Publishing Company
Forest Responds to Population -

Copyright © 2007 McGraw-Hill Publishing Company
Feedback Loops The effects of a disturbance on a system can be
evaluated using the notion of a feedback loop.

Copyright © 2007 McGraw-Hill Publishing Company
Positive Feedback Loop +
Copyright © 2007 McGraw-Hill Publishing Company
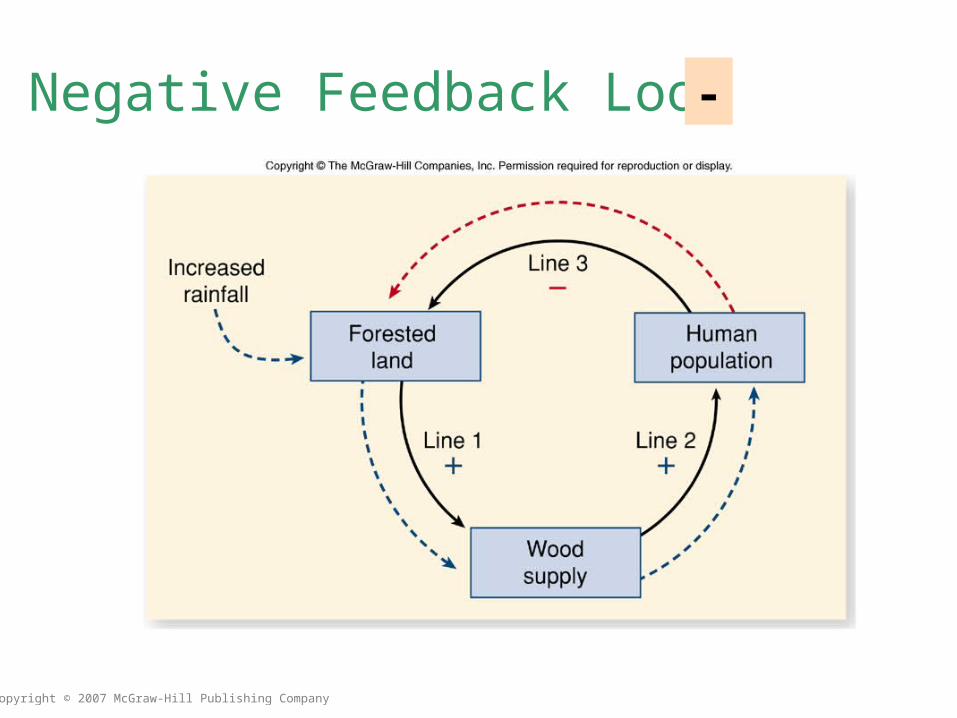
Negative Feedback Loop -

Copyright © 2007 McGraw-Hill Publishing Company
Natural Selection

Copyright © 2007 McGraw-Hill Publishing Company
Why are Systems Difficult to Manage?• Why do societies behave unsustainably?
• Unpredictability (stochastic behavior)
• Variance is the degree or dispersion or scatter in a variable (large variance means low predictability)
• Unpredictability and extreme events make it difficult to manage environmental systems
• Risk Management (used without knowing all!)
• Complexity• The number of storages, flows, and the number and strength
of feedback loops in a system

Copyright © 2007 McGraw-Hill Publishing Company
Complexity in Easter Island System• Positive feedback loop that included human
population, agricultural land, and food supply.
• Negative feedback loop that included population, agricultural land, forest area, and supply. Not possible to know which of these loops predominates.
Copyright © 2007 McGraw-Hill Publishing Company
Hierarchy• Systems often are part of a larger system.
• Subsystems arranged like a ladder according to function
• Organization of natural world viewed as hierarchy of systems
Copyright © 2007 McGraw-Hill Publishing Company
Time Lags• Time lag refers to the period that lapses between a
cause and an effect.
• Long lag times make it difficult to establish cause and effect
• Long lag times also diminish effectiveness of environmental policy

Copyright © 2007 McGraw-Hill Publishing Company
Distance Effects• Distance refers to the separation in space between a
cause and an effect.
• Effects of Acid Rain in the Appalachian Mountains and the tall stacks in the Mid-West.
Copyright © 2007 McGraw-Hill Publishing Company
Linear versus Non-Linear Relationships
• Linear functions are represented with a straight line
• Constancy disappears in nonlinear relationships, which are represented with a function other than a straight line.
• Most of us tend to see the world through “linear glasses”
• Nonlinear implies that the severity of an environmental problem can increase suddenly even if the cause of the problem increases gradually.

Copyright © 2007 McGraw-Hill Publishing Company
The Scientific Method

Copyright © 2007 McGraw-Hill Publishing Company
Reductionistic versus Systems• A Reductionist Approach is based on a premise that
the best way to learn about something is to break it into its parts and study parts separately.
• This approach has been quite successful in the natural sciences (biology, chemistry, physics)
• Limits of the reductionist approach were first recognized by Frederick von Bertlanfy
• General Systems Theory- concerned with problems of relationships, structures, and interdependence, rather than constant attributes of object.
• Integrated Systems Approach

Copyright © 2007 McGraw-Hill Publishing Company
Simulation Models• Mathematical representations that simulate behavior of
systems from insights gained from many disciplines
• First, choose which storages and flows to include
• Quantify the nature (positive or negative) and the strength (weak or strong) of the relationships.
• Calibrate or validate the Model using real-world observations.
• Scenario Analysis (“What if?”)
• Use an existing such as SimCity, SimEarth, or build your own: STELLA