SystemLevel Performance Analysis With PCP · fail to scale to ... pmie and pinpoint ... McConnell...
31
Chatz <[email protected]> Cowan <[email protected]> Nathan <[email protected]> System-Level Performance Analysis With PCP
Transcript of SystemLevel Performance Analysis With PCP · fail to scale to ... pmie and pinpoint ... McConnell...

Chatz <[email protected]>Cowan <[email protected]>Nathan <[email protected]>
SystemLevelPerformanceAnalysis With PCP

Welcome to Aconex!
Scalable performance monitoring
Performance CoPilot
Brief introduction to Aconex
PCP integration into Aconex application
Practical examples

Scalable Performance Monitoring
SGI in Melbourne started developing Performance CoPilot 15 years ago
Goal was to help SGI users understand very complex system performance problems
Traditional toolsfail to scale to large machinesdo not provide low level granularitydifficult to perform retrospective analysishave poor visualisation of large data sets
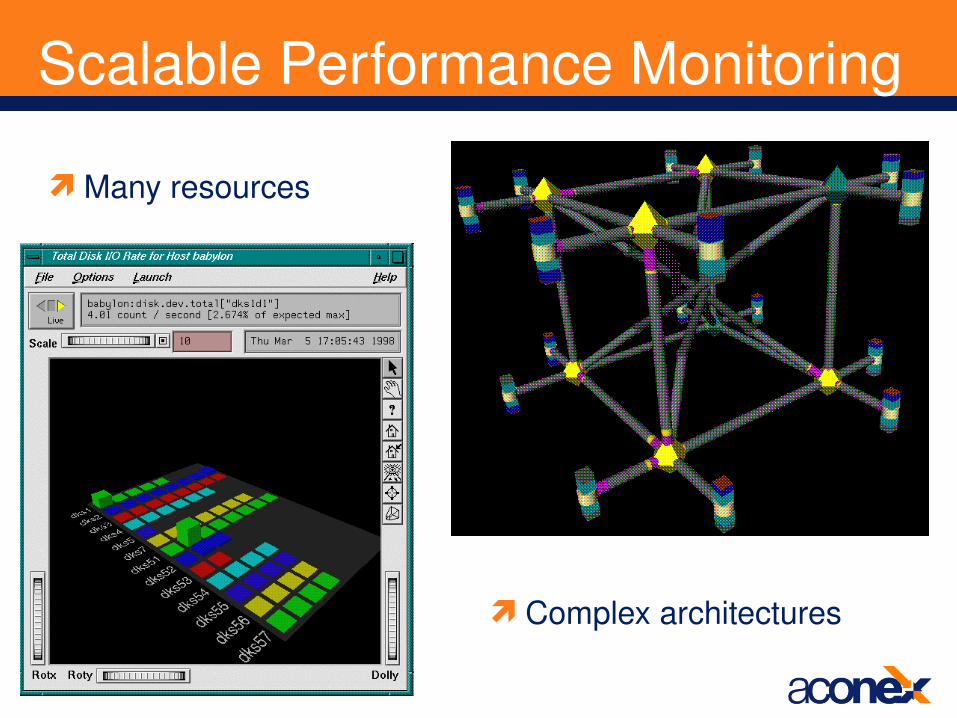
Scalable Performance Monitoring
Many resources
Complex architectures

Scalable Performance Monitoring
How do you monitor a 512 processor machine top does not scale!
How do you monitor a cluster of 20x512 processor machines?
How do you know if what you are observing today has happened before?
How do you correlate today’s event with other activity on the system?
Our goal tonight
Demonstrate how Aconex has taken an open source performance monitoring toolset and integrated it into our Java applicationOverview of PCP and how it worksHow it is integratedDifferences in monitoring a JVM to an Operating
SystemExamples of how we have used PCP in anger
All the software you will see tonight has been developed here in Melbourne

PCP Overview
What is PCP?Open source toolkit for system level performance
analysisLive and historicalExtensible (monitors, collectors)Distributed

Architecture

Data Model
Metrics come from one source (host / archive)Source can be queried at any interval by any monitor toolHierarchical metric names
e.g. disk.dev.read and aconex.response_time.avg
Metrics are singular or setvalued (“instance domain”)Metadata associated with every metric
Data type (int, double, ...)Data semantics (units, scale, ...) Instance domain

Monitor tools
pminfo, pmprobe, pmdumptextpmlogextract, pmlogsummary,
pmwtfkmchartpmstatpmieacxstatacxtop
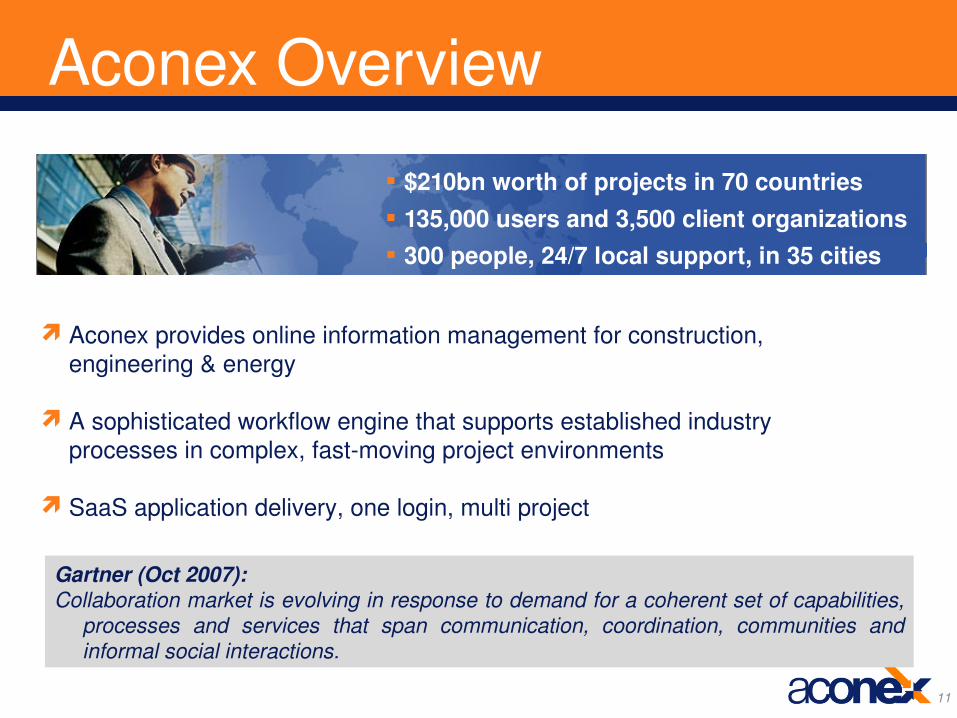
Aconex Overview
Aconex provides online information management for construction, engineering & energy
A sophisticated workflow engine that supports established industry processes in complex, fastmoving project environments
SaaS application delivery, one login, multi project
Gartner (Oct 2007):Collaboration market is evolving in response to demand for a coherent set of capabilities,
processes and services that span communication, coordination, communities and informal social interactions.
$210bn worth of projects in 70 countries 135,000 users and 3,500 client organizations 300 people, 24/7 local support, in 35 cities
11

Large projects need collaboration systems to operate effectively and manage risk
Hundreds of companies come together on large projects
Most communication is between companies
The volume of documents and correspondence on projects is huge
Participants on large projects are increasingly geographically dispersed
Risk management / litigation necessitates keeping a strong audit trail of project information
Participants:Locations:Information:Data managed:
3,030US, Europe, Asia, ME9.6m docs & correspondence4.2TB

What's hard about monitoring Java?
Java's never standalone; interacts withOSNetworkDatabase
Can't monitor Java in isolationThe JVM makes things more complicated
Java heap + GC means that native memory metrics are not so useful on their own
One more layer of indirection between everythingTo the OS, JVM can just look like a big amorphous blob

How do we collect the data?
Needs to beFastLowimpactNot stress the subsystems we're trying to monitor!
Basic monitoring framework is very simple + lightweightObserver/Listener pattern Monitor registers self with MonitorablesMonitorables inform Monitors when they change valueMost Monitorables are very lightweight
MonitoredCounter = wrapper around an AtomicLong, monotonically increasing (e.g. event counter, cumulative tally)
MonitoredValue = any sort of value, commonly AtomicLong/AtomicInteger (show current state – inprogress events)
Also have a polling implementation to monitor thirdparty systems (uses Timer to poll, updates if value changes)

Aconex PMDA
How do we get the data to PCP?
PcpMonitorBridge is an (the only!) implementation of Monitor
Maintains an update queue of changed valuesCreates a memorymapped file (NIO) which gets mapped
into PCP Agent's address spaceShared memory between JVM and C agent (memory == fast, and
no I/Orelated system calls)As close to 0 overhead as we'll get
Keeps a Map of Monitorables file offsets⇒
Polling thread drains queue, writing new values to fileChanges then visible to custom PCP agent Is also an Mbean (CompositeData), just for good measure

How it hangs together

aconexpcpbridge lifecycle
PCP requires a fixed set of metricsNeed to assemble the list of metrics before handing over to PCPCannot dynamically add metrics at runtime
MonitorableRegistry is (ugly) static class maintaining a singleton map of identifiers to Monitorables
Monitorables register themselves with the Registry on creation
Starting the PcpMonitorBridge 'freezes' the Registry, no more monitorables can be created
Dependency injection would be a lot less disgusting here (and let us have multiple Monitors)
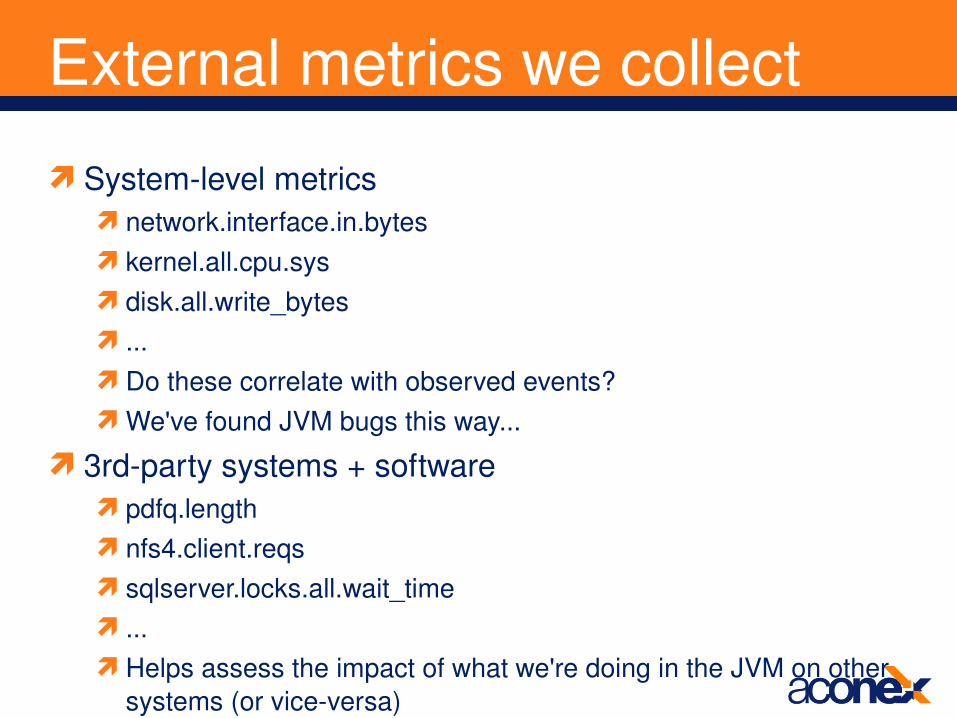
External metrics we collect
Systemlevel metricsnetwork.interface.in.byteskernel.all.cpu.sysdisk.all.write_bytes ...Do these correlate with observed events?We've found JVM bugs this way...
3rdparty systems + softwarepdfq.lengthnfs4.client.reqssqlserver.locks.all.wait_time ...Helps assess the impact of what we're doing in the JVM on other
systems (or viceversa)

JVM Internal metricsLots of information about the JVM, and what it's doingOften stuff exposed through JMX anyway
MBean polling Monitorable implementation
Kinda boring, but useful:aconex.memory.gc.full.countaconex.memory.gc.minor.timeaconex.memory.permgen.usedaconex.memory.survivor.committedaconex.jvm.compilations ...
Mostly memoryrelated, but a few more possible (and easy)Classloader infoThread countsetc...

Applicationlevel statsWhere it gets interesting (for us!) If in doubt, monitor it – it costs almost nothing and might
be useful laterCumulative counters: .logins, .upload.files, .download.files Instantaneous state: .sessions.activeUnchanging values for sanity checking/correlation: .jvm_versionMore advanced stats: .response_time.{min, max, avg, median,
adjavg, samples}Monitor other libraries:
.jmsmsgs.{sent, queued, processed}.cache.region.{misses, requests, evictions, load_time, ...}
Instrument the DB (with JDBC Driver decorator):.connections.{in_use, available}.jdbc.queries.{active, total}
... and about a bazillion more...

And then we get tricky...
Implementations of InputStream and OutputStream which count bytes as they pass throughMuch more accurate than just counting instantaneously by filesize
SessionMonitor (normally off) – calculates sizeof(session object) .sessions.bin_256KB_2MB.{count, max, mean, min, total}
Percontroller metrics – time each request at start/end .controllers.controllername.{count, time}
But we also know that each request is served by 1 thread; can snapshot other values at start/end of request and use as counter deltas .controllers.controllername.{utime, stime, blocked.time,
blocked.count, waited.time, waited.count}

Getting transparency into completely isolated thirdparty systems is still difficult
e.g. one standalone 3rdparty (Javabased) system was misbehaving, needed profiling
How do we get that JVM monitored by PCP? "Cuckoo's Egg" approachCustom org.apache.log4j.AppenderHijack class <init> process to set up PCP bridgeMonitor JVMFind problem!
Challenges still exist...

Adding a new metric
private final MonitoredCounter fileRequestCounter = new MonitoredCounter("aconex.pdf.file_requests", "Number of file requests by the PDF server");... protected ModelAndView handleRequestInternal(...) { ... fileRequestCounter.inc();
Produce new version of pmdaScript runs against the memorymapped file and produces new
PMDA code, which is... ...compiled and released via RPM (concurrent with app release)Done!
$ pmval -r -t 1hour -a /archives/<...> aconex.pdf.file_requests...09:13:22.885 680 10:13:22.885 689 11:13:22.885 696
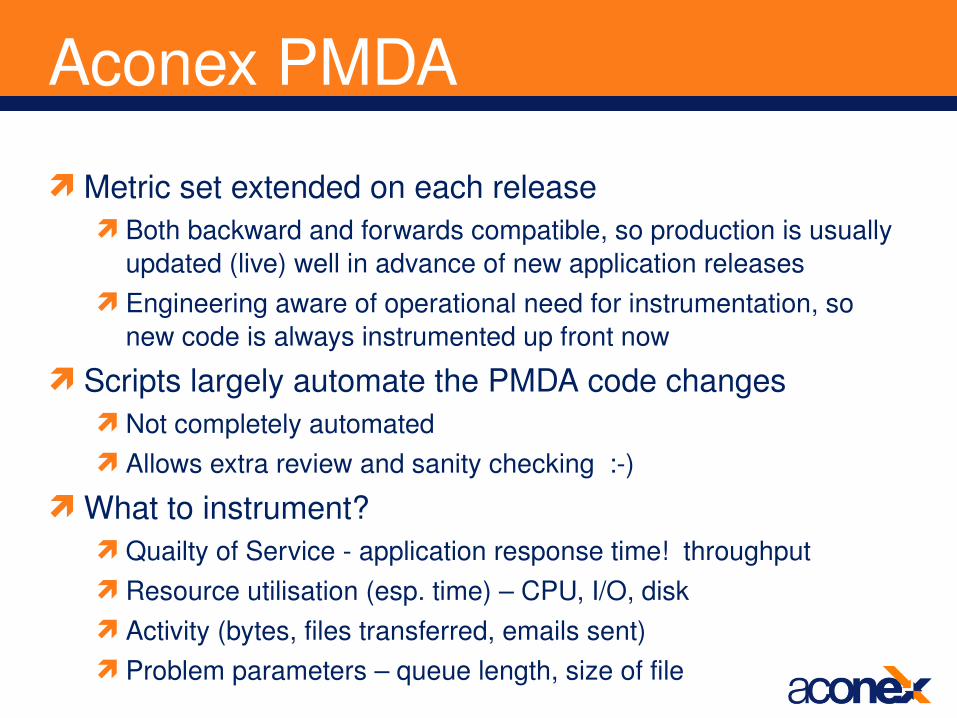
Aconex PMDA
Metric set extended on each releaseBoth backward and forwards compatible, so production is usually
updated (live) well in advance of new application releasesEngineering aware of operational need for instrumentation, so
new code is always instrumented up front now
Scripts largely automate the PMDA code changesNot completely automatedAllows extra review and sanity checking :)
What to instrument?Quailty of Service application response time! throughputResource utilisation (esp. time) – CPU, I/O, diskActivity (bytes, files transferred, emails sent)Problem parameters – queue length, size of file
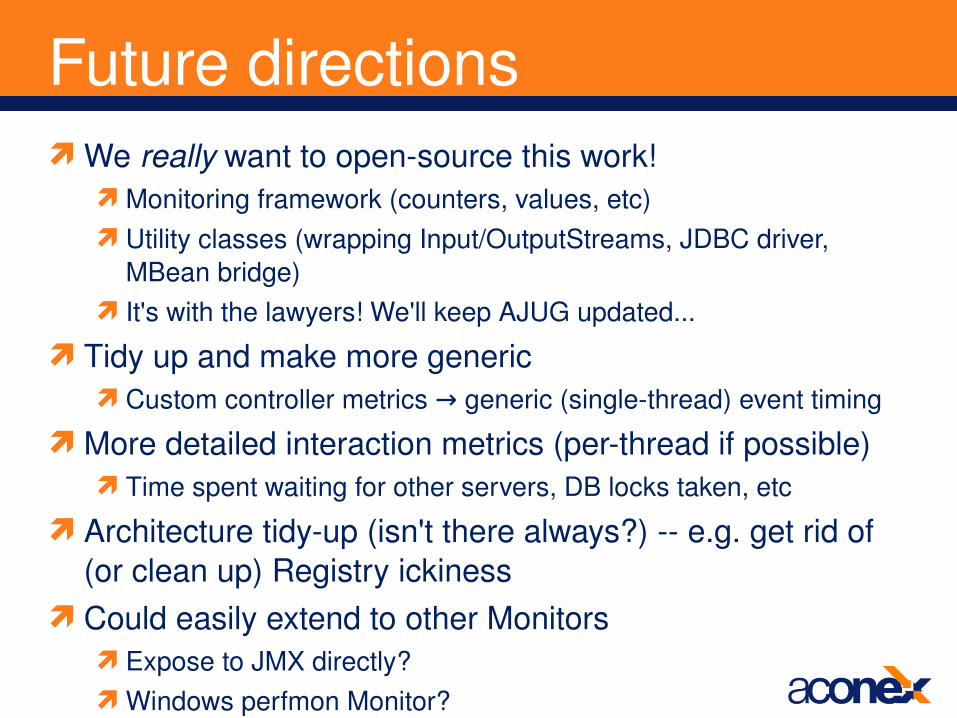
Future directionsWe really want to opensource this work!
Monitoring framework (counters, values, etc)Utility classes (wrapping Input/OutputStreams, JDBC driver,
MBean bridge) It's with the lawyers! We'll keep AJUG updated...
Tidy up and make more genericCustom controller metrics generic (singlethread) event timing→
More detailed interaction metrics (perthread if possible)Time spent waiting for other servers, DB locks taken, etc
Architecture tidyup (isn't there always?) e.g. get rid of (or clean up) Registry ickiness
Could easily extend to other MonitorsExpose to JMX directly?Windows perfmon Monitor?

Final steps
pmie and Nagios – production alarmsnotifications = some_inst ( aconex.notification.jobs_failed > 0 )
> shell "send_mail Notification jobs failed: %v";Archives used to verify rulesCatch unusual resource utilisation, error conditions, and poor
quality of service
pmie and pinpoint monitoringAutomate generation of threaddumps, heap capture, profiling
kmchart – live and historical production monitoringpmdumptext / acxstat – ditto, console toolsBenchmarking, new system configurationPlanning for the future
Further Information
http://www.aconex.com [ /Careers.html ]http://oss.sgi.com/projects/pcphttp://www.ohloh.net/projects/pcphttp://techpubs.sgi.com/ [ PCP Programmers Guide ]

Abu Dhabi Investment House Faithful & Gould Multi Development Aedas Foster and Partners Multiplex AJES Gammon Nishimatsu Arif and Bintoak GHD Global NRY Architect Atkins Grocon Ove Arup & Partners Australand Hassell Page Kirkland Partnership Bates Smart Hongkong Land Robert Bird & Partners Baulderstone Hornibrook Hsin Chong ROK Buchan Group HWO Architects Taisei Capita Symonds ING Real Estate The Cox Group Capitaland Itochu Turner & Townsend Clifton Coney Group Kajima Vietnam Land SSG Confluence Laing O'Rourke Wates Group Cyril Sweett Larsen and Toubro WDA Architects Davis Langdon & Seah Las Vegas Sands Woods Bagot Dragages Levett and Bailey Woolworths Dubai Sports City LTW WSP Group Dubai Metro Mainzeal WT Partnership Emirates Sunland MKM Commercial Holdings Airport Authority Hong Kong InterContinental Hotels Qantas Australia Pacific Airport Management Macquarie Bank Ritz Carlton Building Schools for the Future Mandarin Oriental Hotels Sydney Opera House Colonial First State Property McDonald’s Restaurants Taj Hotels Resorts and Palaces DFS Group Melco Hotels And Resorts Tradewinds Hotels and Resorts Hyatt International Ocean Park Corporation Venus Assets Al Habtoor Connell Wagner Nui Phao Mining Alcoa Earth Tech Engineering Mitsubishi Corporation Alinta Evans & Peck Mott Connell Babcock & Brown Global Offshore International OMV BHP Billiton Global Process Systems Parsons Brinckerhoff Bilfinger Berger Hitachi Penta Ocean Bluescope Steel Hyder Consulting Straits Hillgrove British Gas India Jindal Steel & Power Tanker Pacific Offshore Bulga Coal Maunsell Tiberon Minerals ChemOil McConnell Dowell Waterman-Gore CLP Engineering Meinhardt WorleyParsons Connell Mott MacDonald MinCraft Consulting Xstrata Coal Grocon GHD Global NRY Architect Atkins Grocon Ove Arup & Partners Australand Hassell Page Kirkland Partnership Bates Smart Hongkong Land Robert Bird & Partners Baulderstone Hornibrook Hsin Chong ROK Buchan Group HWO Architects Taisei Capita Symonds ING Real Estate The Cox Group Capitaland Itochu Turner & Townsend Clifton Coney Group Kajima Vietnam Land SSG Confluence Laing O'Rourke Wates Group Cyril Sweett Larsen and Toubro WDA Architects Davis Langdon & Seah Las Vegas Sands Woods Bagot Dragages Levett and Bailey Woolworths Dubai Sports City LTW WSP Group Dubai Metro Mainzeal WT Partnership Emirates Sunland MKM Commercial Holdings Airport Authority Hong Kong InterContinental Hotels Qantas Australia Pacific Airport Management Macquarie Bank Ritz Carlton Building Schools for the Future Mandarin Oriental Hotels Sydney Opera House Colonial First State Property McDonald’s Restaurants Aedas Foster and Partners Multiplex AJES Gammon Nishimatsu Arif and Bintoak GHD Global NRY Architect Atkins Grocon Ove Arup & Partners Australand Hassell Page Kirkland Partnership Bates Smart Hongkong Land Robert Bird & Partners Baulderstone Hornibrook Hsin Chong ROK Buchan Group HWO Architects Taisei Capita Symonds ING Real Estate The Cox Group Capitaland Itochu Turner & Townsend Clifton Coney
Thank you
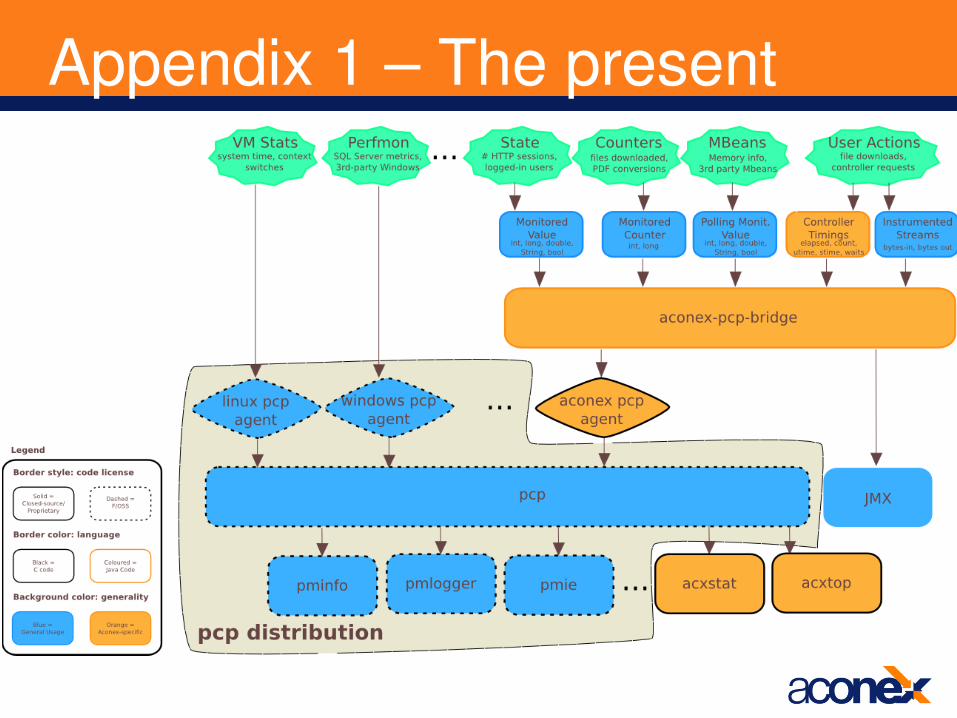
Appendix 1 – The present

Appendix 2 – The future