Systematizing Corporate Decision-Making in a Complex World · Sciarelli & Tani review a wide array...
16
International Journal of Managerial Studies and Research (IJMSR) Volume 4, Issue 8, August 2016, PP 73-88 ISSN 2349-0330 (Print) & ISSN 2349-0349 (Online) http://dx.doi.org/10.20431/2349-0349.0408006 www.arcjournals.org ©ARC Page | 73 Systematizing Corporate Decision-Making in a Complex World Barnim G. Jeschke, Nils Mahnke Germany Corporate decision-making is characterized by its underlying complexity. Related challenges include the anticipation of environmental dynamics and of a multi-perspective stakeholder view that also considers long- term interdependencies among an ever-widening array of relevant forces. How can such claims be transformed into corporate management sense? How can they be instrumental in conceptuali zing and implementing “better” strategies? With SUDEST (“Sustainable Decision Support Tool”), a prescriptive approach is introduced, transforming the bio-cybernetics of applied system’s theory into pragmatic analysis and advice. Based on a holistic, integrative view, direct and indirect relations amongst system constituents are considered, evaluated and chronologically mapped. SUDEST allows the appreciation of non-linear system effects. Both, hard and soft facts are described and translated into matrix logic to draw a valid picture of the underlying situation and to add value for complex decision-making. 1. DECODING COMPLEX ENVIRONMENTS FOR DECISION-MAKING It seems to be common knowledge that the world becomes more and more complex. However, what are the constituents of such complexity? And how can they be operationalized and utilized for decision-making? Finally, what are implications for an anticipatory management approach? 1.1. System Constituents Corporate decision-makers need to reflect the company as part of an open system. While system boundaries define the difference between inside (subject to integrating efforts) and outside (subject to differentiating efforts), exchanges between inside and outside are subject to cooperative efforts. Systems- and, therefore, the information basis for decision-making - are based on its system constituents. Here, decision subjects are to be distinguished from decision objects. Decision subjects are (human) stakeholders, pursuing their interests, trying to increase their power by influencing other stakeholders [1]. The following two aspects may describe stakeholders for the purpose of SUDEST: Level of interest: Is the stakeholder’s interest in consent or in dissent to the interest of the respective corporate decision-maker? Intensity of interest: How strong is the respective stakeholder interest? And what is the power potential of the respective stakeholder to enforce his interests towards the corporate decision- maker and other involved stakeholders? Decision objects are physically measurable, tangible or intangible system-relevant resources. In SUDEST terminology, decision objects are called “products”, being subject to (certain) stakeholder’s interests. In essence, stakeholders impact the system by either increasing or decreasing the quantities of such products. Products, in turn, impact other products as well as stakeholder interests. In a corporate context, such products may relate to economic, social or ecological categories. Typically, a system’s products are interwoven by trade-off effects. Therefore, focussing a system on just a single product (e.g. CO2 equivalents of corporate emission savings) is likely surprise the decision maker. Hence, decision-making is about decision subjects striving to increase or decrease the quantities of certain decision objects. 1.2. System Boundaries Corporate decisions are the result of a sound information basis added by managerial intuition. Intuition, then, is about interpreting and concluding based on the provided information [2].Problem-
-
Upload
nguyenkiet -
Category
Documents
-
view
213 -
download
0
Transcript of Systematizing Corporate Decision-Making in a Complex World · Sciarelli & Tani review a wide array...
International Journal of Managerial Studies and Research (IJMSR)
Volume 4, Issue 8, August 2016, PP 73-88
ISSN 2349-0330 (Print) & ISSN 2349-0349 (Online)
http://dx.doi.org/10.20431/2349-0349.0408006
www.arcjournals.org
©ARC Page | 73
Systematizing Corporate Decision-Making in a Complex World
Barnim G. Jeschke, Nils Mahnke
Germany
Corporate decision-making is characterized by its underlying complexity. Related challenges include the
anticipation of environmental dynamics and of a multi-perspective stakeholder view that also considers long-
term interdependencies among an ever-widening array of relevant forces. How can such claims be transformed
into corporate management sense? How can they be instrumental in conceptualizing and implementing “better”
strategies?
With SUDEST (“Sustainable Decision Support Tool”), a prescriptive approach is introduced, transforming the
bio-cybernetics of applied system’s theory into pragmatic analysis and advice. Based on a holistic, integrative
view, direct and indirect relations amongst system constituents are considered, evaluated and chronologically
mapped.
SUDEST allows the appreciation of non-linear system effects. Both, hard and soft facts are described and
translated into matrix logic to draw a valid picture of the underlying situation and to add value for complex
decision-making.
1. DECODING COMPLEX ENVIRONMENTS FOR DECISION-MAKING
It seems to be common knowledge that the world becomes more and more complex. However, what are the constituents of such complexity? And how can they be operationalized and utilized for
decision-making? Finally, what are implications for an anticipatory management approach?
1.1. System Constituents
Corporate decision-makers need to reflect the company as part of an open system. While system
boundaries define the difference between inside (subject to integrating efforts) and outside (subject to differentiating efforts), exchanges between inside and outside are subject to cooperative efforts.
Systems- and, therefore, the information basis for decision-making - are based on its system
constituents. Here, decision subjects are to be distinguished from decision objects. Decision subjects
are (human) stakeholders, pursuing their interests, trying to increase their power by influencing other stakeholders [1]. The following two aspects may describe stakeholders for the purpose of SUDEST:
Level of interest: Is the stakeholder’s interest in consent or in dissent to the interest of the
respective corporate decision-maker?
Intensity of interest: How strong is the respective stakeholder interest? And what is the power
potential of the respective stakeholder to enforce his interests towards the corporate decision-maker and other involved stakeholders?
Decision objects are physically measurable, tangible or intangible system-relevant resources. In
SUDEST terminology, decision objects are called “products”, being subject to (certain) stakeholder’s interests. In essence, stakeholders impact the system by either increasing or decreasing the quantities
of such products. Products, in turn, impact other products as well as stakeholder interests. In a
corporate context, such products may relate to economic, social or ecological categories. Typically, a
system’s products are interwoven by trade-off effects. Therefore, focussing a system on just a single product (e.g. CO2 equivalents of corporate emission savings) is likely surprise the decision maker.
Hence, decision-making is about decision subjects striving to increase or decrease the quantities of
certain decision objects.
1.2. System Boundaries
Corporate decisions are the result of a sound information basis added by managerial intuition.
Intuition, then, is about interpreting and concluding based on the provided information [2].Problem-
Barnim G. Jeschke & Nils Mahnke
International Journal of Managerial Studies and Research (IJMSR) Page | 74
related information should depict reality, but – at the same time – reduce decisive patterns to the
relevant minimum. Prudent assumptions about the relevant system boundaries are key to a sound situational analysis: Too narrowly defined, the analysis will miss critical constituents and potentially
relevant impacting forces. Too broadly defined, however, it will dilute the managerial focus and
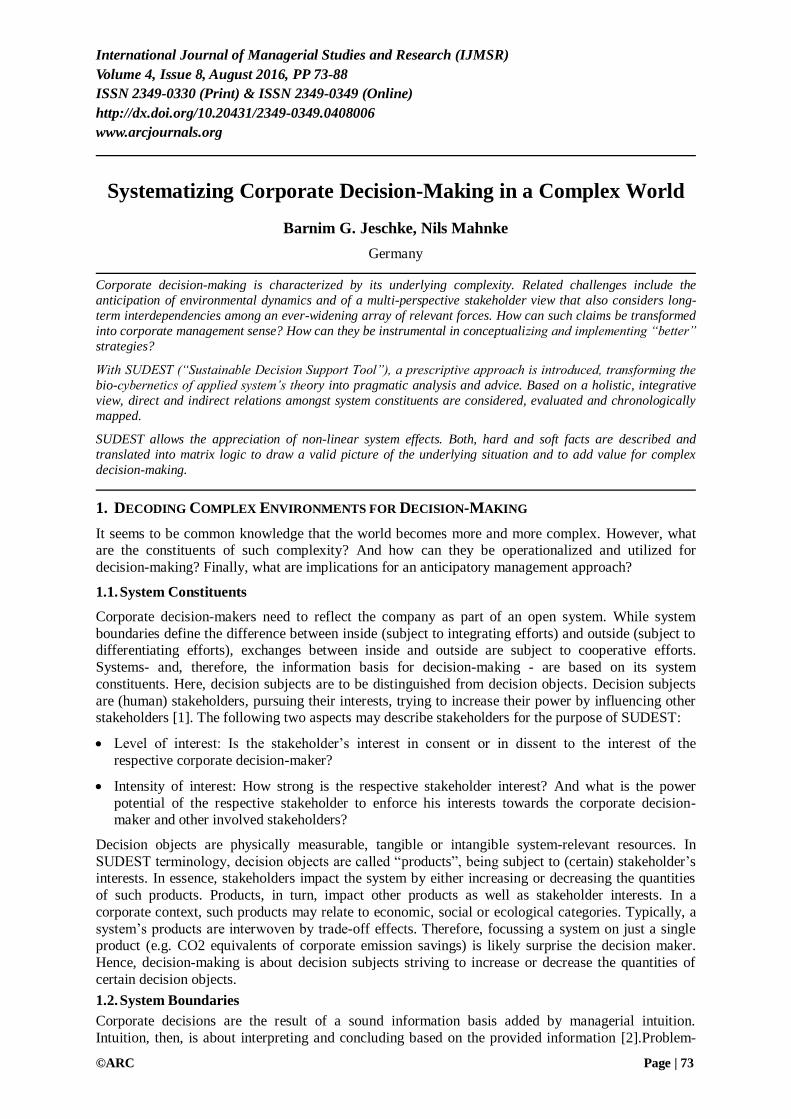
support analytical superficiality. The definition of relevant system boundaries – and, therefore, the environmental scanning radar – can be described by a two-dimensional scheme: the range of
considered system constituents and the time horizon of system analysis (see Figure 1).
Figure1. Dimensions of system bounderies
The first dimension, the range of considered system constituents, relates to both, decision subjects
(“stakeholders”) and their respective decision objects (“products”). Stakeholder relevance is not governed by the directness of his ties to the decision-maker. Rather, it is a function of his overall
system impact – and resulting repercussions for corporate interests. Sciarelli & Tani review a wide
array of stakeholder concepts, categorizing them with respect to the decision-makers’ stakeholder map and the way interrelations beyond the direct company-stakeholder relations are considered [3].
Accordingly, the effects of directly and indirectly interacting stakeholders and their considered
interests (decision objects) need to be distinguished. The second dimension of Figure 1refers to the
time horizon of system analysis. The longer-range the analysis, the more uncertain are system development scenarios. However, the negligence of long-term repercussions may lead to substantially
wrong decisions, with disastrious long-term feedback effects for the acting party.The identification of
useful boundaries for strategic planning is subject to a continuous corporate learning process, reflecting on costs and benefits of alternative environmental scanning approaches.
1.3. Operationalizing Complexity
How can system complexity be grasped? Four non-correlative parameters appear to drive environmental complexity [4] [5]:
Multiplicity: How many constituents are subject to the underlying situation? While traditional,
competition-focused approaches reduce their radar to directly interacting market players - such as
Porter’s five forces [6] - high-multiplicity situations call for some widened stakeholder mapping,
including the PESTEL1 fields. The more constituents affect the respective situation, the more
complex the situational context.
Interdependency: In how far do the above-mentioned situational constituents interrelate? The
higher the degree of indirect relations, the more holistic, integrative system’s thinking will be
1PESTEL stands for political, economic, social, technical, ecological and legal aspects of the corporate macro
environment

Systematizing Corporate Decision-Making in a Complex World
International Journal of Managerial Studies and Research (IJMSR) Page | 75
required in order to grasp the “big picture”. Otherwise, chances are that management draws its attention to symptoms, not to causes. Thus, the higher the degree of interdependency among
system constituents, the higher the underlying complexity.
Diversity: Are system constituents and their relations comparable or dissimilar? With increasing
dissimilarity (measured as variance from the mean of the respective characteristic), analysis tools
are challenged to appreciate the particulars of the respective system constituents on which corporate decision-making is based on.
Dynamics: In how far are relevant constituents or their interrelations subject to change? The more
system dynamics, the more complexity – and the less will the extrapolation of past decision
schemes suffice. Instead, continuous monitoring should provide continuous updating on the corporate environment.
Figure2 displays how dichotomizing the above mentioned parameters leads to a set of 16 types of
situational complexity. Simple situations - as they accompany our every-day life - can be tackled just
by intuition. Complicated situations, in contrast, will require external support. Software programs, for instance, do typically incorporate numerous variables (high multiplicity), either intensely interrelated
or not (low/high interdependency). As a rather mechanistic tool, such programs will appreciate all
variables’ effect by a binary code (low diversity). Justified by low dynamics, such algorithmic connection will remain stable over time. Complexity, however, requires a different logic than a pure
mechanistic one to account for system dynamics.
Figure2. Parameters of environmental complexity (Jeschke/Mahnke 2013:99)
Hence, complex decision-making needs to deal with three challenges:
Situation mapping needs to adequately reflect and project the relevant corporate environment,
an analytical approach needs to be able to describe multifold short- and long-term interrelating
effects among the various system constituents, and
a monitoring routine needs to trace down changing patterns over time, fueling an ever-learning
organisation with relevant information on how to adjust its decision-making approach.
2. CONCEPTUAL BASIS FOR SUDEST
SUDEST is a decision support tool based on the bio-cybernetics of applied system’s theory [7] [8] [9]
to support corporate decision-making within complex situations. Engineering decisions, for instance,
are dominated by hard facts such as technical details, machinery input/output quotas or defective statistics. However, hard facts are typically interwoven with soft facts such as motivation, skill sets, or
conflicts of interest. Therefore, support for sustainable decision-making needs to involve both, hard

Barnim G. Jeschke & Nils Mahnke
International Journal of Managerial Studies and Research (IJMSR) Page | 76
and soft facts – and their interrelations. Looking at complex situations as open systems, system
constituents and their interrelations need to be described by condensing the picture to its most relevant system constituents. Nevertheless, the description needs to be flexible enough to include a greater
variety of constituents, if necessary.
2.1. Forecasting and Backcasting
The SUDEST model output is based on simulating the implications of (initial and future) decision-
making in a dynamic environment. Researching the development of systems and deriving respective
indicators goes beyond ex-post analysis. Both aspects facilitate scrutiny of alternative future actions paths. Considering the dynamics of a complex environment, such forecasting needs to take place
within a certain confidence interval, accounting for underlying information deficits and uncertainties
over time. While such challenges are systemic in nature, they can be appreciated and optimized by a
continuous learning approach. However, forecasting in a complex environment bears the inherent risk that only a limited range of options are considered from the view of the present decider, projecting
today’s problems into the future without allowing creative sideways [10] [11].
While following different logics, the SUDEST model facilitates both, forecasting and reverse-forecasting, i.e. backcasting. In case of the latter, the postulated attainment of a desirable final
outcome represents the starting point for modeling, which will be the subject to a subsequent paper
and will not be dealt with here. For the algorithmic application of SUDEST, the difference between chronological forecasting and anti-chronological backcasting is not essential. A backcasting approach,
however, would deal with a potentially broader array of possible interrelations and wider system
boundaries.
2.2. Sustainable Decisions
“Sustainable” decisions shall refer to corporate action that supports the equilibrium of the respective
system. Further, “absolute” sustainable management can be distinguished from “relative” sustainable
management: While the former helps to stabilize a system (e.g. by introducing technologies that aid ecologically sound production processes), the latter still destabilizes the underlying system – but to a
lesser degree than prior business conduct. Sustainable management supports system’s resilience, i.e.
the tolerance towards disturbances. Hamel and Välikangas define resilience as “… a capacity for
continuous reconstruction. It requires innovation with respect to those organizational values, processes and behaviors that systematically favor perpetuation over innovation.” [12].Within
specified system boundaries, the capability to strive for system equilibrium is the criteria for
sustainable system functioning: Self-organizing systems strive to remain viable [13]. This analytical scope is the key assumption of the SUDEST framework.
2
3. SUDEST METHOD IN FIVE STEPS
The generic SUDEST method includes five steps of analysis. The first three steps are dedicated to a systematic system recording within the underlying system boundaries: What is the chronological
structure of the decision complex? What decisions involve which system constituents? And what are
the relevant relationships within the system? As a fourth step, the model interprets the situation with respect to alternative future action paths. The last step is subject to an ongoing alignment of
assumptions, accounting for developed system knowledge within a continuous learning process.
3.1. Chronological Structuring
For the SUDEST framework, each relevant interaction amongst stakeholders represents decisions
with a substantial impact on the underlying system. Instead of describing the constituents and their
interactions by continuous functions, SUDEST focuses on the discreetness of the employed data at
given points in time: System effects are scrutinized at defined decision moments (the moment when a decision is made and perceived) in order to break-down a complex, sequential decision complex. A
2At a meta level, however, abrupt or incremental environmental changes need to be appreciated by new system constellations, with a revised (sometimes revolutionized) understanding of equilibrium and adaptive cycles. To
describe the linked phenomena, the zoologist Holling introduces the term “panarchy” as “… a concept that
explains the evolving nature of complex adaptive systems. Panarchy is the hierarchical structure in which
systems of nature (…) and humans (…) as well as combined human-nature systems (…) are interlinked in
never-ending adaptive cycles of growth, accumulations, restructuring, and renewal.” [14].
Systematizing Corporate Decision-Making in a Complex World
International Journal of Managerial Studies and Research (IJMSR) Page | 77
cluster of decision moments within the defined system boundaries shall be called “decision phase”. Typically, the analyzed system encompasses different consecutive decision phases, constituting the
chronological order of the respective system’s development. For the forecasting simulation of future
scenarios, simulated results of a preceding decision phase will create the starting point for the directly
succeeding phase. Each starting point is described by a set of system constituent values, mathematically expressed in a state vector. In case of a backcasting approach, the simulation design is
reversed. By specifying the number of chronologically ordered times of decision moments within a
decision phase 𝑡0 , 𝑡1,… , 𝑡𝑘 , the time interval Δ𝑡𝑃 of the decision phase (Δ𝑡𝑃 ≔ 𝑡𝑘 − 𝑡0) can be
subdivided in a number ofdecision intervals, Δ𝑡1 = 𝑡1 − 𝑡0 ,… , Δ𝑡𝑘 = 𝑡𝑘 − 𝑡𝑘−1,which stand for the
elapsed times between consecutive decision moments.
The point in time at the end of each decision interval Δ𝑡𝑖 (1 ≤ 𝑖 ≤ 𝑘) is the moment, when the system
changes due to the preceding time interval, plus the decisions transferred at 𝑡𝑖 are transcribed into
amatrix 𝑀𝑖 (see next section 3.2),describing the influence levels and directions amongst all system
constituents at the decision moment 𝑡𝑖 . Therefore, all system changes occurring during the interval
Δ𝑡𝑖will be aggregated and combined with the decisions at 𝑡𝑖 .To specify the decision moments of a
decision phase, the necessary information is derived e.g. from expert interviews, workshops or already existing empirical data. Expert system descriptions can, for instance, be supported by the use of mind-
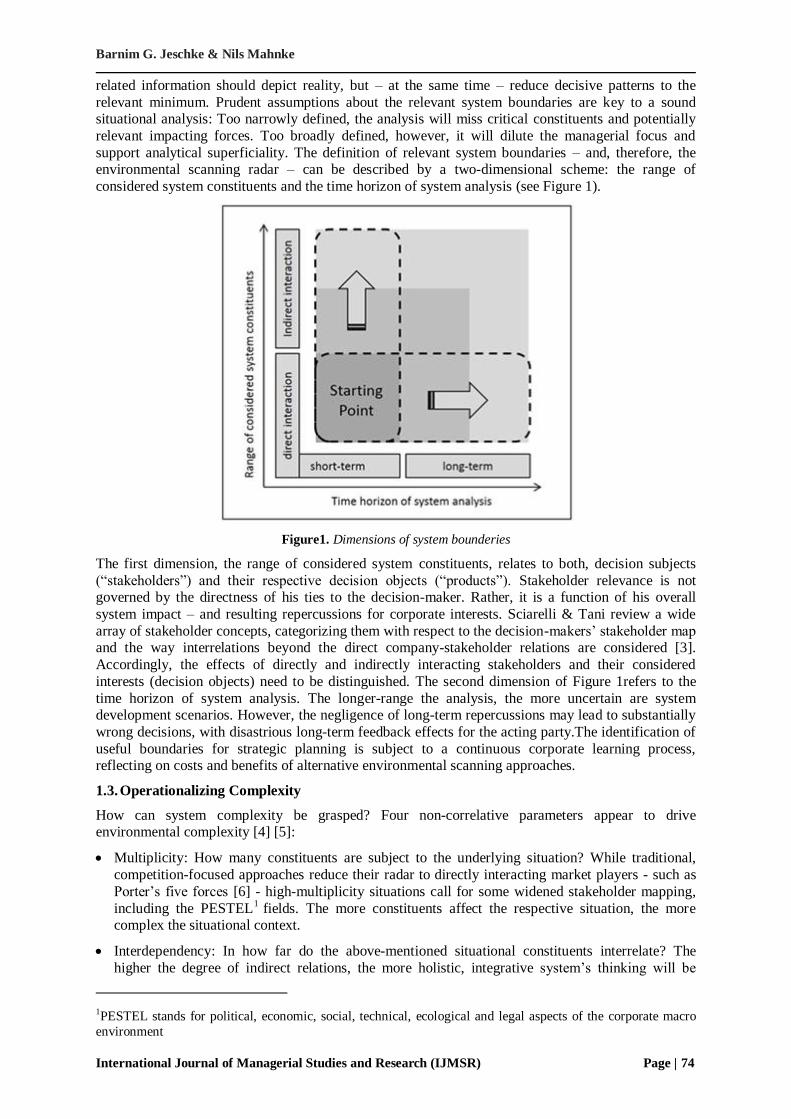
map diagrams. Such description can be provided as a state digraph with stakeholders and products as
its knots. The directed edges of the graph represent the direction and influence of product and information exchange. Still, the digraph needs to be synchronized into a time ordered digraph. Figure
3displays an example of turning a non-synchronized digraph into a synchronized one. The rectangles
with rounded corners are representing knots (stakeholders or products) with attached rectangles listing
the respective dwelling times (𝑑: days) after the reception of all input from preceding knots. The
initial and the final knot are both referring to 𝐾1.
Figure3. Turning non-synchronized state digraphs into synchronized ones
Due to the estimated dwelling times, representing “decision intervals” of individual stakeholders, a
state digraph can be synchronized into a time ordered graph based on standard time [15]. In
synchronized form, the digraph decays naturally into definite decision intervals between decision
moments of logical time ordering [16]. Next, the system states and changes due to the decision intervals will be mapped.
Barnim G. Jeschke & Nils Mahnke
International Journal of Managerial Studies and Research (IJMSR) Page | 78
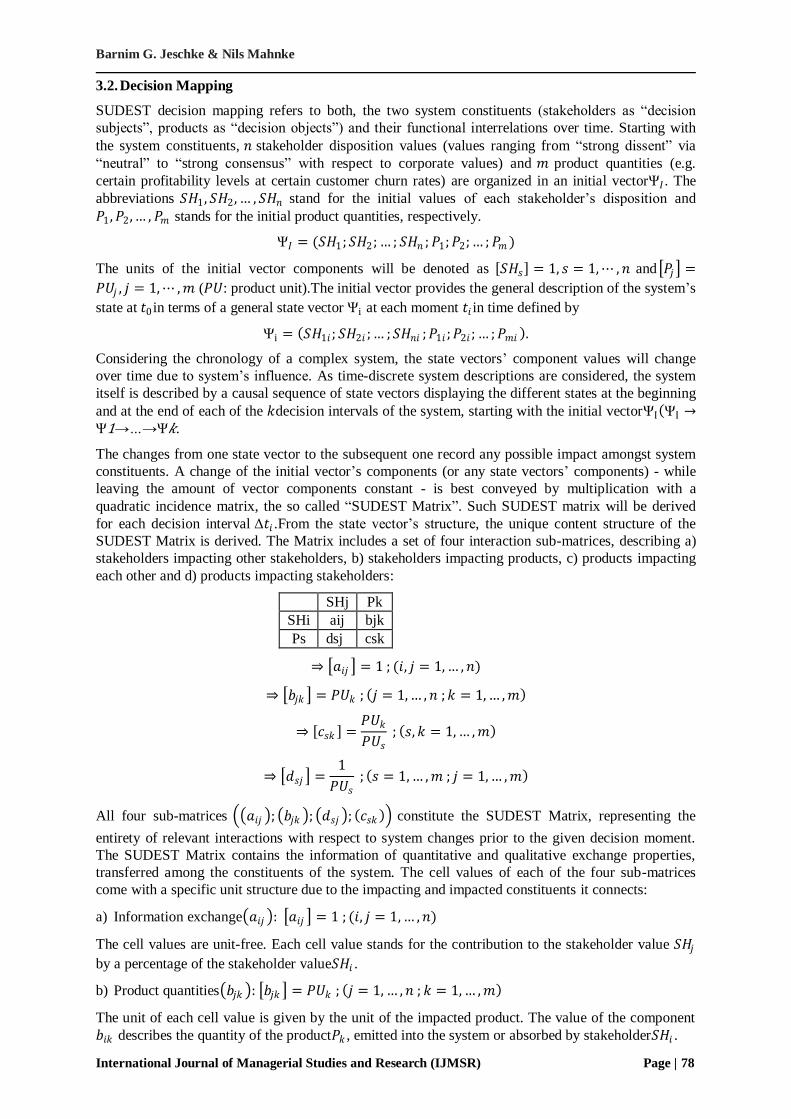
3.2. Decision Mapping
SUDEST decision mapping refers to both, the two system constituents (stakeholders as “decision
subjects”, products as “decision objects”) and their functional interrelations over time. Starting with
the system constituents, 𝑛 stakeholder disposition values (values ranging from “strong dissent” via
“neutral” to “strong consensus” with respect to corporate values) and 𝑚 product quantities (e.g.
certain profitability levels at certain customer churn rates) are organized in an initial vectorΨ𝐼 . The
abbreviations 𝑆𝐻1, 𝑆𝐻2,… , 𝑆𝐻𝑛 stand for the initial values of each stakeholder’s disposition and
𝑃1,𝑃2,… , 𝑃𝑚 stands for the initial product quantities, respectively.
Ψ𝐼 = (𝑆𝐻1 ;𝑆𝐻2 ;… ; 𝑆𝐻𝑛 ;𝑃1;𝑃2;… ;𝑃𝑚 )
The units of the initial vector components will be denoted as 𝑆𝐻𝑠 = 1, 𝑠 = 1,⋯ ,𝑛 and 𝑃𝑗 =
𝑃𝑈𝑗 , 𝑗 = 1,⋯ ,𝑚 (𝑃𝑈: product unit).The initial vector provides the general description of the system’s
state at 𝑡0in terms of a general state vector Ψi at each moment 𝑡𝑖 in time defined by
Ψi = 𝑆𝐻1𝑖 ; 𝑆𝐻2𝑖 ;… ;𝑆𝐻𝑛𝑖 ;𝑃1𝑖 ;𝑃2𝑖 ;… ;𝑃𝑚𝑖 .
Considering the chronology of a complex system, the state vectors’ component values will change
over time due to system’s influence. As time-discrete system descriptions are considered, the system
itself is described by a causal sequence of state vectors displaying the different states at the beginning
and at the end of each of the 𝑘decision intervals of the system, starting with the initial vectorΨI ΨI →Ψ1→…→Ψ𝑘.
The changes from one state vector to the subsequent one record any possible impact amongst system
constituents. A change of the initial vector’s components (or any state vectors’ components) - while
leaving the amount of vector components constant - is best conveyed by multiplication with a
quadratic incidence matrix, the so called “SUDEST Matrix”. Such SUDEST matrix will be derived
for each decision interval Δ𝑡𝑖 .From the state vector’s structure, the unique content structure of the
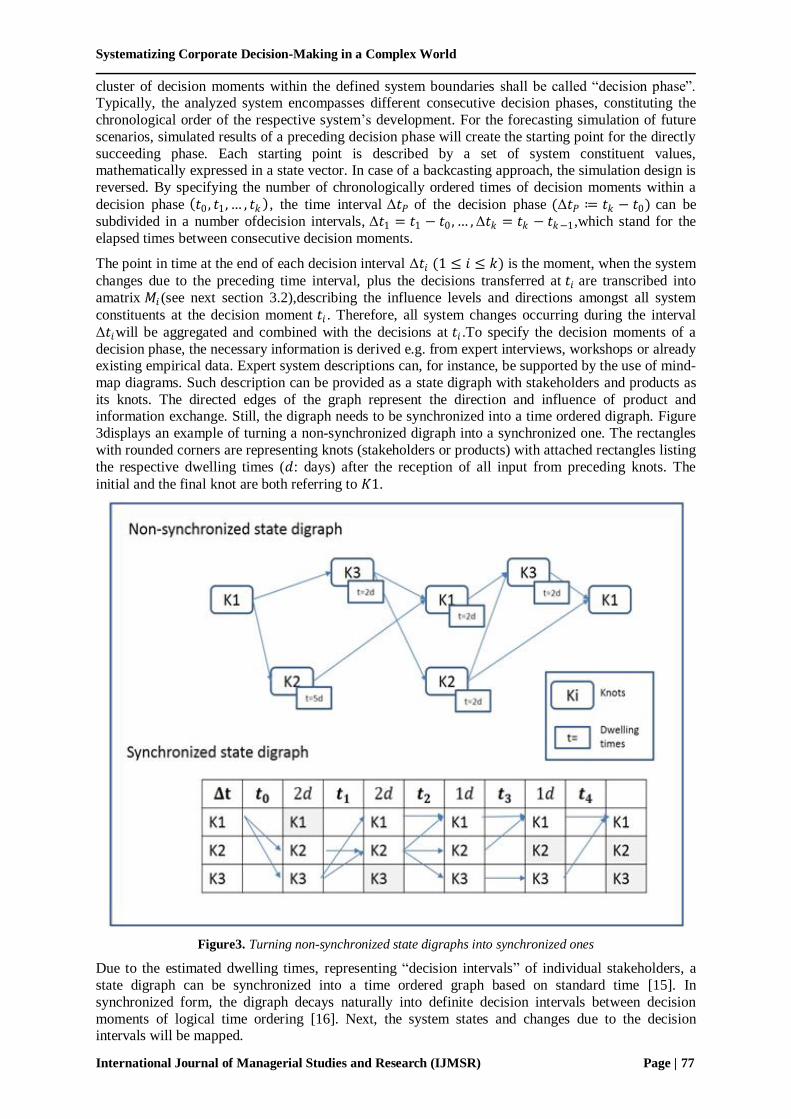
SUDEST Matrix is derived. The Matrix includes a set of four interaction sub-matrices, describing a)
stakeholders impacting other stakeholders, b) stakeholders impacting products, c) products impacting
each other and d) products impacting stakeholders:
SHj Pk
SHi aij bjk
Ps dsj csk
⇒ 𝑎𝑖𝑗 = 1 ; (𝑖, 𝑗 = 1,… ,𝑛)
⇒ 𝑏𝑗𝑘 = 𝑃𝑈𝑘 ; 𝑗 = 1,… ,𝑛 ;𝑘 = 1,… ,𝑚
⇒ 𝑐𝑠𝑘 =𝑃𝑈𝑘
𝑃𝑈𝑠 ; 𝑠,𝑘 = 1,… ,𝑚
⇒ 𝑑𝑠𝑗 =1
𝑃𝑈𝑠 ; 𝑠 = 1,… ,𝑚 ; 𝑗 = 1,… ,𝑚
All four sub-matrices 𝑎𝑖𝑗 ; 𝑏𝑗𝑘 ; 𝑑𝑠𝑗 ; 𝑐𝑠𝑘 constitute the SUDEST Matrix, representing the
entirety of relevant interactions with respect to system changes prior to the given decision moment.
The SUDEST Matrix contains the information of quantitative and qualitative exchange properties,
transferred among the constituents of the system. The cell values of each of the four sub-matrices
come with a specific unit structure due to the impacting and impacted constituents it connects:
a) Information exchange 𝑎𝑖𝑗 : 𝑎𝑖𝑗 = 1 ; (𝑖, 𝑗 = 1,… ,𝑛)
The cell values are unit-free. Each cell value stands for the contribution to the stakeholder value 𝑆𝐻𝑗
by a percentage of the stakeholder value𝑆𝐻𝑖 .
b) Product quantities 𝑏𝑗𝑘 : 𝑏𝑗𝑘 = 𝑃𝑈𝑘 ; 𝑗 = 1, … ,𝑛 ; 𝑘 = 1,… ,𝑚
The unit of each cell value is given by the unit of the impacted product. The value of the component
𝑏𝑖𝑘 describes the quantity of the product𝑃𝑘 , emitted into the system or absorbed by stakeholder𝑆𝐻𝑖 .
Systematizing Corporate Decision-Making in a Complex World
International Journal of Managerial Studies and Research (IJMSR) Page | 79
c) Product interaction 𝑐𝑠𝑘 : 𝑐𝑠𝑘 =𝑃𝑈𝑘
𝑃𝑈𝑠 ; 𝑠,𝑘 = 1,… ,𝑚
The unit of each cell value is given by the quotient of the impacted divided by the unit of the impacting product. The value then contains the quantity of impacted product per unit of impacting
product produced for the duration of the system’s effect.
d) Product effects 𝑑𝑠𝑗 : 𝑑𝑠𝑗 =1
𝑃𝑈𝑠 ; 𝑠 = 1,… ,𝑚 ; 𝑗 = 1,… ,𝑚
The unit of each cell value is given by the quotient of the unit of the impacted divided by the unit of
the impacting product. Thus, the given quantity of product 𝑃𝑠 influences the decision of stakeholder
𝑆𝐻𝑗 .Each final moment of a decision interval therefore comprises a single state of the system, while
system changes are summarized mathematically in the interval-related SUDEST Matrices. Sub
matrix 𝑎𝑖𝑗 defines the decision moments 𝑡0, 𝑡1 ,… , 𝑡𝑘 , 𝑎𝑖𝑗 , called the “Decision Moment
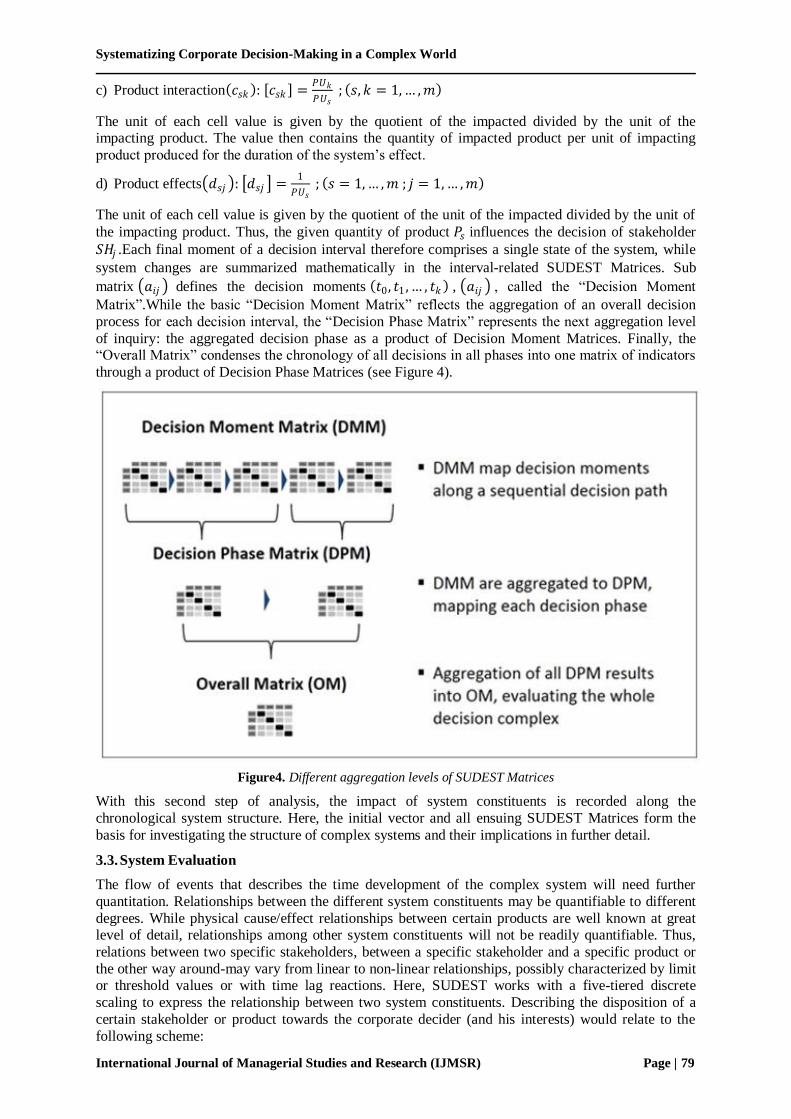
Matrix”.While the basic “Decision Moment Matrix” reflects the aggregation of an overall decision
process for each decision interval, the “Decision Phase Matrix” represents the next aggregation level
of inquiry: the aggregated decision phase as a product of Decision Moment Matrices. Finally, the “Overall Matrix” condenses the chronology of all decisions in all phases into one matrix of indicators
through a product of Decision Phase Matrices (see Figure 4).
Figure4. Different aggregation levels of SUDEST Matrices
With this second step of analysis, the impact of system constituents is recorded along the
chronological system structure. Here, the initial vector and all ensuing SUDEST Matrices form the
basis for investigating the structure of complex systems and their implications in further detail.
3.3. System Evaluation
The flow of events that describes the time development of the complex system will need further
quantitation. Relationships between the different system constituents may be quantifiable to different
degrees. While physical cause/effect relationships between certain products are well known at great level of detail, relationships among other system constituents will not be readily quantifiable. Thus,
relations between two specific stakeholders, between a specific stakeholder and a specific product or
the other way around-may vary from linear to non-linear relationships, possibly characterized by limit or threshold values or with time lag reactions. Here, SUDEST works with a five-tiered discrete
scaling to express the relationship between two system constituents. Describing the disposition of a
certain stakeholder or product towards the corporate decider (and his interests) would relate to the
following scheme:

Barnim G. Jeschke & Nils Mahnke
International Journal of Managerial Studies and Research (IJMSR) Page | 80
++ Strong consent with corporate interests / causing strong increase in product quantity
+ Rather consent with corporate interests / causing some increase in product quantity
O Neutral towards corporate interests / causing no impact on product quantity
- Rather dissent with corporate interests / causing some decrease in product quantity
- - Strong dissent with corporate interests / causing strong decrease in product quantity
For computation, the symbols are translated into numerical values to express the different degrees of
impact on the respective system constituents. It may be sufficient to perceive the nominal values as an
augmenting relation by using, for instance, the following correlations:
++ + 0 - - -
1,5 1,25 1 0,75 0,5
Stakeholder dispositions may, of course, change over time – under the impact of preceding decision
moments: Past decision-making is impacting consecutive stakeholder dispositions. The same is true
for functional relationships among system constituents. SUDEST accounts for such possible changes by allowing revised input for each decision moment. Again, with more differentiating data being
available, a more differentiated scaling, e.g. continuous numerical scaling can be employed. Here, the
focus is on time-discrete system descriptions. We will refer to a mathematical representation, like the
one described, as an innervation of the system dynamics given by the state vectors, over time. This innervation is representing the basis for SUDEST as a decision support tool.
Decision support tools mean to improve the information basis for decision-making, i.e. the choice
amongst two or more action alternatives. Such action alternatives may either be clearly defined (e.g. alternative marketing approaches for customer retention management) or rather diffuse (e.g. “the best
way of keeping existing customers happy”). In the latter case, the preceding two SUDEST analysis
steps are useful to systematically explore the scope of action (e.g. what are causal chains in describing
customer migration patterns) that is conceivable for corporate management. Without defined action alternatives, of course, there is nothing to decide. Therefore, the corporate decider needs to respond to
the following set of questions:
At which point within the chronologically structured system boundaries is the corporate decider
requested to take action? Or, translated into SUDEST terminology: Which decision phase and which specific decision moments are subject to inquiry?
What are the fields of action in which the corporate decider is inclined to impact the underlying
system? Or, translated into SUDEST terminology: What stakeholder or product relationships are
(potentially) subject to corporate management as an “impacting stakeholder”?
What are the details of the researched action scenarios? What does such corporate action imply?
Or, translated into SUDEST terminology: What independent variables are meant to impact the
consent/dissent profiles of the targeted stakeholder as well as the product quantities that are
impacted by such stakeholder actions?
After the analysis of the first three SUDEST steps, the model is now ready for the actual simulation. Possible simulation approaches are a) variation of initial values (assumed initial situation), b)
variation of SUDEST Matrix entries at specific decision moments (assumed decision impacts) and c)
variation of decision intervals (assumed time reaction patterns).
3.4. Model Outcomes
The simulation of the innervated system focuses on different decision outcomes for different decision
scenarios. For a given decision phase, this happens by rewriting the respective state digraph into the corresponding product of chronologically ordered SUDEST Matrices, one for each decision moment.
Let 𝑛 be the number of stakeholders, 𝑚 be the number of involved products and 𝑘 be the number of
decision moments, then each SUDEST Matrix, 𝑀1 ,… ,𝑀𝑘 , is given by
𝑀𝑖 ∈ 𝑀 𝑛 + 𝑚 × 𝑛 + 𝑚 ; ℝ , 𝑖 = 1,… ,𝑘.
Together with the initial vector Ψ𝐼 ≔ 𝑆𝐻1 ;𝑆𝐻2 ;… ; 𝑆𝐻𝑛 ;𝑃1;𝑃2;… ;𝑃𝑚 the product

Systematizing Corporate Decision-Making in a Complex World
International Journal of Managerial Studies and Research (IJMSR) Page | 81
Ψ𝐼 ⋅ 𝑀1 ⋅ … ⋅ 𝑀𝑘
describes the evolution of initial values with respect to the decision phase. The innervation of the
decision phase is described by the product 𝑀1 ⋅ … ⋅ 𝑀𝑘 . A matrix cascade contains all possible
chronological sequences of subsequent matrix products. Naming each decision matrix𝑀𝑖 , 𝑖 = 1,… ,𝑘
and abbreviating each of the matrix products by
𝑀𝑖;𝑗 ≔ 𝑀𝑖 ⋅ 𝑀𝑖+1 ⋅ … ⋅ 𝑀𝑗−1 ⋅ 𝑀𝑗 (𝑖 < 𝑗, 1 ≤ 𝑖, 𝑗 ≤ 𝑘), the matrix cascade is given as follows:
𝑀𝑘
𝑀𝑘−1 𝑀𝑘−1;𝑘
⋮ ⋮ ⋮𝑀3 ⋯ 𝑀3;𝑘−1 𝑀3;𝑘
𝑀2 𝑀2;3 ⋯ 𝑀2;𝑘−1 𝑀2;𝑘
𝑀1 𝑀1;2 𝑀1;3 ⋯ 𝑀1;𝑘−1 𝑀1;𝑘
Each row of the cascade, starting with the SUDEST matrix 𝑀𝑖 𝑖 = 1, … ,𝑘 to its very left, stands for
the development of the accumulated decision moments beginning at the 𝑖-th moment.Each column
(read from top to bottom), beginning with the SUDEST Matrix 𝑀𝑗 𝑗 = 1,… ,𝑘 at its top, represents
the accumulated decisions until the 𝑗-th decisionmoment.The matrix 𝑀1;𝑘 in the lower right corner
represents the Decision Phase Matrix, describing all developments which take place during the
respective decision phase. Applying the cascade to the initial state vector facilitates sensitivity testing.
WithΨ𝑗 ≔ Ψ𝐼 ⋅ 𝑀1 ⋅ 𝑀2 ⋅ … ⋅ 𝑀𝑗−1 ⋅ 𝑀𝑗 ( 1 ≤ 𝑗 ≤ 𝑘), the cascade applied to the initial state vector is
given by:
𝑀𝑘
𝑀𝑘−1 𝑀𝑘−1;𝑘
⋮ ⋮ ⋮𝑀3 ⋯ 𝑀3;𝑘−1 𝑀3;𝑘
𝑀2 𝑀2;3 ⋯ 𝑀2;𝑘−1 𝑀2;𝑘
𝑀1 𝑀1;2 𝑀1;3 ⋯ 𝑀1;𝑘−1 𝑀1;𝑘
Ψ𝐼 Ψ1 Ψ2 Ψ3 ⋯ Ψ𝑘−1 Ψ𝑘
The cascade’s bottom row now contains all chronological ordered changes in the components of the
initial state vector and, therefore, represents the resulting impact development of the described system
components due to the sequence of state vectors, Ψ𝐼 , Ψ1, Ψ2,… , Ψ𝑘 . The connected matrix cascade is
therefore the basis for future sensitivity evaluation of a decision phase. The matrix cascade opens the
field of simulation for alternative action paths, resilience and sensitivity tests. The overall simulation outcome and related system sensitivity can be comprised by formulating a system specific index
number 𝐼𝑆 . To calculate such a number, the contravariant vector Ψ𝑘 of the cascade is contracted with
the covariant vector
Ψ𝐼𝑇 ≔ 𝑆𝐻1 , 𝑆𝐻2 ,… , 𝑆𝐻𝑛 ,𝑃1,… ,𝑃𝑚 𝑇.
To gain a unit-free index, the scalar-product of the contraction will be mediated by the following
diagonal contraction tensor
𝑇 = 𝑡11 ⋯ 0⋮ ⋱ ⋮0 ⋯ 𝑡𝑘𝑘
,
with 𝑡𝑖𝑖 = 1 (𝑖 = 1,… ,𝑛) , 𝑡𝑗𝑗 = 𝑃𝑈(𝑗 − 𝑛) −2(𝑗 = 𝑛 + 1,… ,𝑛 + 𝑚 = 𝑘) .The index number 𝐼𝑆
assigned to the described system is, therefore, given by:
𝐼𝑆 = Ψ𝑘 ⋅ 𝑇 ⋅ Ψ𝐼𝑇 = Ψ𝐼 ⋅ 𝑀1;𝑘 ⋅ 𝑇 ⋅ Ψ𝐼
𝑇 = Ψ𝐼 ⋅ 𝑀1 ⋅ … ⋅ 𝑀𝑘 ⋅ 𝑇 ⋅ Ψ𝐼𝑇
The provided analytical methods define the structuring of the results. With fixed values of the initial
vector, the chronologically ordered changes in the components represent the resulting impact
development of the described system constituents. This gives rise to a sequence of state vectors,
representing the system dynamics Ψ𝐼 , Ψ1, Ψ2,… , Ψ𝑘 . Considering the stakeholder and product values
in normalized form

Barnim G. Jeschke & Nils Mahnke
International Journal of Managerial Studies and Research (IJMSR) Page | 82
Ψ𝐼
Ψ𝐼 ,
Ψ1
Ψ1 ,
Ψ2
Ψ2 ,… ,
Ψ𝑘
Ψ𝑘
elucidates which state vector component is the most influential for the given decision moment. The
step of normalization becomes necessary, as the absolute value development is exponential. Changing
the initial vector values individually leads to changes in the sequence
Ψ𝐼
Ψ𝐼 ,
Ψ1
Ψ1 ,
Ψ2
Ψ2 ,… ,
Ψ𝑘
Ψ𝑘
These changes represent the influence level of each considered value. This way, the changes show the impact of a system constituent as well as the magnitude of influence over time, i.e. the number of
subsequent future decision moments in which the influence from the initial change can be observed. A
change in 𝐼𝑆 due to changes in the initial vector or any of the SUDEST Matrices can measure the
overall sensitivity of the system. Changing the values in each of the state vectors Ψ𝑗 , 𝑗 = 1,… ,𝑘with
respect to one component of the vectors, e.g. variation of a stakeholder’s disposition, will measure the
constituent’s impact on the overall index at each decision moment. Comparing the index number 𝐼𝑆
with its value 𝐼𝑆𝑗 when the 𝑗-th SUDEST matrix is eliminated from the innervation, meaning 𝐼𝑆𝑗 =
Ψ𝐼 ⋅ 𝑀1 ⋅ …𝑀𝑗−1 ⋅ 𝑀𝑗+1 ⋅ 𝑀𝑘 ⋅ 𝑇 ⋅ Ψ𝐼𝑇
will determine its relative contribution to the index. This change
in 𝐼𝑆 can be interpreted as the decision moments’ impact on the system.The analysis results in a set of
indicators, establishing a comprehensive information basis for the respective decision. This includes the development of consent/dissent profiles of involved stakeholders, the development of related
product quantities, sensitivities of alternative action paths and resilience levels for the derived
scenarios. A variation in component values of the initial vector can affect later decisions and the index
number 𝐼𝑆 . It will, therefore, expose the most impactful stakeholder or product at the beginning of the
system’s development tracking and overall.
3.5. Continuous Learning
Continuous learning is facilitated by systematically updating and completing the knowledge base for profound decision-making. In case of lacking quantitative data, the input of qualitative data will
suffice. To comprehend environmental dynamics requires continuous monitoring of relevant context
drivers, i.e. system constituents and their interrelations. The employment of a decision support tool, therefore, asks for some continuous organizational learning approach, both in psychological and
administrative terms. Psychologically, new and unexpected information should not be coined as a
disturbing nuisance but as important stimulus to comprehend system dynamics. Administratively,
reporting systems and corporate planning need to incorporate the information requirements for such a tool.
SUDEST is based on a comprehensive situation analysis that goes beyond the sheer competitive
environment. Environmental scanning and stakeholder monitoring is not a one-off challenge but a continuous process; as such, ongoing learning processes are warranted, providing more profound
decision bases at lower levels of uncertainty. In this the SUDEST description reflects a mode in an
unknown Markow like jump system, with time discrete values. Even though SUDEST is often compared to a Markow linear jump system it isn’t, because SUDEST focuses on the nonlinear
development of the system based on the time discrete mapping of an expert’s knowledge about it.
From a multi-perspective view, SUDEST will support managers’ and other stakeholders’
understanding of system interrelations and corresponding time patterns. As a further result, future scenarios can be anticipated with higher degrees of confidence and corporate planning can make
better use of employed resources by considering system sensitivities. Finally, an ongoing matching of
actually occurring effects against targeted ones will produce a steady information stream that serves the optimization of SUDEST data input.
4. SUDEST APPLICATION EXAMPLE
The application example refers to the management of a gravel pit. At least in industrialized countries,
new gravel pit projects are invariably subject to prohibitive resistance by public stakeholders such as
neighborhood or ecological interest groups. As a result, an increasing share of new exploration projects are either significantly delayed or completely prevented. Here, the objective of analysis is to
manifest the innervation of the complex system, appreciating the influence of numerous stakeholders
and products on the overall outcome (the feasibility of such project). This includes the identification
Systematizing Corporate Decision-Making in a Complex World
International Journal of Managerial Studies and Research (IJMSR) Page | 83
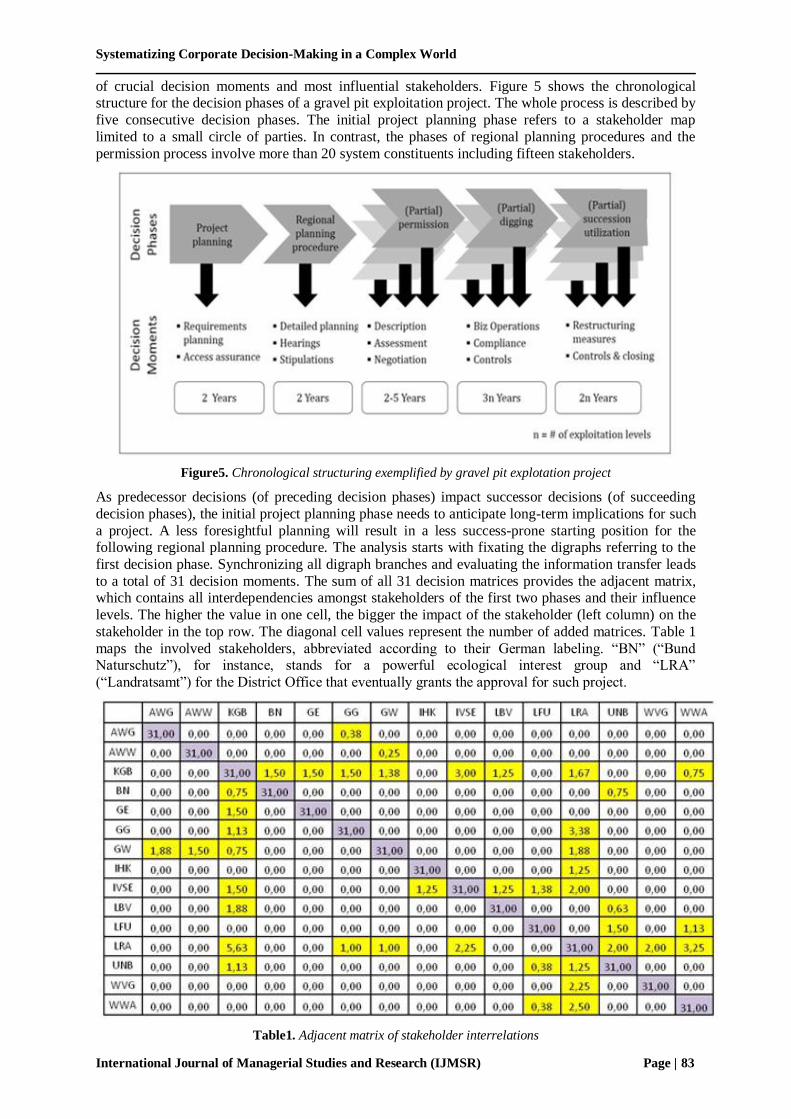
of crucial decision moments and most influential stakeholders. Figure 5 shows the chronological structure for the decision phases of a gravel pit exploitation project. The whole process is described by
five consecutive decision phases. The initial project planning phase refers to a stakeholder map
limited to a small circle of parties. In contrast, the phases of regional planning procedures and the
permission process involve more than 20 system constituents including fifteen stakeholders.
Figure5. Chronological structuring exemplified by gravel pit explotation project
As predecessor decisions (of preceding decision phases) impact successor decisions (of succeeding
decision phases), the initial project planning phase needs to anticipate long-term implications for such
a project. A less foresightful planning will result in a less success-prone starting position for the following regional planning procedure. The analysis starts with fixating the digraphs referring to the
first decision phase. Synchronizing all digraph branches and evaluating the information transfer leads
to a total of 31 decision moments. The sum of all 31 decision matrices provides the adjacent matrix, which contains all interdependencies amongst stakeholders of the first two phases and their influence
levels. The higher the value in one cell, the bigger the impact of the stakeholder (left column) on the
stakeholder in the top row. The diagonal cell values represent the number of added matrices. Table 1
maps the involved stakeholders, abbreviated according to their German labeling. “BN” (“Bund Naturschutz”), for instance, stands for a powerful ecological interest group and “LRA”
(“Landratsamt”) for the District Office that eventually grants the approval for such project.
Table1. Adjacent matrix of stakeholder interrelations
Barnim G. Jeschke & Nils Mahnke
International Journal of Managerial Studies and Research (IJMSR) Page | 84
The shaded cells indicate the actual cross-impacts. Here, the highest influence level can be found with
the stakeholder LRA influencing the stakeholder KGB (“Kiesgrubenbetreiber” – gravel pit operator). The stakeholder IHK (“Industrie- und Handelskammer” – Chamber of Commerce and Industry) is
only influencing stakeholder LRA, while the stakeholder IHK is only influenced by the stakeholder
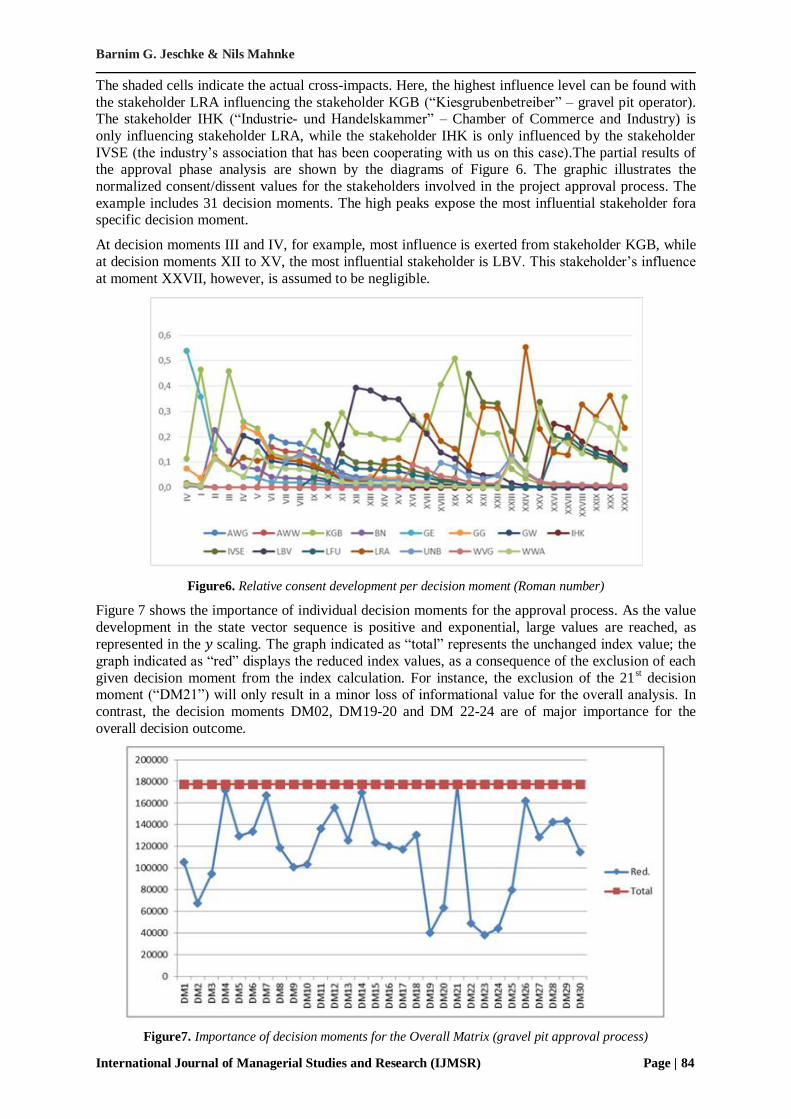
IVSE (the industry’s association that has been cooperating with us on this case).The partial results of the approval phase analysis are shown by the diagrams of Figure 6. The graphic illustrates the
normalized consent/dissent values for the stakeholders involved in the project approval process. The
example includes 31 decision moments. The high peaks expose the most influential stakeholder fora specific decision moment.
At decision moments III and IV, for example, most influence is exerted from stakeholder KGB, while
at decision moments XII to XV, the most influential stakeholder is LBV. This stakeholder’s influence
at moment XXVII, however, is assumed to be negligible.
Figure6. Relative consent development per decision moment (Roman number)
Figure 7 shows the importance of individual decision moments for the approval process. As the value
development in the state vector sequence is positive and exponential, large values are reached, as
represented in the 𝑦 scaling. The graph indicated as “total” represents the unchanged index value; the
graph indicated as “red” displays the reduced index values, as a consequence of the exclusion of each
given decision moment from the index calculation. For instance, the exclusion of the 21st decision
moment (“DM21”) will only result in a minor loss of informational value for the overall analysis. In
contrast, the decision moments DM02, DM19-20 and DM 22-24 are of major importance for the
overall decision outcome.
Figure7. Importance of decision moments for the Overall Matrix (gravel pit approval process)
Systematizing Corporate Decision-Making in a Complex World
International Journal of Managerial Studies and Research (IJMSR) Page | 85
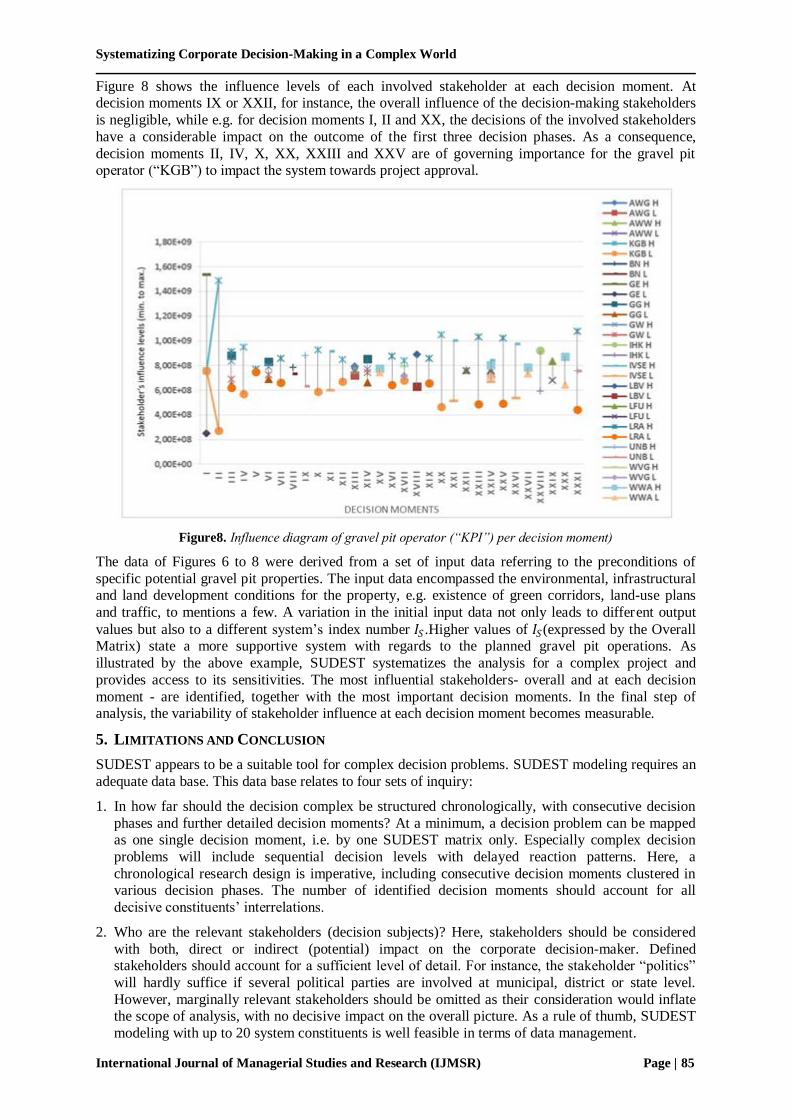
Figure 8 shows the influence levels of each involved stakeholder at each decision moment. At decision moments IX or XXII, for instance, the overall influence of the decision-making stakeholders
is negligible, while e.g. for decision moments I, II and XX, the decisions of the involved stakeholders
have a considerable impact on the outcome of the first three decision phases. As a consequence,
decision moments II, IV, X, XX, XXIII and XXV are of governing importance for the gravel pit operator (“KGB”) to impact the system towards project approval.
Figure8. Influence diagram of gravel pit operator (“KPI”) per decision moment)
The data of Figures 6 to 8 were derived from a set of input data referring to the preconditions of
specific potential gravel pit properties. The input data encompassed the environmental, infrastructural and land development conditions for the property, e.g. existence of green corridors, land-use plans
and traffic, to mentions a few. A variation in the initial input data not only leads to different output
values but also to a different system’s index number 𝐼𝑆 .Higher values of 𝐼𝑆(expressed by the Overall Matrix) state a more supportive system with regards to the planned gravel pit operations. As
illustrated by the above example, SUDEST systematizes the analysis for a complex project and
provides access to its sensitivities. The most influential stakeholders- overall and at each decision
moment - are identified, together with the most important decision moments. In the final step of analysis, the variability of stakeholder influence at each decision moment becomes measurable.
5. LIMITATIONS AND CONCLUSION
SUDEST appears to be a suitable tool for complex decision problems. SUDEST modeling requires an
adequate data base. This data base relates to four sets of inquiry:
1. In how far should the decision complex be structured chronologically, with consecutive decision
phases and further detailed decision moments? At a minimum, a decision problem can be mapped as one single decision moment, i.e. by one SUDEST matrix only. Especially complex decision
problems will include sequential decision levels with delayed reaction patterns. Here, a
chronological research design is imperative, including consecutive decision moments clustered in various decision phases. The number of identified decision moments should account for all
decisive constituents’ interrelations.
2. Who are the relevant stakeholders (decision subjects)? Here, stakeholders should be considered
with both, direct or indirect (potential) impact on the corporate decision-maker. Defined stakeholders should account for a sufficient level of detail. For instance, the stakeholder “politics”
will hardly suffice if several political parties are involved at municipal, district or state level.
However, marginally relevant stakeholders should be omitted as their consideration would inflate the scope of analysis, with no decisive impact on the overall picture. As a rule of thumb, SUDEST
modeling with up to 20 system constituents is well feasible in terms of data management.

Barnim G. Jeschke & Nils Mahnke
International Journal of Managerial Studies and Research (IJMSR) Page | 86
3. What are the relevant products (decision objects) involved? Products are system-relevant resources
subject to stakeholders’ interests and dispositions and, therefore, to system’s existence. Their occurrence may either be expressed by readily quantifiable hard facts (e.g. corporate revenues,
investment volume, ongoing costs, or municipal taxes) or more intangible soft facts (e.g. brand
equity or level of resulting bio-diversity). For the latter case, a five-step nominal scaling approach was introduced – which has proved as a valid way to approach reality.
4. What are the interrelations among the system constituents for each decision moment? Here, again,
the interrelations may be based on hard data, facilitating detailed functional relationships (algorithms). Alternatively, less known relationships can be expressed by the introduced five-step
nominal scaling approach – and may become more quantifiable along a monitoring learning path.
SUDEST accounts for both principal approaches, including all possible functional relationships
within one matrix model.
Generally, the issue of data validity needs to be raised. Estimating stakeholder dispositions and
evaluating relationships is a rather subjective matter, with many pitfalls for misperceptions. Similar to
reality, misperceptions will lead to sub-optimal decisions – but via feedback and related learning effects, perceptions will gradually become more realistic. Applied data generation methods depend on
the respective relationships and information basis. In situations with a long track record, historical
research will suffice. In less transparent situations, expert interviews, focus group analysis or multi-lateral workshops may be needed. Such data generation efforts are, of course, not just required to feed
SUDEST – but to illuminate a controversial situation in order to provide an adequate decision basis
for corporate management. Especially when expert knowledge is used as information source, chances
are that such individual assessments deliver a biased mapping of reality - and biased data feed would result into a biased decision base. Here, ongoing validation with reality is the prerequisite for the
optimization of the tool’s explanatory power.
6. DISCUSSION
Beer introduces five essential system functions to warrant system viability [17]. The SUDEST method
maps each of these functions:
1. Implementation: The primary system activities at the core of a recursive model are expressed by the identified system products and its inter connections.
2. Co-ordination: The coordination among system sub-units and interfaces to the outside are depicted
by the cross impact logic of the SUDEST matrix.
3. Control: Assumptions need to be scrutinized over time, misjudgments need to be identified,
analyzed and evaluated with respect to future estimates.
4. Intelligence: Continuous, systematic feedback schemes warrant an ever-improving knowledge on
the nature of the underlying system and an anticipatory perception of system changes.
5. Policy: The specification of desirable system developments (in case of a forecasting approach) or
of a desirable outcome (in case of a backcasting approach) draws on a corporate value system,
representing the underlying policy of the respective decision maker.
SUDEST is a method to structure and systematize complex decision-making. As such, it offers
considerable support for the pro-active decision-maker. Spotting potential resistance is an anticipatory way of risk management. According to the SUDEST modeling steps, this requires a pluralistic view
on the existing and evolving situation, an understanding of existing and evolving interrelations and
impact mechanisms and, therefore, about sensitivities and most efficient ways to support system stability. Most importantly, however, SUDEST use should lead to a continuous monitoring routine
that goes beyond environmental scanning efforts: This way, assumptions can be scrutinized and, if
necessary, adapted. And it will keep decision makers from bad surprises, as evidenced by a growing number of exposed projects such as international sports event (e.g. public vote against Winter
Olympic games in Southern Germany), infrastructure projects (e.g. public vote against Munich airport
expansion), or consumables’ design that does not comply with health or societal standards.
Sometimes, the matter is about proper and timely two-way communications. Other cases will require action and a change of present corporate conduct. For still other cases, however, SUDEST will
indicate that stakeholder dissent is prohibitive and projects should be re-considered or stopped. The
used example of gravel pit exploitation evidences these options: Some sites are suitable in a way that
Systematizing Corporate Decision-Making in a Complex World
International Journal of Managerial Studies and Research (IJMSR) Page | 87
they can align not just with economical but also with social and ecological interests. Other gravel pit sites will request some reviewed set-up in order to gain a sufficient level of stakeholder acceptance.
Turning an exploited site (with its steep faces and its resting water expanse) into a natural habitat
would exemplify such a re-design option. A good portion of site options, however, will turn out to be
unfeasible due to the dissent potential developing throughout the different decision phases.
Feigenbaum defines an expert system as follows: “An 'expert system' is an intelligent computer program that uses knowledge and inference procedures to solve problems that are difficult enough to
require significant human expertise for their solution. The knowledge necessary to perform at such alevel, plus the inference procedures used, can be thought of as a model of the expertise of the best
practitioners in that field.”[18].In comparison to other expert systems, like iModeler
(www.consideo.de), SUDEST is not bound into the adjacent matrix view of a complex system.
Instead, SUDEST is dealing with information on the chronology of data plus providing access to the relations given in the adjacent matrix. As a generic tool, SUDEST is not bound to any specific
environments or systems as - for example - the expert system MYCIN [19], which focuses on the
diagnoses and therapies of bacterial infections. However, SUDEST is not a fully automated software tool yet. The input data depends on the corporate state of knowledge concerning the underlying
situation. Here, knowledge generation would, of course, not only serve the purpose of feeding
SUDEST – but become an essential step for anticipatory decision-making in general.
REFERENCES
[1] Freeman, R.E. (1984): Strategic Management. A Stakeholder Approach, Boston.
[2] Henderson, B. D. (1977): Business Thinking, The Boston Consulting Group, Reprint No. 203, 1-
3.
[3] Sciarelli, M., Tani, M. (2013). Network Approach and Stakeholder Management. Business
Systems Review, Vol. 2, Issue 2, 2013, 175-190.
[4] Jeschke, B., Mahnke, N. (2013): An innovative Approach to sustainable Decision-Making in Complex Environments, in: Business Systems Review, Vol. 2, Issue 3, July - December 2013,
97-99.
[5] Sargut, G., McGarth, R.G. (2011): Learning to live with complexity, Harvard Business Review
September 2011, 24-25.
[6] Porter, M. E. (2008): The Five Competitive Forces that Shape Strategy", Harvard Business
Review, January 2008, 86-104.
[7] Wiener, N. (1948): Cybernetics, New York.
[8] Ashby, W.R. (1965): An introduction to Cybernetics, London.
[9] Forrester, J.W. (1971): World Dynamics, Cambridge.
[10] Holmberg, J., Robèrt, K.H. (2000): Backcasting from non-overlapping sustainability principles: a
framework for strategic planning. International Journal of Sustainable Development and World
Ecology, Vol. 74, 291–308.
[11] Wilson, C.,Tansey, J. / LeRoy, S. (2006): Integrating Backcasting & Decision Analytic Approaches to Policy Formulation: A Conceptual Framework, The Integrated Assessment
Journal, Vol. 6, Issue 4, 143–164.
[12] Hamel, G., Välikangas, L (2003): The Quest for Resilience, Harvard Business Review,
September 2003, Reprint R0309C, 1-13.
[13] Beer, S. (1985): Diagnosing the System for Organizations, Chichester.
[14] Holling, C. S. (2001): Understanding the Complexity of Economic, Ecological, and Social
Systems, Ecosystems 2001/4: 392.
[15] Bethem, J.v. (1991): The Logic of Time, Dordrecht.
[16] Lamport, L. (1978): Time, Clocks and the Ordering of Events in a distributed System,
Communications of the ACM, 21 (7): 558-565.
[17] Beer, S. (1985): Diagnosing the System for Organizations, Chichester.
[18] Feigenbaum, E. (1980): Expert Systems in the 1980s, in: Bond, A. (Hrsg.), State of the Art
Report on Machine Intelligence, Oxford 1980: 2.
[19] Puppe, F. (1990): Methods of Problem Solving in Expert Systems, Berlin 1990.

Barnim G. Jeschke & Nils Mahnke
International Journal of Managerial Studies and Research (IJMSR) Page | 88
AUTHORS’ BIOGRAPHY
Prof. Dr. Barnim G. Jeschke, Many years of experience as senior manager; > 10
years of entrepreneurial activities in green technologies; founder/managing director
of VC company and independent utility company; Professor for Sustainable Management at FOMUniversity of Applied Sciences,Munich; research focus:
complex decision support and sustainable management.
Prof. Dr. Nils Mahnke, Professor for Applied Mathematics at FOM University of Applied Sciences, Munich; research on various topics of theoretical physics; model
development for symbiotic eco systems; research focus: modeling of system
complexity; management coach.