Systematic Structural Optimization of a Next Generation ...
122
Systematic Structural Optimization of a Next Generation Lunar Rover Chassis by Ryan Alexander Pitre A thesis submitted to the Graduate Program in Mechanical & Materials Engineering in conformity with the requirements for the Degree of Master of Science Queen’s University Kingston, Ontario, Canada September, 2015 Copyright © Ryan Alexander Pitre, 2015
Transcript of Systematic Structural Optimization of a Next Generation ...

Systematic Structural Optimization of a Next Generation Lunar Rover
Chassis
by
Ryan Alexander Pitre
A thesis submitted to the Graduate Program in
Mechanical & Materials Engineering
in conformity with the requirements for
the Degree of Master of Science
Queen’s University
Kingston, Ontario, Canada
September, 2015
Copyright © Ryan Alexander Pitre, 2015
R. Pitre, Systematic Structural Optimization of a Next Generation Lunar Rover Chassis i
Abstract
This research utilized topology and size optimization to optimize a lunar rover chassis in order to
reduce structural mass while satisfying the required surface and launch vehicle loading criterion.
Renewed interest in lunar exploration has provided an opportunity for Canada to participate in a Lunar
Prospecting Mission in collaboration with NASA. Queen’s University, in collaboration with Neptec Design
Group, has developed methodology to produce the structural design of a next generation lunar rover
chassis using systematic design optimization techniques to minimize the structural mass of the chassis.
Typical lightweight design can be achieved using lightweight materials, advanced manufacturing
processes or systems, and design optimization. Due to the unique requirements for spacecraft, the
proposed research is limited to specific materials and processes, therefore weight reduction is achieved
exclusively through design optimization.
The structural design was completed using a three stage design approach: Conceptual, Preliminary,
and Detailed Design Stages. The Conceptual Design Stage developed chassis designs considering
component layout and bounding box topology. The generated concepts were evaluated qualitatively to
select the best candidates for design optimization. The Preliminary Design Stage utilized Hyperworks©
Optistruct commercial software to complete topology optimization to optimize the chassis bounding box
topology while considering lunar surface and launch vehicle loading. The topology optimization results
were then used to create preliminary optimum designs. In the detailed design stage, size optimization
with Optistruct was used to refine the preliminary design further to produce a final optimum design which
had characterized mass and structural performance. All optimization work was constrained to satisfy
displacement, stress, and natural frequency constraints.
The final optimum design reduced the weight of the chassis by 38.7% when compared to the
baseline design while satisfying all required loading scenarios. By current valuation, this mass reduction
can be valued at approximately $24 million dollars [2] from the current cost per kg of transporting payload
on the lunar surface. This research has shown that new methods can achieve substantial weight
reductions in the structural design of spacecraft. Mass reduction of the magnitude found in this research
stands to have significant benefits to the development of future space exploration programs.

R. Pitre, Systematic Structural Optimization of a Next Generation Lunar Rover Chassis ii
Acknowledgements
I would like to thank my supervisor Dr. Il-Yong Kim for providing me with great opportunities and for
his immense contributions to my personal developments. His guidance, teachings, and encouragement
have allowed me to develop greatly as an individual and as an engineer far more than I could have asked
for.
To the students, current and past, in the Structural and Multidisciplinary Systems Design Group,
thank you for your support and patience in helping me achieve my goals. In particular, to Dr. Chao Li and
(soon to be Dr.) Bradley Taylor; thank you for being a sounding board for my ideas and for providing great
suggestions all along the way.
Thank you to my family who provided love, motivation, and encouragement through the highs and
lows of this graduate degree program. Thank you as well to my friends for all of the fun times over these
last couple years.
I would also like to thank the staff and professors at Queen’s University for their support over the past
few years. In particular, thank you to Gabrielle Whan who has gone above and beyond the call of duty
countless times.
To all members, past and future, of the Queen’s Advanced Sounding Rocket Design team, thank you
for your interest and your hard work in participating in what I hope will continue to be a tradition of
excellence at Queen’s University. Words cannot express the pride that I felt after successfully launching
the University’s first ever rocket on our first attempt.
Finally, thank you to Neptec Design Group for providing an exciting research project that has inspired
me to do even greater things with my career. I would like to personally thank Brad Jones, Nick Cristello,
and Dr. Michele Faragalli for your incredible contributions to this project. Your time and expertise are
greatly appreciated and have had a profound impact on my personal and professional development.

R. Pitre, Systematic Structural Optimization of a Next Generation Lunar Rover Chassis iii
Contents
1.0 Chapter 1: Introduction .................................................................................................................. 1 1.1 Motivation for Research ............................................................................................................ 1 1.2 Objectives of Research ............................................................................................................. 2
2.0 Chapter 2: Background and Literature Review ............................................................................. 4 2.1 Examples of Modern Rover Design .......................................................................................... 4 2.2 Introduction to Design Optimization ........................................................................................ 10 2.3 Introduction to Topology Optimization..................................................................................... 11 2.4 Finite Element Analysis of Lunar Rovers ................................................................................ 13 2.5 Design Optimization of Lunar Rovers ..................................................................................... 14 2.6 Analysis and Optimization of Satellite Structures ................................................................... 15
3.0 Chapter 3: Chassis Definition and Design Process Definition .................................................... 19 3.1 Chassis Definition.................................................................................................................... 19 3.2 Design Process ....................................................................................................................... 22
4.0 Chapter 4: Conceptual Design Stage ......................................................................................... 24 4.1 Concept Creation Philosophy .................................................................................................. 25 4.2 Concept Development and Evaluation .................................................................................... 30
4.2.1 Concept #1 ...................................................................................................................... 30 4.2.2 Concept #2 ...................................................................................................................... 34 4.2.3 Concept #3 ...................................................................................................................... 37 4.2.4 Concept #4 ...................................................................................................................... 41 4.2.5 Concept #5 ...................................................................................................................... 44
4.3 Conceptual Design Grading .................................................................................................... 48 4.4 Concept Selection ................................................................................................................... 58
5.0 Chapter 5: Preliminary Design Stage .......................................................................................... 59 5.1 Preliminary Design Stage Philosophy ..................................................................................... 62 5.2 Topology Optimization ............................................................................................................ 64 5.3 Preliminary Design Creation ................................................................................................... 77
6.0 Chapter 6: Detailed Design Stage .............................................................................................. 88 6.1 Detailed Design Stage Philosophy .......................................................................................... 88 6.2 Size Optimization .................................................................................................................... 90 6.3 Detailed Design Creation ........................................................................................................ 97
7.0 Chapter 7: Final Design Performance ....................................................................................... 101 8.0 Chapter 8: Discussions and Conclusions ................................................................................. 104 9.0 References ................................................................................................................................ 107 10.0 Appendix ............................................................................................................................... 111
10.1 Modern Rover Images ....................................................................................................... 111 10.2 High Resolution Model Image ........................................................................................... 114

R. Pitre, Systematic Structural Optimization of a Next Generation Lunar Rover Chassis iv
List of Figures
Figure 1 - Design Optimization Visualization [22] ................................................................................ 10 Figure 2 - 2D Topology Optimization Problem a) Problem Definition and b) Optimum Topology ....... 12 Figure 3 – Artemis Jr. Lunar Rover Key Components Definition [31] .................................................. 19 Figure 4 - Proposed Structural Design Process ................................................................................... 22 Figure 5 - Concept #1 (a) Front Isometric View and (b) Rear Isometric View ..................................... 30 Figure 6 - Concept #1 (a) Deployed Solar Panels and (b) Exposed Radiators ................................... 31 Figure 7 - Concept #1 Chassis Isometric and Top, Front, and Right Side Principal Views ................. 31 Figure 8 - Concept #1 Component Layout Isometric and Top, Front, and Right Side Principal Views33 Figure 9 - Concept #1 Mast Design Isometric and Top, Front, and Right Side Principal Views.......... 33 Figure 10 - Concept #2 (a) Front Isometric View and (b) Rear Isometric View ................................... 34 Figure 11 - Concept #2 Chassis (a) Top View and (b) Rear Isometric View with Hidden Solar Panels
and Radiators .................................................................................................................... 34 Figure 12 - Concept #2 Chassis Isometric and Top, Front, and Right Side Principal Views ............... 35 Figure 13 - Concept #2 Component Layout Isometric and Top, Front, and Right Side Principal Views
........................................................................................................................................... 36 Figure 14 - Concept #2 Mast Design Isometric and Top, Front, and Right Side Principal Views ........ 37 Figure 15 - Concept #3 (a) Front Isometric View and (b) Rear Isometric View ................................... 37 Figure 16 - Concept #3 (a) Top view of Curved Chassis and (b) Front and Side Views of Concept #3
showing full 1m2 of active solar panel ............................................................................... 38 Figure 17 - Concept #3 Chassis Isometric and Top, Front, and Right Side Principal Views ............... 38 Figure 18 - Concept #3 Component Layout Isometric and Top, Front, and Right Side Principal Views
........................................................................................................................................... 40 Figure 19 - Concept #3 Mast Design Isometric and Top, Front, and Right Side Principal Views ........ 40 Figure 20 - Concept #4 (a) Front Isometric View and (b) Rear Isometric View ................................... 41 Figure 21 - Concept #4 (a) Stowed Radiators and (b) Side View of Components under RESOLVE .. 41 Figure 22 - Concept #4 Chassis Isometric and Top, Front, and Right Side Principal Views ............... 42 Figure 23 - Concept #4 Component Layout Isometric and Top, Front, and Right Side Principal Views
........................................................................................................................................... 43 Figure 24 - Concept #4 Mast Design Isometric and Top, Front, and Right Side Principal Views ........ 44 Figure 25 - Concept #5 (a) Front Isometric View and (b) Rear Isometric View ................................... 44 Figure 26 - Concept #5 (a) Three sides covered by 1m2 Solar Panels and (b) Thin (<50mm)
components underneath the RESOLVE Payload ............................................................. 45 Figure 27 - Concept #5 Chassis Isometric and Top, Front, and Right Side Principal Views ............... 45 Figure 28 - Concept #5 Component Layout Isometric and Top, Front, and Right Side Principal Views
........................................................................................................................................... 47 Figure 29 - Concept #5 Mast Design Isometric and Top, Front, and Right Side Principal Views ........ 47 Figure 30 - Quantitative Design Analysis Chart Scoring for Configurability of Exposed Surface Area 51 Figure 31 - Quantitative Design Analysis Chart Scoring for Potential Chassis Stiffness ..................... 52 Figure 32 - Quantitative Design Analysis Chart Scoring for Potential Chassis Weight ....................... 52 Figure 33 - Quantitative Design Analysis Chart Scoring for Lunar Night Survivability ........................ 53 Figure 34 - Quantitative Design Analysis Chart Scoring for Potential, Relative Design Simplicity ...... 53 Figure 35 - Quantitative Design Analysis Chart Scoring for Static Stability ......................................... 54 Figure 36 - Quantitative Design Analysis Chart Scoring for Manufacturability of Chassis .................. 54 Figure 37 - Quantitative Design Analysis Chart Scoring for Internal Volume Efficiency ...................... 55 Figure 38 - Quantitative Design Analysis Chart Scoring for Mast Simplicity and Rigidity ................... 55 Figure 39 - Final Concept Grading Results .......................................................................................... 58 Figure 40 - (Left) Previous Suspension Style Using Passive Differential and (Right) New Suspension
System Using Rear Yoke .................................................................................................. 59 Figure 41 - (Left) Initial Battery Geometry Definition and (Right) Revised Battery Geometry Definition
........................................................................................................................................... 60 Figure 42 - New Concept #1 Chassis .................................................................................................. 60 Figure 43 - Revised Concept #1 Component Layout ........................................................................... 61 Figure 44 - New Concept #4 Chassis .................................................................................................. 61 Figure 45 - Revised Concept #4 Component Layout ........................................................................... 62

R. Pitre, Systematic Structural Optimization of a Next Generation Lunar Rover Chassis v
Figure 46 - Software Package Interaction for Preliminary and Detailed Design Stages ..................... 63 Figure 47 - Coordinate System for Topology Optimization .................................................................. 64 Figure 48 - Skid Steering Load Case Diagram .................................................................................... 67 Figure 49 - Obstacle Interaction Load Case Diagram .......................................................................... 68 Figure 50 - Drilling Operation Load Case Diagram .............................................................................. 69 Figure 51 - Inertial Loading Load Case Diagram ................................................................................. 70 Figure 52 - Concept #1 (Left) Bending Mode (Mode #24) and (Right) Torsion Mode (Mode #12) ..... 70 Figure 53 - Concept #4 (Left) Bending Mode (Mode #16) and (Right) Torsion Mode (Mode #20) ..... 71 Figure 54 - Shaft Modeling in Optistruct using 1D Beam elements ..................................................... 72 Figure 55 - Component Modeling in Optistruct using RBE2 and RBE3 Elements .............................. 72 Figure 56 - Chassis Panel Non-Design Space for Riveting Between Panels ...................................... 73 Figure 57 - Freeze Contact Definition between Mast and Chassis ...................................................... 73 Figure 58 - Boundary Condition Definition for Shaft Connections for Surface Loading Conditions .... 74 Figure 59 - Hold-Down-Release System Boundary Condition Modeling ............................................. 75 Figure 60 - Displacement Constraint Locations for (Left) Concept #1 and (Right) Concept #4 .......... 75 Figure 61 - Concept #1 Meshed Geometry .......................................................................................... 76 Figure 62 - Concept #4 Meshed Geometry .......................................................................................... 77 Figure 63 - Concept #1 Chassis Preliminary Design with Varying Opacity of Body Panels ................ 78 Figure 64 - Concept #4 Chassis Preliminary Design with Varying Opacity of Body Panels ................ 79 Figure 65 - (Left) Concept #1 and (Right) Concept #4 Meshed Preliminary Design Chassis ............. 80 Figure 66 - Stress Concentration at Hold-Down-Release Bolt Hole in Concept #1 ............................. 82 Figure 67 - Concept #1 Stress Contour for Inertial Loading in Z-Direction .......................................... 82 Figure 68 - Concept #4 Stress Contour for Inertial Loading in Z-Direction .......................................... 83 Figure 69 - Concept #4 Displacement Contour for Inertial Loading in Z-Direction .............................. 83 Figure 70 - Concept #1 (Left) Torsion Natural Frequency Mode and (Right) Bending Natural
Frequency Mode ................................................................................................................ 84 Figure 71 - Concept #4 (Left) Torsion Natural Frequency Mode and (Right) Bending Natural
Frequency Mode ................................................................................................................ 85 Figure 72 - Coordinate System for Size Optimization .......................................................................... 91 Figure 73 - Concept #1 (Left) Bending Mode (Mode #27) and (Right) Torsion Mode (Mode #8)........ 93 Figure 74 - Concept #1 (Left) Bending Mode (Mode #30) and (Right) Torsion Mode (Mode #19) ..... 93 Figure 75 - Displacement Constraint Locations for (Left) Concept #1 and (Right) Concept #4 .......... 94 Figure 76 – Stress Singularity Elements (Highlighted in Grey) that are omitted from Stress
Constraints ........................................................................................................................ 94 Figure 77 - Concept #1 Meshed Geometry .......................................................................................... 95 Figure 78 - Concept #4 Meshed Geometry .......................................................................................... 95 Figure 79 - Concept #1 Chassis Detailed Design with Varying Opacity of Body Panels ..................... 98 Figure 80 - Concept #4 Chassis Preliminary Design with Varying Opacity of Body Panels ................ 99 Figure 81 - Concept #1 Stress Contour for Inertial Loading in Z-Direction ........................................ 102 Figure 82 - Concept #4 Stress Contour for Inertial Loading in Z-Direction ........................................ 102 Figure 83 - Concept #4 Displacement Contour for Inertial Loading in Z-Direction ............................ 103 Figure 84 - Image of the Chang'e 3 Lunar Rover Model (Left) [15] and Photo of the Rover during field
test [3] .............................................................................................................................. 111 Figure 85 - Chang'e 3 Rover and Mother Craft at Zhuhai Air Show in 2009 [16] .............................. 111 Figure 86 - Chandrayaan-2 Lunar Rover Prototype (Left) and Rover Dimensions (Right) [19] ......... 112 Figure 87 - Mobile Payload Element Front and Rear Views in Deployed Configuration [11] ............ 112 Figure 88 - NASA MAX-C Rover (Artist's Rendition) [13] .................................................................. 112 Figure 89 - Mars Reconnaissance Lander vehicle configuration (a) stowed in entry aeroshell of
maximum diameter 3.7 m (b) initial landing engine module attached and landing gear extended (c) surface hop configuration with landing propulsion jettisoned [4] ............... 113
Figure 90 - AMALIA Rover Concept Drawing [5] ............................................................................... 113 Figure 91 - Solar Rover II during testing [7] ....................................................................................... 113 Figure 92 – High Resolution Image of the Topology Optimization Model (Top) and Zoomed Section
(Bottom) ........................................................................................................................... 114

R. Pitre, Systematic Structural Optimization of a Next Generation Lunar Rover Chassis vi
List of Tables
Table 1 - Rover characteristics summary (grey boxes indicate no information available) ..................... 9 Table 2 - Components Contained in Lunar Rover Chassis ................................................................. 24 Table 3 - Concept #1 Un-Optimized Structure Volume, Percent of Internal Volume as Components,
and Centre of Gravity ........................................................................................................... 32 Table 4 - Concept #2 Un-Optimized Structure Volume, Percent of Internal Volume as Components,
and Centre of Gravity ........................................................................................................... 35 Table 5 - Concept #3 Un-Optimized Structure Volume, Percent of Internal Volume as Components,
and Centre of Gravity ........................................................................................................... 39 Table 6 - Concept #4 Un-Optimized Structure Volume, Percent of Internal Volume as Components,
and Centre of Gravity ........................................................................................................... 42 Table 7 - Concept #5 Un-Optimized Structure Volume, Percent of Internal Volume as Components,
and Centre of Gravity ........................................................................................................... 46 Table 8 - Quantitative Evaluation of Design Concepts ........................................................................ 50 Table 9 - Qualitative Discussions and Design Concepts ..................................................................... 57 Table 10 - Units Used in Topology Optimization Models in Optistruct ................................................. 71 Table 11 - Mass Summary for Preliminary Designs ............................................................................. 86 Table 12 - Preliminary Design Structural Performance Summary ....................................................... 81 Table 13 - Preliminary Design Modal Analysis Summary .................................................................... 84 Table 14 – Concept #1 Size Optimization Panel Thickness Results ................................................... 96 Table 15 – Concept #4 Size Optimization Panel Thickness Results ................................................... 97 Table 16 - Mass Summary for Detailed Designs ................................................................................. 99 Table 17 - Detailed Design Structural Performance Summary .......................................................... 101 Table 18 - Detailed Design Modal Analysis Summary ....................................................................... 103
R. Pitre, Systematic Structural Optimization of a Next Generation Lunar Rover Chassis vii
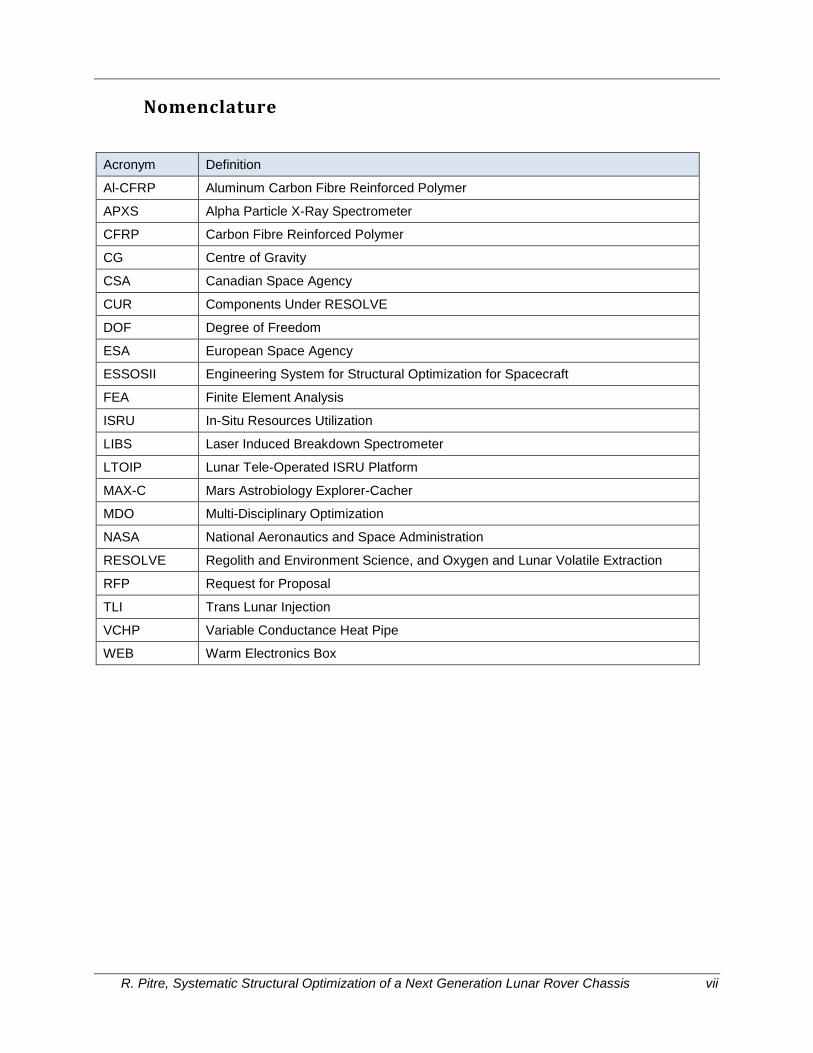
Nomenclature
Acronym Definition
Al-CFRP Aluminum Carbon Fibre Reinforced Polymer
APXS Alpha Particle X-Ray Spectrometer
CFRP Carbon Fibre Reinforced Polymer
CG Centre of Gravity
CSA Canadian Space Agency
CUR Components Under RESOLVE
DOF Degree of Freedom
ESA European Space Agency
ESSOSII Engineering System for Structural Optimization for Spacecraft
FEA Finite Element Analysis
ISRU In-Situ Resources Utilization
LIBS Laser Induced Breakdown Spectrometer
LTOIP Lunar Tele-Operated ISRU Platform
MAX-C Mars Astrobiology Explorer-Cacher
MDO Multi-Disciplinary Optimization
NASA National Aeronautics and Space Administration
RESOLVE Regolith and Environment Science, and Oxygen and Lunar Volatile Extraction
RFP Request for Proposal
TLI Trans Lunar Injection
VCHP Variable Conductance Heat Pipe
WEB Warm Electronics Box

R. Pitre, Systematic Structural Optimization of a Next Generation Lunar Rover Chassis 1
1.0 Chapter 1: Introduction
Renewed interest in lunar exploration has provided an opportunity for Canada to participate in a
Lunar Prospecting Mission in collaboration with NASA. Queen’s University, in collaboration with Neptec
Design Group, has developed methodology to produce an optimum structural design of a lunar rover
chassis. The proposed methodology aims to reduce the weight of the chassis using systematic
optimization techniques that ensure high performance, low mass structural designs.
1.1 Motivation for Research
The proposed program requires the development of a solar-powered lunar roving vehicle to explore
in-situ resource utilization (ISRU) [1]. A lunar roving vehicle is bound by the same challenges as any
spacecraft in that it operates in an extremely hostile environment where there are no opportunities for
repairs or maintenance once the vehicle has left the Earth’s surface. This constraint requires the
spacecraft to be robust with minimal modes and probabilities of failure. In order to achieve such low
probability the spacecraft must be thoroughly designed and tested which results in significant
development and production costs. Astrobotic, a corporation attempting to win the Google Lunar X prize,
has estimated that the cost of landing 1 kg on the lunar surface starts at 1.2 million dollars, and delivering
that same 1 kg to a specific location near the landing site would cost at least 2 million dollars even when
discounting integration fees [2]. High cost limits the number of missions that can be funded and
completed, which in turn increases the demand for spacecraft to carry as much scientific equipment as
possible to gather as much data as possible in a short timeframe.
Spacecraft have traditionally been designed conservatively due to the high risk environment. In
addition, the methodology of spacecraft engineering often leaves the structures to be designed around a
particular configuration, which allocates little time for structural design to be completed. This combination
has produced basic chassis designs in the past which can be seen in some of the examples shown in
Section 2.1 . The structural mass of planetary roving vehicles has traditionally been large, evidenced by
the most recent lunar roving mission, Chang’e 3, which had only 16.7% of its mass as payload [3].
Therefore reducing structural mass has a proportionally significant effect on the total mass of the rover.

R. Pitre, Systematic Structural Optimization of a Next Generation Lunar Rover Chassis 2
Reducing structural mass enables more mass allocation to useful subsystems such as scientific payload,
thermal control, or crew capacity.
Typical lightweight design can be achieved using lightweight materials, advanced manufacturing
processes or systems, and design optimization. Due to the unique requirements for spacecraft, the
proposed research is limited to specific materials and processes, and therefore weight reduction is
achieved exclusively through design optimization. Structural design optimization takes advantage of the
principle that the performance of a structural design can be related to a function of its design parameters,
such as beam thickness or location of a beam. By mathematically solving an optimization problem to
achieve the best possible design space to achieve the required performance, significant mass savings
can be realized.
Structural mass minimization is clearly beneficial to the feasibility of missions in addition to
increasing to potential scientific merit of missions. For these reasons, it is worthwhile to invest more effort
into intelligent design of structural systems, in particular the chassis of a lunar roving vehicle which is the
majority of the structural mass.
1.2 Objectives of Research
The objective of this research was simple yet the realization of this goal is complex. Simply put, the
objective of this research was to develop the structural design of a lunar rover chassis which is
mathematically optimized to be lightweight. In order to achieve this goal a new methodology was required
from the traditional “build, test, and repeat as necessary” method. Therefore, the objectives are
summarized as follows:
1. Demonstrate the effectiveness of the design optimization methodology in producing robust,
lightweight structural designs of a lunar rover chassis
2. Complete systematic optimization of the structural design considering required loading criterion
3. Produce multiple robust, lightweight, and low cost manufacturing chassis designs
4. Perform trade-off studies of final optimum designs to converge on a final optimum design
recommendation
R. Pitre, Systematic Structural Optimization of a Next Generation Lunar Rover Chassis 3
The proposed methodology is summarized in Section 3.2 . At the time of this research, there were
no documented examples of structural design optimization of a lunar roving vehicle. Therefore this
research aimed to revolutionize the design process of lunar roving vehicles in order to reduce
unnecessary structural mass in future vehicle design.

R. Pitre, Systematic Structural Optimization of a Next Generation Lunar Rover Chassis 4
2.0 Chapter 2: Background and Literature Review
The literature review completed for this research aimed to identify design features and design
methodology of modern planetary rovers and determine what level of design optimization and analysis
was present in modern design. Here “modern” is defined as within the past 10 years while “planetary
rover” is defined as any vehicle designed to explore the surface of another planetary body. It is important
to consider the environment in which the vehicles are intended to operate when observing the design
features chosen in response to the operational environment. The most important result from this literature
review was that no research was found documenting component level structural optimization of a
planetary vehicle. Therefore, this research is likely the first attempt at systematic structural optimization of
a lunar rover chassis. The purpose of the rover study is to investigate rover design strategies in order to
provide insight to the concept development process of a lunar roving vehicle. Automotive and aerospace
design optimization was not included in this case study as the methodology for optimization was
predefined and the design strategies for these industries to not completely address the needs of a
planetary vehicle in the context of a robust space-faring vehicle.
2.1 Examples of Modern Rover Design
A systematic review was completed to study examples of modern rovers in order to extract
meaningful design strategies, assess the quality and merit of these strategies, and consolidate this
information into an accessible format. The selection of planetary vehicles for this research was limited to
vehicles not already studied by Neptec Design Group. Qualitatively, the results from the study of the
chosen subset of rovers were representative of the results of Neptec Design Group’s studies. The
purpose of this systematic review was not to merely identify other rovers, but to learn from their design
strategies to maximize the potential of design optimization. The most important design features
considered are listed in no particular order: lightweight design strategies, thermal control systems and
technology, environmental protection strategies, chassis geometry, and solar panel installation design
features. Each modern rover studied in this report was judged in each category to identify interesting
design strategies.
R. Pitre, Systematic Structural Optimization of a Next Generation Lunar Rover Chassis 5
Following a systematic review, seven modern rovers were identified with having interesting design
strategies in at least one of the previously listed design feature categories. These rovers are listed as
follows (in no particular order): Chang’e 3, Chandrayaan-II, Mobile Payload Element, NASA MAX-C, Mars
Reconnaissance Lander, AMALIA Rover, and NASA Solar Rover II. Fourteen articles are referenced for
the analysis of these seven lunar rovers [4] [5] [6] [7] [8] [9] [10] [11] [12] [13] [14] [15] [16].
The Chang’e 3 was the most recently launched lunar rover as it landed on the lunar surface in
December 2013 [17]. The Chang’e 3 was the first rover designed by the Chinese National Space
Administration and was the final stage of the China Lunar Exploration Program. The rover has a six-
wheeled rocker bogie suspension with a similar configuration to the Mars Exploration Rovers, although
with a simpler chassis geometry. The rover was approximately 1.5 m tall and weighs 120 kg total with 20
kg of scientific payload [3]. Each wheel had its own motor, with the front and rear wheels having individual
steering motors. Optimization of the mobility system was planned according to the 2008 conference paper
of the mobility analysis [12]. The mission planning was for 90 days, with the rover only operating during
the lunar day; during the lunar night the rover would enter hibernation. The rover was solar powered;
however a Pu238 reactor was used for heat generation [16]. The rover experienced a critical control
circuit malfunction, preventing closure of its solar panels during the lunar night, however the rover
continued to operate at a minimal capacity and was still responsive as of March, 2015 [17].
The Chandrayaan-2 is a small, 15 kg rover designed by the Indian Space Research Organisation
[18]. The rover was designed to be small with only two instruments on board: an alpha particle X-ray
spectrometer (APXS) and a Laser Induced Breakdown Spectrometer (LIBS). The rover uses the same
six-wheel rocker-bogie configuration as the Chang’e 3 rover, with each wheel having its own electric
motor and the front and rear wheels each having an independent steering motor.
The Mobile Payload Element was another small lunar rover developed by the ESA (European Space
Agency). This rover was the submitted proposal for a German contribution to the ESA Lunar Lander
Mission, which would be looking to land in the south polar region of the moon [11]. The rover was
designed to acquire regolith samples and return them to a lander, similar to the proposed mission Canada
may participate in. The rover had a total mass budget of 12 kg, with 1.939 kg of scientific payload, and

R. Pitre, Systematic Structural Optimization of a Next Generation Lunar Rover Chassis 6
thus required many lightweight design techniques to achieve such a low mass. The concept was a four-
wheeled chassis with active suspension. During the lifetime, there would be dark periods of up to 60
hours, which would require the rover to survive temperatures down to -180 ˚C during the lunar night and
up to +40 ˚C during the lunar day. To survive the 60 hours of darkness, the rover would require an active
thermal control system with passive insulation. The required thermal control system would add 5 kg of
mass if the rover were to survive a lunar night, which would place the rover at 14 kg which is 2kg over the
mass budget. The rover was designed to be solar powered, requiring 25 W, and due to the low elevation
of the Sun, the panels were located on the sides of the rover. The chassis structure was a single central
body with an aluminum base plate and Al-CFRP (Aluminum Carbon Fibre Reinforced Composite)
honeycomb side panels. The internal structure such as the WEB (warm electronics box) was used as load
bearing structure. The chassis size was driven by the avionic box, required solar panel area, and the
mole sampler. For added weight reduction, only the front two wheels were steerable, thus the rover
utilizes both Ackermann and “fork-lift” steering modes. Despite the weight reduction techniques, the rover
was unable to meet the mass budget. The study team did not recommend further mass reduction as the
trade-offs of reliability and performance were too severe.
The NASA MAX-C rover is an acronym for “Mars Astrobiology Explorer-Cacher”. The MAX-C would
arrive on Mars alongside the ExoMars rover, though the ExoMars rover was originally planned for an
earlier launch and thus the MAX-C was relatively far behind in design maturity [13]. The rover was
designed for a 500 sol (Martian days equal to ~514 Earth days) operation time over a distance of at least
20 km. The rover would have a six wheeled rocker-bogie chassis similar to the MSL Curiosity rover [13].
The proposed rover would weigh about 340 kg with a 1.7 m mast and 1.6 m wheel base. The total
scientific payload is estimated at 62 kg.
The Mars Reconnaissance Lander is a relatively large rover with a unique method of movement. The
rover is effectively a lander capable of in-situ CO2 collection to allow for refueling for short flights of
approximately 1 km per flight [14]. The rover weight with full propellant was estimated at 426 kg, with 16.5
kg scientific payload. The vehicle diameter was 4 m with the legs deployed.

R. Pitre, Systematic Structural Optimization of a Next Generation Lunar Rover Chassis 7
The AMALIA rover is designed by Team Italia for the Google Lunar X Prize Challenge [5]. The
competition requires a mission duration of only 14 days, though bonus prizes are available for teams that
survive the lunar night. The rover had a mass budget of 30 kg, of which 4 kg is structure and 1.2 kg is
thermal control. A passive thermal control system was selected to minimize required power and mass.
The rover structure was a trussed design made of mostly CFRP (carbon fiber reinforced polymer).
However, the main panel and WEB bottom panel were made of CFRP honeycomb and aluminium alloy
honeycomb, respectively. At the time of the report the total mass of the rover was 30.9 kg, exceeding the
mass budget of 30 kg, and it was acknowledged that changes would be required to meet the mass
budget requirements.
The Solar Rover II was a Master’s student thesis from the University of Oklahoma. The Micro Lunar
Rover was another Master’s student thesis, also from the University of Oklahoma, and it was a scaled
down version of the Solar Rover II. The Solar Rover II was a single bodied, four wheeled, 30 kg rover
designed for the Martian environment [8]. The base, left and right side walls were 10mm thick aluminium
honeycomb due to their load-bearing requirements. The front and rear panels were solid 3mm thick
aluminium and do not experience significant loading, while the top surface is the solar panel mounted on
L-shaped aluminium beams. A 30mm beam was mounted to the base plate to provide rigidity and a
mounting point for the central differential suspension. The Micro Lunar rover is a scaled down version of
the Solar Rover II, approximately 1/5th of the size [8]. The design was virtually the same, though some
modifications were made. Among the more significant changes made was the material selection.
Extensive research was done by the author to determine material properties of competing material
options. In the end, the author selected the M40J carbon fiber for simple geometry parts due to its high
tensile strength, low density, and small rate of thermal expansion. For more complex geometries, the MS-
1A carbon fiber was selected due to its manufacturability [8]. The final structure weighed 50% of the
original scaled down design, with all weight savings coming from material changes.
A table summary of select rover characteristics is included in Table 1. Rovers are named in the
leftmost column of the table with the top row containing characteristics of interest. If the characteristic was
present in a rover, the box is filled with a “yes”, and comments are provided in brackets. If the
R. Pitre, Systematic Structural Optimization of a Next Generation Lunar Rover Chassis 8
characteristic was not present, then the box is filled with a “no”. When the characteristic was not
applicable to the rover or is not discussed in studied literature, the cell was filled with gray color.

R. Pitre, Systematic Structural Optimization of a Next Generation Lunar Rover Chassis 9
Table 1 - Rover characteristics summary (grey boxes indicate no information available)
Rover Mission Location
Mass Scientific Payload
Dimensions Number of Wheels
Number of motors
Motor Locations
Suspension Type
Steering Type Aluminium Carbon Fiber
MLI Passive Thermal Control
Power Source Battery Type
Movable Solar Panels
Rectangular Chassis
Considered Temperature Range
Silica Aerogel
Source(s)
Chang'e 3 Sinus Iridum
(44.1° N, 31.5° W)
120 kg 20 kg 1.5 m tall (rest
unsure) 6 10
1 Per wheel + 1 Front
and rear for steering
Rocker-bogie Ackermann + Zero Radius + Skid Steering
Unsure Unsure Yes Unsure Solar + Pu238 Unsure Yes Yes -180 ˚C to +50
˚C Unsure
[3] [16] [15] [17] [12]
Chandrayaan-2
Shoemaker or Gerlach
Crater (Lunar South Pole)
15 kg 2 kg 450 mm long (rest unsure)
6 (150 mm OD) (100
mm width) 10
1 Per wheel + 1 Front
and rear for steering
Rocker-bogie Ackermann + Zero Radius + Skid Steering
Yes Unsure Unsure Unsure Solar Unsure Unsure Yes Unsure Unsure [19] [18]
Mobile Payload Element
Lunar South Pole
12 kg 1.939 kg
990 mm(L) x 450 mm(W) x
740 mm(H) (Deployed)
4 4 + 2
Steering actuators
1 Per Wheel + Actuators
on front wheels
Active Ackermann and
"Forklift" Yes
Yes (Al-CFRP)
Yes Yes (with
active) Solar
Primary + Secondary (160 Wh)
Yes Yes -180 ˚C to +40
˚C Unsure [11]
NASA MAX-C Mars (25° N-
15°S) 340 kg 62 kg
2300 mm(L) x 5270
mm(W)(1840 w/o panels) x 1700 mm(H)
6 (350 mm OD)
Unsure Unsure Unsure Unsure Unsure Unsure Unsure Yes Solar Unsure Yes Yes (Current) Unsure No (CO2
gap) [13] [9]
Mars Reconnaissance
Lander
Hypanis Valles /
Xanthe Terra (Mars)
426 kg 16.5 kg 4 m OD N/A N/A N/A Eddy-current dampers on
each leg N/A Unsure Unsure Unsure No
Advanced Sterling-Cycle Radioisotope
Generator (ASRG)
N/A N/A No Unsure Unsure [20] [4]
AMALIA Rover Lunar
Equatorial Region
30 kg Unsure Unsure 4 (180 mm
OD) 4 Wheel hubs
Roll axis swing arms
Unsure Yes Yes Yes Yes Solar Li-ion (>120
Wh/ kg) Yes Yes
-150 ˚C to +150 ˚C
Unsure [5] [21]
NASA Solar Rover II Mars 30 kg 7.93 kg
450 mm(L) x 350 mm(W) x
200 mm(H) (Body
Dimensions)
4 (210 mm OD) (110
mm width) 2 Internal
Passive Differential
Skid Steering Yes Yes (Micro
Rover) "Gold foil" Yes Solar
Four packs of Five D-sized cells
(12 V/pack)
No Yes -133 ˚C to +27
˚C Yes [8] [7]

R. Pitre, Systematic Structural Optimization of a Next Generation Lunar Rover Chassis 10
As can be seen in Table 1, all rovers, with the exception of the Mars Reconnaissance Lander
“Hopper”, had a simple, rectangular chassis. These simple chassis did not appear to have much design
consideration other than material selection and geometric constraints due to fairing size restrictions. The
entire chassis was used as a warm electronics box for all rovers. This is likely an inefficient use of
structure and energy. Carbon fibre and aluminium are present in every rover. Often both are used, using
separate aluminium and carbon fibre components or using Al-CFRP honeycomb. From the material
properties study for the Micro Lunar Rover design, it was determined that carbon fiber possesses the best
material properties for rover design [8]. A unique feature not discussed in Table 1 is the use of internal
structure as load bearing. The only rover that referenced this design feature was the Mobile Payload
Element (Haarmann et al., 2012).
A common theme among many of the rovers was the challenge of meeting the required mass budget.
In the case of the Mobile Payload Element, the engineers were unable to add sufficient thermal control to
survive the lunar night due to mass budget restrictions. The AMALIA rover was also noted to be
overweight during the design process. It can be seen that the payload mass fraction has been relatively
small in the past which limits the usefulness of the rover mission. This study further emphasized the
importance of structural mass reduction for planetary vehicles.
2.2 Introduction to Design Optimization
Systematic design optimization is the formulation of problem such that a particular set of inputs will
produce the best possible output. The optimization problem is visualized in Figure 1.
Figure 1 - Design Optimization Visualization [22]

R. Pitre, Systematic Structural Optimization of a Next Generation Lunar Rover Chassis 11
In Figure 1 “f(x)” is an objective function which is proportional to the design variable “x”. The
optimization problem is bounded by inequality constraints, “g(x)” and equality constraints, “h(x)” while the
design variable itself is bounded by its lower and upper limits, “xl” and “xu”. The design variable is
systematically adjusted based on its sensitivity to the objective function such that the design variable will
approach an optimum value. The true merit of the design optimization problem is that many systems or
components can be defined in such a way that for a set of design variables describes the system or
component and the objective function characterizes its performance. For example, size optimization is the
practice of defining a structure in terms of discrete variables, such as defining a cylindrical tube in terms
of its diameter and wall thickness. In this example, for an objective function of mass minimization, the
engineer can optimize the diameter and wall thickness of the tube to obtain a minimum mass subject to
displacement and stress inequality constraints. The size optimization method is typically used following
topology optimization once the design space is well defined by the optimum topology result.
2.3 Introduction to Topology Optimization
Topology optimization is a specific optimization problem type where the design variable is the
element density of an element within a voxel or pixel based structure. The element density can be a value
between 0 and 1 and is penalized to attempt to force the value to be equal to exactly zero or one. An
element density of 0 represents void space within the original structure, while an element density of one
represents the particular voxel or pixel as a structural element within the overall topology. The optimum
topology is described as the optimum distribution of non-void elements within the original geometry. The
mathematical statement for topology optimization is described in the following equation.
Minimize: 𝑓(𝑥)
Subject to: 𝑔(𝑥) ≤ 𝑥𝑖𝑛𝑒𝑞
ℎ(𝑥) = 𝑥𝑒𝑞
Design Variables: 𝟎 ≤ 𝝆𝒊𝒌 ≤ 𝟏 {𝒊 = 𝟏 … 𝒏}
Equation 1 - Topology Optimization Statement
R. Pitre, Systematic Structural Optimization of a Next Generation Lunar Rover Chassis 12
In Equation 1 the objective function and constraints are defined in the same manner as any typical
optimization problem. Topology optimization is unique due to its use of element density as a design
variable. Here “ρi” is the element density of element “I” in a design space containing “n” elements. The
exponent “k” is a penalty factor which is applied to the element density to force non-binary values to move
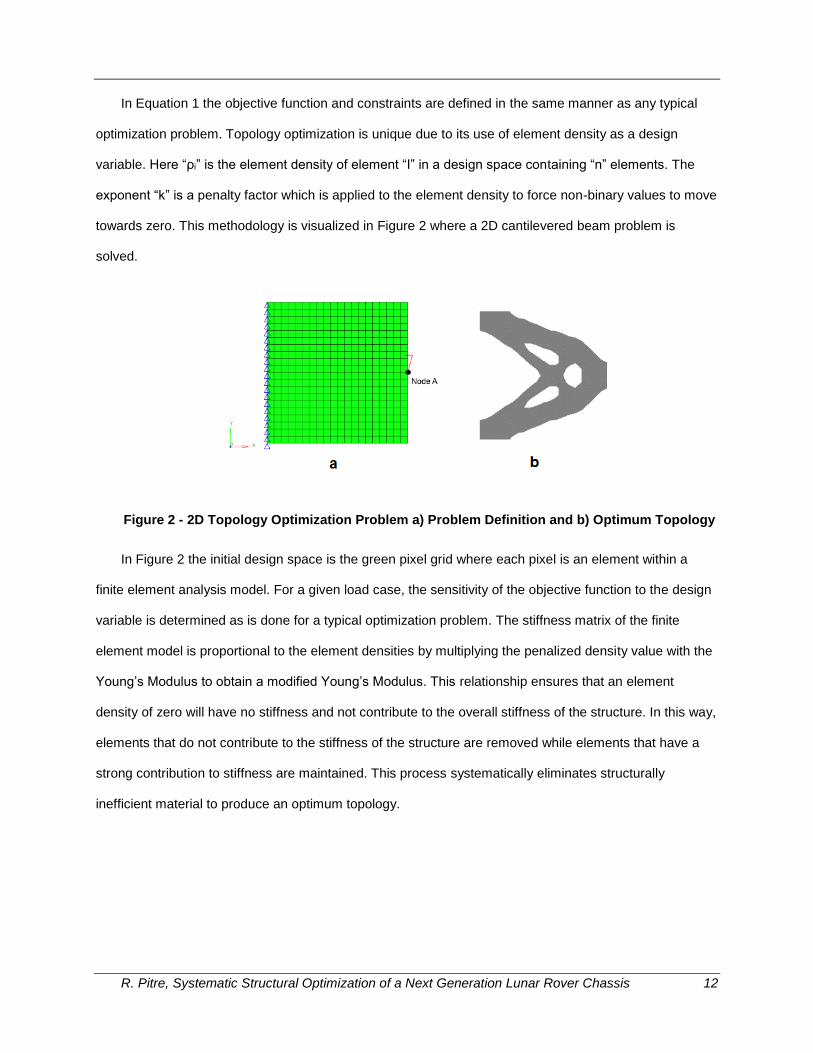
towards zero. This methodology is visualized in Figure 2 where a 2D cantilevered beam problem is
solved.
Figure 2 - 2D Topology Optimization Problem a) Problem Definition and b) Optimum Topology
In Figure 2 the initial design space is the green pixel grid where each pixel is an element within a
finite element analysis model. For a given load case, the sensitivity of the objective function to the design
variable is determined as is done for a typical optimization problem. The stiffness matrix of the finite
element model is proportional to the element densities by multiplying the penalized density value with the
Young’s Modulus to obtain a modified Young’s Modulus. This relationship ensures that an element
density of zero will have no stiffness and not contribute to the overall stiffness of the structure. In this way,
elements that do not contribute to the stiffness of the structure are removed while elements that have a
strong contribution to stiffness are maintained. This process systematically eliminates structurally
inefficient material to produce an optimum topology.

R. Pitre, Systematic Structural Optimization of a Next Generation Lunar Rover Chassis 13
2.4 Finite Element Analysis of Lunar Rovers
At the time this research was completed, no examples were found for thorough finite element
analysis of a lunar rover chassis. However, two relevant articles were found for lunar rover FEA [8] [23].
Taber completed finite element analysis for the composite suspension arm of a Micro Lunar Rover
[8]. Static and dynamic analysis was performed using Pro / Mechanica software. The suspension arm was
subjected to a static load case considering the vehicle weight. The arm was modelled in halves to
determine if either half failed from full loading. Once the arms were deemed to satisfy the loading
condition, the author increased loading until failure was achieved to determine the allowable load for the
suspension arm design. Dynamic analysis was also performed to test for stop loads when stopping
completely from full speed, and also for a drop from 4 cm. The analysis demonstrated that the rover
would require more compliant wheels to prevent failure from a short free-fall.
The analysis performed by Pantaleo and Bourne [23] investigated the dynamic loading seen by the
rover during transit from the Earth to the Moon, also referred to as the Trans Lunar Injection (TLI) stage.
The cases investigated by the authors were acceleration loading, random vibration, and natural
frequencies. ANSYS and Hyperworks© Optistruct commercial software packages were used for the
analysis. Model creation was done by importing CAD geometry to Hyperworks© and defining material
properties / composite layups. The model consisted of three main components: the TLI, the braking
stage, and the rover itself. Minimum factor of safety allowed for this analysis is 1.4 as per regulations of
the United States Defense Standards. Maximum von Mises stress was compared to yield stress of
material to determine factor of safety. The random vibration test was performed at the frequencies and
power spectral densities specified by the chosen launch vehicle. Natural frequency testing was also
completed using both Hyperworks© and ANSYS models. Given the success of all the tests, it was
recommended that optimization be performed to reduce weight of the interstage and bring the safety
factor closer to 1.4.
While both articles provided some insight into the analysis of a lunar roving vehicle neither of the two
examples were comprehensive studies of the performance of a lunar roving vehicle. However, the articles

R. Pitre, Systematic Structural Optimization of a Next Generation Lunar Rover Chassis 14
provided some insight into loading cases that should be considered for the lunar rover chassis, in
particular the dynamic loading considered by Pantaleo and Bourne.
2.5 Design Optimization of Lunar Rovers
It is important to reiterate the fact that there are no public examples of topology or design optimization
for a lunar rover chassis. Topology and design optimization were not discussed in other public
documents, and thus it is unlikely that this work exists. Despite the lack of structural optimization in lunar
rovers, mobility system optimization has been done for two different rovers. In addition, mobility systems
optimization was identified as a next step in past documents on the Chang’e 3 rover [12].The mobility
optimization for the two rovers, the ESA ExoMars and Next Lunar Lander, were done by the same two
authors working at the German Aerospace Centre (DLR) [24].
The optimization process performed by Seeni, Schafer, and Hirzinger [10] and Schafer and Leite [25]
was a system level optimization using a genetic algorithm to optimize control and structural performance.
The optimization used generic vehicle models with simple components such as homogenous square
beams for bogies and hollow cylinders for wheels. Interestingly, it was recommended by the authors that
topology optimization be performed to improve weight savings for these components. Each generated
vehicle was evaluated for several terrain scenarios to determine the objective function value. The
optimization process used the following performance measures: Slope climb capability, obstacle traverse
capability, and tip-over static stability. Structural and control optimizations were performed separately. For
structural optimization, mass minimization was used as the objective function while the following
inequality constraints were considered: roll axis static stability angle, pitch axis static stability angle, and
average drive mechanical power. In addition to the structural and control optimization, other scenarios
were considered to evaluate average power, accumulated sinkage, stability, travel distance, and attitude
path. This optimization methodology was successful in providing a system level design which satisfied
various design parameters, however the author noted that the component level design was not
considered and therefore significant weight savings could be achieved by considering component level
optimization.

R. Pitre, Systematic Structural Optimization of a Next Generation Lunar Rover Chassis 15
2.6 Analysis and Optimization of Satellite Structures
Given the limited work completed for planetary vehicle analysis and optimization, research was done
to find articles on satellite structural design with direct relevance to rover structural design. Topics of
interest for satellite design were optimization (specifically topology optimization) and finite element
analysis. Four papers were found for structural optimization [26] [27] [28] [29] and 1 paper was found for
finite element analysis [30].The following papers on satellites are by no means a complete list of available
papers on satellite design. The papers found were chosen due to their relevance, though other relevant
papers may exist that were not found. It is important to note that articles on topology optimization were
not found for structural design; all design optimization articles found performed shape optimization.
The first example of satellite optimization was done by Mao and Zhang [26]. The article summarized
a shape optimization process for satellite structural design using ANSYS and CATIA. In the article, two
satellite platforms were optimized. Each satellite structure was a cylinder made up of aluminum
honeycomb, a PMI foam core layer, and composite axial and circumferential beams. Mounting panels for
payload, single apparatus, and propulsions system also resided on the cylinder with additional reinforcing
composite beams used for the mounting panels. For the shape optimization, mass was chosen as the
objective function. Design variables used were as follows: single layer thickness of main cylinder
subsections, honeycomb grid wall thickness and length, height of honeycomb / PMI core, single layer
thickness and core layer height of mounting panels, and beam section dimensions. Constraints used
were as follows: first bending frequency, maximum structural displacement under acceleration, composite
ply stress intensity, shear stability rule, and elastic buckling of main cylinder under axial loading. A two-
level approach was used for optimization. First a sequential unconstrained minimization technique
approach was used to find a probable optimal design point, and then the first order optimization method
was used to find a more accurate minimum. FE modeling was done using the master-slave node
approach. The first satellite model used 51 design variables, 30 iterations, and achieved a 4.95% mass
reduction, while the second model used 30 design variables, 25 iterations, and achieved a 7.18% mass
increase. For both cases, the average additional mass decrease from the First Order Optimization
method was 0.38%.
R. Pitre, Systematic Structural Optimization of a Next Generation Lunar Rover Chassis 16
The second example of satellite optimization was done by Ravanbakhsh and Franchini [27]. The
article summarizes the optimization of a microsatellite (Microsatellites are classified as satellites between
10 and 100 kg). The mass budget chosen by the authors required 55% of the satellite mass to be shared
between the structure and payload. Optimization was performed by MATLAB using results from static and
dynamic FEA models. Following the initial sizing from the static and dynamic models, an initial set of
design parameters was input into the optimizer with an initial defined mass. The structure was then sized
by calculating the static case, followed by a dynamic case if the static case is passed. For each iteration,
the payload mass was increased provided that the mass difference between the initial design and the
new design is greater than 0.5 kg. In simpler terms, the mass savings were used as payload weight until
the lighter structure + payload weight is the same as the original design weight. Once the difference was
less than 0.5 kg the dynamic calculations were performed. If the design passes the dynamic test case,
then the iterations stop. If the design did not pass the dynamic case, then the design was eliminated and
a new design set was selected. It was found that this method was unable to provide an optimum solution
due to the conflicting outcomes of minimizing mass while maximizing payload budget. Thus a genetic
algorithm multi-objective optimization was performed. From the GA optimization a Pareto front was
created, which showed that a satellite total mass in the range of 40-60 kg was the optimum approach as
the relative change in structure mass budget is smaller in that range (20-15%). Therefore in this range
there was also less change in payload mass budget (payload budget is directly proportional to structure
budget), providing more flexibility when determining payloads. This is important as the satellite was
designed without exact knowledge of mission requirements and therefore no knowledge of payload
requirements.
The third example of satellite optimization was done by Pina et. al. [29]. The optimization in this case
was done using Patran / Nastran and an in-house software package named “Engineering System for
Structural Optimization for Spacecraft” (ESSOSII). Patran was used for model construction, which was
composed mainly of laminated honeycomb panels. Nastran was used to solve static and dynamic cases.
ESSOSII uses the two-level multi-point approximation concept. The constructed model contained 29,480
grid points, 29,002 shell elements and 559 different types of beam elements. The final weight was 2,248
kg with 140.3 kg of structure. Static analysis was done using the SOL 101 module of Nastran. Dynamic

R. Pitre, Systematic Structural Optimization of a Next Generation Lunar Rover Chassis 17
analysis was done using the SOL 103 module of Nastran. For optimization, mass minimization was the
objective function. The thicknesses of aluminium face sheets composite laminate layers were the design
variables (it was noted that not all panels were considered). The constraints used were thickness side
constraints for each design variable as well as requiring the final design to be subject to the global mode
frequency. Both ESSOSII and Nastran SOL 200 were used for optimization. Nastran SOL 200 was used
for the initial design case then further optimization was done using ESSOSII. Following the Nastran
results, mass was reduced by about 11 kg to 2,236.82 kg then the ESSOSII optimization further reduced
the mass to 2,213.3 kg.
The fourth and final example of satellite optimization was done by Chen and Huang [28]. The paper
was written by the same author as the previous example at Beihang University in China, and uses
ESSOSII, Patran, and Nastran with a two-level multi-point approximation like in the previous example.
The objective function was the weight of the structure as it was in all previous examples. The design
variables were the linked cross-sectional dimensions of the frame, making up seven design variables.
The constraints were the transverse and first-order frequency limits, element stress limits, and stability
requirements. The FE model included 24,669 nodes with 26,844 elements. The resulting optimization
reduced the structural mass by 3.2 kg.
While there were some examples of satellite structural optimization for mass reduction it is important
to distinguish the type of optimization considered. These were all examples of size or shape optimization
where the design space was already well defined. Again it is stressed that no examples of topology
optimization were found for satellite structural design.
Finite element analysis was discussed in all examples for satellite optimization. In all cases static and
dynamic analysis were performed. Models were made up of beam, shell and rod elements. Patran and
Nastran were used in the third and fourth examples while MATLAB, ANSYS, and CATIA were also used.
Static analysis was typically done to determine structural integrity when subject to inertial loads. Dynamic
analysis typically sought to ensure that natural frequencies were avoided during launch.

R. Pitre, Systematic Structural Optimization of a Next Generation Lunar Rover Chassis 18
An example of an article devoted exclusively to satellite FEA is done by Abdelal, Cooper, and
Robotham [30]. The author used ANSYS to generate a model then used a program written in MATLAB to
determine beam stresses and deformation. After the results were produced, a sensitivity analysis was
performed to determine structural performance sensitivity to input variables using the first order reliability
method. The example FEA in the article included thermal loading in the analysis for the static case,
though thermal loading was not considered for the dynamic case.
In summary, optimization is a well-defined problem and topology optimization is a particular subset of
the general optimization problem. The literature review was successful in producing a high level summary
of previous planetary rover designs in order to improve decision making in the concept generation task.
The literature was unable to find studies of systematic structural optimization of planetary vehicles and
was also unable to find comprehensive studies of planetary vehicle finite element analysis. Due to the
lack of available literature on rover design, the search was expanded to include satellite structures, which
was a better studied problem but still no examples of complex component level structural optimization
were found.

R. Pitre, Systematic Structural Optimization of a Next Generation Lunar Rover Chassis 19
3.0 Chapter 3: Chassis Definition and Design Process
Definition
The focus of this research for the structural design of a lunar rover chassis was the mass reduction of
the structural components. This was achieved using a systematic approach which made use of topology
and size optimization to achieve weight reduction. The optimization was completed using Hyperworks©
Optistruct. Optimization was completed while considering surface and launch vehicle loading on the lunar
rover chassis. The performance of the chassis under these loads was monitored to ensure robustness of
the structure.
3.1 Chassis Definition
This research aimed to develop a next generation lunar rover chassis design through leveraging the
power of mathematical optimization. A lunar roving vehicle is a vehicle which operates on the lunar
surface while the chassis is the primary structure which joins all critical subsystems together. An image of
Neptec’s baseline lunar roving vehicle concept, the Artemis Jr., is highlighted in Figure 3.
Figure 3 – Artemis Jr. Lunar Rover Key Components Definition [31]
In Figure 3, three main components are highlighted which may not be obviously identifiable. The
component of interest for this research is the chassis. The chassis locates the mast and all its
components, the payload, the suspension and drive train (not labelled in the figure) as well as all internal
components. The chassis is responsible for maintaining the correct location of these features to ensure

R. Pitre, Systematic Structural Optimization of a Next Generation Lunar Rover Chassis 20
that all subsystems including the chassis itself perform as intended. In Section 2.1 it is evident that this
structural component often represents the majority of the mass of a lunar roving vehicle.
In this research, the mast design, payload design, and suspension design were not considered in the
design space. These components contributed to the structural loading on the chassis but do not appear in
this research in any other capacity. A payload is a task-performing component (i.e. communication,
science-gathering, etc.) carried by the planetary vehicle. The payload in Figure 3 is referred to as
“RESOLVE” in this research, which is an acronym spelling out “Regolith and Environment Science, and
Oxygen and Lunar Volatile Extraction”. The RESOLVE payload occupied a large percentage of the rover
volume and is intended to drill into the lunar surface to determine the contents of the lunar soil. This
payload was significant as it heavily constrained the allowable design space for the chassis in addition to
being a major source of loading.
The chassis itself was not constrained to fit any particular notion of what the main structure should
resemble. Any structural component which can adequately locate all features while ensuring their
protection from the hostile space environment can be defined as a valid chassis. In summary, the chassis
must satisfy the following design requirements:
1) The chassis must locate all components and subsystems 2) The chassis must provide structural rigidity to the vehicle 3) The chassis must ensure that all located components and subsystems are able to function for
their intended lifetime 4) The chassis must a sealed structure to protect internal components from environmental hazards
including cosmic radiation, lunar regolith penetration, and outgassing. 5) The chassis must ensure provisions for thermal control systems design
This research was responsible for the structural provisions and was not concerned with the
component interaction (outside of their interactions with the chassis directly) and was not responsible for
any thermal design or environmental hazards mitigation design outside of the sealed chassis design.
Thermal design was not included in the scope of this research but was identified as an important design
criteria and was considered qualitatively in the concept generation task.

R. Pitre, Systematic Structural Optimization of a Next Generation Lunar Rover Chassis 21
The sealed design provision was achieved by the implementation of external body panels, which
were required by Neptec to be at least 2mm thick in order to provide protection from cosmic radiation.
These fixed requirements were added to the space frame structure through the use of fasteners.
R. Pitre, Systematic Structural Optimization of a Next Generation Lunar Rover Chassis 22
3.2 Design Process
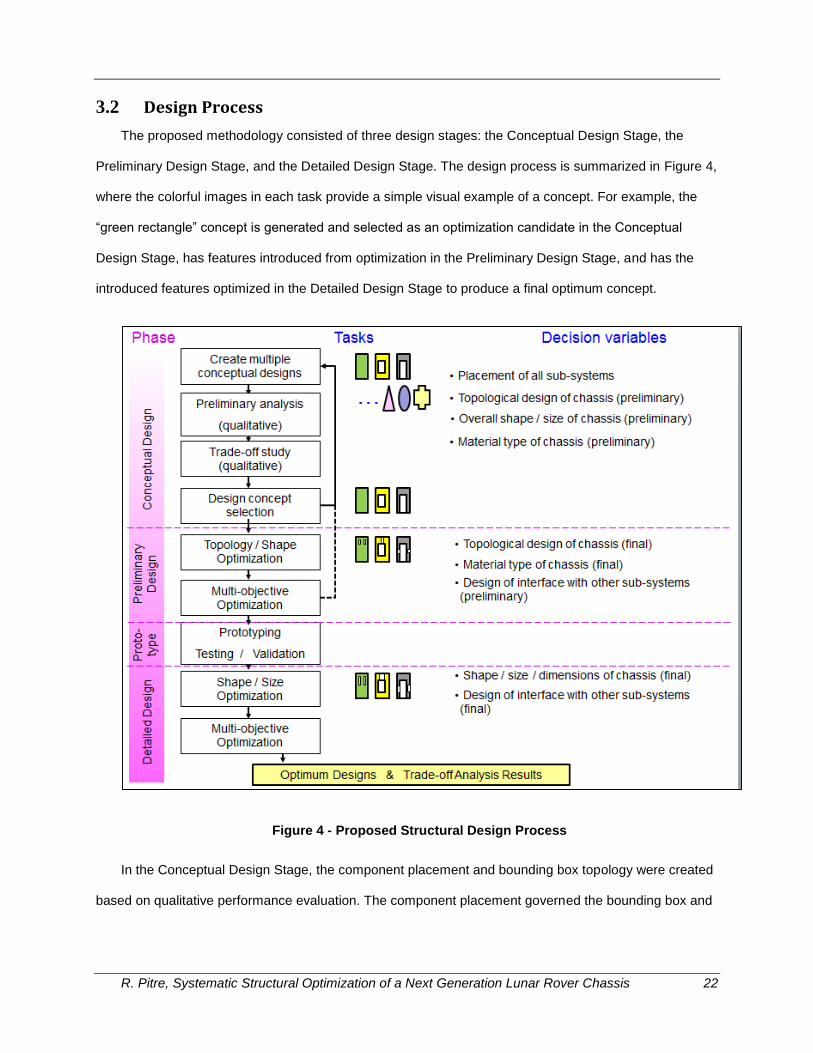
The proposed methodology consisted of three design stages: the Conceptual Design Stage, the
Preliminary Design Stage, and the Detailed Design Stage. The design process is summarized in Figure 4,
where the colorful images in each task provide a simple visual example of a concept. For example, the
“green rectangle” concept is generated and selected as an optimization candidate in the Conceptual
Design Stage, has features introduced from optimization in the Preliminary Design Stage, and has the
introduced features optimized in the Detailed Design Stage to produce a final optimum concept.
Figure 4 - Proposed Structural Design Process
In the Conceptual Design Stage, the component placement and bounding box topology were created
based on qualitative performance evaluation. The component placement governed the bounding box and

R. Pitre, Systematic Structural Optimization of a Next Generation Lunar Rover Chassis 23
final conceptual design creation which was passed into the Preliminary Design Stage. In this research
component placement was completed considering the methodology outlined in Section 4.1 .
In the Preliminary Design Stage, the conceptual designs generated in the Conceptual Design Stage
were subjected to topology optimization in order to create a preliminary optimum topology. The
preliminary optimum topologies were then subjected to structural analysis, and the results were used to
create a preliminary optimum design. The preliminary optimum designs were mechanically viable,
assembled structure designs that consider joining methods. Multi-objective optimization was not formally
completed in this research as it was outside the scope of the research, rather, the preliminary optimum
designs were compared in a trade-off study to quantitatively compare the performance of evaluated
concepts before moving onto the Detailed Design Stage.
In the Detailed Design Stage, the preliminary optimum designs were broken into distinct panels that
were subject to size optimization in order to yield more significant weight reduction. After the second
trade-off study, the concepts were refined to create the final optimum designs. These final designs were
compared in a second trade-off study to determine the best candidate for the lunar rover chassis. Again,
multi-objective optimization was not formally completed as it was outside the scope of the research but
instead the trade-off study is intended to select the best qualities for the final designs.
The proposed three step process is a systematic approach to properly tackle the problem of initially
having the most design freedom while simultaneously having the least design knowledge. The process
was defined such that the engineer minimizes the amount of constraints imposed on themselves to avoid
creation of suboptimal designs. By systematically improving fidelity the structure was able to
accommodate all required features with a potentially non-intuitive geometry.
R. Pitre, Systematic Structural Optimization of a Next Generation Lunar Rover Chassis 24
4.0 Chapter 4: Conceptual Design Stage
The goal of the Conceptual Design Stage was to produce two concepts with strong potential for
design optimization. The concept design included the component placement and the bounding box
topology that was considered for optimization. The component placement governed the bounding box
requirements and had influence on the structural performance when the vehicle was subjected to inertial
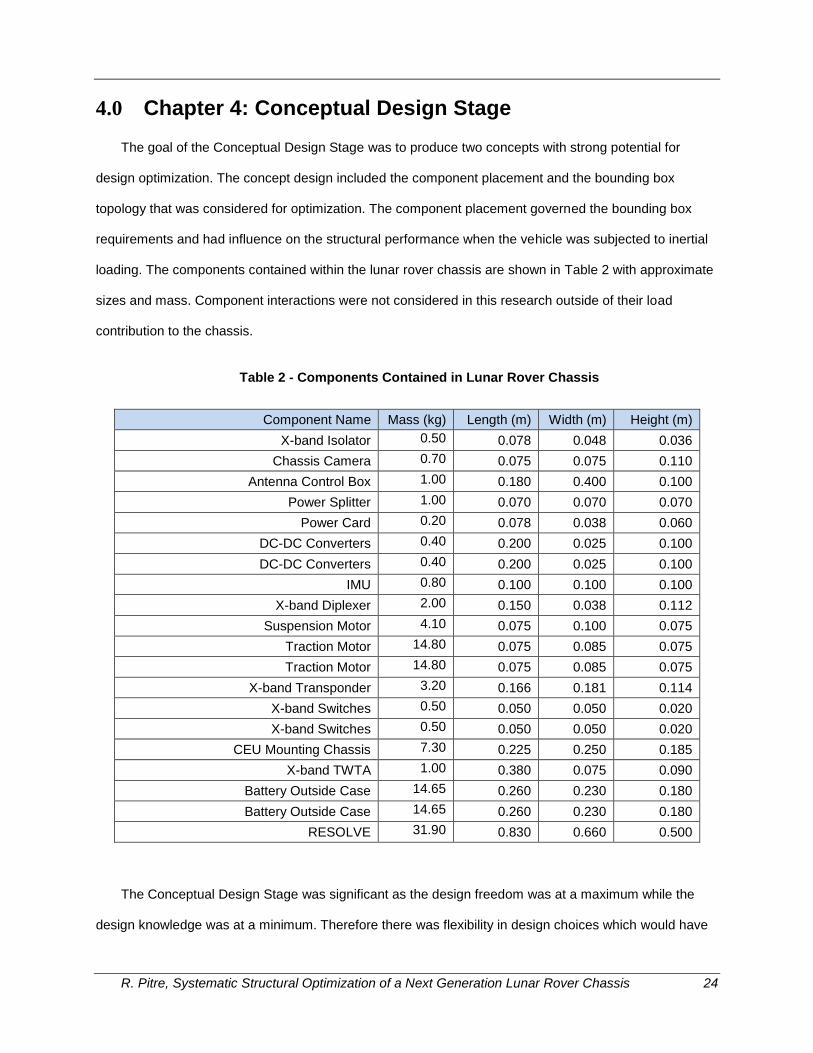
loading. The components contained within the lunar rover chassis are shown in Table 2 with approximate
sizes and mass. Component interactions were not considered in this research outside of their load
contribution to the chassis.
Table 2 - Components Contained in Lunar Rover Chassis
Component Name Mass (kg) Length (m) Width (m) Height (m)
X-band Isolator 0.50 0.078 0.048 0.036
Chassis Camera 0.70 0.075 0.075 0.110
Antenna Control Box 1.00 0.180 0.400 0.100
Power Splitter 1.00 0.070 0.070 0.070
Power Card 0.20 0.078 0.038 0.060
DC-DC Converters 0.40 0.200 0.025 0.100
DC-DC Converters 0.40 0.200 0.025 0.100
IMU 0.80 0.100 0.100 0.100
X-band Diplexer 2.00 0.150 0.038 0.112
Suspension Motor 4.10 0.075 0.100 0.075
Traction Motor 14.80 0.075 0.085 0.075
Traction Motor 14.80 0.075 0.085 0.075
X-band Transponder 3.20 0.166 0.181 0.114
X-band Switches 0.50 0.050 0.050 0.020
X-band Switches 0.50 0.050 0.050 0.020
CEU Mounting Chassis 7.30 0.225 0.250 0.185
X-band TWTA 1.00 0.380 0.075 0.090
Battery Outside Case 14.65 0.260 0.230 0.180
Battery Outside Case 14.65 0.260 0.230 0.180
RESOLVE 31.90 0.830 0.660 0.500
The Conceptual Design Stage was significant as the design freedom was at a maximum while the
design knowledge was at a minimum. Therefore there was flexibility in design choices which would have

R. Pitre, Systematic Structural Optimization of a Next Generation Lunar Rover Chassis 25
a significant impact on design performance despite the engineer having limited knowledge of what impact
design choices may have. Therefore decisions made in the Conceptual Design Stage must reflect the
engineer’s best judgement in order to maximize the potential for design optimization. It is important to
note that the conceptual design stage work was intentionally completed with relatively low fidelity to allow
optimization to progress quickly while design knowledge was developed in parallel.
4.1 Concept Creation Philosophy
Concept generation for each design began with an overall goal for the geometry of the chassis. For
example, Concept #1 was designed to closely resemble the baseline chassis design used for Neptec’s
Artemis Jr. rover concept, while Concept #3 was designed to be a curved shape. Once an overall
geometry was selected, the components were placed such that they balanced the centre of gravity about
the pitch axis while minimizing the centre of gravity for the yaw axis. In addition to centre of gravity,
components were placed such that the internal chassis volume was minimized (i.e. components were
placed compactly). Typically the larger components were placed first with smaller components added at
the end. Components were all surrounded by a 10mm buffer zone to allow space for fastening, structure,
and thermal systems. Following the placement of the components, the chassis baseplate and outer shell
were created such that all internal components were covered. The thickness of the outer shell and
baseplate were conservatively set at 20mm to ensure adequate space is available for structure and
thermal systems.
The mast, solar panel, and radiator designs were added after the creation of the chassis. The
purpose of the mast, solar panel, and radiator designs was to simply generate ideas for the rover, as
Queen’s University’s role in this project was the chassis design. The mast height was typically determined
by the required height of the solar panels to obtain the required surface area in addition to mast mounted
sensor requirements. The radiator was then designed to have its required surface area. The mast was
then made to ensure adequate connection between the chassis, solar panels, and radiators while
creating the required connections for the mast components. The resulting designs were low fidelity and
are simply a method of visualizing multiple, different potential mast designs.

R. Pitre, Systematic Structural Optimization of a Next Generation Lunar Rover Chassis 26
The constraints for the conceptual design phase were grouped into two general categories. The first
group is “general constraints”. These apply to every concept that has been and will be generated. The
second category is “concept specific constraints”. These are constraints that were created to ensure the
concepts were different from one another. The constraints were created with the intent of defining the
allowable design space without inhibiting creativity.
The general constraints were numbered in no particular order to allow for easy referencing. These
constraints apply to all concepts and were intended to define the design space without over-defining the
problem. The constraints were defined with support from Neptec Design Group based on their potential
mission requirements.
1. The following coordinate system was used for all concepts and is used as a reference for all
descriptions. In any case where confusion exists in coordinate system definition this definition will be
used:
The centre of the RESOLVE payload projected to the ground was designated as the
origin (i.e. the origin is on the ground immediately below the RESOLVE payload centre)
a. Roll axis was along the X-direction
b. Pitch axis was along the Z-direction
c. Yaw axis was along the Y-direction
2. The rover must be contained within a volume of 1600 mm × 2000 mm × 1400 mm to satisfy
lander geometric constraints
3. All geometries were simplified to be a rectangular prism that enclosed the entire component
a. An exception to this was the suspension assembly, which was modelled with more
complexity to allow it to be surrounded by other components
4. All components were separated by 1cm gap to allow room for fastening and thermal linkages.
This gap was modelled as solid material in CAD models.
5. It was assumed that orientation was not restricted and that the components could be oriented
freely in any configuration
a. Exceptions were the IMU and suspension motor

R. Pitre, Systematic Structural Optimization of a Next Generation Lunar Rover Chassis 27
6. All components were assumed to have uniform mass distribution (i.e. they are modeled as solid
objects with homogenous density). Exceptions were:
a. RESOLVE Payload’s X-CG was at ⅓ its length from the front to account for the drill
b. The suspension was assumed to have its CG at ¾ its length along the differential shaft
(inside the rover) to account for the suspension motor being attached to one end
7. Components with no specified mass were given mass based on density calculated by considering
the total volume of a group of components (i.e. communication) and the total group mass then
multiplying individual components by density
8. Battery packs were configurable and could be split into multiple rows if necessary
9. Internal components were placed such that they minimized the required chassis volume while
maintaining a desirable centre of mass
a. Thermal efficiency, or the ability to readily store or dissipate heat, was considered as the
concept is developed, but in the first generation of the first two concepts, thermal
efficiency was not considered in component placement.
10. The following components were assumed to be mutually dependent and therefore placed
together in all design concepts:
a. Front and Rear Navigation cameras must be at opposite ends of the rover with equal
spacing from the X and Z axes
b. X-Band Hemi Antennas must be placed as far apart as possible on the mast
c. X-Band Switch + X-band Hemi Antennas must be placed as close together as possible
as they are connected with waveguide tubing.
d. Mast Camera with fish-eye Lens must be placed together
11. The remaining components were assumed to be mutually independent
12. Navigation cameras must be placed at least 1m above ground.
13. The Chassis component must be placed on the Z-axis centreline +/- 5cm
14. Ground clearance underneath the RESOLVE payload must be between 30 cm and 40 cm. The
placement of the pivot shaft connecting the chassis to the walking beam was dependent on the
desired ground clearance.

R. Pitre, Systematic Structural Optimization of a Next Generation Lunar Rover Chassis 28
15. Drive motors were not a distinct volume and could be considered to be contained within the
spindle, walking beam and chassis.
16. The wheels, walking beam, drive motor, and drive train had their mass attached to the CG of the
spindle connecting the walking beam to the chassis.
17. Suspension must be placed such that the walking beam moment is applied at a right angle
18. Centre of gravity should maximize static stability, which is accomplished by ensuring CG is as low
as possible
19. Solar panels were sized and placed with the following considerations:
a. All panels had an 85.5˚ elevation
i. The rover must have is 1.0 m2 of active panel area at all times during operation
and a total panel area of at least 1.5 m2
b. The solar panel did not need to be fixed to an exterior surface; it was possible to have a
dedicated support structure for the panels
20. Radiators were sized and placed with the following considerations:
a. Radiators placement must minimize the radiation view factor to the lunar surface
b. The surface area of the radiators must be at least 0.75 m2
c. Radiators should avoid radiation view factors to the mast and ground while maximizing
the view factor to space
21. The mass of the solar panels and radiators were considered through the predefined thermal
systems mass.
a. The centre of mass for the thermal systems was concept-specific and was dependent on
the placement and orientation of the solar panels and radiators.
b. The remaining components in the “Thermal Systems” grouping were considered to have
their mass uniformly distributed such that they have no effect on the CG.

R. Pitre, Systematic Structural Optimization of a Next Generation Lunar Rover Chassis 29
Design specific constraints were created to ensure variation between concepts. The goal was to have
as few design specific constraints as possible.
Concept #1 – Baseline Chassis
o The Concept #1 chassis must resemble the baseline Artemis Jr. chassis design.
Concept #2 – U Shape Chassis
o The Concept #2 chassis must resemble a U shape chassis design.
Concept #3 – Curved Chassis
o The Concept #3 chassis must have a large curved shape.
Concept #4 – Components under RESOLVE Chassis
o The Concept #4 chassis must have components placed under the RESOLVE chassis
Concept #5 – Hybrid Components under RESOLVE Chassis
o The Concept #5 chassis must be unique (subjectively) from other four concepts.

R. Pitre, Systematic Structural Optimization of a Next Generation Lunar Rover Chassis 30
4.2 Concept Development and Evaluation
Concept designs are presented in the order they were created. This section serves to identify the
overall designs of each concept. The following images are provided for each concept: front and rear
isometric views, images highlighting the special features, chassis isometric and principal views, mast
isometric and principal views, and component placement isometric and principle views. It is important to
remember that these concepts are at an early stage of the design process; the concepts are merely a
starting point for optimization and are intended to provide a starting geometry. Each concept is
constrained to fit within the defined bounding box in Section 4.1 , therefore the roll axis length of each
concept was order or magnitude 1600 mm while the pitch axis length was order of magnitude 1000 mm to
allow space for the drive train and suspension system. The height of all concepts varied between 200 mm
and 600 mm.
4.2.1 Concept #1
Concept #1 was designed to resemble the baseline design developed by Neptec Design Group. The
front and rear isometric views for Concept #1 are shown in Figure 5.
Figure 5 - Concept #1 (a) Front Isometric View and (b) Rear Isometric View
The most unique feature of the Concept #1 design is the deployable solar panels. By deploying the
solar panels, which are stowed on the sides (blocking the radiators while stowed), a full 1.5m2 of solar
panel is active while exposing the radiators. This unique feature is shown in Figure 6.

R. Pitre, Systematic Structural Optimization of a Next Generation Lunar Rover Chassis 31
Figure 6 - Concept #1 (a) Deployed Solar Panels and (b) Exposed Radiators
The baseline chassis was a U-shaped chassis with an additional tier on the rear portion of the “U”,
such that the chassis looks like an “L” from the side view. The “U” shape was chosen to allow the rover to
back away from a stuck drill rod in case of drill failure. The additional tier is required to ensure all
components can fit in the U-shape. The chassis was sized with the following considerations: the length
was governed by the 1400mm “width” of the bounding box, the width of the rover was governed by the
1600mm “length” of the bounding box minus the wheels and walking beams, while the height was
determined by the largest component sizes. The chassis design is shown in Figure 7.
Figure 7 - Concept #1 Chassis Isometric and Top, Front, and Right Side Principal Views
The chassis design placed all components behind the RESOLVE payload except for the batteries,
which are located in the front of the chassis in the arms of the “U”. The component placement philosophy
for Concept #1 was to place the RESOLVE payload at the geometric centre of the rover on the baseplate
and distribute the components around it. Given the size of the wheels, there was limited room to place
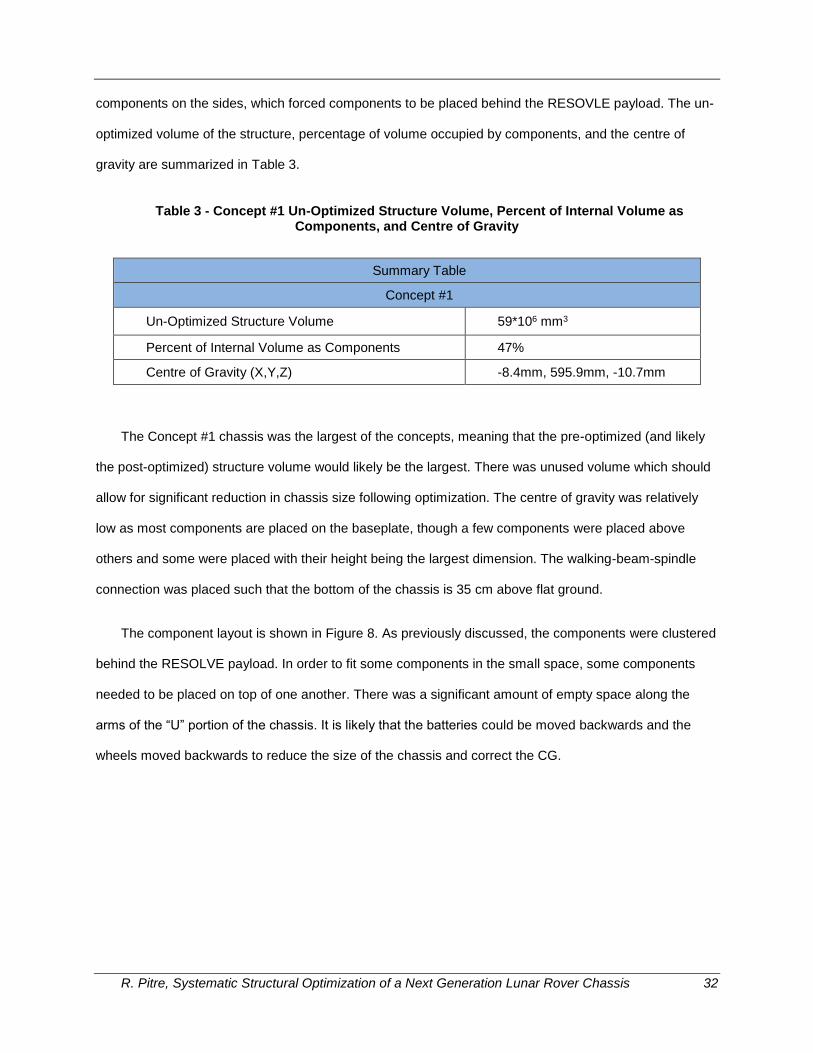
R. Pitre, Systematic Structural Optimization of a Next Generation Lunar Rover Chassis 32
components on the sides, which forced components to be placed behind the RESOVLE payload. The un-
optimized volume of the structure, percentage of volume occupied by components, and the centre of
gravity are summarized in Table 3.
Table 3 - Concept #1 Un-Optimized Structure Volume, Percent of Internal Volume as Components, and Centre of Gravity
Summary Table
Concept #1
Un-Optimized Structure Volume 59*106 mm3
Percent of Internal Volume as Components 47%
Centre of Gravity (X,Y,Z) -8.4mm, 595.9mm, -10.7mm
The Concept #1 chassis was the largest of the concepts, meaning that the pre-optimized (and likely
the post-optimized) structure volume would likely be the largest. There was unused volume which should
allow for significant reduction in chassis size following optimization. The centre of gravity was relatively
low as most components are placed on the baseplate, though a few components were placed above
others and some were placed with their height being the largest dimension. The walking-beam-spindle
connection was placed such that the bottom of the chassis is 35 cm above flat ground.
The component layout is shown in Figure 8. As previously discussed, the components were clustered
behind the RESOLVE payload. In order to fit some components in the small space, some components
needed to be placed on top of one another. There was a significant amount of empty space along the
arms of the “U” portion of the chassis. It is likely that the batteries could be moved backwards and the
wheels moved backwards to reduce the size of the chassis and correct the CG.

R. Pitre, Systematic Structural Optimization of a Next Generation Lunar Rover Chassis 33
Figure 8 - Concept #1 Component Layout Isometric and Top, Front, and Right Side Principal Views
The mast design is shown in Figure 9. The mast was designed with minimal consideration of
structural integrity. The mast served simply to provide mounting for the external mast components and
supporting the solar panels / radiators. The radiators were placed on the sides at an angle matched to the
solar panels to allow close coverage when stowed and to avoid view factors with mast components. The
panels allowed for more flexibility of orientation because they are hinged. The external mast components
were simply placed to match constraints and to ensure that antennas were as far apart as possible while
ensuring cameras were unobstructed.
Figure 9 - Concept #1 Mast Design Isometric and Top, Front, and Right Side Principal Views
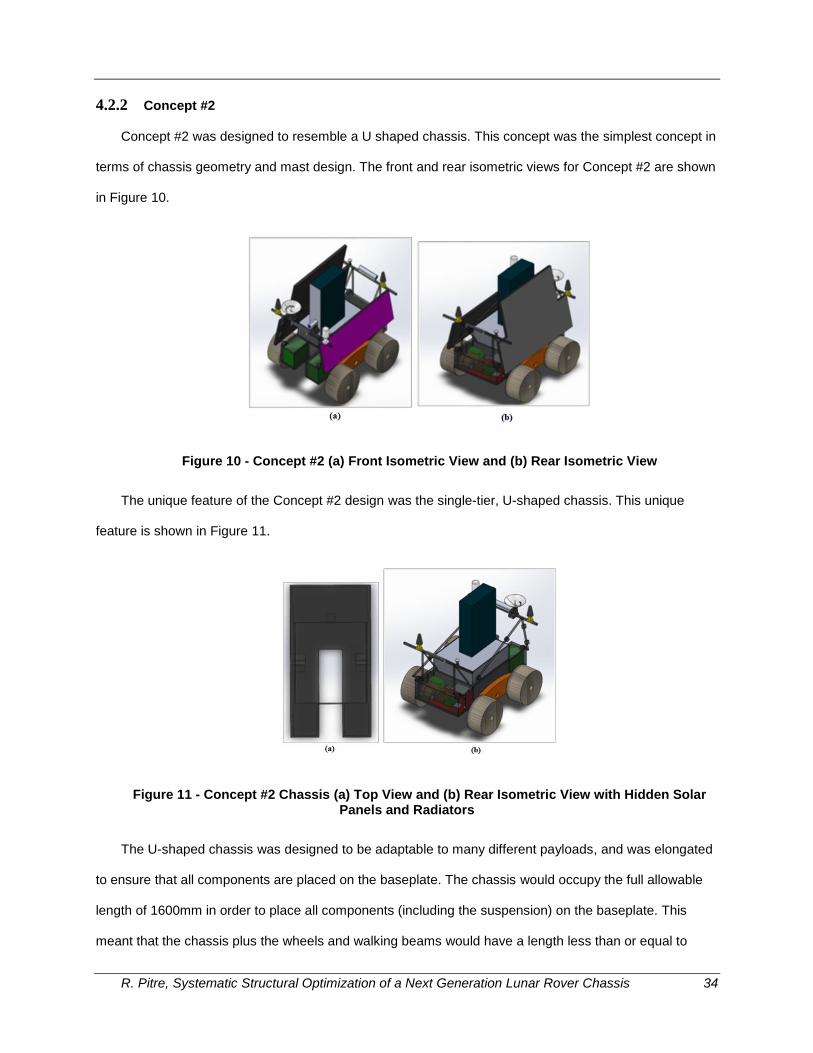
R. Pitre, Systematic Structural Optimization of a Next Generation Lunar Rover Chassis 34
4.2.2 Concept #2
Concept #2 was designed to resemble a U shaped chassis. This concept was the simplest concept in
terms of chassis geometry and mast design. The front and rear isometric views for Concept #2 are shown
in Figure 10.
Figure 10 - Concept #2 (a) Front Isometric View and (b) Rear Isometric View
The unique feature of the Concept #2 design was the single-tier, U-shaped chassis. This unique
feature is shown in Figure 11.
Figure 11 - Concept #2 Chassis (a) Top View and (b) Rear Isometric View with Hidden Solar Panels and Radiators
The U-shaped chassis was designed to be adaptable to many different payloads, and was elongated
to ensure that all components are placed on the baseplate. The chassis would occupy the full allowable
length of 1600mm in order to place all components (including the suspension) on the baseplate. This
meant that the chassis plus the wheels and walking beams would have a length less than or equal to

R. Pitre, Systematic Structural Optimization of a Next Generation Lunar Rover Chassis 35
1400mm, which meant that there was minimal structure between the RESOLVE payload and the walking
beams. The chassis design is shown in Figure 12.
Figure 12 - Concept #2 Chassis Isometric and Top, Front, and Right Side Principal Views
Similar to Concept #1, the component placement was considered by placing the RESOLVE payload
at the geometric centre of the rover and distributing the components around it. Due to the requirement of
drill clearance, the chassis design placed all components behind the RESOLVE payload except for the
batteries, which were located in the front of the chassis in the arms of the “U” on either side of the drill.
The un-optimized volume of the structure, percentage of volume occupied by components, and the centre
of gravity are summarized in Table 4.
Table 4 - Concept #2 Un-Optimized Structure Volume, Percent of Internal Volume as Components, and Centre of Gravity
Summary Table
Concept #2
Un-Optimized Structure Volume 57*106 mm3
Percent of Internal Volume as Components 51%
Centre of Gravity (from Geometric Centre) (X,Y,Z) -24.4mm, 586.3mm, -16.2mm
The Concept #2 chassis’ un-optimized structure volume is slightly smaller than Concept #1 but larger
than the other concepts. There was still a significant amount of available internal volume as the chassis
height was set to the height of the batteries. Therefore the size of rear portion of the “U” would be

R. Pitre, Systematic Structural Optimization of a Next Generation Lunar Rover Chassis 36
reduced following optimization, though by inspection the structural volume reduction would not be large.
The centre of gravity was the lowest due to all components being placed on the baseplate. The
consequence of this was that it was difficult to balance the X-CG.
The component layout is shown in Figure 13. It can be seen that the components were clustered
behind the RESOLVE payload on the baseplate. Components were distributed around the suspension.
There was a slim section of empty space along both of the arms of the “U” portion of the chassis that is
unusable as it is approximately 35mm wide.
Figure 13 - Concept #2 Component Layout Isometric and Top, Front, and Right Side Principal Views
The mast design is shown in Figure 14. The mast was designed to be as small as possible while
allowing for mounting of panels on either side. The side beams were at an 85.5° elevation such that the
panels / radiators could be mounted directly at the correct elevation. Similar to Concept #1, the external
mast components were simply placed to match constraints and to ensure that antennas were as far apart
as possible while ensuring cameras were unobstructed. The panel and radiators were placed on opposite
sides such that the radiator was always shaded when the solar panel is active. The consequence of this
set-up was that the rover orientation is limited during operation.

R. Pitre, Systematic Structural Optimization of a Next Generation Lunar Rover Chassis 37
Figure 14 - Concept #2 Mast Design Isometric and Top, Front, and Right Side Principal Views
4.2.3 Concept #3
Concept #3 was designed to be an aesthetically pleasing, curved design. The front and rear isometric
views for Concept #3 are shown in Figure 15.
Figure 15 - Concept #3 (a) Front Isometric View and (b) Rear Isometric View
The special feature of the Concept #3 design was the curved chassis. The curved shape allowed for
a full 1 m2 of active solar panel from the front and sides allowing flexibility of rover orientation during
operation. This special feature is shown in Figure 16.

R. Pitre, Systematic Structural Optimization of a Next Generation Lunar Rover Chassis 38
Figure 16 - Concept #3 (a) Top view of Curved Chassis and (b) Front and Side Views of Concept #3 showing full 1m2 of active solar panel
The curved shape was determined by the internal components more than the bounding box. The
curve was an ellipse with one principal axis determined by the outer face of the batteries while the other
was determined by the X-Band TWTA. Similar to Concepts #1 and #2, components were placed after the
RESOLVE payload. Components were placed iteratively until they conformed to the elliptical shape. The
RESOLVE payload was placed near the rear of the rover with the drill at the aft-most portion of the
chassis. This allowed the X-CG to be balanced by placing all components behind the rover. This meant
that the front portion was elliptical while the rear portion simply covered the batteries and the RESOLVE
payload. The ellipse was also inclined at an 85.5° elevation with respect to the ground to ensure proper
orientation of the solar panel that was fixed to the front of the rover. The chassis design is shown in
Figure 17.
.
Figure 17 - Concept #3 Chassis Isometric and Top, Front, and Right Side Principal Views
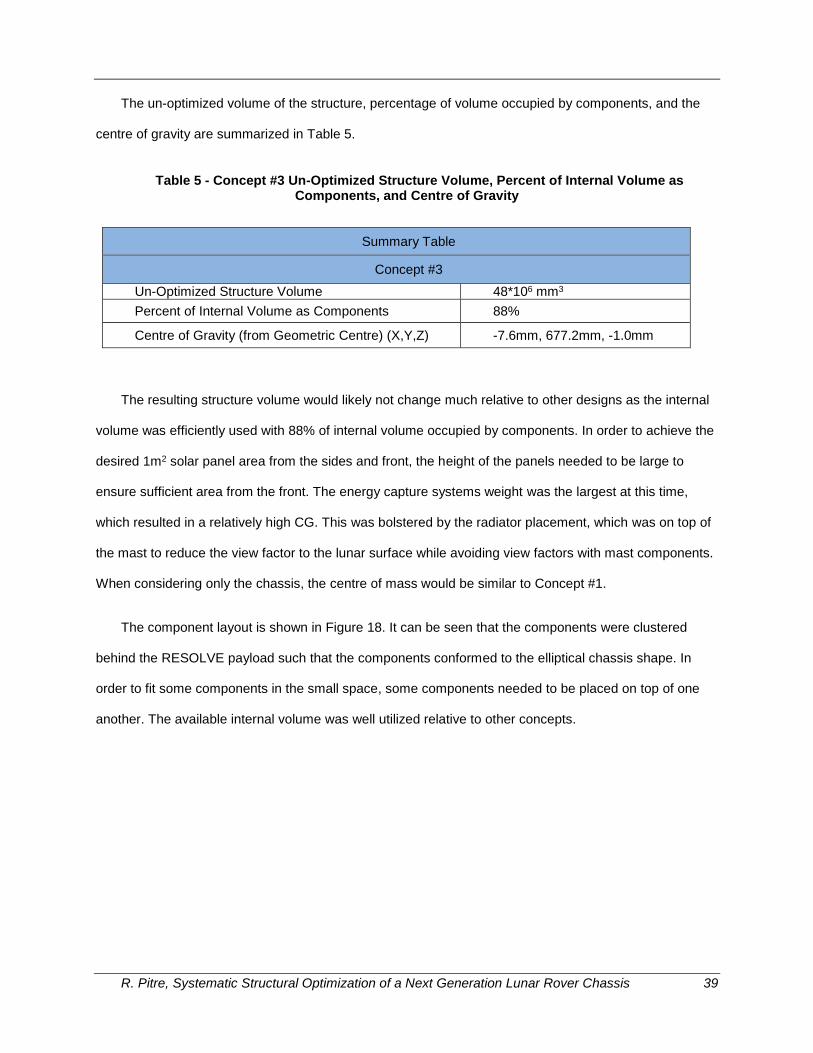
R. Pitre, Systematic Structural Optimization of a Next Generation Lunar Rover Chassis 39
The un-optimized volume of the structure, percentage of volume occupied by components, and the
centre of gravity are summarized in Table 5.
Table 5 - Concept #3 Un-Optimized Structure Volume, Percent of Internal Volume as Components, and Centre of Gravity
Summary Table
Concept #3
Un-Optimized Structure Volume 48*106 mm3
Percent of Internal Volume as Components 88%
Centre of Gravity (from Geometric Centre) (X,Y,Z) -7.6mm, 677.2mm, -1.0mm
The resulting structure volume would likely not change much relative to other designs as the internal
volume was efficiently used with 88% of internal volume occupied by components. In order to achieve the
desired 1m2 solar panel area from the sides and front, the height of the panels needed to be large to
ensure sufficient area from the front. The energy capture systems weight was the largest at this time,
which resulted in a relatively high CG. This was bolstered by the radiator placement, which was on top of
the mast to reduce the view factor to the lunar surface while avoiding view factors with mast components.
When considering only the chassis, the centre of mass would be similar to Concept #1.
The component layout is shown in Figure 18. It can be seen that the components were clustered
behind the RESOLVE payload such that the components conformed to the elliptical chassis shape. In
order to fit some components in the small space, some components needed to be placed on top of one
another. The available internal volume was well utilized relative to other concepts.

R. Pitre, Systematic Structural Optimization of a Next Generation Lunar Rover Chassis 40
Figure 18 - Concept #3 Component Layout Isometric and Top, Front, and Right Side Principal Views
The mast design is shown in Figure 19. The mast conformed to the elliptical shape of the front of the
chassis with rear support beams connecting to the rear portion of the chassis. The front solar panel would
require support which made up the majority of the mast structure. Similar to Concept #1, the external
mast components were simply placed to match constraints and to ensure that antennas were as far apart
as possible while ensuring cameras were unobstructed.
Figure 19 - Concept #3 Mast Design Isometric and Top, Front, and Right Side Principal Views

R. Pitre, Systematic Structural Optimization of a Next Generation Lunar Rover Chassis 41
4.2.4 Concept #4
Concept #4 was designed with the intent of placing as many components underneath the RESOLVE
chassis as possible. The front and rear isometric views for Concept #4 are shown in Figure 20.
Figure 20 - Concept #4 (a) Front Isometric View and (b) Rear Isometric View
The special features of the Concept #4 design were the sliding radiators and the components placed
underneath the RESOLVE payload. The sliding radiator assembly allowed control over the active
radiating area of the radiators. By placing the components underneath the RESOLVE payload, the centre
of gravity was lowered and the overall size of the chassis was reduced. These special features are shown
in Figure 21.
Figure 21 - Concept #4 (a) Stowed Radiators and (b) Side View of Components under RESOLVE
The overall chassis shape was simple due to the components being placed underneath the
RESOLVE payload. The components were all on the baseplate, with the exception of the CEU, IMU, and

R. Pitre, Systematic Structural Optimization of a Next Generation Lunar Rover Chassis 42
X-band Transponder, below the RESOLVE payload, which was placed above the batteries (the tallest
component at 95mm). This approach had an added benefit of ease of access to interior components by
easily removing RESOLVE. It could be possible to reduce the height of the batteries which could reduce
the height (and therefore overall size) of the chassis. It was also possible to reduce the height of the CEU
such that it would fit underneath the RESOLVE payload. The chassis design is shown in Figure 22.
Figure 22 - Concept #4 Chassis Isometric and Top, Front, and Right Side Principal Views
The un-optimized volume of the structure, percentage of volume occupied by components, and the
centre of gravity are summarized in Table 6.
Table 6 - Concept #4 Un-Optimized Structure Volume, Percent of Internal Volume as Components, and Centre of Gravity
Summary Table
Concept #4
Un-Optimized Structure Volume 39*106 mm3
Percent of Internal Volume as Components 49%
Centre of Gravity (from Geometric Centre) (X,Y,Z) -0.1mm, 621.3mm, -1.4mm
The un-optimized volume was the lowest of all concepts. In addition, the internal volume underneath
the RESOLVE payload was largely unused which could result in further reduction of the chassis size. The
sliding radiator design required a tall solar panel to ensure 1m2 of active solar panels from each side. This
was the reason for the high CG. If the panels were neglected, the CG would be similar to Concept #1 (not

R. Pitre, Systematic Structural Optimization of a Next Generation Lunar Rover Chassis 43
Concept #2 as the RESOLVE payload was slightly elevated). The component layout is shown in Figure
23. It can be seen that the components were distributed underneath the RESOLVE payload. A better view
of the component distribution underneath RESOLVE can be seen in Figure 21(b). The component
placement philosophy was different from the previous three concepts. The RESOLVE payload was
placed after the components based on the tallest component underneath RESOLVE. The RESOLVE
payload is approximately at the geometric centre of the rover. The components were more spread out
than other concepts which could result in more heater power / mass requirements which could offset the
potential mass savings from optimization. There was a significant amount of unused volume underneath
the chassis, however, which meant there was room for shuffling of components to improve on this.
Figure 23 - Concept #4 Component Layout Isometric and Top, Front, and Right Side Principal Views
The mast design is shown in Figure 24. The Concept #4 mast was built around the sliding radiators.
The radiators were smaller and therefore easier to move than the solar panels, which meant smaller
motors could be used to actuate the panels. The design offered more flexibility of orientation than
Concept #2 but less than the other concepts. Similar to Concept #1, the external mast components were
simply placed to match constraints and to ensure that antennas were as far apart as possible while
ensuring mast cameras are unobstructed.

R. Pitre, Systematic Structural Optimization of a Next Generation Lunar Rover Chassis 44
Figure 24 - Concept #4 Mast Design Isometric and Top, Front, and Right Side Principal Views
4.2.5 Concept #5
Concept #5 was designed to provide another example of placing RESOLVE after the components.
The front and rear isometric views for Concept #5 are shown in Figure 25.
Figure 25 - Concept #5 (a) Front Isometric View and (b) Rear Isometric View
The special features of the Concept #5 design were that the solar panels have three sides of 1m2 of
active solar panels, as well as placing all thin (<50 mm) components underneath the RESOLVE payload.
These special features are shown in Figure 26.

R. Pitre, Systematic Structural Optimization of a Next Generation Lunar Rover Chassis 45
Figure 26 - Concept #5 (a) Three sides covered by 1m2 Solar Panels and (b) Thin (<50mm) components underneath the RESOLVE Payload
Concept #5 followed the same approach as Concept #4, which was placing components first and
RESOLVE second. As was previously stated, this approach resulted in a smaller chassis with significant
available internal volume. The RESOLVE payload was also easily removed to access the internal
components. The thin components (<50 mm) were placed underneath the RESOLVE payload, which
meant RESOLVE was lower to the ground than in Concept #4. This also meant that more components
needed to be placed behind RESOLVE and the batteries could not fit underneath. The centre of mass
was reported as higher in Concept #4 due to the tall solar panels; however the chassis alone would have
a similar CG to Concept #5. The chassis design is shown in Figure 27.
Figure 27 - Concept #5 Chassis Isometric and Top, Front, and Right Side Principal Views
The components placed around RESOLVE were of varying heights so the chassis was less uniform.
As discussed in Concept #4, it could be possible to change the configuration of the batteries and CEU to

R. Pitre, Systematic Structural Optimization of a Next Generation Lunar Rover Chassis 46
be thinner and possibly fit underneath. If this change were made, Concept #4 and #5 would become
similar if not identical in terms of chassis design. The components were placed behind the RESOLVE
payload (components underneath RESOLVE are also at this end of the chassis) except for the batteries,
which are located in the front of the chassis in the arms of the “U”. The un-optimized volume of the
structure, percentage of volume occupied by components, and the centre of gravity are summarized in
Table 7.
Table 7 - Concept #5 Un-Optimized Structure Volume, Percent of Internal Volume as Components, and Centre of Gravity
Summary Table
Concept #5
Un-Optimized Structure Volume 39*106 mm3
Percent of Internal Volume as Components 42%
Centre of Gravity (from Geometric Centre) (X,Y,Z) -0.8 mm, 596.9 mm, -8.0 mm
The un-optimized structural volume was almost identical to Concept #4, though less internal volume
was used and a significant portion of the structural volume was used to cover larger components.
Optimization of this design would likely produce a low final weight, though the result would be close to
Concept #4. The centre of gravity was lower than Concept #4 due to Concept #4 having taller solar
panels. If only the chassis CG is considered for the two concepts, it is likely that Concept #4 would have a
CG similar to that of Concept #5.
The component layout is shown in Figure 28. The RESOLVE payload was approximately at the
geometric centre of the rover immediately above the 50 mm components. The batteries were split into
four units and placed at the front of the rover by the drill, while the rest of the components were placed at
the back. Components that were thinner than 50 mm were placed below the RESOLVE payload towards
the back of the RESOLVE payload to balance the X-CG.

R. Pitre, Systematic Structural Optimization of a Next Generation Lunar Rover Chassis 47
Figure 28 - Concept #5 Component Layout Isometric and Top, Front, and Right Side Principal Views
The mast design was shown in Figure 29. The mast was designed to have 1m2 of active solar panels
from three different sides and had radiators on the fourth side. The result was a large solar panel array.
The mast structure was small as the solar panels and radiators required structural support that would
complete the mast structure. Similar to Concept #1, the external mast components were simply placed to
match constraints and to ensure that antennas were as far apart as possible while ensuring cameras are
unobstructed.
Figure 29 - Concept #5 Mast Design Isometric and Top, Front, and Right Side Principal Views
R. Pitre, Systematic Structural Optimization of a Next Generation Lunar Rover Chassis 48
4.3 Conceptual Design Grading
The design review and trade-off study were done using a quantitative design analysis table. The
scores were assigned qualitatively for the majority of metrics where quantitative scoring was not possible.
The scoring is entirely subjective and it is likely that scoring would vary significantly between scorers.
Despite this, the scoring was a result of many discussions within Queen’s University and between
Queen’s University and Neptec Design Group. The Quantitative Design Analysis Table considered key
metrics as specified by Neptec Design Group. The metrics were organized into three categories by the
following principles:
1. “Critical” category: Most important metrics to quantify design performance and possible to
quantify with some reasonable accuracy in this stage.
2. “Important” category: Important metrics to quantify design performance, but less important than
“Critical” metrics, and possible to quantify with some reasonable accuracy.
3. “Useful” category: Useful but not essential design performance metric and possible to quantify
with some reasonable accuracy.
The allocation of metrics into this categories was completed during a design review meeting with
Neptec Design Group. The statement “with some reasonable accuracy” is referring to the ability to
confidently identify the relative performance of each concept compared to the others. All concept grading
was relative to other concepts. The goal was to effectively compare concepts to determine the relative
merits of each concept. Given the low maturity of the concepts in the conceptual design stage,
quantitative scoring for key metrics is often impossible. These metrics are considered in the following
way:
1. Criteria for which it is impossible to quantify in this stage in “Discussion Table”.
These are not included and Table 8 and thus given a new row
2. Criteria for which it is difficult to quantify in this stage in “Discussion Table”.
These are included in Table 8 and have their features listed in the concept columns and
discussions in the comments column

R. Pitre, Systematic Structural Optimization of a Next Generation Lunar Rover Chassis 49
The Quantitative Design Analysis Table was made up of 9 metrics in 3 different categories. The
scoring for each metric was one of three grades:
1. “Excellent” – A score of 3. At most two designs could receive this score; ideally only one concept
would receive this grade.
2. “Good” – A score of 2. This grade was given to all designs that are not given a grade of Excellent
or Fair.
3. “Fair” – A score of 1. At most two designs could receive this score; ideally only one concept would
receive this grade.
The purpose of limiting the amount of Excellent and Fair scores was to ensure effective comparison
of concepts. In this way the best candidates for optimization were easily identified through the completed
qualitative analysis. The grade assigned to each metric was multiplied by a weight factor depending on
what category the metric is in. It was assumed that all concepts did not violate any design criterion. The
three categories had the following weight factors:
1. Critical category: Weight factor of 5.
2. Important category: Weight factor of 3.
3. Useful category: Weight factor of 1.
The Quantitative Design Analysis Table is shown in Table 8.
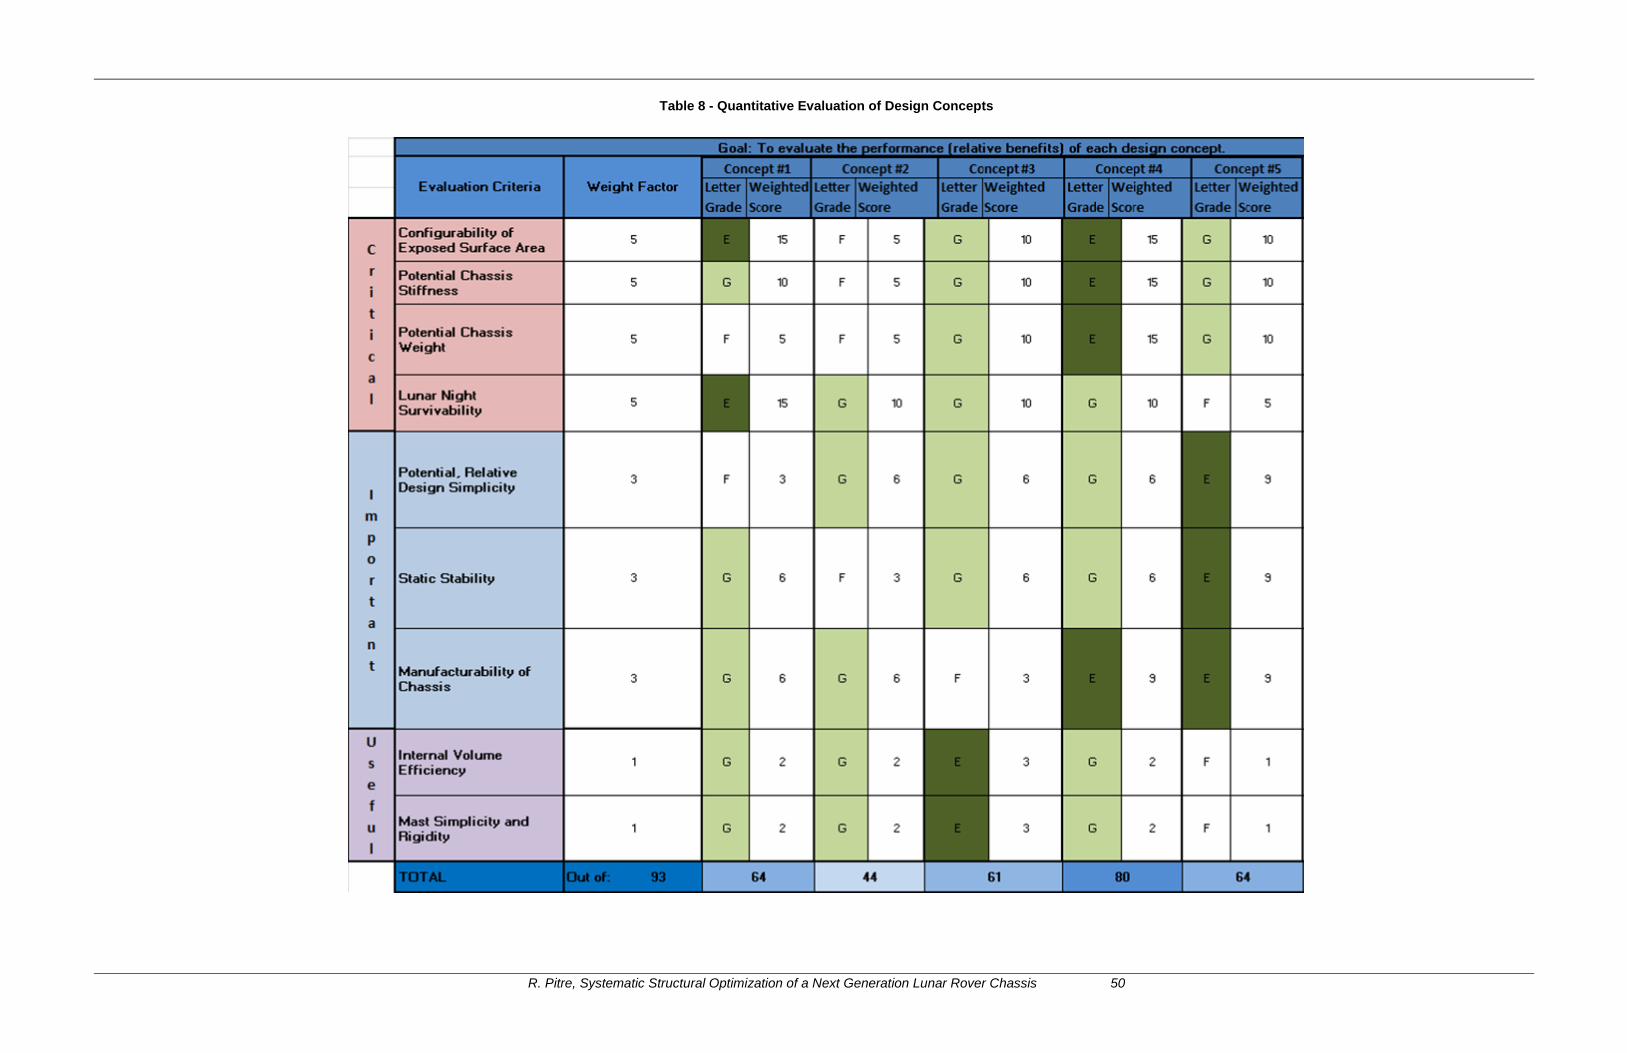
R. Pitre, Systematic Structural Optimization of a Next Generation Lunar Rover Chassis 50
Table 8 - Quantitative Evaluation of Design Concepts

R. Pitre, Systematic Structural Optimization of a Next Generation Lunar Rover Chassis 51
Configurability of exposed surface area was in the critical category. The scores given for this metric
can be seen in Figure 30. Grading for this metric was based on the overall size of the solar panels as well
as the ability to maximize / minimize energy capture / heat dissipation as desired. In addition, the flexibility
of rover orientation was considered in grading. Concepts #1 and #4 had the ability to control the output of
the radiators while maintaining a relatively good flexibility of orientation and thus received a grade of
Excellent. Concepts #3 and #5 had great flexibility of orientation though they had no control over radiator
output and thus received grades of Good. Concept #2 had poor flexibility of orientation and no control
over radiator output and thus received a grade of poor.
Figure 30 - Quantitative Design Analysis Chart Scoring for Configurability of Exposed Surface Area
Potential chassis stiffness was in the critical category. The scores given for this metric can be seen in
Figure 31. Grading for this metric was based on the theoretical maximum stiffness of a given chassis
design. An example to consider is the potential maximum stiffness of a U-shape chassis vs. a square
chassis. A square chassis will almost always have a higher stiffness post-optimization than a U-shape
chassis. In this way the concepts are compared in terms of what the expected relative stiffness would be
following optimization based on the original “bounding box” geometry. The chassis for Concept #4 had a
large, uniform base of 120mm height with only a small opening for the RESOLVE drill. Therefore, it was
expected that Concept #4 would have the highest stiffness following optimization and receives a score of
Excellent. It was expected that following optimization, the Concept #2 chassis would have the lowest
stiffness and receives a score of Fair. The rest of the concepts would fall in between these two and thus
were given a grade of Good.

R. Pitre, Systematic Structural Optimization of a Next Generation Lunar Rover Chassis 52
Figure 31 - Quantitative Design Analysis Chart Scoring for Potential Chassis Stiffness
Potential chassis weight was in the critical category. The scores given for this metric can be seen in
Figure 32. Grading for this metric was based on the un-optimized structural volume of each chassis
assuming uniform 20mm thickness of the baseplate and outer shell. It was assumed that a larger un-
optimized volume would tend to remain larger following optimization. Concept #4 had the lowest un-
optimized structural volume of all concepts (with #5 a close second). Because all components were
placed underneath RESOLVE, minimal structure was required to cover the components. Concept #5
required more structure to ensure coverage of all components due to larger components being distributed
around RESOLVE. Therefore, Concept #4 was given a score of Excellent. Concept #1 and #2 were larger
than the other concepts before optimization, and therefore were given scores of Fair. Concept #3 and #5
fell in between and therefore received a grade of Good.
Figure 32 - Quantitative Design Analysis Chart Scoring for Potential Chassis Weight
Lunar night survivability was in the critical category. The scores given for this metric can be seen in
Figure 33. This metric was graded on the ability of the radiators to be stowed as well as the colocation of
components. (Closely packed components tend to require less heater mass / power.) Concept #1 had all
components closely packed together and had control over radiator output. Thus, Concept #1 received a
grade of Excellent. Concept #5 had no control over radiator output and had the most spread out
components (aside from Concept #4, which had control over radiators) and thus received a grade of Fair.
Concept #4 had control over radiator output but had the least compact component placement. Concepts

R. Pitre, Systematic Structural Optimization of a Next Generation Lunar Rover Chassis 53
#2 and #3 had closely packed components but no control over radiators. Therefore, concepts #2, #3 and
#4 are given a grade of Good.
Figure 33 - Quantitative Design Analysis Chart Scoring for Lunar Night Survivability
Potential, relative design simplicity was in the important category. The scores given for this metric
can be seen in Figure 34. Grading was based on the relative number of parts and subsystems for each
concept as well as the interfacing complexity between the mast, chassis, and RESOLVE payload. Fewer
parts required meant fewer potential sources of failure. All concepts were considered to have equally
simple mast to chassis connections. Concept #5 required no extra parts and had a simple interface to the
RESOLVE payload as it was just mounted to the top of the chassis; therefore it received a grade of
Excellent. Concept #1 required additional motors to actuate the hinged solar panels and had a complex
connection to the RESOLVE payload which was nested within the chassis; therefore it received a grade
of Fair. Concept #2 and #3 had complex connections to the RESOLVE payload but did not require
additional components. Concept #4 had a simple connection to the RESOLVE payload but required
additional motors to actuate the sliding panels. Therefore concepts #2, #3 and #4 received a grade of
Good.
Figure 34 - Quantitative Design Analysis Chart Scoring for Potential, Relative Design Simplicity
Static stability was in the important category. The scores given for this metric can be seen in Figure
35. Grading was based on the centre of gravity of the rover as well as the wheel spacing. All concepts
had the same wheel spacing with the exception of Concept #2, which had a narrower spacing, therefore

R. Pitre, Systematic Structural Optimization of a Next Generation Lunar Rover Chassis 54
Concept #2 received a grade of Fair. Concept #5 had the lowest CG of all concepts; therefore it received
a grade of Excellent. The remaining concepts fell in between and therefore receive a grade of Good.
Figure 35 - Quantitative Design Analysis Chart Scoring for Static Stability
Manufacturability of chassis was in the important category. The scores given for this metric can be
seen in Figure 36. Grading was based on the predicted labor and time costs of the manufacturing
(including assembly). Concepts #4 and #5 had relatively simple geometries and easy integration of the
RESOLVE payload; therefore they received a grade of Excellent. Concept #3 had the most complex
shape and had a more complex integration of the RESOLVE payload, and therefore received a grade of
Fair. Concepts #1 and #2 had simple geometries and more complex integration of the RESOLVE payload
and therefore received a grade of Good.
Figure 36 - Quantitative Design Analysis Chart Scoring for Manufacturability of Chassis
Internal volume efficiency was in the useful category. The scores given for this metric can be seen in
Figure 37. Grading was based on the efficient use of internal volume in terms of the percentage of the
internal volume occupied by components. Concept #3 utilized 88% of the internal volume which was by
far the highest percentage, and therefore received a grade of Excellent. Concept #5 used the least
amount of internal volume at 42%, and therefore received a grade of Fair. The remaining concepts fell in
between and received a grade of Good.

R. Pitre, Systematic Structural Optimization of a Next Generation Lunar Rover Chassis 55
Figure 37 - Quantitative Design Analysis Chart Scoring for Internal Volume Efficiency
Mast simplicity and rigidity was in the useful category. The scores given for this metric can be seen in
Figure 38. Grading was based on overall rigidity and complexity of the structure in terms of material
requirements excluding the solar panel and radiator. Rigidity was highly dependent on beam thickness
therefore comparing rigidity was difficult for most concepts. The Concept #3 mast would likely be the most
rigid due to its curved shape and interfacing with the solar panel. The solar panel structure would reduce
the required mast structure as well for Concept #3, therefore it received a score of Excellent. Concept #5
had the most complex mast as almost the entire mast was covered with solar panels / radiators. The
panels would add rigidity at the cost of a lot of interfacing material, therefore Concept #5 received a score
of fair. The rest of the concepts fell in between for complexity and rigidity and therefore received a score
of good.
Figure 38 - Quantitative Design Analysis Chart Scoring for Mast Simplicity and Rigidity
The Qualitative Discussions and Design Features Table provided high level details regarding the
design of each metric in the columns for each concept. The comments column provided additional
discussions regarding what the metric considers and how it was graded. From the principles, each of the
metrics in Table 8 was discussed in Table 9 as all metrics were difficult to quantify. The important metrics
that were impossible to quantify but important to identify were included in a new category “Not in Table 8”
in the bottom rows of the table. The table can be seen in Table 9. This table was not be discussed in
great detail though it is recommended that the table be reviewed as it contained useful information. The

R. Pitre, Systematic Structural Optimization of a Next Generation Lunar Rover Chassis 56
metrics that were present (because they were impossible to quantify) in the Qualitative Table and not the
Quantitative Table due are:
Cost
Overall Thermal Performance of Chassis
Overall Chassis Stiffness
Stress Distribution and Deformation of Chassis

R. Pitre, Systematic Structural Optimization of a Next Generation Lunar Rover Chassis 57
Table 9 - Qualitative Discussions and Design Concepts

R. Pitre, Systematic Structural Optimization of a Next Generation Lunar Rover Chassis 58
4.4 Concept Selection
The concepts chosen for further investigation using design optimization were Concept #1 and
Concept #4. The final grading for each concept is shown in Figure 39.
Figure 39 - Final Concept Grading Results
From Figure 39 it can be seen that Concept #4 was the highest scoring while there was a tie between
Concept #5 and Concept #1. Concept #4 was chosen due to its high score. The design of Concept #4
ensures great potential for high stiffness and low weight while maintaining a low centre of gravity.
Concept #1 was tied with Concept #5 in second place. Concept #1 was chosen over Concept #5 for
two reasons. First, Concept #1 was a legacy design and was being explored by Neptec Design Group in
their parallel concept development. Hence, Concept #1 was used as the baseline design. Second,
Concept #4 and Concept #5 were much more similar than Concept #1 and Concept #4, thus optimization
would create more distinguishable results when comparing Concept #1 and Concept #4

R. Pitre, Systematic Structural Optimization of a Next Generation Lunar Rover Chassis 59
5.0 Chapter 5: Preliminary Design Stage
Following the Conceptual Design Stage, Concept #1 and Concept #4 were revised such that the
component layout and bounding box topology were adjusted by considering thermal performance. All
other subsystems remained unchanged from the previous body of work. In response to further
development of a parallel concept by Neptec Design Group, Concept #1 was changed to reflect design
changes implemented to their new concept. Concept #4 was also adjusted to achieve a lower profile due
to component definition updates. In addition to chassis changes, the suspension subsystem was changed
from a passive differential gearbox inside the chassis to a rear-yoke suspension. This change is
highlighted in Figure 40. The change in suspension style affected the boundary condition definition which
has a strong influence on load paths within the chassis during topology optimization.
Figure 40 - (Left) Previous Suspension Style Using Passive Differential and (Right) New Suspension System Using Rear Yoke
The battery geometry was also changed from two long battery packs to eight shorter battery packs.
This change is highlighted in Figure 41.

R. Pitre, Systematic Structural Optimization of a Next Generation Lunar Rover Chassis 60
Figure 41 - (Left) Initial Battery Geometry Definition and (Right) Revised Battery Geometry Definition
The new Concept #1 chassis bounding box geometry is shown in Figure 42.
Figure 42 - New Concept #1 Chassis
Some key differences between the old and new Concept #1 chassis are listed as follows:
Spindle connections above chassis baseplate
Suspension interfaces with chassis at rear at same height as spindle connections
Chassis is shorter and a uniform height
All components are housed on the base plate
Batteries are no longer in frame rails
Some components are placed in the frame rails
The new component layout for Concept #1 chassis is shown in Figure 43. The new layout was
developed based on the revised component layout which was chosen by Neptec Design Group in their
parallel study.

R. Pitre, Systematic Structural Optimization of a Next Generation Lunar Rover Chassis 61
Figure 43 - Revised Concept #1 Component Layout
The new component layout for Concept #4 was chosen to reduce total height of the chassis to 130
mm. This height was achieved by re-configuring the CEU assembly to be shorter as well as spreading the
batteries out on the baseplate to utilize the space underneath the RESOLVE chassis. The new Concept
#4 bounding box geometry is shown in Figure 44.
Figure 44 - New Concept #4 Chassis
Some key differences between the old and new Concept #4 chassis are listed as follows:
Spindle connections above chassis baseplate
Suspension interfaces with chassis at rear at same height as spindle connections
Chassis is shorter than previous iteration
Batteries are spread along baseplate floor
The new component layout for Concept #4 chassis is shown in Figure 45. The new layout was
developed to reduce the maximum height as much as possible. This was accomplished by utilizing as
much space under RESOLVE as possible and by spreading the batteries out along the baseplate. Most

R. Pitre, Systematic Structural Optimization of a Next Generation Lunar Rover Chassis 62
components are concentrated near the rear of the chassis. Components that produce more heat are
placed in the rails, while the remaining components are clustered in the rear portion of the chassis with
the new batteries.
Figure 45 - Revised Concept #4 Component Layout
5.1 Preliminary Design Stage Philosophy
The Preliminary Design Stage was centred on topology optimization. Topology optimization was
completed for the updated conceptual designs to create preliminary optimum topologies. The topology
optimization had a defined bounding box topology which allowed for element sizing of 3 mm for the
chassis. Element sizing for a quadrilateral 2D element is defined as the average side length of the
quadrilateral. In addition, the topology optimization model contained a suspension system which was
capable of rigid body motion to prevent over-constraining of the model. The optimization included surface
operation loading as well as launch vehicle acceleration and natural frequency load cases.
The preliminary optimum topologies referenced structural analysis results to create preliminary
optimum designs. The preliminary optimum designs were mechanically viable designs that consider
joining methods. The preliminary optimum designs were compared in a trade-off study to quantitatively
compare the performance of Concept #1 and Concept #4 prior to moving onto the Detailed Design Stage.
The software package interaction for the Preliminary Design Stage and Detailed Design Stage is shown
in Figure 46. The software packages used are Solid Works© and Hyperworks© Software Suite
(specifically the Hypermesh© preprocessor and Optistruct© solver).

R. Pitre, Systematic Structural Optimization of a Next Generation Lunar Rover Chassis 63
Figure 46 - Software Package Interaction for Preliminary and Detailed Design Stages
Topology optimization was conducted in order to reduce the weight of the chassis using a high fidelity
model. High fidelity modeling was achieved using accurate boundary condition modeling, representative
load cases, and by refining the design space and mesh density. The total weight reduction was desired
to be 20% from the baseline chassis, which was estimated to be 32 kg excluding fasteners. Therefore,
the optimum topologies should be reduced to a weight of at most 25.6 kg. The topology optimization
statement is shown in Equation 2.
Minimize: Total Compliance
Subject to: 𝑆𝑢𝑏𝑠𝑦𝑠𝑡𝑒𝑚 𝑐𝑜𝑛𝑛𝑒𝑐𝑡𝑖𝑜𝑛 𝑑𝑖𝑠𝑝𝑙𝑎𝑐𝑒𝑚𝑒𝑛𝑡 ≤ 5𝑚𝑚
𝑀𝑎𝑠𝑠 ≤ 25.6 𝑘𝑔
𝐵𝑒𝑛𝑑𝑖𝑛𝑔 𝑚𝑜𝑑𝑒 𝑛𝑎𝑡𝑢𝑟𝑎𝑙 𝑓𝑟𝑒𝑞𝑢𝑒𝑛𝑐𝑦 ≥ 60 𝐻𝑧
𝑇𝑜𝑟𝑠𝑖𝑜𝑛 𝑚𝑜𝑑𝑒 𝑛𝑎𝑡𝑢𝑟𝑎𝑙 𝑓𝑟𝑒𝑞𝑢𝑒𝑛𝑐𝑦 ≥ 60 𝐻𝑧
𝑆𝑦𝑚𝑚𝑒𝑡𝑟𝑦 𝑎𝑏𝑜𝑢𝑡 𝑐𝑒𝑛𝑡𝑒𝑟 𝑋 − 𝑍 𝑝𝑙𝑎𝑛𝑒
Design Variables: 𝟎. 𝟎𝟏 ≤ 𝝆𝒊𝒌 ≤ 𝟏 {𝒊 = 𝟏 … 𝒏}
Equation 2 - Topology Optimization Statement
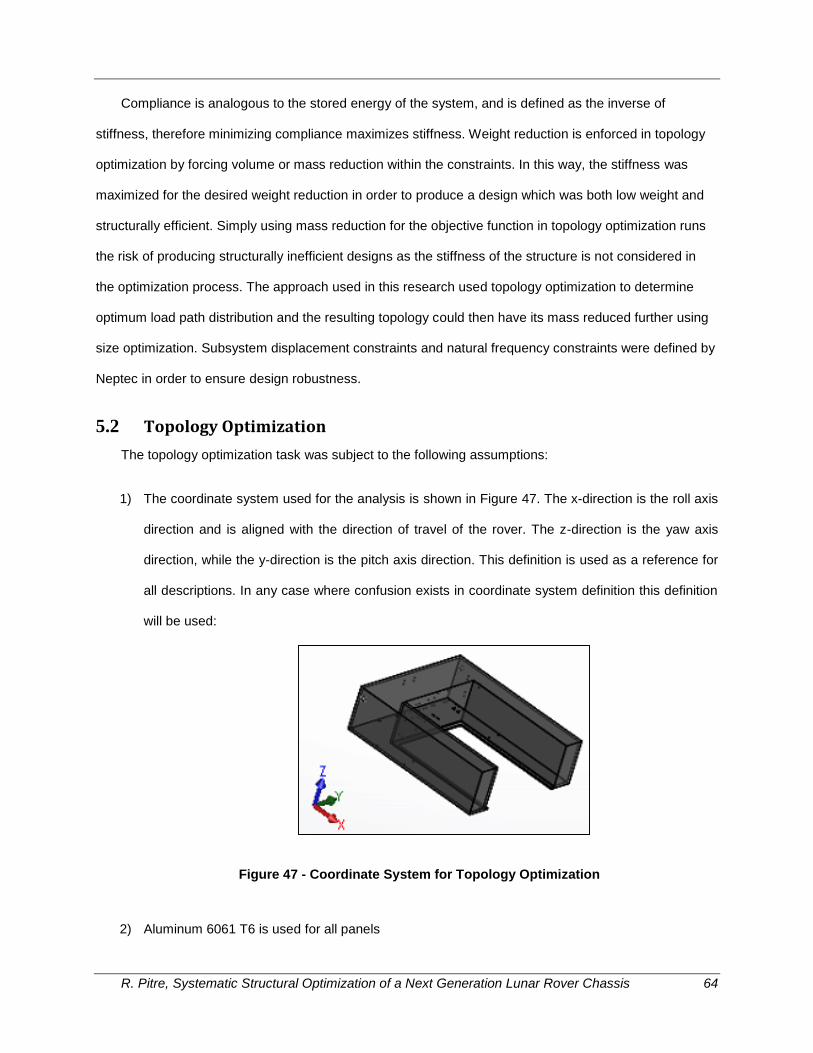
R. Pitre, Systematic Structural Optimization of a Next Generation Lunar Rover Chassis 64
Compliance is analogous to the stored energy of the system, and is defined as the inverse of
stiffness, therefore minimizing compliance maximizes stiffness. Weight reduction is enforced in topology
optimization by forcing volume or mass reduction within the constraints. In this way, the stiffness was
maximized for the desired weight reduction in order to produce a design which was both low weight and
structurally efficient. Simply using mass reduction for the objective function in topology optimization runs
the risk of producing structurally inefficient designs as the stiffness of the structure is not considered in
the optimization process. The approach used in this research used topology optimization to determine
optimum load path distribution and the resulting topology could then have its mass reduced further using
size optimization. Subsystem displacement constraints and natural frequency constraints were defined by
Neptec in order to ensure design robustness.
5.2 Topology Optimization
The topology optimization task was subject to the following assumptions:
1) The coordinate system used for the analysis is shown in Figure 47. The x-direction is the roll axis
direction and is aligned with the direction of travel of the rover. The z-direction is the yaw axis
direction, while the y-direction is the pitch axis direction. This definition is used as a reference for
all descriptions. In any case where confusion exists in coordinate system definition this definition
will be used:
Figure 47 - Coordinate System for Topology Optimization
2) Aluminum 6061 T6 is used for all panels

R. Pitre, Systematic Structural Optimization of a Next Generation Lunar Rover Chassis 65
3) Body panels were incorporated in topology optimization by considering a minimum panel thickness
equal to the body panel thickness of 2mm to ensure that topology optimization did not eliminate the
body panels.
4) Structural panels (optimization design space panels) were modeled as shell elements with 10 mm
thickness for initial design space
5) Structural panels were perfectly connected without considering fasteners
6) All shafts were modeled as 1D beam elements and were considered to be perfectly rigid
a. Shafts had pin connections at the ends allowing free rotation
b. Shaft ends were connected to the chassis via RBE2 (rigid) elements
7) Components were assumed to be connected to the chassis via four bolts at the component corners
a. Components were modeled as point mass elements
b. Bolted connections were modeled using RBE2 (rigid) elements
c. Point mass elements were connected to the bolted connections with RBE3 (no stiffness)
elements
8) A 14 mm band was reserved as non-design space along the edges of all structural panels for
fasteners
9) Connection points to landing vehicle were located at (±210 mm, ±355 mm, 0 mm) from geometric
centre as per Neptec Design Group’s recommendation
a. The bolted connections were considered to attach the chassis to a perfectly rigid platform,
such that the bolted connections constrain 5 DOF (DX,DY,DZ,RX,RY)
10) Mast beams were modeled as individual beams at an 85° elevation
11) Mast components were modeled as four point masses located at the top of each mast, with the
total mass of mast components equally divided amongst mast beams
12) The suspension structure geometry captured the allowable design space of the suspension
structure
13) Wheel geometry models were created from measurements from Neptec documentation, and
wheels were considered to be perfectly connected to the suspension structure

R. Pitre, Systematic Structural Optimization of a Next Generation Lunar Rover Chassis 66
a. Wheels were unconstrained except for the launch vehicle load cases, where the wheels
were assumed to be constrained in the yaw axis direction at the base of the wheels
b. Wheel loading was applied as point forces as local behaviour of the wheel was not
important
14) The RESOLVE payload was modeled in the same manner as other components. The drill loading
was considered to be a 10 N vertical (+Z) reaction force and a 30000 Nmm vertical (+Z) reaction
moment. These loads were applied at the ground (350 mm below payload) at the centre of the
payload (estimated as ⅓ x-length from the front of the rover along centre line)
15) A safety factor of 2 was applied to all load cases
16) Torsion and bending modes were determined by visual inspection of modal analysis and lowest
modes for torsion and bending are chosen to match desired mode shape defined by Neptec Design
Group.
17) Masts were connected to the chassis using freeze contacts in Optistruct, which map displacement
from the master surface to the slave surface.
The Phase 2 topology optimization considered seven load cases that captured quasi-static loading
imparted on the chassis during surface operations and during launch. The load cases were created to
capture the following loading scenarios:
1) Skid steering operation on the lunar surface
2) Obstacle interaction during driving operations on the lunar surface
3) Drilling operations on the lunar surface
4) Inertial loading during launch with the rover aligned with different axes with respect to direction of
rocket travel:
a. Acceleration applied along the x-axis
b. Acceleration applied along the y-axis
c. Acceleration applied along the z-axis
5) Normal modes analysis for the first 30 modes
The skid steering operation load case assumed that the rover is spinning in place on asphalt with
rubber tires as recommended by Neptec Design Group. This is a conservative estimate of the loading

R. Pitre, Systematic Structural Optimization of a Next Generation Lunar Rover Chassis 67
imparted on the chassis as the regolith coefficient of friction with the rover wheels would be much smaller.
This spinning action applies a pitch axis y-direction force on the wheels outwards (from the inside towards
the outside). In addition, the wheels had a vertical z-direction reaction force applied based on the total
mass budget of 250kg for the rover as recommended in Neptec documentation. A force was applied in
the x-direction to account for the drive units applying torque to the wheels. The force was calculated using
the radius of the wheel and the peak torque of the drive motors. It was applied in opposite directions on
either side of the chassis to simulate the wheels spinning in opposite directions. Finally, an acceleration of
1622 mm/s2 is applied to the entire model to account for lunar gravity. The chassis was constrained at the
inside edges of the shafts to allow load transfer from the wheels to the chassis via the shafts. The skid
steering operation loading diagram is shown in Figure 48.
Figure 48 - Skid Steering Load Case Diagram
The obstacle interaction load case assumed that the rover was driving forwards with one wheel
interacting with an obstacle. This interaction was modeled by applying equal weight to each wheel on
one half of the vehicle while on the other half 70% was applied to the leading wheel while 30% was
applied to the trailing wheel. A reaction force was applied to account for motor torque as was done in the
skid steering load case, however all forces were applied in the same direction to propel the rover
forwards. The simply supported shaft constraints and the lunar gravity application were the same as in
the skid steering load case. The obstacle interaction load case diagram is shown in Figure 49.

R. Pitre, Systematic Structural Optimization of a Next Generation Lunar Rover Chassis 68
Figure 49 - Obstacle Interaction Load Case Diagram
The drilling operations load cased assumed that the rover was resting stationary and drilling into the
lunar surface. The drilling loads were defined in Neptec documentation as a 10 N z-direction reaction
force and a 30000 Nmm reaction moment about the z-axis. The drilling loads were applied at ground
level. The yaw axis reaction forces applied to the wheels, the simply supported shaft connections, and the
lunar gravity application were the same as in the skid steering load case. The loading diagram for the
drilling operations is shown in Figure 50.

R. Pitre, Systematic Structural Optimization of a Next Generation Lunar Rover Chassis 69
Figure 50 - Drilling Operation Load Case Diagram
The inertial loading cases assumed that an acceleration of 6G was applied in one of the three
primary directions while an acceleration of 2G was applied perpendicular to this direction. Three load
cases were created to account for 6G acceleration in the x-direction, y-direction, and z-direction. The
constraints were applied at the Hold-Down-Release bolt locations for 5 DOF (free rotation about z-axis)
and at the bottom of the wheels in the z-direction. The wheels were constrained as the rover is resting on
flat ground in the lander. For a wheel to be raised, the other wheel would need to move downward, which
is not possible as the rover is fixed to the lander by bolts. The loading diagram for the inertial loading
load cases is shown in Figure 51.

R. Pitre, Systematic Structural Optimization of a Next Generation Lunar Rover Chassis 70
Figure 51 - Inertial Loading Load Case Diagram
The normal modes analysis solved for the first 30 modes with the constraints used in the inertial
loading load cases. This load case was used to ensure that the torsion and bending modes have
sufficiently high natural frequencies. The number for the torsion and bending modes were found by first
solving the model at its initial conditions. For the case where only the chassis is considered as design
space, the mode shape remained valid during optimization. For Concept #1, it was found that the bending
mode was mode # 24 while the torsion mode was mode # 12. The mode shapes for Concept #1 are
shown in Figure 52.
Figure 52 - Concept #1 (Left) Bending Mode (Mode #24) and (Right) Torsion Mode (Mode #12)
For Concept #4, it was found that the bending mode was mode # 16 while the torsion mode was
mode # 20. The mode shapes for Concept #4 are shown in Figure 53.

R. Pitre, Systematic Structural Optimization of a Next Generation Lunar Rover Chassis 71
Figure 53 - Concept #4 (Left) Bending Mode (Mode #16) and (Right) Torsion Mode (Mode #20)
Topology optimization models were created in Hypermesh for solving with Optistruct. Optistruct is a
unit-less solver, and therefore, consistency in terms of units in definition of loads and geometries is
important. The unit system used in this analysis can be found in Table 10.
Table 10 - Units Used in Topology Optimization Models in Optistruct
Mass Length Time Force Pressure Energy Velocity Density Gravity
Mg (ton)
mm s N MPa mJ mm/s G kg/l 9.81E+03
Material definition was done using the MAT1 card, which assumes a temperature independent, linear
isotropic material. The material used was aluminum 6061 T6, with a Young’s modulus of 68.9 GPa, a
Poisson’s ratio of 0.33, and a density of 2.7 g/cm3. The chassis was modeled using shell elements with
the PSHELL property card. For manufacturing purposes, the structural frame is composed of 2D sheet
panels, which would be cut to obtain the final topology. Due to this definition, the use of solid elements
was not practical as the solid element model would create panels with varying thicknesses, which are not
feasible to produce. Shell elements were better suited to produce panel designs that required minimal
post-processing and therefore improved the feasibility of the optimum design. The chassis was connected
to the suspension structure geometry via 1D CBEAM elements, which were released in the desired
rotational degree of freedom at the ends. This allowed rigid body rotation of the suspension drive units
and yoke, which allowed for more realistic load paths in the model. The beam connection to the chassis is
highlighted in Figure 54.

R. Pitre, Systematic Structural Optimization of a Next Generation Lunar Rover Chassis 72
Figure 54 - Shaft Modeling in Optistruct using 1D Beam elements
Component modeling was completed using rigid RBE2 elements to model bolt connections at the
connection points on the chassis. The RBE2 elements were connected to the mass elements (at the
geometric centre of the components) with RBE3 elements to prevent the components from contributing to
chassis stiffness. The component modeling is highlighted in Figure 55.
Figure 55 - Component Modeling in Optistruct using RBE2 and RBE3 Elements
The chassis panels were modeled to have a 14 mm band of non-design space at the edges to allow
for fasteners between panels. This feature is highlighted in Figure 56.

R. Pitre, Systematic Structural Optimization of a Next Generation Lunar Rover Chassis 73
Figure 56 - Chassis Panel Non-Design Space for Riveting Between Panels
The mast beams were included in the model to impart loading on the chassis. Mast beams were
modeled with tetrahedral elements to reduce model complexity as the mast beam performance was not
significant for the chassis stiffness. In fact, the mast beams were modeled individually so they did not
contribute to the chassis stiffness. The chassis and the mast used different element types, which required
the use of a freeze contact definition to connect the two structures. The freeze contact is not a true
contact and is therefore usable in linear static analysis. The freeze contact connects elements with a
master-slave relationship such that displacement is identical for the connected nodes. The freeze contact
definition is highlighted in Figure 57.
Figure 57 - Freeze Contact Definition between Mast and Chassis
Boundary condition modeling for the surface operation load cases were applied at the shaft
connection between the chassis and the suspension structure. The inner portion of the shaft was
extended towards the centre of the chassis slightly to apply a boundary condition. The boundary

R. Pitre, Systematic Structural Optimization of a Next Generation Lunar Rover Chassis 74
conditions were defined such that the three shafts (two connected to drive units and one to the rear yoke)
were simply supported. The boundary condition definition for these shafts is highlighted in Figure 58. The
drive unit shafts were capable of rotation about the y-axis and were able to pivot about the x-axis,
allowing the chassis to rest on the shafts. The rear shaft was able to pivot about the y-axis to allow the
chassis to rest on this shaft as well. The constraints allowed the chassis to deform along the roll axis due
to the release of the DOF along the direction of the shaft.
Figure 58 - Boundary Condition Definition for Shaft Connections for Surface Loading Conditions
For the rocket loading conditions, the connection system to the landing vehicle was modeled as four
10 mm diameter bolts at locations defined by Neptec Design Group. The bolts were idealized using RBE2
elements and a 5DOF constraint. The connection system to the landing vehicle’s modeling strategy in
Optistruct is shown in Figure 59.

R. Pitre, Systematic Structural Optimization of a Next Generation Lunar Rover Chassis 75
Figure 59 - Hold-Down-Release System Boundary Condition Modeling
The natural frequency modes were modeled using the EIGRL load card which uses the Lanczos
method [32] to solve for eigenvalues. The upper bound of frequency was left blank to allow the solver to
improve solve times. The natural frequency constraints were applied using the FREQ optimization
response cards with the desired mode, and applying a lower limit of 60 Hz to the mode natural frequency.
Displacement constraints for both concepts were applied on all component and subsystem
connection points as well as at random intervals on the structure. Displacement constraints are the same
for all load cases. The displacement constraint locations for Concept #1 and Concept #4 are shown in
Figure 60.
Figure 60 - Displacement Constraint Locations for (Left) Concept #1 and (Right) Concept #4
The chassis volume fraction constraint was applied by using the mass calculation tool in Optistruct to
determine the total mass of the non-design space and design space. Once these masses were known,

R. Pitre, Systematic Structural Optimization of a Next Generation Lunar Rover Chassis 76
the design space mass was reduced to the desired value and the volume fraction required for this
reduction was recorded.
The following optimization control settings were used for the topology optimization to improve
optimization results:
DESMAX = 100 (prevents more than 100 iterations for solution)
MINDIM = 10 (Minimum dimension of thin features set to 4x element size to improve manufacturability)
MATINIT = 0.25 (density starting iteration)
MINDENS = 0.01 (minimum density)
Checker = 1 (check for checkerboard element generation of alternating density of 1 & 0)
Discrete = 3 (typical penalization factor)
The resulting meshed geometry is shown for Concept #1 in Figure 61 and Concept #4 in Figure 62. A
higher resolution image can be seen in Figure 92 in the Appendix.
Figure 61 - Concept #1 Meshed Geometry

R. Pitre, Systematic Structural Optimization of a Next Generation Lunar Rover Chassis 77
Figure 62 - Concept #4 Meshed Geometry
The optimization was completed on a Windows based machine with an 8CPU i7 (3.07 GHz)
processor, and 24 GB RAM (1333MHz). The solver used was Hyperworks© Optistruct and the total
solution time for a single topology optimization was approximately 5 days of continuous run time (wall
clock time).
5.3 Preliminary Design Creation
The topology optimization results highlighted in this section mathematically satisfy design constraints,
however the results were not mechanically viable. Therefore the results required significant post-
processing to produce a mechanically feasible design. The post-processing was required to remove
unnecessary features, simplify geometry, and determine connectivity. Despite the minimum member
thickness definition it is common to have small features (less than 5 mm), which can dramatically reduce
manufacturability while not increasing performance significantly. In addition, many features had complex
curvature which was replicated with relatively high tolerance while maintaining similar performance.
Connectivity was highly dependent on panel thicknesses and therefore, the bulk of work for connectivity
was completed in the Detailed Design Stage. However, the connection detail between the body panels
and the chassis were mostly independent of chassis structure thickness and therefore these items were
modeled with slightly higher fidelity. The chassis structure was a space frame structure which was sealed
by the addition of sheet metal body panels of 2 mm thickness. The body panels contributed to the overall
chassis stiffness though their primary function was to seal the chassis and protect the internal
components from environmental hazards such as cosmic radiation and dust.
After consulting the Queen’s University Mechanical Engineering Department Machine Shop
employees, it was determined that the most cost effective method for manufacturing would be water jet or
laser cutting of sheet metal to form the chassis structure panels. This method influenced the topology
optimization design space and in the Preliminary Design Creation all design decisions must consider how
the decision will enable the panel structure to be machined. This process was entirely based on
engineering judgement and therefore was highly subjective. Regardless, the final design was both

R. Pitre, Systematic Structural Optimization of a Next Generation Lunar Rover Chassis 78
lightweight and mechanically feasible. The preliminary designs for Concept #1 and Concept #4 were
rendered in Solidworks and can be seen in Figure 63 and Figure 64, respectively.
Figure 63 - Concept #1 Chassis Preliminary Design with Varying Opacity of Body Panels

R. Pitre, Systematic Structural Optimization of a Next Generation Lunar Rover Chassis 79
Figure 64 - Concept #4 Chassis Preliminary Design with Varying Opacity of Body Panels
It can be seen that both designs have substantial material removal from the initial bounding box
topology. Both designs have the body panels (2 mm thickness) mounted to the outside of the chassis
structures via fasteners. The fasteners are not included in the preliminary design, however the fastener
holes were considered to be 2.5 mm radius holes as was seen for the baseline chassis. The preliminary
designs for both concepts would not be costly to produce, as the cost of cutting patterns into sheet metal
is low. The cost of fastening would be relatively expensive as the number of fasteners is large. Also,
fastening the body panels to the space frame would require the addition of custom fasteners or some
fastening surfaces such as angle beams. For simplicity, it was assumed that the preliminary designs had

R. Pitre, Systematic Structural Optimization of a Next Generation Lunar Rover Chassis 80
the panels perfectly attached to each other until the optimum thicknesses are determined. Due to the
addition of body panels, the thickness of all panels was reduced to 5mm. However, it was found that
exceedingly high stress resulted in the base plate and side plates for both concepts; therefore the
thickness of these components was increased to 10 mm for the preliminary designs.
Body panels are required to protect the chassis from radiation and therefore are not considered as
design space. For this reason they were omitted from the topology optimization task. Structural validation
was completed by meshing the preliminary chassis designs and inserting the new chassis mesh into the
topology optimization model. In this way, the load case considerations were identical to those previously
defined. The preliminary designs for both concepts included external body panels, which were fastened to
the chassis. The connections are realized using RBE2 elements. The meshed preliminary designs for
Concept #1 and Concept #4 are shown in Figure 65.
Figure 65 - (Left) Concept #1 and (Right) Concept #4 Meshed Preliminary Design Chassis
The results for each concept for each load case are shown in Table 11.

R. Pitre, Systematic Structural Optimization of a Next Generation Lunar Rover Chassis 81
Table 11 - Preliminary Design Structural Performance Summary
Load Case
Concept #1 Preliminary Design Concept #4 Preliminary Design
Maximum Displacement (mm)
Maximum Stress (MPa)
Maximum Displacement (mm)
Maximum Stress (MPa)
Skid Steering 0.424 43.88 0.385 139.4
Obstacle Interaction
0.439 30.40 0.680 121.1
Drilling Operation 0.118 12.04 0.219 259.7
Inertial Loading X-Direction
0.594 293.4 5.671 519.9
Inertial Loading Y-Direction
0.561 397.2 2.879 466.4
Inertial Loading Z-Direction
1.366 418.3 8.146 381.9
In general, the maximum stress for each chassis occurred at the shaft connections for the surface
load cases and at the landing vehicle connection bolt locations for the inertial loads. The inertial load
cases had higher displacements and stresses than the surface load cases, which is not surprising due to
the magnitude of acceleration applied to the vehicle.
For Concept #1, the most severe load case was the inertial loading in the Z-direction. However, the
maximum stress was not accurate as the model did not have a sufficiently dense mesh to capture the
local behavior at the bolt connections. If a sufficiently dense mesh was achieved, the model would be
unable solve with the available computing power. The stress concentration was highlighted in Figure 66.
If the near bolt region was used, the maximum stress was less than 200 MPa for the z-direction inertial
loading.

R. Pitre, Systematic Structural Optimization of a Next Generation Lunar Rover Chassis 82
Figure 66 - Stress Concentration at Hold-Down-Release Bolt Hole in Concept #1
The stress contour for Concept #1 inertial loading in the z-direction is shown in Figure 67. The legend
was modified to cap the maximum stress at 200 MPa. It can be seen that the structure was mostly loaded
at the landing vehicle connection points. This is expected as the bolt modeling assumes a perfectly rigid
lander which results in high stresses at the boundary conditions.
Figure 67 - Concept #1 Stress Contour for Inertial Loading in Z-Direction
The stress contour for Concept #4 inertial loading in the z-direction is shown in Figure 68. The legend
was modified to limit the maximum stress to 200 MPa. It can be seen that the structure was again loaded
at the landing vehicle connection points but also at some sharp corners on the top of the chassis and
near the inside shaft connections. The stress concentrations at the corners were expected due to the
mesh density.
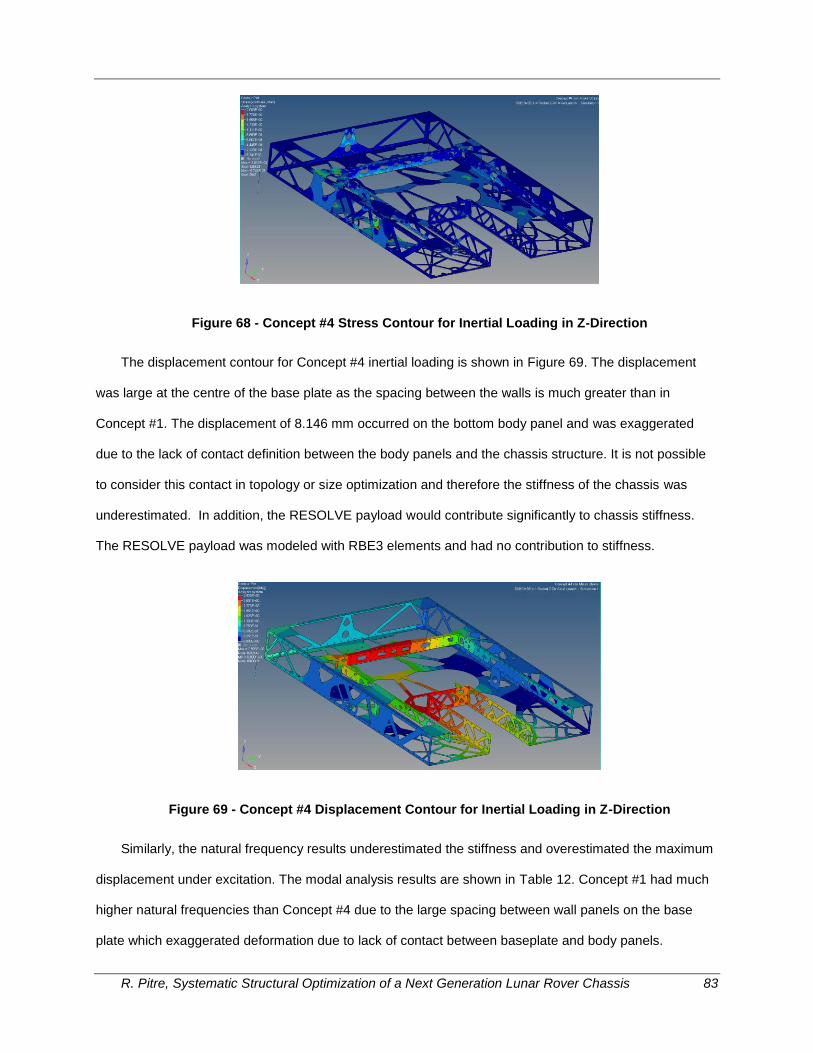
R. Pitre, Systematic Structural Optimization of a Next Generation Lunar Rover Chassis 83
Figure 68 - Concept #4 Stress Contour for Inertial Loading in Z-Direction
The displacement contour for Concept #4 inertial loading is shown in Figure 69. The displacement
was large at the centre of the base plate as the spacing between the walls is much greater than in
Concept #1. The displacement of 8.146 mm occurred on the bottom body panel and was exaggerated
due to the lack of contact definition between the body panels and the chassis structure. It is not possible
to consider this contact in topology or size optimization and therefore the stiffness of the chassis was
underestimated. In addition, the RESOLVE payload would contribute significantly to chassis stiffness.
The RESOLVE payload was modeled with RBE3 elements and had no contribution to stiffness.
Figure 69 - Concept #4 Displacement Contour for Inertial Loading in Z-Direction
Similarly, the natural frequency results underestimated the stiffness and overestimated the maximum
displacement under excitation. The modal analysis results are shown in Table 12. Concept #1 had much
higher natural frequencies than Concept #4 due to the large spacing between wall panels on the base
plate which exaggerated deformation due to lack of contact between baseplate and body panels.
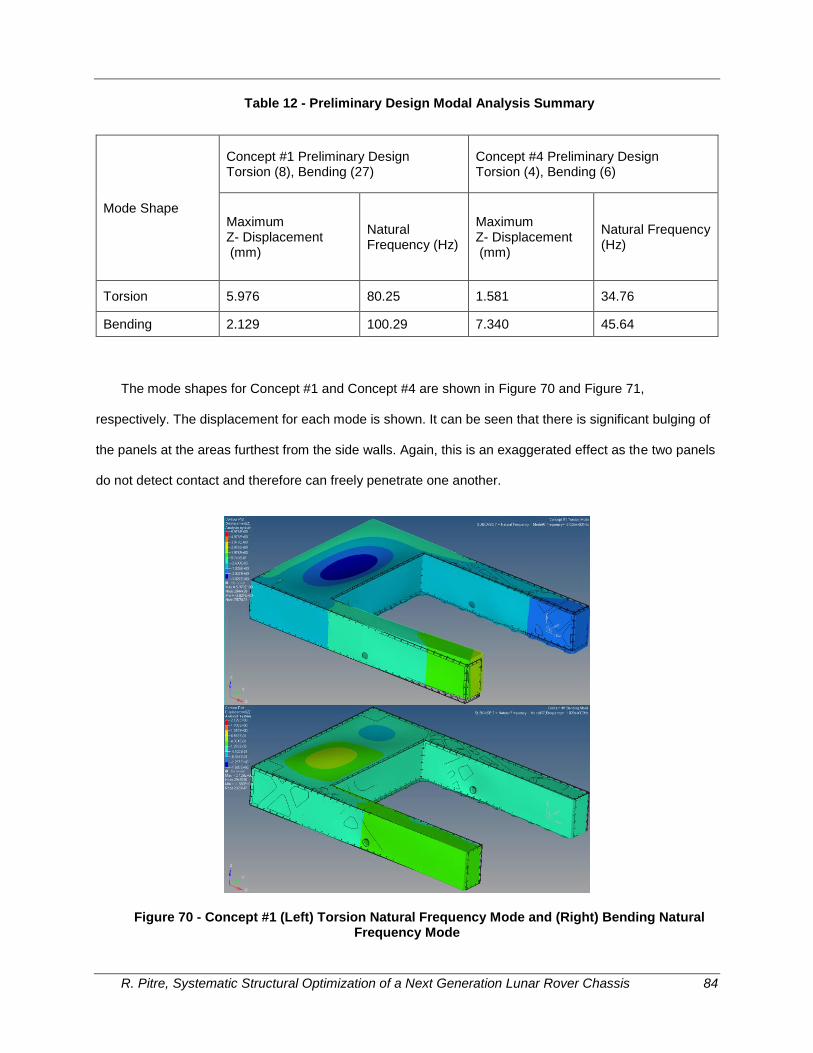
R. Pitre, Systematic Structural Optimization of a Next Generation Lunar Rover Chassis 84
Table 12 - Preliminary Design Modal Analysis Summary
Mode Shape
Concept #1 Preliminary Design Torsion (8), Bending (27)
Concept #4 Preliminary Design Torsion (4), Bending (6)
Maximum Z- Displacement (mm)
Natural Frequency (Hz)
Maximum Z- Displacement (mm)
Natural Frequency (Hz)
Torsion 5.976 80.25 1.581 34.76
Bending 2.129 100.29 7.340 45.64
The mode shapes for Concept #1 and Concept #4 are shown in Figure 70 and Figure 71,
respectively. The displacement for each mode is shown. It can be seen that there is significant bulging of
the panels at the areas furthest from the side walls. Again, this is an exaggerated effect as the two panels
do not detect contact and therefore can freely penetrate one another.
Figure 70 - Concept #1 (Left) Torsion Natural Frequency Mode and (Right) Bending Natural Frequency Mode

R. Pitre, Systematic Structural Optimization of a Next Generation Lunar Rover Chassis 85
Figure 71 - Concept #4 (Left) Torsion Natural Frequency Mode and (Right) Bending Natural Frequency Mode
The results of the topology optimization can be considered accurate as the provided loading
conditions are well captured using the modeling techniques shown in Section 5.2 . Topology optimization
considers global behaviour of the system due to the use of compliance as an objective function.
Therefore the chassis design produced by the topology optimization is only optimum for the load cases it
was designed for. It is evident that these load cases are much more severe than the surface load cases
and will cause a stronger influence on the optimum topology.
The structural analysis for verification of Concept #1 and Concept #4 can also be said to have
accurate load case modeling as the topology optimization and structural analysis models use the same
load case definitions. However, the introduction of the body panels during the preliminary design creation
task resulted in some model idealization errors due to lack of contact between the body panel and
chassis structure elements. The positive aspect of this error is that the chassis is inherently less stiff in the
model as the panels act somewhat independently. In reality, contact between the body panels and the

R. Pitre, Systematic Structural Optimization of a Next Generation Lunar Rover Chassis 86
chassis structure will improve structural performance. Therefore, the model is conservative which reduces
accuracy of the model but reduces risk of failure in the final design.
Despite the error in the structural analysis model, some interesting comparisons can be made
between Concept #1 and Concept #4. For structural performance, Concept #1 greatly outperformed
Concept #4. The natural frequency of Concept #1 was much higher than Concept #4, implying better
stiffness in Concept #1. In addition to this, the maximum stress and displacement were lower as a whole
when accounting for stress singularities in the model. This was due to Concept #4 having a larger, less
supported baseplate than Concept #1. Concept #1 has a smaller rear section that is better supported by
the side walls than Concept #4 which allows Concept #4’s base plate to bulge more. However, Concept
#4’s results are more negatively affected by the lack of contact considerations and therefore the actual
difference in performance is probably less extreme. The final mass for both concept (neglecting
fasteners) is summarized in Table 13.
Table 13 - Mass Summary for Preliminary Designs
Preliminary Chassis Design Post Optimization Mass (kg)
Concept #1 32.72
Concept #4 37.54
The addition of body panels increased the mass significantly, however size optimization typically
reduces the mass further in efforts to obtain a final design mass of 25.6 kg at maximum. In addition to
having superior structural performance, Concept #1 had a lower total mass of 32.72 kg while Concept #4
was slightly heavier at 37.54 kg. Both concepts were well above the final desired weight of 25.6 kg;
however the preliminary designs had arbitrarily large assigned thicknesses to allow for adjustment using
size optimization. Many panels had low stresses, which presented some opportunities for panel thickness
reduction. The panel area was quite large and therefore even small thickness changes of an individual
panel would result in significant changes in chassis mass.

R. Pitre, Systematic Structural Optimization of a Next Generation Lunar Rover Chassis 87
During the topology optimization process, it became clear that the initial design space definition had a
crucial role in the results even for the same loading conditions. Using shell elements instead of solid
elements for the same geometry dramatically improved the results. Also, the definition of the rivet
mounting structure as non-design space reduced the required post-processing for the design. It was
considered that topology optimization also model body panels but due to the lack of contact between the
panels there was concern that the load paths developed would not be representative of the true paths.
Therefore, the chassis structure was created first so that load paths within the chassis would be correctly
considered and then the size optimization step would refine panel thickness considered body panel
implementation.

R. Pitre, Systematic Structural Optimization of a Next Generation Lunar Rover Chassis 88
6.0 Chapter 6: Detailed Design Stage
The Detailed Design Stage consisted of the size optimization and detailed design production tasks.
The size optimization task achieved high fidelity by using sophisticated load case definition, realistic
consideration of body panels, and a developed preliminary design. The load case definition was identical
to the load case definition in the Preliminary Design Stage, which included surface operation, launch
vehicle acceleration and modal analysis load cases.
6.1 Detailed Design Stage Philosophy
The preliminary design models created for verification of structural load cases were used to create
the size optimization model. Size optimization was used to determine the optimum thickness for each
panel to satisfy structural requirements while minimizing weight. Following size optimization, the detailed
designs were created by realizing the size optimization results into the preliminary optimum designs and
considering joining of all parts. The detailed designs were then compared in a trade-off study. After the
trade-off study, the best performing concept was chosen as the final optimum design. The software
interaction for the size optimization task was unchanged from Figure 46.
The Detailed Design Stage goal was to refine the preliminary designs by optimizing structural panel
thickness while satisfying structural constraints. The preliminary designs were well-defined such that the
only changes applied in the Detailed Design Stage were panel thickness and some minor panel size
changes to accommodate joining requirements. The preliminary designs were defined considering a
space-frame structure with fastener connections between structural panels as well as between structural
and body panels. It was not recommended to change the manufacturing style in the detailed design stage
as it would reduce optimality of the design due to design space changes. Therefore, changes to the
manufacturing style should be introduced at the beginning of the Preliminary Design Stage. The body
panel shells were modelled as independent shells to more accurately consider the stiffness contribution of
the body panels. The structural panel thickness was allowed to vary between 1 mm and 25.4 mm during
optimization. The 1 mm lower limit was chosen to limit susceptibility of panel buckling, while the upper
limit was chosen to prevent the optimization from producing unreasonably large panels that would be
challenging to integrate into the final design.
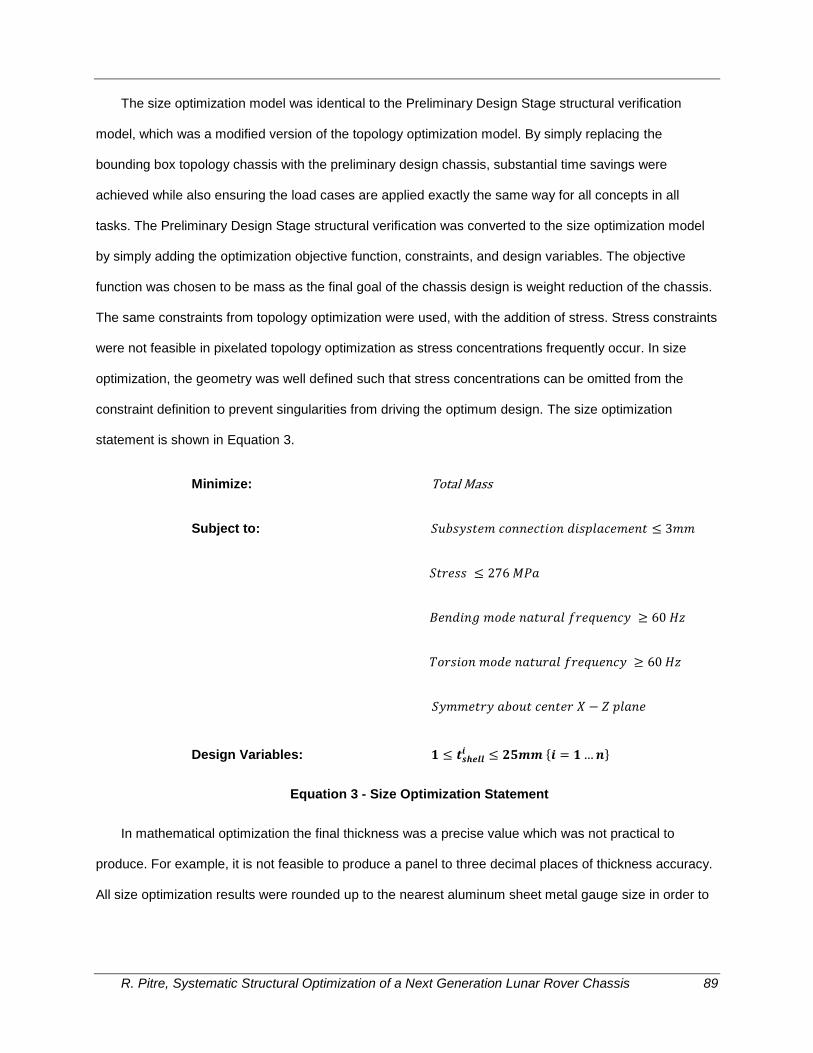
R. Pitre, Systematic Structural Optimization of a Next Generation Lunar Rover Chassis 89
The size optimization model was identical to the Preliminary Design Stage structural verification
model, which was a modified version of the topology optimization model. By simply replacing the
bounding box topology chassis with the preliminary design chassis, substantial time savings were
achieved while also ensuring the load cases are applied exactly the same way for all concepts in all
tasks. The Preliminary Design Stage structural verification was converted to the size optimization model
by simply adding the optimization objective function, constraints, and design variables. The objective
function was chosen to be mass as the final goal of the chassis design is weight reduction of the chassis.
The same constraints from topology optimization were used, with the addition of stress. Stress constraints
were not feasible in pixelated topology optimization as stress concentrations frequently occur. In size
optimization, the geometry was well defined such that stress concentrations can be omitted from the
constraint definition to prevent singularities from driving the optimum design. The size optimization
statement is shown in Equation 3.
Minimize: Total Mass
Subject to: 𝑆𝑢𝑏𝑠𝑦𝑠𝑡𝑒𝑚 𝑐𝑜𝑛𝑛𝑒𝑐𝑡𝑖𝑜𝑛 𝑑𝑖𝑠𝑝𝑙𝑎𝑐𝑒𝑚𝑒𝑛𝑡 ≤ 3𝑚𝑚
𝑆𝑡𝑟𝑒𝑠𝑠 ≤ 276 𝑀𝑃𝑎
𝐵𝑒𝑛𝑑𝑖𝑛𝑔 𝑚𝑜𝑑𝑒 𝑛𝑎𝑡𝑢𝑟𝑎𝑙 𝑓𝑟𝑒𝑞𝑢𝑒𝑛𝑐𝑦 ≥ 60 𝐻𝑧
𝑇𝑜𝑟𝑠𝑖𝑜𝑛 𝑚𝑜𝑑𝑒 𝑛𝑎𝑡𝑢𝑟𝑎𝑙 𝑓𝑟𝑒𝑞𝑢𝑒𝑛𝑐𝑦 ≥ 60 𝐻𝑧
𝑆𝑦𝑚𝑚𝑒𝑡𝑟𝑦 𝑎𝑏𝑜𝑢𝑡 𝑐𝑒𝑛𝑡𝑒𝑟 𝑋 − 𝑍 𝑝𝑙𝑎𝑛𝑒
Design Variables: 𝟏 ≤ 𝒕𝒔𝒉𝒆𝒍𝒍𝒊 ≤ 𝟐𝟓𝒎𝒎 {𝒊 = 𝟏 … 𝒏}
Equation 3 - Size Optimization Statement
In mathematical optimization the final thickness was a precise value which was not practical to
produce. For example, it is not feasible to produce a panel to three decimal places of thickness accuracy.
All size optimization results were rounded up to the nearest aluminum sheet metal gauge size in order to

R. Pitre, Systematic Structural Optimization of a Next Generation Lunar Rover Chassis 90
reduce cost of chassis production. In instances where the thickness was too large for standard gauge
sizing, the thickness was rounded up to the nearest quarter of an inch.
In addition to the sheet metal gauge changes, the panel exterior dimensions required some
adjustment following the thickness changes to ensure that all panels joined together as desired. Panels
were typically extended to ensure that the spacing between fastener holes and the edge of the panels
was never decreased. Panels were also extended to ensure that consistent spacing existed between
perpendicular panels to allow for angle brackets to be used to bolt or rivet plates together.
Once the final changes were made to the detailed designs final comparisons can be made as no
further changes were applied to the chassis designs. Final selection of the best performing concept
detailed design was based on the relative performance of mass, structural and thermal robustness,
manufacturability, and cost. The nodal displacement constraint was reduced to 3 mm due to some of the
large deflections seen in the Preliminary Design Stage verification analysis. In addition, a stress
constraint was added to prevent yielding of the chassis material. Due to external time constraints imposed
by Neptec’s scheduled timeline, mesh convergence was not possible, and therefore some stress
singularities existed in the model. These singularity elements were not included in the stress constraint
definition to prevent stress singularities from driving the optimization results. The torsion and bending
mode natural frequencies were constrained as they were in the topology optimization task with a lower
limit of 60 Hz based on Neptec’s requirements. Finally, the shell thickness was limited to 1 mm as a lower
limit to prevent buckling from becoming the failure mode, and the upper limit of 25.4 mm was chosen to
prevent challenges in integrating panels into the detailed designs.
6.2 Size Optimization
Size optimization models were created in Hypermesh for solving with Optistruct. The size
optimization model was the same as the Preliminary Design Stage verification analysis model, which was
the same as the topology optimization model. Assumptions made for the size optimization task were
mostly based on the topology optimization assumptions that were originally outlined in the Preliminary
Design Stage report. The size optimization task is subject to the following assumptions:
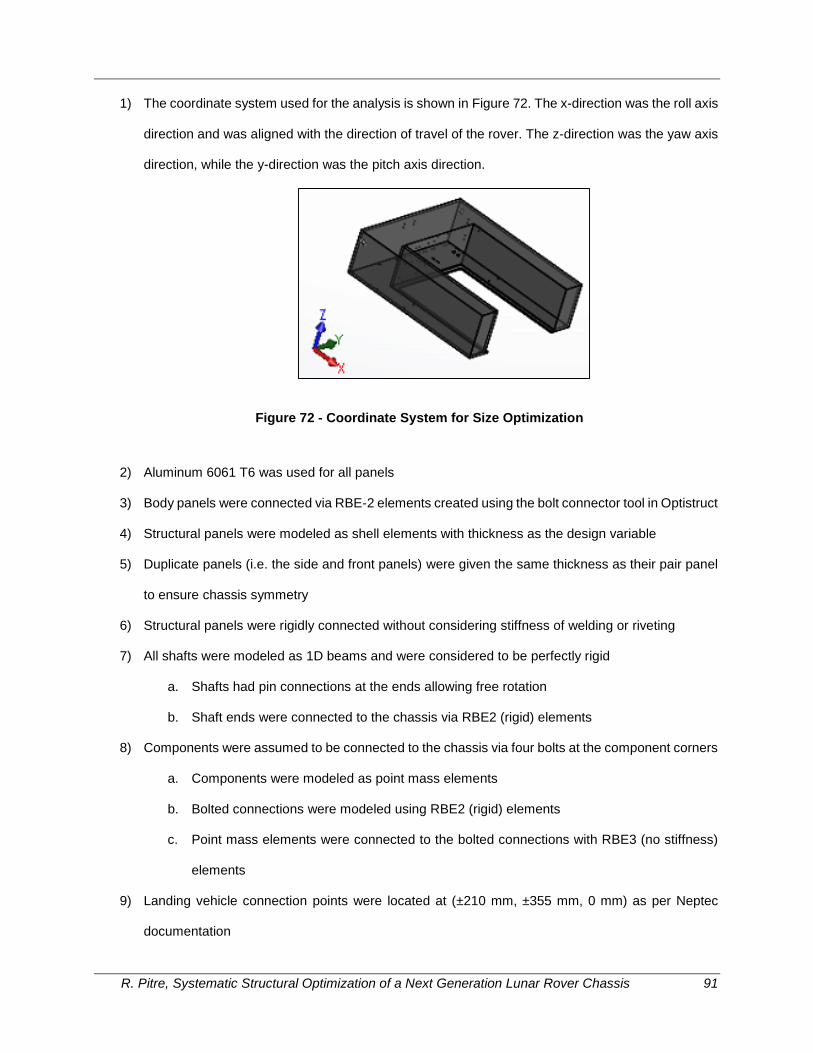
R. Pitre, Systematic Structural Optimization of a Next Generation Lunar Rover Chassis 91
1) The coordinate system used for the analysis is shown in Figure 72. The x-direction was the roll axis
direction and was aligned with the direction of travel of the rover. The z-direction was the yaw axis
direction, while the y-direction was the pitch axis direction.
Figure 72 - Coordinate System for Size Optimization
2) Aluminum 6061 T6 was used for all panels
3) Body panels were connected via RBE-2 elements created using the bolt connector tool in Optistruct
4) Structural panels were modeled as shell elements with thickness as the design variable
5) Duplicate panels (i.e. the side and front panels) were given the same thickness as their pair panel
to ensure chassis symmetry
6) Structural panels were rigidly connected without considering stiffness of welding or riveting
7) All shafts were modeled as 1D beams and were considered to be perfectly rigid
a. Shafts had pin connections at the ends allowing free rotation
b. Shaft ends were connected to the chassis via RBE2 (rigid) elements
8) Components were assumed to be connected to the chassis via four bolts at the component corners
a. Components were modeled as point mass elements
b. Bolted connections were modeled using RBE2 (rigid) elements
c. Point mass elements were connected to the bolted connections with RBE3 (no stiffness)
elements
9) Landing vehicle connection points were located at (±210 mm, ±355 mm, 0 mm) as per Neptec
documentation

R. Pitre, Systematic Structural Optimization of a Next Generation Lunar Rover Chassis 92
a. The bolted connections were considered to attach the chassis to a perfectly rigid platform,
such that the bolted connections constrain 5 DOF (DX,DY,DZ,RX,RY)
10) Mast beams were modeled as individual beams at an 85° elevation
11) Mast components were modeled as four point masses located at the top of each mast, with the
total mass of mast components equally divided amongst mast beams
12) The suspension structure geometry captured the allowable design space of the suspension
structure
13) Wheel geometry models were created from measurements in Neptec documentation, and wheels
were considered to be perfectly connected to the suspension structure
a. Wheels were unconstrained except for the launch vehicle load cases, where the wheels
were assumed to be constrained in the yaw axis direction at the base of the wheels
b. Wheel loading was applied as point forces as local behaviour of the wheel was not
important
14) The RESOLVE payload was modeled in the same manner as other components. The drill loading
was considered to be a 10 N vertical (+Z) reaction force and a 30000 Nmm vertical (+Z) reaction
moment. These loads were applied at the ground (350 mm below payload) at the centre of the
payload (⅓ x-length from the front of the rover along centre line)
15) A safety factor of 2 was applied to all load cases based on Neptec Design Group’s
recommendation
16) Torsion and bending modes were determined by visual inspection of modal analysis and lowest
modes for torsion and bending are chosen
17) Masts were connected to the chassis using freeze contacts in Optistruct, which mapped
displacement from the master surface to the slave surface.
The size optimization considered the same seven load cases that were considered in the Preliminary
Design Stage. These load cases were described in Section 5.2 . The normal modes analysis was solved
for the first 30 modes with the constraints used in the inertial loading load cases. This load case was used
to ensure that the torsion and bending modes had sufficiently high natural frequencies. The mode
numbers for the torsion and bending modes were found by reviewing the Preliminary Design Stage

R. Pitre, Systematic Structural Optimization of a Next Generation Lunar Rover Chassis 93
verification models. For Concept #1, it was found that the bending mode was mode #27 while the torsion
mode was mode #8. These modes were also used in the Preliminary Design Stage verification analysis.
The mode shapes for Concept #1 are shown in Figure 73.
Figure 73 - Concept #1 (Left) Bending Mode (Mode #27) and (Right) Torsion Mode (Mode #8)
For Concept #4, it was found that the bending mode was mode #30 while the torsion mode was
mode #19. In order to improve size optimization results, higher modes were required for Concept #4 as
the lower modes focus on the oscillation of the body panels which are largely unsupported at their mid-
section. Higher modes ignore the body panels and isolate the chassis structure, which was more
important to the overall performance of the chassis. The mode shapes for Concept #4 are shown in
Figure 74.
Figure 74 - Concept #1 (Left) Bending Mode (Mode #30) and (Right) Torsion Mode (Mode #19)
The natural frequency modes were modeled using the EIGRL load card which uses the Lanczos
method to solve for eigenvalues. The upper bound of frequency was left blank to allow the solver to
improve solve times. The natural frequency constraints were applied using the FREQ optimization
response cards with the desired mode, and applying a lower limit of 60 Hz to the mode natural frequency.

R. Pitre, Systematic Structural Optimization of a Next Generation Lunar Rover Chassis 94
Displacement constraints for both concepts were applied on all component and subsystem
connection points as well as at random intervals on the structure. The displacement constraints were
applied to all load cases. The displacement constraint locations for Concept #1 and Concept #4 are
shown in Figure 75.
Figure 75 - Displacement Constraint Locations for (Left) Concept #1 and (Right) Concept #4
Stress constraints were applied to all chassis structure panel elements with the exception of the
singularity elements. These elements occur at corners where three panels meet as well as at the
boundary condition elements. The omitting of stress singularity elements is highlighted in Figure 76, with
grey elements omitted from the stress constraint consideration.
Figure 76 – Stress Singularity Elements (Highlighted in Grey) that are omitted from Stress Constraints
No additional optimization settings were required for Size Optimization. The resulting meshed
geometry is shown for Concept #1 in Figure 77 and Concept #4 in Figure 78.

R. Pitre, Systematic Structural Optimization of a Next Generation Lunar Rover Chassis 95
Figure 77 - Concept #1 Meshed Geometry
Figure 78 - Concept #4 Meshed Geometry
The size optimization desired results were the optimum thickness of all structural panels for both
concepts. Due to the mathematical nature of the optimization, the optimum panel thickness was reported
with many decimal places of accuracy, which was not feasible to achieve when manufacturing the panels.
In addition, it is more cost efficient to realize the size optimization results into aluminum sheet metal
gauge sizes to reduce cost of manufacturing. For panel thicknesses greater than typical sheet metal
gauges, the panel thickness was rounded up to the nearest quarter of an inch. The panel thickness
results for Concept #1 and Concept #4 are shown in Table 14 and Table 15, respectively.

R. Pitre, Systematic Structural Optimization of a Next Generation Lunar Rover Chassis 96
Table 14 – Concept #1 Size Optimization Panel Thickness Results
Concept #1
Panel Name Size Optimization Thickness (mm) Sheet Metal Gauge Final Thickness (mm)
Base Plate 3.897 6 4.115
Front Plates 1.000 13 1.016
Rear Plate 1.000 13 1.016
Side Plates 3.427 2 3.635
RESOLVE Rear Plate
3.947 1 4.083
RESOLVE Side Plates
1.375 10 1.438
Top Plate 1.000 13 1.016
The panel thickness requirements for Concept #1 were relatively low which allows for substantial
weight savings. It can be seen that the majority of the load was taken by the base plate, the exterior side
plates (nearest the drive units) and the plate behind the RESOLVE payload. These were expected to take
load, as the base plate holds all components, the side plates take the majority of the load from the shafts,
and the plate behind RESOLVE bridges between the landing vehicle bolt connections at the rear of the
chassis.

R. Pitre, Systematic Structural Optimization of a Next Generation Lunar Rover Chassis 97
Table 15 – Concept #4 Size Optimization Panel Thickness Results
Concept #4
Panel Name Size Optimization Thickness (mm) Sheet Metal Gauge
Final Thickness (mm)
Base Plate 8.947 00 9.266
Side Plates 12.650 00000 13.119
Top Plate 15.050 000000 14.732
Rear Plate 4.273 6 4.115
RESOLVE Base Plate 5.230 4 5.189
Front Plates 1.950 12 2.052
RESOLVE Rear Plate 25.400 N/A 25.4
RESOLVE Side Plates 9.262 00 9.266
Under RESOLVE Rear Plate
4.418 0 4.585
Under RESOLVE Side Plates
1.430 15 1.45
Shaft Connection Plates 20.840 N/A 20.6375
The panel thickness requirements for Concept #4 were unreasonably large, especially when
compared to Concept #1. After review of the design, it was clear that due to the lack of stiffness
contribution of the RESOLVE payload, the chassis lacks stiffness when subjected to acceleration loading
in the Z-direction. The chassis was not well suited to support the large mass of the RESOLVE payload,
which resulted in the RESOLVE base plate deforming substantially which in turn resulted in a chassis
with poor torsion and bending stiffness. After size optimization, it was clear that the Concept #4 bounding
box topology would need to be revised if future work were to be considered.
6.3 Detailed Design Creation
While the size optimization results highlighted in Section 6.2 were immediately post-processed to
provide easily obtainable material thickness, the design required fine-tuning to ensure connection was
possible between panels. This was realized by extending panels to maintain spacing between rivet holes
for perpendicular panels. The amount of work required to create the detailed designs was much smaller
than the creation of the preliminary designs as all of the rivet holes had previously been defined. The
detailed designs for Concept #1 and Concept #4 were rendered in Solidworks and can be seen in Figure
and Figure 64, respectively.

R. Pitre, Systematic Structural Optimization of a Next Generation Lunar Rover Chassis 98
Figure 79 - Concept #1 Chassis Detailed Design with Varying Opacity of Body Panels

R. Pitre, Systematic Structural Optimization of a Next Generation Lunar Rover Chassis 99
Figure 80 - Concept #4 Chassis Preliminary Design with Varying Opacity of Body Panels
The final design mass for both concepts (neglecting fasteners) is summarized in Table 16.
Table 16 - Mass Summary for Detailed Designs
Detailed Chassis Design Mass (kg)
Concept #1 19.61
Concept #4 47.79

R. Pitre, Systematic Structural Optimization of a Next Generation Lunar Rover Chassis 100
It can be seen that Concept #1 was significantly lighter than Chassis #4 due to the large thicknesses
required for Concept #4. Both designs have the body panels mounted to the outside of the chassis
structures via fasteners. The fasteners are not shown in the detailed designs, however the fastener holes
were considered to be 2.5 mm radius holes as was seen for the baseline chassis. The detailed designs
for both Concept #1 would have significantly less material cost due to the lower thickness and would be
relatively cheap to produce, as the cost of cutting patterns into sheet metal is low. The cost of fastening
would be relatively expensive as the number of fasteners is large. Angle beams had been placed in the
detailed designs to allow for some connection between perpendicular plates.
Concept #1 achieves a 38.7% weight reduction from the baseline chassis which is a tremendous
success. Concept #4, on the other hand, achieves a 49.3% mass increase from the baseline chassis
which would indicate that a redesign of Concept #4 is required to allow for similar performance to
Concept #1. In particular, re-evaluating the interaction between the chassis structure and the landing
vehicle connections, as well as bridging the gap between shaft connections would dramatically improve
the performance of Concept #4.

R. Pitre, Systematic Structural Optimization of a Next Generation Lunar Rover Chassis 101
7.0 Chapter 7: Final Design Performance
The results for both detailed design concepts for each load case are shown in Table 17.
Table 17 - Detailed Design Structural Performance Summary
Load Case
Concept #1 Detailed Design Concept #4 Detailed Design
Maximum Displacement (mm)
Maximum Stress (MPa)
Maximum Displacement (mm)
Maximum Stress (MPa)
Skid Steering 0.580 77.44 0.245 73.02
Obstacle Interaction
0.357 46.32 0.764 126.5
Drilling Operation 0.114 13.82 0.221 17.31
Inertial Loading X-Direction
0.473 164.4 3.062 268.0
Inertial Loading Y-Direction
0.459 208.0 1.613 268.0
Inertial Loading Z-Direction
1.011 220.5 3.031 268.0
As was seen in the Preliminary Design Stage, the maximum stress for each chassis occurred at the
shaft connections for the surface load cases and at the hold-down-release bolt locations for the inertial
loads. Reported stress results ignore high stresses at singularity elements such as the shaft connection
and boundary condition elements. The inertial load cases had weaker performance than the surface load
cases, which is not surprising due to the magnitude of acceleration applied to the vehicle.
The stress contour for Concept #1 inertial loading in the z-direction is shown in Figure 81. The legend
was modified to truncate the maximum stress at 276 MPa. It can be seen that the structure was mostly
stressed at the landing vehicle connection points. This was expected as the bolt modeling assumes a
perfectly rigid lander which resulted in high stresses at the boundary conditions. Despite the lower
thickness it was clear that the performance of Concept #1 is much greater than Concept #4.
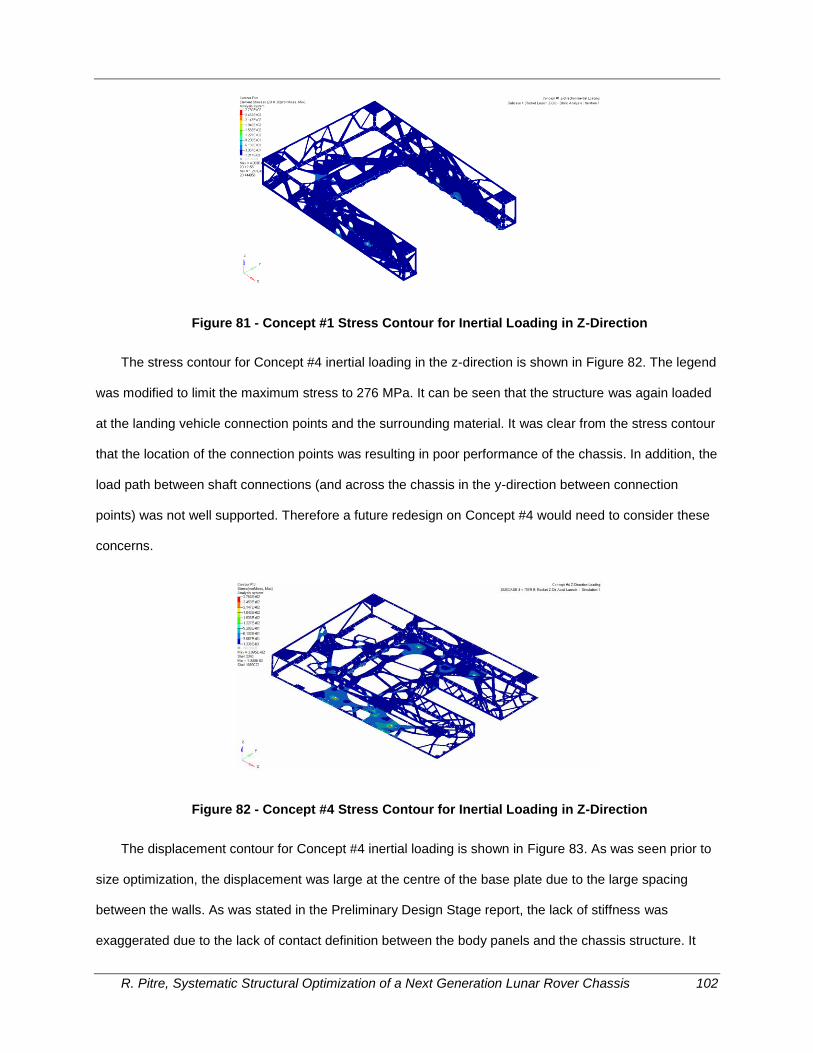
R. Pitre, Systematic Structural Optimization of a Next Generation Lunar Rover Chassis 102
Figure 81 - Concept #1 Stress Contour for Inertial Loading in Z-Direction
The stress contour for Concept #4 inertial loading in the z-direction is shown in Figure 82. The legend
was modified to limit the maximum stress to 276 MPa. It can be seen that the structure was again loaded
at the landing vehicle connection points and the surrounding material. It was clear from the stress contour
that the location of the connection points was resulting in poor performance of the chassis. In addition, the
load path between shaft connections (and across the chassis in the y-direction between connection
points) was not well supported. Therefore a future redesign on Concept #4 would need to consider these
concerns.
Figure 82 - Concept #4 Stress Contour for Inertial Loading in Z-Direction
The displacement contour for Concept #4 inertial loading is shown in Figure 83. As was seen prior to
size optimization, the displacement was large at the centre of the base plate due to the large spacing
between the walls. As was stated in the Preliminary Design Stage report, the lack of stiffness was
exaggerated due to the lack of contact definition between the body panels and the chassis structure. It
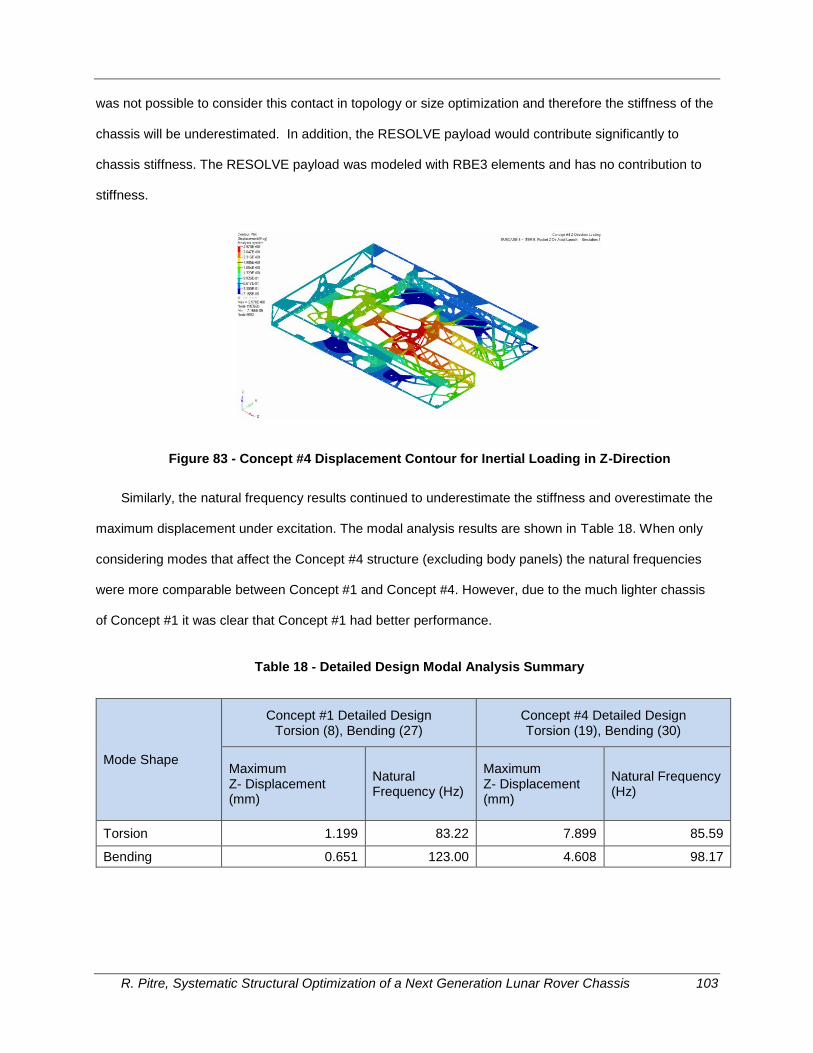
R. Pitre, Systematic Structural Optimization of a Next Generation Lunar Rover Chassis 103
was not possible to consider this contact in topology or size optimization and therefore the stiffness of the
chassis will be underestimated. In addition, the RESOLVE payload would contribute significantly to
chassis stiffness. The RESOLVE payload was modeled with RBE3 elements and has no contribution to
stiffness.
Figure 83 - Concept #4 Displacement Contour for Inertial Loading in Z-Direction
Similarly, the natural frequency results continued to underestimate the stiffness and overestimate the
maximum displacement under excitation. The modal analysis results are shown in Table 18. When only
considering modes that affect the Concept #4 structure (excluding body panels) the natural frequencies
were more comparable between Concept #1 and Concept #4. However, due to the much lighter chassis
of Concept #1 it was clear that Concept #1 had better performance.
Table 18 - Detailed Design Modal Analysis Summary
Mode Shape
Concept #1 Detailed Design Torsion (8), Bending (27)
Concept #4 Detailed Design Torsion (19), Bending (30)
Maximum Z- Displacement (mm)
Natural Frequency (Hz)
Maximum Z- Displacement (mm)
Natural Frequency (Hz)
Torsion 1.199 83.22 7.899 85.59
Bending 0.651 123.00 4.608 98.17

R. Pitre, Systematic Structural Optimization of a Next Generation Lunar Rover Chassis 104
8.0 Chapter 8: Discussions and Conclusions
This research successfully completed the following objectives:
1. Demonstrate the effectiveness of the design optimization methodology in producing robust,
lightweight structural designs of a lunar roving vehicle
2. Complete systematic optimization of the structural design considering required loading criterion
3. Produce multiple robust, lightweight, and low cost manufacturing chassis designs
4. Perform trade-off studies of final optimum designs to produce a final optimum design
recommendation
This research produced the final designs for Concept #1 and Concept #4 using the previously defined
methodology which utilized systematic design optimization techniques. While the research did not
produce multiple robust, lightweight and low cost designs it was incredibly successful in producing one
single optimum design. Concept #1 resulted in a strong performing final design while Concept #4 required
too much material to satisfy structural requirements. Due to the weak performance of Concept #4, a
trade-off study is not meaningful as the difference in performance was so easily seen. A more meaningful
discussion is identifying why the performance difference was so dramatic between the two concepts and
how future designs should learn from the proceedings of this research.
The primary reason Concept #4 had poor performance was the lack of structure connecting the base
plate to the RESOLVE base plate. The RESOLVE base plate was essentially suspended over the base
plate structure, which resulted in low stiffness despite large panel thickness. In addition to this, landing
vehicle connections were not as well supported as in Concept #1. In Concept #1, the spacing between
the side walls and the connection points was relatively small, while the rear connections were bridged by
the RESOLVE rear plate. For Concept #4 to compete with Concept #1, it would either need to move the
connection points or re-design the structure to accommodate the current connection points. By making
this change and developing more support between the RESOLVE base plate and the base plate, Concept
#4 would become much more viable. However, adding more interior structure would result in large
changes to the thermal design of the spacecraft, which would in turn require and additional re-design of
the component layout.

R. Pitre, Systematic Structural Optimization of a Next Generation Lunar Rover Chassis 105
When reviewing the results of Concept #4, it is important to consider the decisions that drove the
design development. Initially, Concept #4 was created manually (with no mathematical basis) to place
components underneath the RESOLVE payload to lower the centre of gravity. Therefore the structural
performance was not considered in the concept generation. The consequence of this process was that
concepts could be generated that were not structurally viable such as Concept #4.
Future design processes should incorporate more quantitative structural considerations into the
concept generation task. The challenge of this task is that adding interior structure will change the
component view factors, which will change the component optimum layout, which will in turn re-define the
bounding box topology. Therefore it may be wise to consider a multi-step optimization where thermal and
structural performances are somehow considered simultaneously. In addition to this consider it may be
beneficial to explore the use of modern polymer and alloy materials to improve weight savings. Material
advances coupled with systematic optimization approaches could reduce structural mass in future
designs.
In addition to a more rigorous concept development approach it would be prudent to consider
additional failure mechanisms of the lunar rover chassis. In this research the modes of failure considered
were displacement in excess of 3 mm at a critical connection location, yield stress at any location, and the
global natural frequency of the chassis in pre-defined modes. These failure modes are useful metrics to
quantify the structural performance, however environmental factors are also crucial to the rover’s mission
success. In future work, quantifying the chassis’ radiation protection, thermal performance, sealing
effectiveness, and random impact loading from micrometeorites or lunar surface hazards would improve
the robustness of the chassis design.
When discussing concept generation, it is interesting to consider how one would define a new
concept with the available knowledge developed during this research. Due to the size of the RESOLVE
payload and with the need to allow for the chassis to drive away from a stuck drill-head, the design of the
chassis is heavily constrained. It is clear that Neptec Design Group had heavily favoured the U-shape
chassis throughout the design development, and it would appear that this is the best option due to the
need to drive away from the drill-head. The only other options are to place the RESOLVE payload above

R. Pitre, Systematic Structural Optimization of a Next Generation Lunar Rover Chassis 106
the chassis, below the chassis, or asymmetrically. None of these options appear to have significant merit,
and placing above the chassis has already been proven to have weak performance. Regarding the U-
shape chassis, it was shown that placing all components on the baseplate is possible with the re-design
of Concept #1 and this has proven to be effective. Having a uniform chassis height improves chassis
performance and Concept #1 accomplishes this task. Therefore it appears that Neptec Design Group’s
baseline design was a well-designed choice for the initial concept, which is not surprising given that
Neptec has spent many years developing their concept.
Despite the legacy concept having superior performance, the project was still successful in reducing
the weight of an already strong concept. A weight reduction of 38.7% should allow for a strong bid for
future lunar rover contracts. This weight savings would result in more than $24M in mass savings by the
estimates of Astrobotic [2]. Overall, this project has shown that design optimization can greatly improve
spacecraft design. In the future, it is recommended to apply design optimization wherever time, expertise,
and funding will allow it. Design optimization is seen as the future in many industries; despite the
conservativeness required for risk management in the development of spacecraft, it is inevitable that
design optimization will be a leading contributor to future spacecraft design.

R. Pitre, Systematic Structural Optimization of a Next Generation Lunar Rover Chassis 107
9.0 References
[1] NASA, "About In-Situ Resource Utilization (ISRU)," 13 June 2013. [Online]. Available: http://www.nasa.gov/exploration/analogs/isru/.
[2] Astrobotic, "Payload User Guide Version 3.0," Pittsburgh, 2015.
[3] Dragon in Space, "Chang'e 3," 8 March 2013. [Online]. Available: http://www.dragoninspace.com/planetary/change3.aspx.
[4] H. R. Williams, J. C. Bridges, R. M. Ambrosi, M. Perkinson, J. Reed, L. Peacocke, N. P. Bannister, S. D. Howe, R. C. O'Brien and A. C. Klein, "Mars reconnaissance lander: Vehicle and Mission Design," Planetary and Space Science, pp. 1621-1631, 2011.
[5] A. D. Torre, A. E. Finzi, G. Genta, F. Curti, L. Schirone, G. Capuano, A. Sacchetti, I. Vukman, F. Mailland, E. Monchieri, A. Guidi, R. Trucco, I. Musso and C. Lombardi, "AMALIA Mission Lunar Rover—The conceptual design of the Team ITALIA Rover, candidate for the Google Lunar X Prize Challenge," Acta Astronautica, pp. 961-978, 2010.
[6] J. Schwender, F. Grimminger, S. Bartsch, T. Kaupisch, M. Yuksel, A. Bresser, J. B. Akpo, M. K. Seydel, A. Dieterle, S. Schmidt and F. Kirchner, "CESAR: A Lunar Crater Exploration and Sample Return Robot," in International Conference on Intelligent Robots and Systems, St. Louis, 2009.
[7] M. J. Roman, "Design and Analysis of a Four Wheeled Planetary Rover," University of Oklahoma Gradaute College, Norman, OK, 2005.
[8] T. D. Taber, "Design and Analysis of a Lightweight Lunar Rover," University of Oklahoma Gradaute College, Norman, OK, 2006.
[9] M. G. Wilson, C. G. Salvo, F. Abilleria, A. J. Sengstacken, A. G. Allwood, P. G. Backes, R. A. Lindemann and J. F. Jordan, "Development of a NASA 2018 Mars Landed Mission Concept," ASCE, pp. 1054-1073, 2010.
[10] A. Seeni, B. Schafer and G. Hirzinger, "Conceptual Rover Design by an Integrated Optimization Process," in International Symposium on Artificial Intelligence, Robotics and Automation in Space,
Sapporo, JP, 2010.
[11] R. Haarmann, R. Jaumann, F. Claasen, M. Apfelbeck, S. Klinkner, L. Richter, J. Schwendner, M. Wolf and P. Hofmann, "Mobile Payload Element (MPE): Concept study for a sample fetching rover for the ESA Lunar Lander Mission," Planetary and Space Science, pp. 283-295, 2012.
[12] P. Zhang, Z. Deng, M. Hu and H. Gao, "Mobility Performance Analysis of Lunar Rover Based on Terramechanics," in International Conference on Advanced Intelligent Mechatronics, Xi'an, China,
2008.
[13] C. G. Salvo and A. Elfving, "Proposed Mars Astrobiology Explorer –Cacher(MAX-C) & ExoMars2018 (MXM-2018)Mission Formulation Status," in 22nd MEPAG Meeting, Monrovia, 2010.

R. Pitre, Systematic Structural Optimization of a Next Generation Lunar Rover Chassis 108
[14] S. D. Howe, R. C. O'Brien, R. M. Ambrosi, B. Gross, J. Katalenich, L. Sailer, J. Webb, M. McKay, J. C. Bridges and N. P. Bannister, "The Mars Hopper: an impulse-driven, long-range, long-lived mobile platform utilizing in situ Martian resources," Journal of Aerospace Engineering, pp. 144-
153, 2011.
[15] X. Luhua, C. Xianfeng and X. Yuan, "The Operations of China’s First Lunar Rover," Beijing Aerospace Control Centre, Beijing, 2012.
[16] B. Harvey, "To the Moon and Mars," China in Space, pp. 311-343, 2013.
[17] P. Blau, "Spaceflight101 Space News," 9 March 2015. [Online]. Available: 2015.
[18] Indian Space Research Organisation, "Chandrayaan - 2," May 2013. [Online]. Available: http://isp.justthe80.com/moon-exploration/chandrayaan---2#TOC-Rover.
[19] Indian Institute of Technology Kanpur, "Indian Institute of Technology Kanpur Lunar Rover Project," 2 July 2013. [Online]. Available: http://www.iitk.ac.in/dord/lunar/dandfab_2.htm.
[20] H. R. Williams, R. M. Ambrosi and N. P. Bannister, "A Mars hopping vehicle propelled by a radioisotope thermal rocket: thermofluid design and materials selection," The Royal Society, pp.
1290-1309, 2010.
[21] Team D.I.A.N.A., "Team D.I.A.N.A. Home Page," March 2013. [Online]. Available: http://www.teamdiana.org/.
[22] G. M. Vanderplaats, "Gradient Based Optimization Image," in DOT User’s Manual Version 2.04,
Goleta, USA, VMA Engineering, 2008.
[23] R. Pantaleo and J. Bourne, "Simulation of Launch Vehicle Dynamics on an Interstage Structure," Carnegie Mellon University, Pittsburgh, 2009.
[24] A. C. Leite and B. Schafer, "Multibody Modeling And Multi-Objective Optimization Of A Sixwheeled," in 1st ESA Workshop on Multibody Dynamics for Space Applications, Noordwijk, NL,
2010.
[25] A. C. Leite and B. Schafer, "Planetary Rover Optimization Tool (ROT)," in XV International Symposium on Dynamic Problems of Mechanics, Rio de Janerio, BR, 2013.
[26] J. Mao and W. Zhang, "Engineering Applications of Satellite Structural Optimization Utilizing ANSYS/CATIA," Applied Mechanics and Materials, pp. 1567-1575, 2011.
[27] A. Ravanbakhsh and S. Franchini, "Multiobjective optimization applied to structural sizing of low cost university-class microsatellite projects," Acta Astronautica, pp. 212-220, 2012.
[28] S. Chen and H. Huang , "Optimum Design of a Space Frame and its Application in Satellite Structure," Journal of Spacecraft and Rockets, pp. 1063-1066, 2010.
[29] I. Pina, K. Yu and H. Huang, "Structural Modeling, Analysis and Optimization Method Comparison for Spacecraft Design," IEEE, pp. 632-636, 2011.
[30] G. F. Abdelal, J. E. Cooper and A. J. Robotham, "Reliability assessment of 3D space frame structures applying stochastic finite element analysis," International Journal of Mechanics and Materials in Design, pp. 1-9, 2011.

R. Pitre, Systematic Structural Optimization of a Next Generation Lunar Rover Chassis 109
[31] Neptec Design Group, "Destin Lunar Drill," June 2015. [Online]. Available: http://www.neptec.com/wp-content/uploads/2015/06/Destin-Lunar-Drill.pdf. [Accessed 20 August 2015].
[32] L. Komzsik, The Lanczos Method: Evolution and Application, SIAM, 2003.
[33] A. Mavroulakis and A. Trombe, "A New Semianalytical Algorithm for Calculating Diffuse Plane View Factors," Journal of Heat Transfer, pp. 279-282, 1998.
[34] A. F. Emery, O. Johansson, M. Lobo and A. Abrous, "A Comparitive Study of Methods for Computing the Diffuse Radiation Viewfactors for Complex Structures," Journal of Heat Transfer,
pp. 413-422, 1991.
[35] A. Mezrhab and M. Bouzidi, "Computation of view factors for surfaces of complex shape including screening effects and using a boundary element approximation," International Journal for
Computer-Aided Engineering and Software, pp. 132-148, 2005.
[36] S. Mazumder and M. Ravishankar, "General procedure for calculation of diffuse view factors between arbitrary planar polygons," Internation Journal of Mass and Heat Transfer, pp. 7330-
7335, 2012.
[37] R. P. Koptelov, G. K. Malikov and V. G. Lisienko, "View Factors for Surface Zones," Steel in Translation, pp. 5-12, 2013.
[38] J. Blobner, R. A. Bialecki and G. Kuhn, "Boundary Element Solution of Coupled Heat Conduction Radiation Problems in The Presence of Shadow Zones," Numerical Heat Transfer, pp. 451-478,
2001.
[39] A. Minnich, J. Turner and M. Hall, "A Viewfactor-bsed Radiative Heat Transfer Model for Telluride," Los Alamos National Laboratory, Los Alamos, 2002.
[40] Wolfram Alpha, "Line-Line Intersection," 1 July 2014. [Online]. Available: http://mathworld.wolfram.com/Line-LineIntersection.html.
[41] Maryland Metrics, "Maryland Metrics PTFE Datasheet," 21 07 2014. [Online]. Available: http://mdmetric.com/or/datapgb.htm 1/.
[42] ANSYS, Inc., "ANSYS Element Reference," ANSYS, Inc., Canonsburg, PA, 2009.
[43] ANSYS, Inc., "ANSYS Mechanical APDL Thermal Analysis Guide," November 2013. [Online]. Available: https://support.ansys.com/portal/site/AnsysCustomerPortal/template.fss?file=/prod_docu/15.0/ANSYS%20Mechanical%20APDL%20Thermal%20Analysis%20Guide.pdf.
[44] MIT, "19.3 Radiation Heat Transfer Between Planar Surfaces," 1 February 2002. [Online]. Available: http://web.mit.edu/16.unified/www/FALL/thermodynamics/notes/node136.html.
[45] M. M. Garzon, "Development and Analysis of the Thermal Design forthe Osiris-3u Cubesat," The Pennsylvania State University, Philadelphia, 2012.
[46] K. Thanarasi, "Thermal Analysis of CUBESAT in Worse Case Hot and Cold Environment using FEA Method," Applied Mechanics and Materials, pp. 497-502, 2012.

R. Pitre, Systematic Structural Optimization of a Next Generation Lunar Rover Chassis 110
[47] B. M. P. a. S. O., Topology Optimization: Theory, Methods and Applications, Springer, 2003.
[48] A. Seeni, B. Schafer, B. Rebele and R. Krenn, "Lunar Rover with Multiple Science Payload Handling Capability," Institute of Robotics and Mechatronics, German Aerospace Center, Wessling, Germany.
[49] W. Zhang, L. Xia, J. Zhu and Q. Zhang, "Some Recent Advances in the Integrated Layout Design of Multicomponent Systems," Journal of Mechanical Design, pp. 1-15, 2011.
[50] A. C. Leite and B. Schafer, "Mass, power and static stability optimization of a 4-wheeled planetary exploration rover," in 2nd International Conference on Engineering Optimization, Lisbon, Portugal,
2010.
[51] A. C. Leite and B. Schafer, "On multi-objective optimization of planetary exploration rovers applied to exomars-type rovers," in ASTRA, Noordwijk, NL, 2011.

R. Pitre, Systematic Structural Optimization of a Next Generation Lunar Rover Chassis 111
10.0 Appendix
10.1 Modern Rover Images
Figure 84 - Image of the Chang'e 3 Lunar Rover Model (Left) [15] and Photo of the Rover during field test [3]
Figure 85 - Chang'e 3 Rover and Mother Craft at Zhuhai Air Show in 2009 [16]

R. Pitre, Systematic Structural Optimization of a Next Generation Lunar Rover Chassis 112
Figure 86 - Chandrayaan-2 Lunar Rover Prototype (Left) and Rover Dimensions (Right) [19]
Figure 87 - Mobile Payload Element Front and Rear Views in Deployed Configuration [11]
5
Figure 88 - NASA MAX-C Rover (Artist's Rendition) [13]

R. Pitre, Systematic Structural Optimization of a Next Generation Lunar Rover Chassis 113
Figure 89 - Mars Reconnaissance Lander vehicle configuration (a) stowed in entry aeroshell of maximum diameter 3.7 m (b) initial landing engine module attached and landing gear extended (c)
surface hop configuration with landing propulsion jettisoned [4]
Figure 90 - AMALIA Rover Concept Drawing [5]
Figure 91 - Solar Rover II during testing [7]

R. Pitre, Systematic Structural Optimization of a Next Generation Lunar Rover Chassis 114
10.2 High Resolution Model Image
Figure 92 – High Resolution Image of the Topology Optimization Model (Top) and Zoomed Section (Bottom)