Systematic Screening of Dams for Environmental Flow ... Flow Assessment and Implementation THEODORE...
38
Overview Articles 1006 BioScience • November 2014 / Vol. 64 No. 11 http://bioscience.oxfordjournals.org Systematic Screening of Dams for Environmental Flow Assessment and Implementation THEODORE E. GRANTHAM, JOSHUA H. VIERS, AND PETER B. MOYLE Environmental flow protections are crucial to the conservation of freshwater biodiversity in dam-regulated river systems. Nevertheless, the implementation of environmental flows has lagged far behind the pace of river ecosystem alteration. The vast number of dams now in operation and the substantial resources required to modify their operations suggest that a systematic approach is needed to identify rivers potentially benefiting from environmental flows. Here, we develop and apply a screening framework that is focused on the selection of dams that warrant environmental flows on the basis of evidence of hydrologic alteration and ecological impairment. Our approach is illustrated for California, where 181 (of an initial 1400+) dams are identified as high-priority candidates to improve environmental flows for native fish conservation. Given the rapid declines of freshwater biodiversity and pervasive alteration to rivers, this systematic screening approach should be useful for guiding the strategic implementation of environmental flows. Keywords: rivers, water management, environmental flows, fish conservation, California T he proliferation of dams since the mid-twentieth century has altered river ecosystems at a global scale. Currently, there are an estimated 50,000 large dams (more than 15 meters [m] high) in operation and millions of smaller impoundments throughout the world (Berga et al. 2006, Lehner et al. 2011). Furthermore, energy and water scarcity challenges associated with climate change and human population growth continue to fuel the demand for large water projects (Palmer et al. 2008), which suggests that the number and extent of dams will continue to grow. The important societal benefits of dams, such as flood control, water supply, and hydropower, have also come with substan- tial environmental costs (WCD 2000, Bruno and Siviglia 2012). Dams are a dominant driver of global freshwater bio- diversity declines (Dudgeon et al. 2006), fish species extinc- tions (Xenopoulos et al. 2005, Reidy Liermann et al. 2012), and river floodplain degradation (Opperman et al. 2010). Therefore, there is mounting pressure on policymakers and resource managers to realize the potential benefit of water infrastructure development while ensuring the long-term sustainability of freshwater ecosystems. The modification of dam operations to control the tim- ing and magnitude of flow releases for environmental benefits (i.e., environmental flows) has been proposed as an approach for mitigating the negative ecological impacts of dams while preserving essential water management functions (Richter and Thomas 2007, Pittock and Hartmann 2011, Arthington 2012). By manipulating the quantity, tim- ing, and quality of water releases from reservoirs to mimic natural flow dynamics, it may be possible to restore essential ecosystem processes on which aquatic organisms depend (Poff et al. 1997). Although the structural design and opera- tional purposes of dams necessarily limit the potential to restore natural flow regimes, re-operating dams for environ- mental flows is becoming an increasingly important strategy for freshwater ecosystem conservation in regulated rivers (Konrad et al. 2012). A wide range of approaches has been developed to support quantification and implementation of environmental flows (Tharme 2003, Williams 2011). Poff and colleagues’ (2010) ecological limits of hydrologic alteration approach (ELOHA) represents the latest effort to develop a science-based envi- ronmental flow assessment framework. The approach estab- lishes environmental flow standards at the regional scale by defining river classes that exhibit similar hydroecological conditions and expected responses to flow regime change. By developing standards at the regional scale, ELOHA is intended to improve the cost efficiency of environmental flow assessments, which have traditionally been conducted at river- or project-specific scales. The ELOHA framework has been adopted in distinct geographic regions, including river basins in the United States, Spain, China, Australia, BioScience 64: 1006–1018. © The Author(s) 2014. Published by Oxford University Press on behalf of the American Institute of Biological Sciences. All rights reserved. For Permissions, please e-mail: [email protected]. doi:10.1093/biosci/biu159 Advance Access publication 15 October 2014
Transcript of Systematic Screening of Dams for Environmental Flow ... Flow Assessment and Implementation THEODORE...

Overview Articles
1006 BioScience • November 2014 / Vol. 64 No. 11 http://bioscience.oxfordjournals.org
Systematic Screening of Dams for Environmental Flow Assessment and Implementation
THEODORE E. GRANTHAM, JOSHUA H. VIERS, AND PETER B. MOYLE
Environmental flow protections are crucial to the conservation of freshwater biodiversity in dam-regulated river systems. Nevertheless, the implementation of environmental flows has lagged far behind the pace of river ecosystem alteration. The vast number of dams now in operation and the substantial resources required to modify their operations suggest that a systematic approach is needed to identify rivers potentially benefiting from environmental flows. Here, we develop and apply a screening framework that is focused on the selection of dams that warrant environmental flows on the basis of evidence of hydrologic alteration and ecological impairment. Our approach is illustrated for California, where 181 (of an initial 1400+) dams are identified as high-priority candidates to improve environmental flows for native fish conservation. Given the rapid declines of freshwater biodiversity and pervasive alteration to rivers, this systematic screening approach should be useful for guiding the strategic implementation of environmental flows.
Keywords: rivers, water management, environmental flows, fish conservation, California
The proliferation of dams since the mid-twentieth century has altered river ecosystems at a global scale.
Currently, there are an estimated 50,000 large dams (more than 15 meters [m] high) in operation and millions of smaller impoundments throughout the world (Berga et al. 2006, Lehner et al. 2011). Furthermore, energy and water scarcity challenges associated with climate change and human population growth continue to fuel the demand for large water projects (Palmer et al. 2008), which suggests that the number and extent of dams will continue to grow. The important societal benefits of dams, such as flood control, water supply, and hydropower, have also come with substan-tial environmental costs (WCD 2000, Bruno and Siviglia 2012). Dams are a dominant driver of global freshwater bio-diversity declines (Dudgeon et al. 2006), fish species extinc-tions (Xenopoulos et al. 2005, Reidy Liermann et al. 2012), and river floodplain degradation (Opperman et al. 2010). Therefore, there is mounting pressure on policymakers and resource managers to realize the potential benefit of water infrastructure development while ensuring the long-term sustainability of freshwater ecosystems.
The modification of dam operations to control the tim-ing and magnitude of flow releases for environmental benefits (i.e., environmental flows) has been proposed as an approach for mitigating the negative ecological impacts of dams while preserving essential water management
functions (Richter and Thomas 2007, Pittock and Hartmann 2011, Arthington 2012). By manipulating the quantity, tim-ing, and quality of water releases from reservoirs to mimic natural flow dynamics, it may be possible to restore essential ecosystem processes on which aquatic organisms depend (Poff et al. 1997). Although the structural design and opera-tional purposes of dams necessarily limit the potential to restore natural flow regimes, re-operating dams for environ-mental flows is becoming an increasingly important strategy for freshwater ecosystem conservation in regulated rivers (Konrad et al. 2012).
A wide range of approaches has been developed to support quantification and implementation of environmental flows (Tharme 2003, Williams 2011). Poff and colleagues’ (2010) ecological limits of hydrologic alteration approach (ELOHA) represents the latest effort to develop a science-based envi-ronmental flow assessment framework. The approach estab-lishes environmental flow standards at the regional scale by defining river classes that exhibit similar hydroecological conditions and expected responses to flow regime change. By developing standards at the regional scale, ELOHA is intended to improve the cost efficiency of environmental flow assessments, which have traditionally been conducted at river- or project-specific scales. The ELOHA framework has been adopted in distinct geographic regions, including river basins in the United States, Spain, China, Australia,
BioScience 64: 1006–1018. © The Author(s) 2014. Published by Oxford University Press on behalf of the American Institute of Biological Sciences. All rights reserved. For Permissions, please e-mail: [email protected]. doi:10.1093/biosci/biu159 Advance Access publication 15 October 2014

Overview Articles
http://bioscience.oxfordjournals.org November 2014 / Vol. 64 No. 11 • BioScience 1007
and South America (Pahl-Wostl et al. 2013). However, the significant financial and technical resources generally required to apply ELOHA have hindered its implementation in other jurisdictions (Richter et al. 2012), which suggests that environmental flows will continue to be implemented opportunistically in river basins where resources and politi-cal and institutional capacities are greatest (e.g., Moyle et al. 1998, Richter et al. 2006).
Environmental flow protections remain limited or nonex-istent in the vast majority of the world’s regulated rivers, and resource constraints make it unlikely that ELOHA (and other environmental flow assessment frameworks) will be com-prehensively applied in the near future (Richter et al. 2012). Although opportunistic implementation of environmental flows will remain important, such as through dam relicens-ing procedures (Pittock and Hartmann 2011, Williams 2011) and various state programs (Gillilan and Brown 1997), a broader strategy to improve environmental flows in regu-lated river systems is needed. Here we propose a systematic, data-driven approach to screen and select dams that may require managed environmental flows to sustain freshwater biodiversity based on indicators of hydrological and eco-logical impairment. The approach allows for a preliminary evaluation of environmental flow management needs over broad spatial scales by compiling and analyzing data relevant to the ecological and hydrologic impacts of individual dams. The purpose of the approach is to guide strategic investment in environmental flow investigations for river basins where environmental flows are needed most, which complements assessment frameworks such as ELOHA that are designed to establish specific flow standards once a system of interest has been identified. The approach is intended for agencies, non-governmental organizations, and policymakers that must consider how to prioritize the rivers on which they work and in which they invest resources.
We illustrate the approach for the state of California, which covers approximately 425,000 square kilometers [km2] and contains more than 1400 large dams (defined by the state as more than 1.8 m high and storing more than 60,000 cubic meters [m3]) and tens of thousands of smaller impoundments. Many of these dams are operated with little consideration for their effects on aquatic ecosystems and are a dominant factor responsible for the rapid decline of the state’s native fish fauna (Moyle 2002, Moyle et al. 2011). In California, some dams are required to release environ-mental flows for salmon and other fish listed under the federal Endangered Species Act (ESA). In addition, hydro-power dams regulated by the Federal Energy Regulatory Commission (FERC) increasingly require environmental flow releases to mitigate their impacts on fish and other downstream biota (Viers 2011). However, most dams in the state are not subject to federal ESA or FERC require-ments. State law (California Fish and Game Code §5937) does mandate that dam operators release sufficient water to support fish downstream. Furthermore, recent success-ful lawsuits have indicated that the Fish and Game Code
may become an increasingly important policy mechanism for securing environmental flows below dams (Gillilan and Brown 1997, Börk et al. 2012). However, determining which dams may not be in compliance with the code is a daunting task that state agencies have not undertaken to date. To help guide future implementation of environmental flow pro-grams in California, we developed and applied the screening framework to identify dams for which environmental flows may be warranted. Here, screening criteria are focused on indicators of hydrological alteration and fish population impairment, but the framework can be adapted for applica-tion in other regions, especially where protection of public trust resources, such as rivers and streams, are required by law (Gillilan and Brown 1997, Viers and Rheinheimer 2011).
Screening dams for environmental flow management in CaliforniaThe screening framework provides a data-driven process to identify and rank dams for which environmental flow protections appear warranted. Its application is intended for broad geographic regions, which are characterized by high biogeographic diversity and a widespread distribution of dams. The framework consists of a series of tiered filters that are used to screen dams on the basis of their physical and geographic attributes, hydrologic impacts, and potential ecological effects (figure 1). First, dams that meet minimum size and catchment area specifications are identified. Next, the hydrologic conditions below these dams are assessed to quantify the extent to which flows may deviate from natural, unimpaired conditions. Third, the potential impacts of dam operations on the biotic community in proximity to each dam are evaluated. Finally, the dams that satisfy all filters are identified and ranked by multiple criteria. The selected subset of ranked dams provides the basis for strategically pursuing site-specific assessments of dam operations and environmental flow requirements.
Characterizing physical and geographic attributes. To develop a dam database for California, records were compiled from several existing data sets, including the US Army Corps of Engineers National Inventory of Dams (USACE 2010), California Department of Water Resources List of Jurisdictional Dams (DWR 2010), and National Marine Fisheries Service’s Dam Dataset for Assessing Anadromous Fish Passage (Goslin 2005). The data sets include most large dams in California, which are defined as being at least 1.8 m high with a storage capacity of more than 60,000 m3 (or more than 7.6 m high and storing at least 18,500 m3). Individual dams were mapped in a GIS format (ArcGIS version 10.1; ESRI, Redlands, California) by their latitudinal and longitu-dinal coordinates and, where necessary, manually geolocated on the basis of the 1:100,000 National Hydrography Dataset streamline layer and orthorectified aerial photos.
We first filtered dams for their potential to be managed for environmental flows by excluding dams that create off-stream storage, such as hydropower facilities (e.g., penstocks

Overview Articles
1008 BioScience • November 2014 / Vol. 64 No. 11 http://bioscience.oxfordjournals.org
and forebays) and projects in highly urbanized catchments (e.g., wastewater treatment facilities and off-stream perco-lation basins). Debris basins, retention ponds, and similar passive impoundments were also excluded. For dams that consisted of multiple project works (e.g., those with mul-tiple dikes and spillways), we included only the primary impoundment structure. Finally, dams with drainage areas less than 1 km2 and with storage capacities of less than 100,000 m3 were excluded. Although small impoundments also impair stream flows (Smith et al. 2002) and can have significant ecological effects (Gangloff 2013), they were excluded because of their limited potential to be managed for environmental flows relative to that of larger dams.
Assessing hydrologic alteration. The second filter considers the effects of dams on downstream flows. A common approach to quantifying the hydrologic impacts of dams involves a comparison of observed (altered) downstream flows with expected (unimpaired or baseline) conditions. Expected hydrologic conditions can be estimated by modeling tech-niques, including process-based watershed models (e.g., Singh and Woolhiser 2002, Kennen et al. 2008) and statisti-cal approaches (e.g., Sanborn and Bledsoe 2006, Carlisle et al. 2010a) or can be derived empirically from pre-dam
data (e.g., Batalla et al. 2004). Observed conditions are then compared with predictions of expected unimpaired flows to assess hydrologic alteration for indices describing dif-ferent aspects of flow regime, such as the ratio of observed to expected monthly discharge (O:E; Carlisle et al. 2010b). When empirical flow data are unavailable, an alternative metric for assessing hydrologic alteration is the ratio of the reservoir storage capacity to the mean annual inflow—here referred to as the degree of regulation (DOR; Hirsch et al. 1990, Lehner et al. 2011). The DOR reflects the capacity of a dam to capture the annual discharge volume of a river and has been shown to be strongly correlated with other hydrologic alteration metrics, such as reductions in peak-flow magnitudes and a disruption of seasonal flow patterns (Batalla et al. 2004, Kondolf and Batalla 2005).
To evaluate hydrologic alteration below dams in California, we first identified the dams with downstream US Geological Survey (USGS) flow gages. The analysis was restricted to gages located below dams with limited or no tributary influ-ence and with at least 10 years of continuous daily flow records between 1970 and 2012. Dams in close proximity to each other (e.g., storage dams with downstream hydropower facilities) were associated with the same downstream gage. At all gages we assessed potential changes in the magnitude
Figure 1. Screening framework for dams at which environmental flow management may be warranted on the basis of physical dam attributes and indicators of flow alteration and biotic impairment. The candidate dams are ranked on the basis of physical characteristics, regulatory context, and ecological values to prioritize sites or river basins for environmental flow assessment. Abbreviations: km2, square kilometers; m3, cubic meters.

Overview Articles
http://bioscience.oxfordjournals.org November 2014 / Vol. 64 No. 11 • BioScience 1009
and seasonality of monthly flows and changes in the mag-nitude of maximum 1-day flows. Predictions of expected, unimpaired monthly, and maximum 1-day flows were gener-ated using a statistical modeling approach developed by the USGS (Carlisle et al. 2010a, 2010b). Random forest models (Breiman 2001) were used to parameterize the relationships between geospatial catchment attributes (e.g., climate, topog-raphy, soils) and hydrologic responses at reference gages (i.e., those with no upstream dams and limited land-use disturbance) and then to predict hydrologic conditions at other locations on the basis of upstream catchment charac-teristics (see appendix S1 for more information). Catchment variables for the reference gages and those identified below dams were obtained from the Gages-II database (Falcone et al. 2012). Modeled predictions of unimpaired monthly and maximum 1-day flows were compared with observed values at the gages below dams to generate O:E ratios of the flow metrics. Alteration of seasonal flow patterns was also assessed by quantifying the correlation (Pearson’s r) between observed and expected mean monthly flows.
Because of the limited geographic distribution of USGS gage stations, information on downstream flows was not available for the majority of dams evaluated in this study. However, the potential for flow alteration was assessed for all dams by the DOR. Volumetric storage capacity was derived from the dam datasets. The mean annual inflow was estimated from 61 years (1950–2010) of predicted unimpaired annual surface flows at each dam location using the statistical modeling approach described above (and in appendix S1). To consider the potential influence of upstream dams, cumulative DOR was also calculated: for each dam, the reservoir capacity was added to the capacity of all reservoirs in the dam’s upstream catchment, and the total was divided by the mean annual inflow.
Assessing biological conditions. The third tier of the evaluation framework assesses the potential impacts of dams on the aquatic ecosystem. For the assessment of dams in California, ecological criteria were focused on native fish taxa because of their management relevance and because fish are strong indicators of river ecosystem condition (Esselman et al. 2013). Furthermore, extensive knowledge of the popula-tion status, distribution, and life history requirements of California’s fish fauna has been gained from previous stud-ies and environmental monitoring (Moyle 2002, Moyle et al. 2011). Although other taxonomic groups, such as ben-thic macroinvertebrates, are known to be sensitive to flow alteration (Konrad et al. 2008, Carlisle et al. 2010b), uniform statewide data were not available to allow for consistent comparisons among dams and were therefore not included as ecological screening criteria.
To identify dams that had the potential to affect native fish species of management concern, we selected a set of 67 spe-cies known to be vulnerable to dam and diversion impacts based on their distribution, documented impacts of flow alteration, and their life history requirements (Marchetti
and Moyle 2001, Brown and Ford 2002, Moyle 2002, Moyle et al. 2011). The group represents approximately half of California’s 133 native fish taxa and includes wide-ranging migratory species, such as salmon, steelhead, lamprey, and stugeon, in addition to other native riverine fishes threat-ened by dams and diversions (appendix S2). The excluded species were those that occur in lentic habitats or in isolated spring systems and riverine species resilient to hydrologic alteration. We further restricted the focal group to 42 spe-cies considered endangered or vulnerable to extinction on the basis of a recent population status assessment (appendix S2; Moyle et al. 2011). The current ranges of all focal spe-cies were mapped at the Hydrologic Unit Code 12 (HUC12) watershed scale (NRCS and USGS 2014), using methods described in Santos et al. 2014.
Biological screening criteria (figure 1) were applied to identify the dams located in watersheds in which imper-iled, flow-sensitive species were potentially present. The screening approach was therefore focused on dams that had the potential to affect species of management of concern, which would presumbably benefit from environmental flows. Dams located in watersheds with no imperiled flow-senstitve fish species were excluded because they are likely to be low-priority candidates for environmental flow manage-ment. A second screening criterion was applied to identify watersheds with dams in which imperiled flow-sensitive species had been lost. Local extirpations were assessed by comparing historic and current range maps for California native fish species (Santos et al. 2014). Environmental flow releases below dams where species have been extirpated may not provide immediate ecological benefits but may be important for the long-term recovery of imperiled species. We did not consider the full range of factors, including inva-sive species, habitat modification, and water quality degrada-tion, that influence the population status and range of the fishes in the affected watersheds. Therefore, the ecological screening criteria provide evidence that dams may warrant environmental flows to protect imperiled fish species but do not address the feasibility or potential ecological benefits of dam reoperation, which may be limited by other physical, biological, and social factors.
The screening and ranking of candidate dams. The tiered screening framework was applied to identify the subset of dams with evidence of both hydrologic alteration and fish impairment. The criteria for hydrologic alteration were deviation from observed flow patterns (the magnitude of monthly and maxi-mum 1-day flows and seasonality) and high values for DOR and cumulative DOR. Although there are no generalizable ecological-flow relationships that can be used to set objective ecological sustainability thresholds for flow impairment (Poff and Zimmerman 2010), a review of environmental flow stan-dards suggested that flow alteration greater than 20% is likely to cause moderate to major changes in ecosystem structure and functions (Richter et al. 2012). We considered deviation in monthly and maximum 1-day flows of 50% as a reasonable

Overview Articles
1010 BioScience • November 2014 / Vol. 64 No. 11 http://bioscience.oxfordjournals.org
threshold criterion at which adverse ecological effects may occur, and this is large enough to limit the potential effects of model uncertainty on flow alteration predictions (i.e., O:E flow metrics; appendix S1). The threshold criterion for devia-tion in seasonal flow patterns was defined by a correlation coefficient (Pearson’s r) of less than 0.5. Finally, we used a DOR or cumulative DOR index greater than 1 as a criterion for hydrologic alteration, on the basis of previous studies that have shown DOR approaching or exceeding 1 to be a strong indicator of flow regime impacts (Batalla et al. 2004, Eng et al. 2012). Biological impairment criteria were satisfied by the presence or local extirpation of any flow-sensitive fish spe-cies with an imperiled population status (i.e., endangered or near-threatened per Moyle et al. 2011). Dams satisfying one or more hydrologic criteria and associated with indicators of fish impairment were included in a final subset of dams (figure 1).
The dams identified through the screening process were sorted and ranked on the basis of their size (height and res-ervoir capacity) and the hydrologic alteration criteria. These sorting criteria emphasize the largest dams and those with the greatest potential for significant flow regime impacts. Additional sorting criteria were applied to identify the dams
affecting rivers of potential significance for fish conserva-tion, such as the number of imperiled flow-sensitive fish spe-cies and the total richness of native fish species present in the affected watershed. Candidate dams were also distinguished by their primary purpose, designated in the US National Inventory of Dams (USACE 2010). Finally, dams subject to federal ESA and FERC requirements were distinguished from dams primarily managed under state jurisdiction.
Mapping California’s damsA total of 1440 unique California dam records were compiled from existing data sets (Goslin 2005, DWR 2010, USACE 2010). From this list, 515 were identified as off-stream dams, retention basins, or other facilities that do not release water directly into streams. An additional 172 dams with small drainage areas (less than 1 km2) or low storage capacities (less than 100,000 m3) were excluded. The 753 remain-ing dams were selected for further assessment. These dams represent a broad range of sizes, storage capacities, and drainage areas (figure 2) and include those that are privately owned (n = 339) and those owned and operated by local (n = 279), state (n = 27), and federal agencies (n = 108). The
Figure 2. Distribution of the dams evaluated (n = 753), with frequency distributions for dam height, storage capacity, and catchment area. Abbreviations: km, kilometers; km2, square kilometers; m, meters; m3, cubic meters.

Overview Articles
http://bioscience.oxfordjournals.org November 2014 / Vol. 64 No. 11 • BioScience 1011
dams are also managed for a range of operational purposes. According to the purpose designations in USACE (2010), the evaluated dams are primarily operated for irrigation (n = 328), hydroelectric production (n = 133), and water supply (n = 133). However, nearly all dams were reported as having multiple operational purposes, and the relative impor-tance of each operation type is not specified in USACE (2010).
Flow regime alteration below damsA total of 211 USGS flow gages were identified down-stream of 228 dams. The potential alteration of flow magnitudes and seasonal flow patterns at those gages was first assessed by comparing modeled unimpaired monthly flows with the observed flows. The observed monthly flows were calculated from daily flows at gages with at least 27 observations per month for water years in the period of record, resulting in a set of 205 gages below 224 dams. Expected monthly flows from 1950 to 2010 were estimated at all gages from the unimpaired flow models, which performed well in predicting flows at reference gages excluded from the model training data set (appendix S1). Mean monthly O:E ratios were calculated at each gage from the set of paired observation–model values within the period of record.
Nearly all of the gaged dams showed evidence of monthly flow alteration. Of the 224 dams evaluated, 202 had at least 1 month in which the observed monthly flows deviated from expected values by greater than 50%. For 26 dams, monthly flows were altered by greater than 50% for all 12 months and, for most dams (n = 183), monthly flows were altered by greater than 50% for 6 months or more. Mean monthly O:E values were less than 1 for most dams in the winter and spring, which indicates that flow releases from most dams were, on average, lower than expected surface flows (figure 3a). However, in the summer and fall, many of the dams had monthly O:E values greater than 2, which may represent augmented flow releases in late summer for agricultural water deliveries.
The change in seasonal flow patterns was assessed by examining the correlation between paired observed and expected monthly flows at each gage (figure 3b). At most of the dam gages (n = 87 of 213), the observed and expected monthly flows were strongly correlated (r > 0.75), which indicates that monthly seasonal flow patterns were generally preserved. However, low correlations (r < 0.5) of monthly flows at 46 gages indicated that seasonal flow patterns were highly altered in those rivers (figure 3b). Negative correla-tion coefficient values were observed at four gages, which indicates a reversal of natural seasonal flow patterns.
Next, the potential effects of dams on downstream peak flows were assessed by comparing observed with expected values of the mean maximum 1-day flow. Only gages with more than 350 days of daily flow records per year for 10 years were included (n = 209). Mean O:E values were cal-culated at each site for the period of record by comparing observed values with modeled predictions of maximum
1-day flows for all water years with records between 1950 and 2010. The model performed well in predicting the maxi-mum 1-day flows at validation sites omitted from model training (appendix S1), which indicates that significant deviation (greater than 0.5) in O:E from 1 is attributable to upstream dam operations and not model error. A high proportion of the gages (n = 77) exhibited relatively low deviation from expected maximum 1-day flows, with mean O:E values between 0.75 and 1.25 (figure 3c). At 45 gages, the maximum 1-day flows were less than 50% of the expected values, which indicates a reduction in peak-flow magnitudes, whereas a similar number of sites (n = 53) had observed maximum 1-day flow values that were greater than 50% of predicted values.
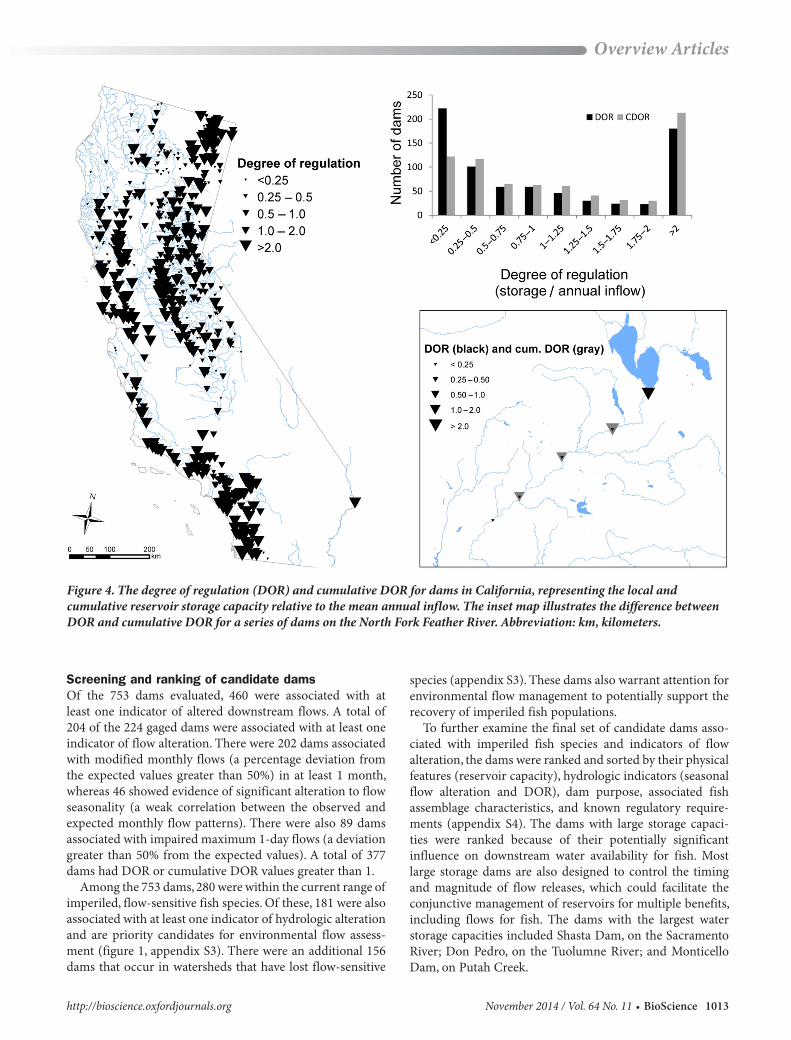
The degree of regulation was calculated for all of the dams (n = 753), including those without downstream USGS gages, by dividing the dam storage volume by the mean unimpaired annual inflow (the average of all annual predictions for water years between 1950 and 2010). The cumulative DOR was calculated as the total storage volume of the dam plus those of all dams in the upstream catchment divided by the mean annual inflow. The model-predicted unimpaired annual flows were esti-mated with high accuracy and low bias (appendix S1). Both DOR and cumulative DOR values for dams exhib-ited a bimodal distribution, with most dams having either values less than 0.25 (storage capacity less than 25% of annual inflow volume) or greater than 1 (storage capac-ity greater than mean annual inflow; figure 4). A total of 421 dams had a DOR greater than 0.5, 362 greater than 0.75, and 303 greater than 1. There were 180 dams with storage capacities greater than 2 times the estimated mean annual inflow (DOR > 2). Although the dams with high DOR values occur throughout the state, they are clustered in particularly high densities in arid regions, such as southern coastal California and the northeast part of the state (figure 4).
Indicators of fish taxa conditionTo identify the dams that could adversely affect native fish populations, we screened for dams in watersheds occupied by imperiled fish species considered sensitive to flow altera-tion. Imperiled, flow-sensitive species primarily occurred along the California coast, within the Central Valley and Sierra Nevada foothills regions and in the Klamath River Basin in northern California (figure 5a). All of the dams within the range of imperiled flow-sensitive species (con-sidered endangered or near-threatened per Moyle et al. 2011) were identified: 280 dams were within the range of at least 1 flow-sensitive species, including 269 within the range of resident (nonmigratory) species and 173 within the range of sensitive anadromous species.
A total of 421 dams were also identified in 315 HUC12 watersheds that have lost flow-sensitive species. The dams associated with species losses were concentrated in the southern California coast, the Sierra Nevada foothills, and

Overview Articles
1012 BioScience • November 2014 / Vol. 64 No. 11 http://bioscience.oxfordjournals.org
Figure 3. Histograms of (a) the ratio of observed to expected mean monthly flows, (b) seasonal flow deviation based on a correlation between the observed and expected monthly flows, and (c) the ratio of observed to expected 1-day maximum flow at gages (n = 211) below California dams. The gray shading indicates that the observed flows were similar to the expected (unimpaired) values.
the upper Sacramento and Klamath River basins (figure 5b). The losses were primarily attributed to range contractions of anadromous taxa from historic to present time: Steelhead trout were extirpated from 78 (HUC12) watersheds affected
by 107 dams, Chinook and coho salmon from 120 water-sheds containing 162 dams, lamprey from 26 watersheds containing 26 dams, and sturgeon from 6 watersheds con-taining 10 dams.
Overview Articles
http://bioscience.oxfordjournals.org November 2014 / Vol. 64 No. 11 • BioScience 1013
Screening and ranking of candidate damsOf the 753 dams evaluated, 460 were associated with at least one indicator of altered downstream flows. A total of 204 of the 224 gaged dams were associated with at least one indicator of flow alteration. There were 202 dams associated with modified monthly flows (a percentage deviation from the expected values greater than 50%) in at least 1 month, whereas 46 showed evidence of significant alteration to flow seasonality (a weak correlation between the observed and expected monthly flow patterns). There were also 89 dams associated with impaired maximum 1-day flows (a deviation greater than 50% from the expected values). A total of 377 dams had DOR or cumulative DOR values greater than 1.
Among the 753 dams, 280 were within the current range of imperiled, flow-sensitive fish species. Of these, 181 were also associated with at least one indicator of hydrologic alteration and are priority candidates for environmental flow assess-ment (figure 1, appendix S3). There were an additional 156 dams that occur in watersheds that have lost flow-sensitive
species (appendix S3). These dams also warrant attention for environmental flow management to potentially support the recovery of imperiled fish populations.
To further examine the final set of candidate dams asso-ciated with imperiled fish species and indicators of flow alteration, the dams were ranked and sorted by their physical features (reservoir capacity), hydrologic indicators (seasonal flow alteration and DOR), dam purpose, associated fish assemblage characteristics, and known regulatory require-ments (appendix S4). The dams with large storage capaci-ties were ranked because of their potentially significant influence on downstream water availability for fish. Most large storage dams are also designed to control the timing and magnitude of flow releases, which could facilitate the conjunctive management of reservoirs for multiple benefits, including flows for fish. The dams with the largest water storage capacities included Shasta Dam, on the Sacramento River; Don Pedro, on the Tuolumne River; and Monticello Dam, on Putah Creek.
Figure 4. The degree of regulation (DOR) and cumulative DOR for dams in California, representing the local and cumulative reservoir storage capacity relative to the mean annual inflow. The inset map illustrates the difference between DOR and cumulative DOR for a series of dams on the North Fork Feather River. Abbreviation: km, kilometers.

Overview Articles
1014 BioScience • November 2014 / Vol. 64 No. 11 http://bioscience.oxfordjournals.org
Dams associated with the greatest downstream hydro-logic alteration were also identified and ranked on the basis of their seasonal flow deviation (a correlation of O:E mean monthly flows) and DOR (capacity divided by the annual inflow; appendix S4). Many of the dams with high sea-sonal flow deviation were dams with relatively small storage capacities (less than 50 × 106 m3), such as Meadow Lake Dam (on a tributary of the north fork of the Mokelumne River; r = –0.03), Tinemaha Dam (on the Owens River; r = 0.13), and the Pit River No. 4 Diversion Dam (on the Pit River; r = 0.36). Similarly, the dams with the largest DOR values tended to have small storage capacities, which suggests that a dam’s size is not necessarily indicative of its hydrologic effects.
The dams associated with a high number of flow-sensitive species and overall native fish species richness were also identified (appendix S4). Dams located in river basins with the highest number of imperiled flow-sensitive spe-cies included Camp Far West Storage and Diversion Dams (on the Bear River; six species), Red Bluff Diversion Dam (on the Sacramento River; six species), and Woodbridge Diversion Dam (on the Mokelumne River; five species).
These dams were also associated with the highest level of native species richness (15 or more native species). Other candidate dams located in watersheds with high native species richness were Lake Anza (on Wildcat Creek; 16 spe-cies), Whiskeytown Lake (on Clear Creek; 15 species), and several dams on the Sacramento River (Keswick, Shasta, and Anderson Cottonwood; 15 species each).
Finally, the dams’ purpose and regulatory requirements were evaluated to consider the feasibility of, and appropri-ate policy mechanisms for, implementing environmental flows below the candidate dams. For example, 83 of the candidate dams had a primary designated purpose of irriga-tion, which may be more compatible with environmental flow management than dams whose primary purpose is water supply (n = 45) or hydropower (n = 24). Of the 181 candidate dams, 38 are subject to federal ESA or FERC regulations that require environmental flows (appendix S4). The remaining 143 dams with evidence of flow alteration and ecological impairment are therefore considered a high priority for assessing compliance with state environmental flow requirements.
Figure 5. (a) Dams within the range of imperiled flow-sensitive species and (b) dams located in watersheds where flow-sensitive species have been locally extirpated.

Overview Articles
http://bioscience.oxfordjournals.org November 2014 / Vol. 64 No. 11 • BioScience 1015
In summary, we identified 181 dams for which improved environmental flow releases may be warranted on the basis of evidence of hydrologic alteration and fish population impairment. The assessment and implementation of envi-ronmental flows below an additional 156 dams may also be warranted to restore populations of flow-sensitive spe-cies that have been locally extirpated from watersheds in which the dams occur. The candidates for environmental flow management occur throughout the state and represent a broad diversity of ownership (e.g., public utilities, private, state agencies), impoundment sizes, and functions (e.g., flood control, water storage, diversions). Of the 181 prior-ity dams, 38 are subject to FERC or federal ESA regulations that require environmental flows, although others may manage environmental flows in accordance with project-specific state and federal agency agreements. Although our analysis provides evidence of flow regime alteration and fish population impairment associated with all candidate dams, additional investigation is required to assess whether flow releases from dams are sufficient to maintain native fish populations and other desirable ecological features in down-stream waters. In addition, an evaluation of other potential limiting factors (e.g., habitat degradation, nonnative spe-cies, pollution) not related to flows is necessary to deter-mine whether environmental flow management is justified. Therefore, the ultimate determination of environmental flow needs (and compliance with state and federal environmental flow regulations) will require site-specific assessments, sub-stantive social engagement, and possible legal enforcement (see box 1 for an example).
ConclusionsFrom an initial pool of 753 large dams in California, the screening process identified 181 candidate dams at which environmental flows may be warranted on the basis of
indicators of flow and ecological impairment. These dams fall within a broad range of biogeographic settings, sizes, and operational purposes. They all showed evidence of downstream flow alteration or had storage capacities that exceed annual inflows. For 65 of the 90 candidate dams with downstream flow gages, their observed monthly flows devi-ated from the expected values by 50% or more for at least 6 months of the year. Among the 181 candidate dams, 118 had storage capacities large enough to capture more than the average annual inflow. The candidate dams were also asso-ciated with indicators of fish population impairment; they were all located within the range of imperiled fish popula-tions sensitive to flow alteration.
By identifying dams for which there is evidence of both flow alteration and ecological impairment, our screening framework provides a transparent and objective basis for determining where more time-consuming investments in environmental flow assessment are needed. This framework is intended for application over broad spatial scales for evaluating hundreds to thousands of dams, in which an ini-tial screening is needed to prioritize effort and resources for agencies, nongovernmental organizations, and policymak-ers. It complements other environmental flow assessment approaches in which the specific ecological effects of dams are evaluated at the river basin scale (e.g., Risley et al. 2010).
Because of the large spatial scale at which the framework is applied, the screening criteria are restricted to relatively coarse indicators of ecological and hydrologic impairment that can be inferred from the best available region-wide data. Dams have the potential to affect freshwater ecosystems in a variety of ways that are not considered in this framework, including modifications to sediment transport processes (Vörösmarty et al. 2003, Schmidt and Wilcock 2008), ther-mal regime alterations (Olden and Naiman 2010), and facilitated nonnative species introductions (Moyle and
Box 1. Restoring environmental flows in Putah Creek, California.
In the 1950s, the US Bureau of Reclamation built Monticello Dam, on Putah Creek, a tributary of the Sacramento River in Yolo County. Streamflow in lower Putah Creek is completely regulated, except when large storms cause the dam to spill over. During a late 1980s drought, releases were so low that a 30-kilometer section of lower Putah Creek dried, resulting in fish kills and harm to riparian wildlife. In response, a citizen’s group; the University of California, Davis; and the city of Davis sued to increase flows (Putah Creek Council v. Solano Irrigation District and Solano County Water Agency). The trial court, citing California’s Fish and Game Code §5937, ordered a 50% increase in the minimum release schedule to keep the creek flowing to its mouth. Subsequent negotiations led to the Putah Creek Accord, signed in May 2000, which established additional operational requirements to benefit fish and other aquatic organisms (Moyle et al. 1998).
The Accord’s flow recommendations were based on the ecological needs of fish species and assemblages in the creek, assessed by expert opinion from long-term monitoring data, and included increased spring spawning and rearing flows for native fish, pulse flows to attract and support anadromous fish in the fall, and minimum flows to sustain fish in droughts. Nine years of creek monitoring indi-cate that the new flow regime has been successful in promoting the expansion and maintenance of native-dominated fish assemblages throughout the creek (Kiernan et al. 2012). Importantly, the restoration of native fishes was achieved by manipulating stream flows at biologically important times of the year and only required a small increase in the total volume of water delivered downstream (water that was not diverted) during most years.

Overview Articles
1016 BioScience • November 2014 / Vol. 64 No. 11 http://bioscience.oxfordjournals.org
Mount 2007). These and other factors affecting habitat suitability and ecological responses to environmental flows must be evaluated through more detailed study. We reiter-ate that the framework is a screening-level tool that shows where environmental flows likely warrant attention, but decisions over where to invest resources in environmental flows for ecosystem restoration need to be supplemented by knowledge of local ecological, social, and economic conditions. The hydrologic and ecological screening criteria are focused on those dams for which environmental flows should be assessed but do not preclude the need for site-level investigations of the dams’ impacts and the feasibility and potential benefits of environmental flows.
The lack of consistent information on dam opera-tions, downstream flow regimes, and below-dam aquatic ecosystems is a significant barrier to environmental flow management and the sustainable use of water resources (Pahl-Wostl et al. 2013). The National Inventory of Dams (USACE 2010) offers the most comprehensive database of dams in the United States. The database characterizes general classes of use (e.g., water supply, hydropower) but contains no quantitative information on how dams are operated (e.g., the timing and volume of inflows, storage, and outflows). Although California has a relatively dense network of USGS stream gages, flow conditions below the vast majority of dams are unknown. Finally, assessing the ecological impacts of dams is constrained by limited and non-uniformly distributed biological observations (Santos et al. 2014). Given these knowledge gaps, there is a clear need to develop an integrated system of monitoring and reporting to better characterize the current state of aquatic ecosystems, hydrologic regimes, and anthropogenic modi-fications. Furthermore, such efforts must be closely linked to policy and governance processes to support effective implementation of environmental flow recommendations (Pahl-Wostl et al. 2013).
The degradation of freshwater ecosystems combined with escalating pressures on water resources requires strong management responses to conserve threatened freshwater biota and ecosystem services. However, the scale of ecosystem deterioration means that a systematic approach is needed to provide a strategic and scientifically defensible framework for implementing conservation mea-sures (Nel et al. 2009, Linke et al. 2011). This is particularly true for securing environmental flow protections, which are often controversial and require substantial financial and technical resources for their implementation. Recent approaches to systematic freshwater conservation have been focused on protected area planning (Moilanen et al. 2008, Leathwick et al. 2010), systematic dam removal for improving fish passage (Kocovsky et al. 2009, Martin and Apse 2011, Null et al. 2014), and the prioritization of fresh-water ecosystem restoration projects (Kauffman-Axelrod and Steinberg 2010). The proposed framework fills an important gap by supporting the strategic implementation of environmental flows.
In this study, the framework is focused on the selection of dams at which environmental flows may be important for conserving California’s native fish populations. However, the screening approach can be adapted to other systems, screening criteria, and conservation targets. Furthermore, new ranking criteria can be used to support alternative con-servation priorities, such as the protection of ESA-listed spe-cies or aquatic biodiversity hotspots. In some cases, state or federal regulatory requirements can also be used as criteria to prioritize dams for environmental flow assessments. For example, the screening results indicated that only 38 of the 181 candidate dams in California are regulated under federal FERC or ESA requirements, which indicates that state policy and enforcement mechanisms, such as Fish and Game Code §5937, may be necessary to assess and implement environ-mental flows in most of the state’s priority dams.
Worldwide environmental flow programs (e.g., Bunn and Arthington 2002, Yarnell et al. 2010, Arthington 2012) show that re-operating dams to replicate ecologically meaningful aspects of the natural flow regime can help sustain riverine biota. Growing population pressures and climate change suggest that environmental flows will be an increasingly important strategy for freshwater ecosystem conservation. In California, for example, dams capable of storing and releasing cold-water flows will likely be crucial for sustain-ing salmon in river systems with warming climates (Null et al. 2010, Katz et al. 2012). Identifying dams located in river basins of conservation value could help set priorities for implementing environmental flows and other ecosys-tem restoration measures. Furthermore, projected changes in hydrology will also necessitate a reevaluation of dam safety, performance, and management policies (Pittock and Hartmann 2011, Viers 2011), which could present opportu-nities for operational or structural modifications (including dam removal). Therefore, understanding the relative impor-tance of dams from an ecological perspective can help set management priorities and guide the strategic conservation of freshwater ecosystems.
AcknowledgementsThis study benefited from conversations with Curtis Knight, Monty Schmitt, Brian Johnson, and Rene Henery. The manuscript was also greatly improved by comments from four anonymous reviewers. We thank Nick Santos for GIS analysis and modeling support. Daren Carlisle and David Wolock assisted with hydrologic modeling. Sydney Vickery helped with figure development. This research was sup-ported by funding from the Natural Resources Defense Council, California Trout, Trout Unlimited, the S. D. Bechtel, Jr. Foundation, and the California Energy Commission Public Interest Energy Research Program.
Supplemental materialThe supplemental material is available online at http://bio-science.oxfordjournals.org/lookup/suppl/doi:10.1093/biosci/biu159/-/DC1.
Overview Articles
http://bioscience.oxfordjournals.org November 2014 / Vol. 64 No. 11 • BioScience 1017
References citedArthington AH. 2012. Environmental Flows: Saving Rivers in the Third
Millennium. University of California Press.Batalla RJ, Gómez CM, Kondolf GM. 2004. Reservoir-induced hydrological
changes in the Ebro River basin (NE Spain). Journal of Hydrology 290: 117–136.
Berga L, Buil JM, Bofill E, De Cea JC, Garcia Perez JA, Mañueco G, Polimon J, Soriano A, Yagüe J, eds. 2006. Dams and Reservoirs, Societies and Environment in the 21st Century. Taylor and Francis.
Börk KS, Krovoza JF, Katz JV, Moyle PB. 2012. The rebirth of Cal. Fish & Game Code 5937: Water for fish. UC Davis Law Review 45: 809–913.
Breiman L. 2001. Random Forests. Machine Learning 45: 5–32.Brown LR, Ford T. 2002. Effects of flow on the fish communities of a regu-
lated California river: Implications for managing native fishes. River Research and Applications 18: 331–342.
Bruno MC, Siviglia A. 2012. Assessing impacts of dam operations—Interdisciplinary approaches for sustainable river management. River Research and Applications 28: 675–677.
Bunn SE, Arthington AH. 2002. Basic principles and ecological conse-quences of altered flow regimes for aquatic biodiversity. Environmental Management 30: 492–507.
Carlisle DM, Falcone J, Wolock DM, Meador MR, Norris RH. 2010a. Predicting the natural flow regime: Models for assessing hydro-logical alteration in streams. River Research and Applications 26: 118–136.
Carlisle DM, Wolock DM, Meador MR. 2010b. Alteration of streamflow magnitudes and potential ecological consequences: A multiregional assessment. Frontiers in Ecology and the Environment 9: 264–270.
Dudgeon D, et al. 2006. Freshwater biodiversity: Importance, threats, status and conservation challenges. Biological Reviews 81: 163–182.
[DWR] California Department of Water Resources. 2010. California Jurisdictional Dams. DWR. (5 September 2014; www.water.ca.gov/damsafety/damlisting)
Eng K, Carlisle DM, Wolock DM, Falcone JA. 2012. Predicting the likeli-hood of altered streamflows at ungauged rivers across the coterminuous United States. River Research and Applications 29: 781–791.
Esselman PC, Infante DM, Wang L, Cooper AR, Wieferich D, Tsang Y-P, Thornbrugh DJ, Taylor WW. 2013. Regional fish community indicators of landscape disturbance to catchments of the conterminous United States. Ecological Indicators 26: 163–173.
Falcone JA. 2011. GAGES-II: Geospatial attributes of gages for evaluat-ing streamflow. USGS. (5 September 2014; http://water.usgs.gov/GIS/ metadata/usgswrd/XML/gagesII_Sept2011.xml)
Gangloff MM. 2013. Taxonomic and ecological tradeoffs associated with small dam removals. Aquatic Conservation: Marine and Freshwater Ecosystems 23: 475–480.
Gillilan DM, Brown TC. 1997. Instream Flow Protection: Seeking a balance in western water use. Island Press.
Goslin M. 2005. Creating a comprehensive dam dataset for assessing anad-romous fish passage in California. NOAA Technical Memorandum no. NOAA-TM-NMFS-SWFSC-376.
Hirsch R, Walker J, Day J, Kallio R. 1990. The influence of man on hydro-logic systems. Pages 329–359 in Wolman MG, Riggs HC, eds. Surface Water Hydrology, vol. 0–1. Geological Society of America.
Katz J, Moyle PB, Quiñones RM, Israel J, Purdy S. 2013. Impending extinction of salmon, steelhead, and trout (Salmonidae) in California. Environmental Biology of Fishes 96: 1169–1186.
Kauffman-Axelrod J, Steinberg S. 2010. Development and application of an automated GIS based evaluation to prioritize wetland restoration opportunities. Wetlands 30: 437–448.
Kennen JG, Kauffman LJ, Ayers MA, Wolock DM, Colarullo SJ. 2008. Use of an integrated flow model to estimate ecologically relevant hydrologic characteristics at stream biomonitoring sites. Ecological Modelling 211: 57–76.
Kiernan J, Moyle PB, Crain PK. 2012. Restoring native fish assemblages to a regulated California stream using the natural flow regime concept. Ecological Applications 22: 1472–1482.
Kocovsky PM, Ross RM, Dropkin DS. 2009. Prioritizing removal of dams for passage of diadromous fishes on a major river system. River Research and Applications 25: 107–117.
Kondolf GM, Batalla RJ. 2005. Hydrological effects of dams and water diversions on rivers of Mediterranean-climate regions: examples from California. Pages 197–211 in Garcia C, Batalla RJ, eds. Catchment Dynamics and River Processes: Mediterranean and Other Climate Regions. Elsevier.
Konrad CP, Brasher AMD, May JT. 2008. Assessing streamflow characteris-tics as limiting factors on benthic invertebrate assemblages in streams across the western United States. Freshwater Biology 53: 1983–1998.
Konrad CP, Warner A, Higgins JV. 2012. Evaluating dam re-operation for freshwater conservation in the Sustainable Rivers Project. River Research and Applications 28: 777–792.
Leathwick JR, Moilanen A, Ferrier S, Julian K. 2010. Complementarity-based conservation prioritization using a community classification, and its application to riverine ecosystems. Biological Conservation 143: 984–991.
Lehner B, et al. 2011. High-resolution mapping of the world’s reservoirs and dams for sustainable river-flow management. Frontiers in Ecology and the Environment 9: 494–502.
Linke S, Turak E, Nel J. 2011. Freshwater conservation planning: The case for systematic approaches. Freshwater Biology 56: 6–20.
Marchetti MP, Moyle PB. 2001. Effects of flow regime on fish assemblages in a regulated California stream. Ecological Applications 11: 530–539.
Martin EH, Apse CD. 2011. Northeast Aquatic Connectivity: An Assessment of Dams on Northeastern Rivers. The Nature Conservancy, Eastern Freshwater Program.
Moilanen A, Leathwick J, Elith J. 2008. A method for spatial freshwater con-servation prioritization. Freshwater Biology 53: 577–592.
Moyle PB. 2002. Inland Fishes of California. Berkeley: University of California Press.
Moyle PB, Mount JF. 2007. Homogenous rivers, homogenous faunas. Proceedings of the National Academy of Sciences 104: 5711–5712.
Moyle PB, Katz JVE, Quiñones RM. 2011. Rapid decline of California’s native inland fishes: A status assessment. Biological Conservation 144: 2414–2423.
Nel JL, Roux DJ, Abell R, Ashton PJ, Cowling RM, Higgins JV, Thieme M, Viers JH. 2009. Progress and challenges in freshwater conservation planning. Aquatic Conservation: Marine and Freshwater Ecosystems 19: 474–485.
[NRCS and USGS] National Resources Conservation Service and United States Geological Survey. 2014. Watershed Boundary Dataset. (4 January 2012; http://www.nrcs.usda.gov/wps/portal/nrcs/main/national/water/watersheds/dataset)
Null SE, Deas ML, Lund JR. 2010. Flow and water temperature simulation for habitat restoration in the Shasta River, California. River Research and Applications 26: 663–681.
Null, SE, Medellín-Azura J, Escriva-Bou A, Lent M, Lund JR. 2014. Optimizing the dammed: Water supply losses and fish habitat gains from dam removal in California. Journal of Environmental Management 136: 121–131.
Olden JD, Naiman RJ. 2010. Incorporating thermal regimes into environ-mental flows assessments: Modifying dam operations to restore fresh-water ecosystem integrity. Freshwater Biology 55: 86–107.
Opperman JJ, Luster R, McKenney BA, Roberts M, Meadows AW. 2010. Ecologically functional floodplains: Connectivity, flow regime, and scale. Journal of the American Water Resources Association 46: 211–226.
Pahl-Wostl C, et al. 2013. Environmental flows and water governance: Managing sustainable water uses. Current Opinion in Environmental Sustainability 5: 341–351.
Palmer MA, Reidy Liermann CA, Nilsson C, Flörke M, Alcamo J, Lake PS, Bond N. 2008. Climate change and the world’s river basins: Anticipating management options. Frontiers in Ecology and the Environment 6: 81–89.
Pittock J, Hartmann J. 2011. Taking a second look: Climate change, periodic relicensing and improved management of dams. Marine and Freshwater Research 62: 312–320.

Overview Articles
1018 BioScience • November 2014 / Vol. 64 No. 11 http://bioscience.oxfordjournals.org
Poff NL, Zimmerman JKH. 2010. Ecological responses to altered flow regimes: A literature review to inform the science and management of environmental flows. Freshwater Biology 55: 194–205.
Poff NL, Allan JD, Bain MB, Karr JR, Prestegaard KL, Richter BD, Sparks RE, Stromberg JC. 1997. The natural flow regime: A par-adigm for river conservation and restoration. BioScience 47: 769–784.
Poff NL, et al. 2010. The ecological limits of hydrologic alteration (ELOHA): A new framework for developing regional environmental flow stan-dards. Freshwater Biology 55: 147–170.
Reidy Liermann C, Nilsson C, Robertson J, Ng RY. 2012. Implications of dam obstruction for global freshwater fish diversity. BioScience 62: 539–548. (art. 12)
Richter BD, Davis MM, Apse C, Konrad C. 2012. A presumptive standard for environmental flow protection. River Research and Applications 28: 1312–1321.
Richter BD, Warner AT, Meyer JL, Lutz K. 2006. A collaborative and adap-tive process for developing environmental flow recommendations. River Research and Applications 22: 297–318.
Risley J, Wallick JR, Waite I, Stonewall A. 2010. Development of an Environmental Flow Framework for the McKenzie River Basin, Oregon. US Geological Survey. Scientific Investigations Report no. 2010–5016.
Sanborn SC, Bledsoe BP. 2006. Predicting streamflow regime metrics for ungauged streams in Colorado, Washington, and Oregon. Journal of Hydrology 325: 241–261.
Santos NR, Katz JV, Moyle PB, Viers JH. 2014. A programmable infor-mation system for management and analysis of aquatic species range data in California. Environmental Modelling and Software 53: 13–26.
Schmidt JC, Wilcock PR. 2008. Metrics for assessing the downstream effects of dams. Water Resources Research 44 (art. W04404).
Singh V, Woolhiser D. 2002. Mathematical modeling of watershed hydrol-ogy. Journal of Hydrologic Engineering 7: 270–292.
Smith S, Renwick W, Bartley J, Buddemeier R. 2002. Distribution and significance of small, artificial water bodies across the United States landscape. Science of the Total Environment 299: 21–36.
Tharme RE. 2003. A global perspective on environmental flow assessment: Emerging trends in the development and application of environmental flow methodologies for rivers. River Research and Applications 19: 397–441.
[USACE] US Army Corps of Engineers. 2010. CorpsMap: National Inventory of Dams. USACE. (5 September 2014; http://nid.usace.army.mil)
Viers JH, Rheinheimer DE. 2011. Freshwater conservation options for a changing climate in California’s Sierra Nevada. Marine and Freshwater Research 62: 266–278.
Viers JH. 2011. Hydropower relicensing and climate change. Journal of the American Water Resources Association 47: 655–661.
Vörösmarty CJ, Meybeck M, Fekete B, Sharma K, Green P, Syvitski JPM. 2003. Anthropogenic sediment retention: Major global impact from reg-istered river impoundments. Global and Planetary Change 39: 169–190.
Williams JG. 2011. Environmental Flow Assessments: A Critical Review and Commentary. California Energy Commission. Report no. PIER CEC-500-2011-037.
Xenopoulos MA, Lodge DM, Alcamo J, Marker M, Schulze K, Van Vuuren DP. 2005. Scenarios of freshwater fish extinctions from climate change and water withdrawal. Global Change Biology 11: 1557–1564.
Yarnell SM, Viers JH, Mount JF. 2010. Ecology and Management of the Spring Snowmelt Recession. BioScience 60: 114–127.
Theodore E. Grantham ([email protected]) is a research biologist at the U.S. Geological Survey Fort Collins Science Center. He conducted this work as a postdoctoral researcher at the Center for Watershed Sciences, at the University of California, Davis. Joshua H. Viers is an associate professor in the School of Engineering at the University of California, Merced. Peter B. Moyle is the associate director of the Center for Watershed Sciences and a professor in the Department of Wildlife, Fish, and Conservation Biology at the University of California, Davis.
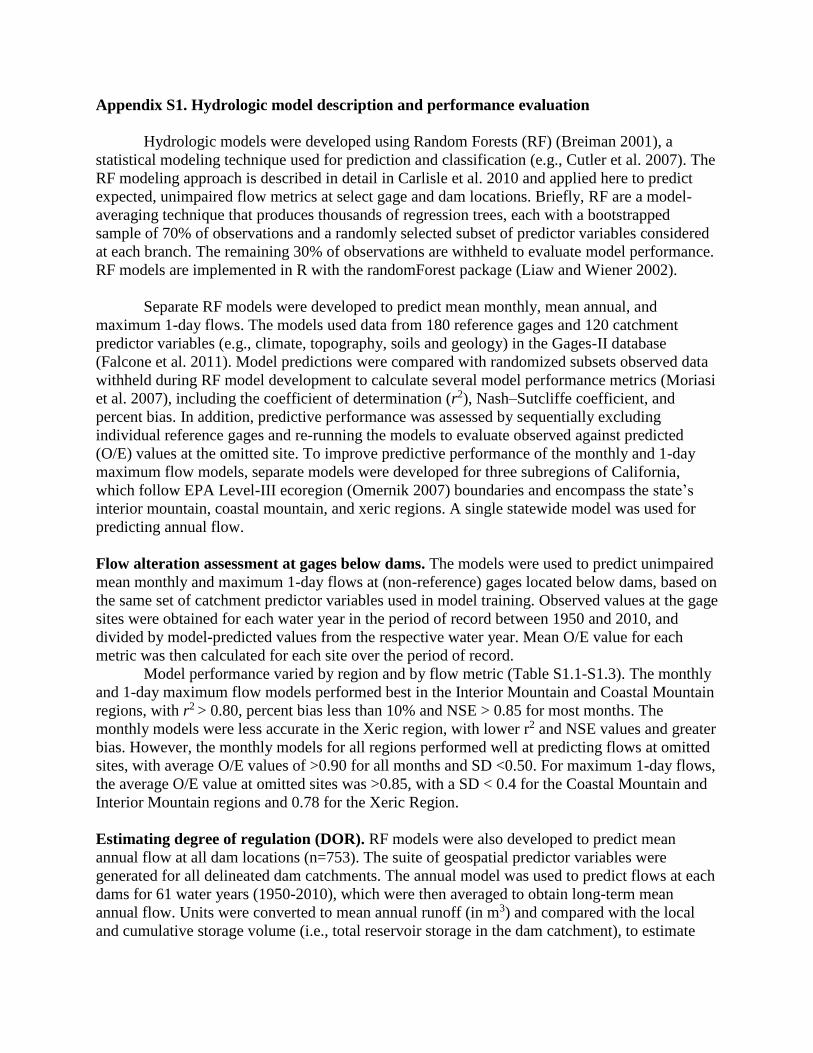
Appendix S1. Hydrologic model description and performance evaluation
Hydrologic models were developed using Random Forests (RF) (Breiman 2001), a
statistical modeling technique used for prediction and classification (e.g., Cutler et al. 2007). The
RF modeling approach is described in detail in Carlisle et al. 2010 and applied here to predict
expected, unimpaired flow metrics at select gage and dam locations. Briefly, RF are a model-
averaging technique that produces thousands of regression trees, each with a bootstrapped
sample of 70% of observations and a randomly selected subset of predictor variables considered
at each branch. The remaining 30% of observations are withheld to evaluate model performance.
RF models are implemented in R with the randomForest package (Liaw and Wiener 2002).
Separate RF models were developed to predict mean monthly, mean annual, and
maximum 1-day flows. The models used data from 180 reference gages and 120 catchment
predictor variables (e.g., climate, topography, soils and geology) in the Gages-II database
(Falcone et al. 2011). Model predictions were compared with randomized subsets observed data
withheld during RF model development to calculate several model performance metrics (Moriasi
et al. 2007), including the coefficient of determination (r2), Nash–Sutcliffe coefficient, and
percent bias. In addition, predictive performance was assessed by sequentially excluding
individual reference gages and re-running the models to evaluate observed against predicted
(O/E) values at the omitted site. To improve predictive performance of the monthly and 1-day
maximum flow models, separate models were developed for three subregions of California,
which follow EPA Level-III ecoregion (Omernik 2007) boundaries and encompass the state’s
interior mountain, coastal mountain, and xeric regions. A single statewide model was used for
predicting annual flow.
Flow alteration assessment at gages below dams. The models were used to predict unimpaired
mean monthly and maximum 1-day flows at (non-reference) gages located below dams, based on
the same set of catchment predictor variables used in model training. Observed values at the gage
sites were obtained for each water year in the period of record between 1950 and 2010, and
divided by model-predicted values from the respective water year. Mean O/E value for each
metric was then calculated for each site over the period of record.
Model performance varied by region and by flow metric (Table S1.1-S1.3). The monthly
and 1-day maximum flow models performed best in the Interior Mountain and Coastal Mountain
regions, with r2 > 0.80, percent bias less than 10% and NSE > 0.85 for most months. The
monthly models were less accurate in the Xeric region, with lower r2 and NSE values and greater
bias. However, the monthly models for all regions performed well at predicting flows at omitted
sites, with average O/E values of >0.90 for all months and SD <0.50. For maximum 1-day flows,
the average O/E value at omitted sites was >0.85, with a SD < 0.4 for the Coastal Mountain and
Interior Mountain regions and 0.78 for the Xeric Region.
Estimating degree of regulation (DOR). RF models were also developed to predict mean
annual flow at all dam locations (n=753). The suite of geospatial predictor variables were
generated for all delineated dam catchments. The annual model was used to predict flows at each
dams for 61 water years (1950-2010), which were then averaged to obtain long-term mean
annual flow. Units were converted to mean annual runoff (in m3) and compared with the local
and cumulative storage volume (i.e., total reservoir storage in the dam catchment), to estimate

degree-of-regulation (DOR) and cumulative DOR (CDOR) metrics. The model performed well
in predicting annual flow values at omitted sites, with high accuracy and limited bias (Table
S1.4).
Table S1.1. Performance of monthly and maximum 1-day flow in Coastal Mountain Zone
Model
r2 Nash
Sutcliffe % Bias
Mean O/E SD O/E
January 0.92 0.91 3.26 0.94 0.31
February 0.88 0.88 -1.38 0.97 0.31
March 0.93 0.93 0 0.95 0.29
April 0.92 0.92 5.17 0.96 0.3
May 0.84 0.83 9.23 0.94 0.34
June 0.81 0.8 10.04 0.93 0.38
July 0.81 0.75 12.38 0.93 0.31
August 0.85 0.8 12.05 0.85 0.31
September 0.83 0.76 15.47 0.9 0.31
October 0.84 0.84 2.78 0.97 0.4
November 0.88 0.88 -2.1 0.94 0.37
December 0.94 0.94 1.57 0.93 0.32
Maximum 1-
day 0.89 0.89 -4.1 0.93 0.39

Table S1.2. Performance of monthly and maximum 1-day flow in Interior Mountain Zone
Model
r2 Nash
Sutcliffe % Bias
Mean O/E SD O/E
January 0.72 0.78 3.38 0.98 0.43
February 0.73 0.73 6.74 0.97 0.4
March 0.88 0.86 5.01 0.97 0.3
April 0.87 0.87 3.78 0.97 0.28
May 0.93 0.92 7.3 0.95 0.26
June 0.94 0.94 1.68 0.93 0.31
July 0.90 0.90 -0.29 0.98 0.42
August 0.82 0.81 -9.15 0.95 0.39
September 0.67 0.67 -2.75 0.91 0.42
October 0.84 0.82 -8.33 1.01 0.38
November 0.83 0.82 -6.48 1.05 0.46
December 0.84 0.83 1.75 0.99 0.49
Maximum 1-
day 0.91 0.89 -6.2 0.93 0.42

Table S1.3. Performance of monthly and maximum 1-day flow in Xeric Zone
Model
r2 Nash
Sutcliffe % Bias
Mean O/E SD O/E
January 0.51 0.48 -1.27 0.96 0.54
February 0.66 0.66 -0.69 0.95 0.49
March 0.56 0.54 -3.34 0.96 0.45
April 0.58 0.55 -5.17 0.95 0.45
May 0.68 0.66 -5.81 0.97 0.4
June 0.67 0.64 -7.64 0.98 0.37
July 0.63 0.57 -11.53 0.98 0.34
August 0.58 0.42 -16.77 0.98 0.35
September 0.61 0.56 -9.72 0.98 0.32
October 0.36 0.33 -12.74 0.97 0.38
November 0.61 0.61 -6.61 0.93 0.46
December 0.75 0.75 -1.27 0.95 0.54
Maximum 1-
day
0.74 0.73 -1.06 0.86 0.78
Table S1.4. Performance of annual flow model, used for estimating degree-of-regulation (DOR)
at dam locations
Model
r2 Nash
Sutcliffe % Bias
Mean O/E SD O/E
Annual flow 0.95 0.94 1.21 0.94 0.30

References
Breiman L. 2001. Random Forests. Machine Learning 45: 5-32.
Carlisle DM, Falcone J, Wolock DM, Meador MR, Norris RH. 2010. Predicting the natural flow
regime: models for assessing hydrological alteration in streams. River Research and
Applications 26: 118-136.
Cutler DR, Edwards Jr TC, Beard KH, Cutler A, Hess KT, Gibson J, Lawler JJ. 2007. Random
forests for classification in ecology. Ecology 88: 2783-2792.
Falcone J. 2011. Gages-II: Geospatial Attributes of Gages for Evaluating Streamflow. Accessed
January 9, 2014 at: http://water.usgs.gov/GIS/metadata/usgswrd/XML/gagesII_Sept2011.xml
Liaw A, Wiener M. 2002. Classification and Regression by randomForest. R news 2: 18-22.
Moriasi D, Arnold J, Van Liew M, Bingner R, Harmel R, Veith T. 2007. Model evaluation
guidelines for systematic quantification of accuracy in watershed simulations. Transactions
of the ASABE 50: 885-900.
Omernik JM. 1987. Ecoregions of the conterminous United States. Annals of the Association of
American geographers 77: 118-125.
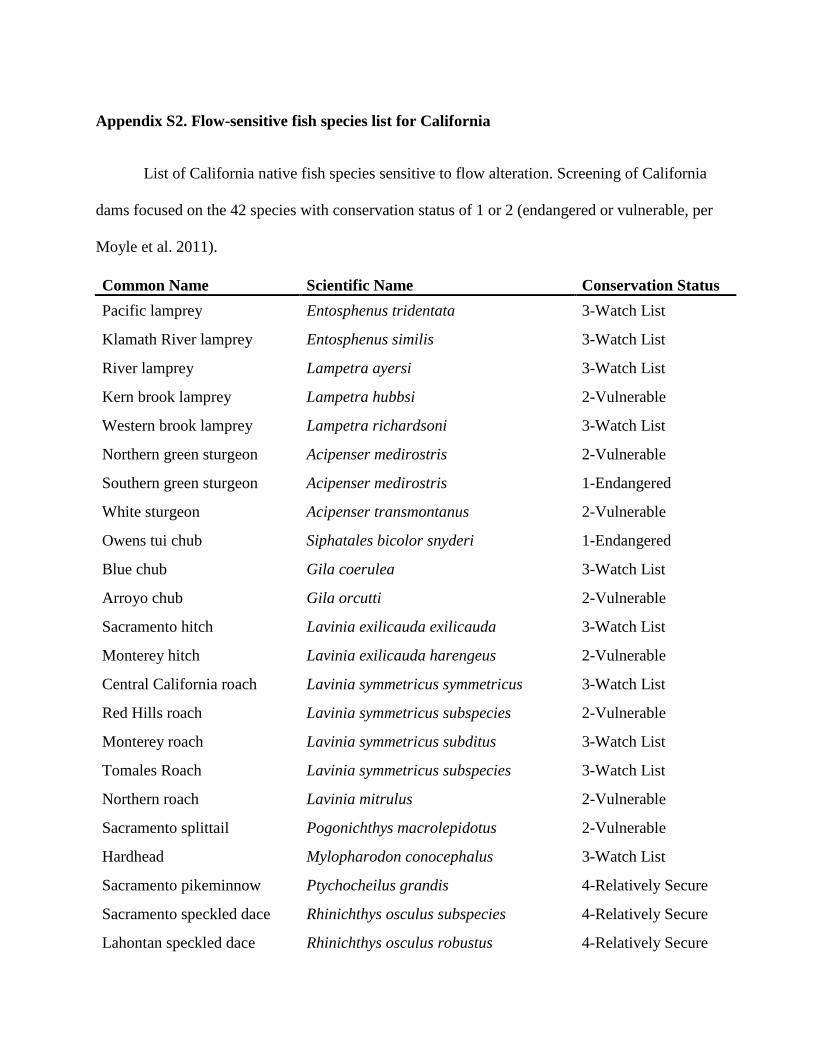
Appendix S2. Flow-sensitive fish species list for California
List of California native fish species sensitive to flow alteration. Screening of California
dams focused on the 42 species with conservation status of 1 or 2 (endangered or vulnerable, per
Moyle et al. 2011).
Common Name Scientific Name Conservation Status
Pacific lamprey Entosphenus tridentata 3-Watch List
Klamath River lamprey Entosphenus similis 3-Watch List
River lamprey Lampetra ayersi 3-Watch List
Kern brook lamprey Lampetra hubbsi 2-Vulnerable
Western brook lamprey Lampetra richardsoni 3-Watch List
Northern green sturgeon Acipenser medirostris 2-Vulnerable
Southern green sturgeon Acipenser medirostris 1-Endangered
White sturgeon Acipenser transmontanus 2-Vulnerable
Owens tui chub Siphatales bicolor snyderi 1-Endangered
Blue chub Gila coerulea 3-Watch List
Arroyo chub Gila orcutti 2-Vulnerable
Sacramento hitch Lavinia exilicauda exilicauda 3-Watch List
Monterey hitch Lavinia exilicauda harengeus 2-Vulnerable
Central California roach Lavinia symmetricus symmetricus 3-Watch List
Red Hills roach Lavinia symmetricus subspecies 2-Vulnerable
Monterey roach Lavinia symmetricus subditus 3-Watch List
Tomales Roach Lavinia symmetricus subspecies 3-Watch List
Northern roach Lavinia mitrulus 2-Vulnerable
Sacramento splittail Pogonichthys macrolepidotus 2-Vulnerable
Hardhead Mylopharodon conocephalus 3-Watch List
Sacramento pikeminnow Ptychocheilus grandis 4-Relatively Secure
Sacramento speckled dace Rhinichthys osculus subspecies 4-Relatively Secure
Lahontan speckled dace Rhinichthys osculus robustus 4-Relatively Secure

Owens speckled dace Rhinichthys osculus subspecies 1-Endangered
Santa Ana speckled dace Rhinichthys osculus subspecies 1-Endangered
Lahontan mountain sucker Catostomus platyrhynchus 3-Watch List
Sacramento sucker Catostomus occidentalis occidentalis 4-Relatively Secure
Monterey sucker Catostomus occidentalis mnioltiltus 4-Relatively Secure
Modoc sucker Catostomus microps 1-Endangered
Klamath largescale sucker Catostomus snyderi 2-Vulnerable
Lost River sucker Catostomus luxatus 1-Endangered
Santa Ana sucker Catostomus santaanae 1-Endangered
Shortnose sucker Chasmistes brevirostris 2-Vulnerable
Razorback sucker Xyrauchen texanus 1-Endangered
Longfin smelt Spirinchus thaleichthys 2-Vulnerable
Delta smelt Hypomesus pacificus 1-Endangered
Mountain whitefish Prosopium williamsoni 3-Watch List
Upper Klamath-Trinity fall
Chinook salmon Oncorhynchus tshawytscha 2-Vulnerable
Upper Klamath-Trinity
spring Chinook salmon Oncorhynchus tshawytscha 1-Endangered
California Coast fall Chinook
salmon Oncorhynchus tshawytscha 2-Vulnerable
Central Valley winter
Chinook salmon Oncorhynchus tshawytscha 2-Vulnerable
Central Valley spring
Chinook salmon Oncorhynchus tshawytscha 2-Vulnerable
Central Valley late fall
Chinook salmon Oncorhynchus tshawytscha 1-Endangered
Central Valley fall Chinook
salmon Oncorhynchus tshawytscha 2-Vulnerable
Central coast coho salmon Oncorhynchus kisutch 1-Endangered
Southern Oregon Northern
California coast coho salmon Oncorhynchus kisutch 1-Endangered
Northern California coast
winter steelhead Oncorhynchus mykiss 3-Watch List
Northern California coast
summer steelhead Oncorhynchus mykiss 1-Endangered
Klamath Mountains Province
winter steelhead Oncorhynchus mykiss 3-Watch List

Klamath Mountains Province
summer steelhead Oncorhynchus mykiss 1-Endangered
Central California coast
winter steelhead Oncorhynchus mykiss 2-Vulnerable
South Central California
coast steelhead Oncorhynchus mykiss 2-Vulnerable
Southern California steelhead Oncorhynchus mykiss 1-Endangered
Kern River rainbow trout Oncorhynchus mykiss gilberti 1-Endangered
Lahontan cutthroat trout Oncorhynchus clarki henshawi 2-Vulnerable
Desert pupfish Cyprinodon macularius 1-Endangered
Owens pupfish Cyprinodon radiosus 1-Endangered
Bigeye marbled sculpin Cottus klamathensis macrops 2-Vulnerable
Lower Klamath marbled
sculpin Cottus klamathensis polyporus 3-Watch List
Upper Klamath marbled
sculpin Cottus klamathensis klamathensis 3-Watch List
Riffle sculpin Cottus gulosus 3-Watch List
Pit sculpin Cottus pitensis 4-Relatively Secure
Inland threespine stickleback Gasterosteus aculeatus microcephalus 4-Relatively Secure
Unarmored threespine
stickleback Gasterosteus aculeatus williamsoni 1-Endangered
Sacramento perch Archoplites interruptus 1-Endangered
Sacramento tule perch Hysterocarpus traskii traskii 3-Watch List
Tidewater Goby Eucyclogobius newberryi 2-Vulnerable
References
Moyle PB, Katz JVE, Quiñones RM. 2011. Rapid decline of California's native inland fishes: a
status assessment. Biological Conservation 144: 2414-2423.

Appendix S3. High-priority candidate dams for assessing environmental flow needs for
imperiled species conservation and recovery
Dams (n = 181) identified through screening process based on indicators of hydrologic
alteration and potential to adversely affect imperiled flow-sensitive fish species (table S3.1). An
additional 156 dams (table S3.2) with evidence of hydrological alteration occur in watersheds
from which flow-sensitive species have been locally extirpated and may warrant environmental
flows to support the recovery of imperiled fish populations.
Table 3.1. High-priority candidate dams for assessing environmental flow needs for imperiled
species conservation
NID Name County River
CA00454 Agnew Lake Mono Rush Creek
CA00949 Albaugh No 2 Lassen Trib Willow Creek
CA00731 Alisal Creek Santa Barbara Alisal Creek
CA00204 Alpine Marin Lagunitas Creek
CA00226 Anderson Cottonwood Shasta Sacramento River
CA00964 Anthony House Nevada Deer Creek
CA01412 Arundell Barranca Ventura Arundell Barranca
CA00336 Balch Afterbay Fresno North Fork Kings River
CA00665 Bean Hollow #2 (De Los Frijoles) San Mateo Arroyo De Los Frijoles
CA00666 Bean Hollow #3 (De Los Frijoles) San Mateo Arroyo De Los Frijoles
CA00757 Bear Valley San Bernardino Bear Creek
CA00191 Big Tujunga No. 1 Los Angeles Big Tujunga Creek
CA00601 Blodgett Sacramento Laguna Creek
CA00207 Bon Tempe Marin Lagunitas Creek
CA00088 Bouquet Canyon Los Angeles Bouquet Creek
CA00245 Bowman Nevada Canyon Creek
CA00802 Boxsprings Riverside Box Springs Creek
CA10136 Bradbury Santa Barbara Santa Ynez River
CA00284 Bridgeport Mono East Walker Rv
CA00126 Calaveras Alameda Calaveras Creek
CA00227 Camp Far West Yuba Bear River
CA01086 Camp Far West Diversion Yuba Bear River
CA00399 Cape Horn Dam (Van Arsdale Reservoir) Mendocino South Eel River
CA00378 Caples Lake (Twin Lake) Alpine Trib Silver Fork
CA10139 Casitas Ventura Coyote Creek
CA00044 Castaic Los Angeles Castaic Creek
CA00049 Cedar Springs San Bernardino West Fork Mojave River
CA00165 Chabot Alameda San Leandro Creek
CA10141 Clear Lake Modoc Lost River
CA01119 Clementia Sacramento Trib Cosumnes River

CA00214 Copper Basin San Bernardino Copper Basin
CA00239 Crocker Diversion (Snelling Diversion) Merced Merced River
CA82504 Deer Hill Modoc Trib Fletcher Creek
CA00281 Don Pedro Main Tuolumne Tuolumne River
CA01248 Dove Canyon Orange Dove Creek
CA00068 Dry Canyon Los Angeles Dry Canyon Creek
CA00811 Dry Creek Contra Costa Dry Creek
CA01240 Edwards Reservoir Santa Barbara Trib Gato Creek
CA00806 Elmer J Chesbro Santa Clara Llagas Creek
CA10105 Englebright Yuba Yuba River
CA10216 Fallen Leaf El Dorado Taylor Creek
CA10104 Farmington Dam San Joaquin Rock And Littlejohn Creeks
CA00256 Faucherie Lake Main Nevada Canyon Creek
CA10148 Folsom Sacramento American River
CA00247 French Lake Nevada Canyon Creek
CA10154 Friant Fresno San Joaquin River
CA00138 Gibraltar Santa Barbara Santa Ynez River
CA10156 Glen Anne Santa Barbara West Fork Glen Annie Canyon
CA00260 Goodwin Calaveras Stanislaus River
CA00089 Grant Lake Mono Rush Creek
CA00760 Grass Valley San Bernardino Grass Valley Creek
CA10320 Green Tank Modoc Trib Fletcher Creek
CA00290 Guadalupe Santa Clara Guadalupe Creek
CA10019 Hansen Los Angeles Tujunga Wash
CA00694 Hawkins San Benito Trib Arroyo De Las Viboras
CA01030 Haynes Res Shasta Goose Creek
CA00641 Heenan Lake Alpine Tr Efk Carson R
CA00851 Herman, Lake Solano Sulphur Springs Creek
CA00848 Hernandez San Benito San Benito River
CA00417 Iron Canyon Shasta Iron Canyon Creek
CA00325 Iron Gate Siskiyou Klamath River
CA00252 Jackson Lake Nevada Jackson Creek
CA00254 Jackson Meadows Nevada Middle Fork Yuba River
CA00132 James H Turner (San Antonio Reservoir) Alameda San Antonio Creek
CA00211 Juncal Santa Barbara Santa Ynez River
CA00340 Kerckhoff Madera San Joaquin River
CA10160 Keswick Shasta Sacramento River
CA00278 La Grange Stanislaus Tuolumne River
CA00327 Lake Almanor Plumas North Fork Feather River
CA00161 Lake Anza (C L Tilden Park) Contra Costa Wildcat Creek
CA00759 Lake Arrowhead San Bernardino Little Bear Creek
CA00142 Lake Frey Solano Wild Horse Creek
CA00224 Lake Gregory San Bernardino Houston Creek

CA00763 Lake Hemet Riverside Trib San Jacinto River
CA10131 Lake Oneill San Diego Santa Margarita River Offstream
CA00736 Lake Sherwood Ventura Potrero Valley Creek
CA10162 Lake Tahoe Placer Truckee River
CA10164 Lauro Santa Barbara Diablo Creek
CA10165 Lewiston Trinity Trinity River
CA00090 Long Valley Mono Owens River
CA00887 Lopez San Luis Obispo Arroyo Grande Creek
CA00380 Lower Blue Lake Alpine Blue Creek
CA00127 Lower Crystal Springs San Mateo San Mateo Creek
CA00635 Lower Kinney Lake Alpine Tr Silver Creek
CA00664 Lucerne, Lake San Mateo Arroyo De Los Frijoles
CA00296 Magalia Butte Little Butte Creek
CA00739 Malibu Lake Club Los Angeles Malibu Creek
CA10108 Martis Creek Nevada Martis Creek
CA00312 Matilija Ventura Matilija Creek
CA00459 McBrien Modoc Pit River
CA00242 McSwain Mariposa Merced River
CA00381 Meadow Lake Alpine Trib North Fork Mokelumne
CA00341 Merced Falls Merced Merced River
CA01313 Merlo Sonoma Fall Creek
CA00248 Milton Nevada/Sierra Middle Yuba River
CA01122 Mission Viejo, Lake Orange Oso Creek
CA00243 Modesto Res Stanislaus Trib Tuolumne River
CA10021 Mojave Dam San Bernardino W Fk Mojave River
CA10170 Monticello Yolo Putah Creek
CA00216 Morris Los Angeles San Gabriel River
CA00155 Municipal Solano Trib Suisun Creek
CA00953 Myers Lassen Trib Ash Creek
CA00812 Nacimiento San Luis Obispo Nacimiento River
CA01029 Nash Shasta Trib Stillwater Creek
CA01082 New U San Leandro Alameda San Leandro Creek
CA00156 Newell Santa Cruz San Lorenzo River
CA10174 Nimbus Sacramento American River
CA00299 North Fork (Pacheco Dam) Santa Clara Pacheco Creek
CA00674 Notre Dame San Mateo Belmont Creek
CA00321 Novato Creek Marin Novato Creek
CA00193 Pacoima Los Angeles Pacoima Creek
CA00847 Paicines San Benito Trib Tres Pinos Creek
CA00297 Paradise Butte Little Butte Creek
CA00301 Peoples Weir Kings Kings River
CA00208 Peters Marin Lagunitas Creek
CA00206 Phoenix Lake Marin Ross Creek

CA00128 Pilarcitos San Mateo Pilarcitos Creek
CA10112 Pine Flat Fresno Kings River
CA00397 Pit No. 4 Diversion Shasta Pit River
CA00402 Pit No. 5 Diversion Shasta Pit River
CA83281 Pit River Weir Shasta Pit River
CA01008 Pomponio Ranch San Mateo Pomponio Creek
CA00743 Potrero Los Angeles Potrero Valley
CA10179 Prosser Creek Nevada Prosser Creek
CA10180 Putah Diversion Yolo, Solano Putah Creek
CA00052 Pyramid Los Angeles Piru Creek
CA00761 Rancho Cielito San Bernardino Trib Chino Creek
CA00011 Rector Creek Napa Rector Creek
CA10181 Red Bluff Diversion Tehama Sacramento River
CA00921 Renner Sibley Cr Modoc Sibley Creek
CA00262 Rodden Lake Stanislaus Lesnini Creek
CA00934 Ross No 1 Shasta Trib Stillwater Creek
CA01351 Rubber Dam 1 Alameda Alameda Creek
CA01380 Rubber Dam 2 Alameda Alameda Creek
CA01251 Rubber Dam 3 Alameda Alameda Creek
CA10202 Salinas San Luis Obispo Salinas River
CA00129 San Andreas San Mateo Trib San Mateo Creek
CA00813 San Antonio Monterey San Antonio River
CA00195 San Dimas Los Angeles San Dimas Creek
CA00200 San Gabriel Los Angeles San Gabriel River
CA10323 San Justo San Benito Offstream
CA00166 San Pablo Contra Costa San Pablo Creek
CA10024 Santa Fe Los Angeles San Gabriel River
CA00805 Santa Felicia Ventura Piru Creek
CA00398 Scott Lake Eel River
CA00563 Scout Lake Mendocino Trib Berry Creek
CA00669 Searsville San Mateo Corte Madera Creek
CA00209 Seeger Marin Nicasio Creek
CA10025 Sepulveda Los Angeles Los Angeles River
CA10186 Shasta Shasta Sacramento River
CA01083 Soulajule Marin Arroyo Sausal
CA00873 Sulphur Creek Orange Sulphur Creek
CA00461 SX (Essex) Modoc Trib Pit River
CA00800 Sycamore Riverside Sycamore Canyon
CA01266 Sycamore Canyon Ventura Sycamore Can
CA00729 Tejon Storage 2 Kern Trib Tejon Creek
CA00888 Terminal San Luis Obispo Trib Arroyo Grande
CA10114 Terminus (Lake Kaweah) Tulare Kaweah River
CA00036 Thermalito Diversion Butte Feather River

CA00084 Tinemaha Inyo Owens River
CA01123 Trampas Canyon Orange Trampas Canyon
CA00956 Tule Lake (Moon Lake) Lassen Cedar Creek
CA00265 Tulloch Calaveras Stanislaus River
CA00384 Twin Lakes Alpine Trib North Fork Mokelumne
CA10197 Twitchell San Luis Obispo Cuyama River
CA00385 Upper Blue Lake Alpine Blue Creek
CA01145 Upper Oso Orange Oso Creek
CA00807 Uvas Santa Clara Uvas Creek
CA00770 Vail Riverside Temecula Creek
CA00602 Van Vleck Sacramento Trib Arkansas Creek
CA00842 Virginia Ranch Yuba Dry Creek
CA10303 Warm Springs Sonoma Dry Creek
CA10232 Weaver Nevada Eastfork
CA00300 West Valley Modoc West Valley Creek
CA00904 Westlake Reservoir Los Angeles Tree Springs Creek
CA00029 Whale Rock San Luis Obispo Old Creek
CA10204 Whiskeytown Shasta Clear Creek
CA00586 William, Lake Napa Trib Milliken Creek
CA00850 Wood Ranch Ventura Trib Arroyo Simi
CA00285 Woodbridge Div San Joaquin Mokelumne River
CA00276 Woodward Stanislaus Simmons Creek

Table 3.2. Candidate dams for assessing environmental flow needs for imperiled species
recovery
NID Name County River
CA01361 Agua Chinon Orange Agua Chinon Wash
CA00798 Alessandro Riverside Alessandro Creek
CA00289 Almaden Santa Clara Almitos Creek
CA00294 Anderson Santa Clara Coyote River
CA00266 Beardsley Afterbay Tuolumne Middle Fork Stanislaus River
CA00413 Belden Forebay (Caribou Afterbay) Plumas North Fork Feather River
CA00835 Berenda Slough Madera Berenda Slough
CA00434 Big Creek Dam No. 3a (Huntington) Fresno Big Creek
CA00432 Big Creek Dam No. 6 Fresno San Joaquin River
CA00440 Big Creek Dam No. 7 (Redinger Lake) Fresno San Joaquin River
CA00187 Big Dalton Los Angeles Big Dalton Wash
CA01075 Big Dry Creek Fresno Big Dry Cr & Do
CA00233 Big Sage Modoc Rattlesnake Creek
CA10102 Black Butte Tehama Stony Creek
CA10135 Boca Nevada Little Truckee River
CA00747 Bonita Canyon Orange Bonita Creek
CA00566 Bordeaux, Lake Lake Trib Bucksnort Creek
CA00524 Branham Flat Lassen Branham Creek
CA01098 Bravo Lake Reservoir Tulare Wutchumna Ditch
CA10342 Brown Mtn Barrier Los Angeles Arroyo Seco
CA00824 Brush Creek El Dorado Brush Creek
CA10243 Buchanan Madera Chowchilla River
CA00332 Bucks Lake (Bucks Storage) Plumas Bucks Creek
CA10103 Burns Merced Burns Creek
CA00781 Calavera San Diego Calavera Creek
CA00288 Calero Santa Clara Calero Creek
CA00173 Camanche Main San Joaquin Mokelumne River
CA00817 Camino El Dorado Silver Creek
CA01355 Castle Merced Canal Creek
CA00067 Chatsworth Los Angeles Trib Los Angeles River
CA00158 Cherry Flat Santa Clara Penitencia Creek
CA00125 Cherry Valley Tuolumne Cherry Creek
CA00418 Chili Bar El Dorado South Fork American River
CA01011 Coit Santa Clara Trib North Fork Pacheco Creek
CA00104 Conn Creek Napa Conn Creek
CA00287 Coyote Santa Clara Coyote Creek
CA10201 Coyote Valley Dam Mendocino East Fork Russian River
CA00329 Cresta Plumas North Fork Feather River
CA00840 Cull Creek Alameda Cull Creek

CA10327 Cummings Res No 2 Modoc Pit River Trib
CA00234 Cuyamaca San Diego Boulder Creek
CA00656 Davis No 2 San Joaquin Trib Calaveras River
CA00043 Del Valle Alameda Arroyo Valley
CA00878 Dixon San Diego Trib Escondido Creek
CA00537 Donner Lake Nevada Donner Creek
CA10144 Dorris Modoc Stockdill Slough
CA00929 Dwight Hammond Siskiyou Trib Shasta River
CA00120 Early Intake Tuolumne Tuolumne River
CA01055 Eaton H. Magoon Lake (Upper Bohn Lake) Napa Routan Creek
CA00111 El Capitan San Diego San Diego River
CA00486 Enquist Modoc Trib Olivers Can
CA10313 Everly Modoc Long Branch Cyn
CA01327 Fancher Creek Fresno Fancher Cr & Hog Creek
CA00273 Forbestown Diversion Butte South Fork Feather River
CA00655 Gilmore San Joaquin Trib Mormon Slough
CA00612 Goffinet Amador Jackass Creek
CA00675 Grant Company 2 Santa Clara Arroyo Aguague
CA00333 Grizzly Forebay Plumas Grizzly Creek
CA00605 Hamel Sacramento Trib Dry Creek
CA00797 Harrison Street Riverside Harrison Creek
CA00005 Henderson Amador Jackass Creek
CA00702 Hendricks Head Diversion Butte Trib Horse Creek
CA00283 Henshaw San Diego San Luis Rey River
CA10244 Hidden Dam Madera Fresno River
CA00108 Hodges, Lake San Diego San Dieguito River
CA00515 Hog Flat Lassen Tr Susan River
CA00867 Jackson Creek Amador Jackson Creek
CA00232 Jacobs Creek El Dorado Jacobs Creek
CA00293 James J. Lenihan (Lexington) Santa Clara Los Gatos Creek
CA00706 Jane, Lake Madera Trib Hildreth Creek
CA00815 Junction El Dorado Silver Creek
CA00698 Kelsey Merced Trib South Fork Dry Creek
CA82531 Kern No 3 Tulare Kern River
CA01307 Kilmer Tuolumne Trib Dry Creek
CA00748 Laguna Orange Trib San Diego Creek
CA00140 Lake Curry Napa Gordon Valley Creek
CA00776 Lake Loveland San Diego Sweetwater River
CA00745 Lambert Orange Trib Newport Bay
CA01217 Las Llajas Ventura Las Llajas Can
CA00516 Leavitt, Lake Lassen Tr Susan River
CA00764 Little Lake Riverside Trib San Jacinto
CA10166 Little Panoche Detention Fresno Little Panoche Creek

CA10020 Lopez Los Angeles Pacoima Wash
CA10167 Los Banos Creek Detention Dam Merced Los Banos Creek
CA00331 Lower Bucks Lake (Bucks Diversion) Plumas Bucks Creek
CA00076 Lower San Fernando (Lower Van Norman) Los Angeles San Fernando Creek
CA00644 Lower Twin Lake Mono Robinson Creek
CA00387 Lyons Tuolumne South Fork Stanislaus River
CA00027 Madera Lake Madera Fresno River
CA00443 Mammoth Pool Fresno San Joaquin River
CA01211 Mary Street Riverside Alessandro Wash
CA00212 Mathews Riverside Trib Cajalco Creek
CA00416 McCloud Diversion Shasta McCloud River
CA01257 McKays Point Diversion Calaveras North Fork Stanislaus River
CA00305 Mockingbird Canyon Riverside Mockingbird Canyon
CA01013 Murry Santa Clara Mississippi Creek
CA01097 Mustang Creek Merced Mustang Creek
CA00863 New Bullards Bar Yuba North Yuba River
CA00240 New Exchequer (Lake McClure) Mariposa Merced River
CA10246 New Melones Calaveras Stanislaus River
CA00035 Oroville Butte Feather River
CA00864 Our House Sierra Middle Fork Yuba River
CA10111 Owens Dam Mariposa Owens Creek
CA00938 Peconom Lassen Antelope Val
CA00746 Peters Canyon Orange Peters Canyon
CA00801 Pigeon Pass Riverside Pigeon Pass
CA83151 Pit No. 7 Afterbay Shasta Pit River
CA00328 Poe Butte North Fork Feather River
CA00274 Ponderosa Butte South Fork Feather River
CA00909 Poway San Diego Warren Canyon
CA00799 Prenda Riverside Prenda Creek
CA00194 Puddingstone Los Angeles Walnut Creek
CA00771 Quail Valley Riverside Trib San Jancinto River
CA00765 Railroad Canyon Riverside San Jacinto River
CA01215 Ramona San Diego Green Val Road Creek
CA00825 Rancho Seco Sacramento Trib Hadselville Creek
CA00837 Redbank Fresno Redbank Creek
CA00223 Robert A Skinner Riverside Tucalota Creek
CA00485 Roberts Modoc Trib Pit River
CA00330 Rock Creek Plumas North Fork Feather River
CA00509 Round Valley Lassen Round Val Cr
CA00833 Ruth Lake (R. W. Matthews) Trinity Mad River
CA00620 Salt Springs Valley Calaveras Rock Creek
CA00906 San Dieguito San Diego Trib Escondido Creek
CA00841 San Lorenzo Creek (Don Castro) Alameda San Lorenzo Creek

CA00782 San Marcos San Diego San Marcos Creek
CA00113 San Vicente San Diego San Vicente Creek
CA00854 Sand Canyon Orange Sand Canyon
CA00298 Santiago Creek Orange Santiago Creek
CA00109 Savage San Diego Otay River
CA01045 Schubin El Dorado Trib Webber Creek
CA10324 Seven Oaks San Bernardino Santa Ana River
CA00437 Shaver Lake Fresno Stevenson Creek
CA00705 Sierra Vista Madera Chowchilla River
CA00823 Slab Creek El Dorado South Fork American River
CA00271 Slate Creek Plumas Slate Creek
CA01250 Smiths Reservoir Merced Trib Burns Creek
CA10192 Stampede Sierra Little Truckee River
CA10194 Stony Gorge Glenn Stony Creek
CA10113 Success Tulare Tule River
CA00114 Sutherland San Diego Santa Ysabel Creek
CA00775 Sweetwater Main San Diego Sweetwater River
CA00401 Tiger Creek Afterbay Amador North Fork Mokelumne River
CA01115 Top Cat Tehama Trib Brannin Creek
CA10196 Trinity Trinity Trinity River
CA00905 Turner San Diego Moosa Canyon
CA00112 Upper Otay San Diego Proctor Val Creek
CA00291 Vasona Percolating Santa Clara Los Gatos Creek
CA00750 Veeh Orange Trib San Diego Creek
CA00829 Villa Park Orange Santiago Creek
CA01314 Wallace Calaveras Trib Bear Creek
CA00482 White Modoc Trib Pit River
CA10027 Whittier Narrows Dam Los Angeles San Gabriel River
CA00772 Wohlford Lake San Diego Escondido Creek
CA82501 Wood Flat Modoc North Fork Pit River
CA00796 Woodcrest Riverside Woodcrest Creek

Appendix S4. Ranking of candidate dams based on hydrologic, ecological and jurisdictional
criteria
Table S4.1 Top 20-ranking dams sorted by storage capacity, seasonal flow alteration, and degree-of-regulation
Storage Capacity (Mm3)
Seasonal flow alteration
(Pearson's r)*
Degree-of-Regulation
(capacity/mean annual inflow)
Shasta 5615
Meadow Lake -0.03
Trampas Canyon 180
Don Pedro Main 2504
Santa Felicia -0.03
Copper Basin 97
Monticello 1976
Lake Almanor 0.04
Wood Ranch 95
Lake Almanor 1613
Lower Blue Lake 0.07
Woodward 77
Pine Flat 1233
Twitchell 0.08
Paicines 74
Folsom 1203
Iron Canyon 0.10
Westlake Reservoir 74
Lake Tahoe 903
Tinemaha 0.13
Modesto Res 65
Friant 642
Jackson Lake 0.15
Upper Oso 53
Clear Lake 556
Upper Blue Lake 0.18
Bouquet Canyon 51
Warm Springs 470
Lake Tahoe 0.22
Casitas 42
San Antonio 432
James Turner (San Antonio) 0.32
McBrien 40
Nacimiento 419
Iron Gate 0.36
Mission Viejo, Lake 33
Castaic 399
Pit No. 4 Diversion 0.37
Castaic 28
Casitas 313
Calaveras 0.37
Terminal 19
Whiskeytown 297
Thermalito Diversion 0.43
San Andreas 18
Twitchell 296
Lewiston 0.44
Whale Rock 18
Bradbury 253
Lower Crystal Springs 0.46
Lake Arrowhead 17
Long Valley 226
Pit No. 5 Diversion 0.48
Tule Lake (Moon Lake) 13
Pyramid 222
Keswick 0.50
Tejon Storage 2 12
Lake Kaweah 176
Monticello 0.51
Monticello 9
*Correlation between observed and expected (modeled) mean monthly flows, assessed only at dams with
downstream gages (n = 252)

Table S4.2 Top 20-ranking dams sorted by number of imperiled flow-sensitive species and native species richness
Imperiled flow-sensitive species richness
Native species richness
Camp Far West Diversion 6
Red Bluff Diversion 21
Red Bluff Diversion 6
Woodbridge Div 19
Camp Far West 6
Camp Far West Diversion 17
Whiskeytown 5
Camp Far West 17
Lake Anza (C L Tilden Park) 5
Lake Anza (C L Tilden Park) 16
Woodbridge Div 5
Whiskeytown 15
Clear Lake 5
Nash 15
Castaic 4
Keswick 15
Nash 4
Herman, Lake 15
Lewiston 4
Anderson Cottonwood 15
Edwards Reservoir 3
Shasta 15
Lauro 3
Nimbus 15
Keswick 3
Folsom 15
Malibu Lake Club 3
Woodward 14
Lucerne, Lake 3
Warm Springs 14
Pine Flat 3
Farmington Dam 14
Farmington Dam 3
Crocker Diversion (Snelling Diversion) 14
Magalia 3
Merlo 14
Paradise 3
Goodwin 14
Trampas Canyon 3
Tulloch 14

Table S4.3 Candidate dams subject to federal FERC or ESA regulations that require environmental flows
Dam Name Owner/Operator
Agnew Lake Southern California Edison Company
Balch Afterbay Pacific Gas and Electric Company
Bowman Nevada Irrigation District
Camp Far West South Sutter Water District
Cape Horn Dam (Van Arsdale Reservoir) Pacific Gas and Electric Company
Caples Lake (Twin Lake) Pacific Gas and Electric Company
Cedar Springs California Dept Of Water Resources
Clear Lake U S Bureau Of Reclamation
Don Pedro Main Turlock Irrigation District
Faucherie Lake Main Nevada Irrigation District
French Lake Nevada Irrigation District
Friant U S Bureau Of Reclamation
Iron Canyon Pacific Gas and Electric Company
Iron Gate Pacificorp
Jackson Lake Nevada Irrigation District
Jackson Meadows Nevada Irrigation District
Kerckhoff Pacific Gas and Electric Company
Lake Almanor Pacific Gas and Electric Company
Lake Tahoe U S Bureau Of Reclamation
Lower Blue Lake Pacific Gas and Electric Company
McSwain Merced Irrigation District
Meadow Lake Pacific Gas and Electric Company
Merced Falls Pacific Gas and Electric Company
Milton Nevada Irrigation District
Monticello U S Bureau Of Reclamation
Pit No. 4 Diversion Pacific Gas and Electric Company
Pit No. 5 Diversion Pacific Gas and Electric Company
Pit River Weir Pacific Gas and Electric Company
Pyramid California Department Of Water Resources
Santa Felicia United Water Conservation District
Scott Pacific Gas and Electric Company
Shasta U S Bureau Of Reclamation
Thermalito Diversion California Department Of Water Resources
Tulloch South San Joaquin Irrigation District
Twin Lakes Pacific Gas and Electric Company
Upper Blue Lake Pacific Gas and Electric Company
Virginia Ranch Browns Valley Irrigation District
Whiskeytown U S Bureau Of Reclamation
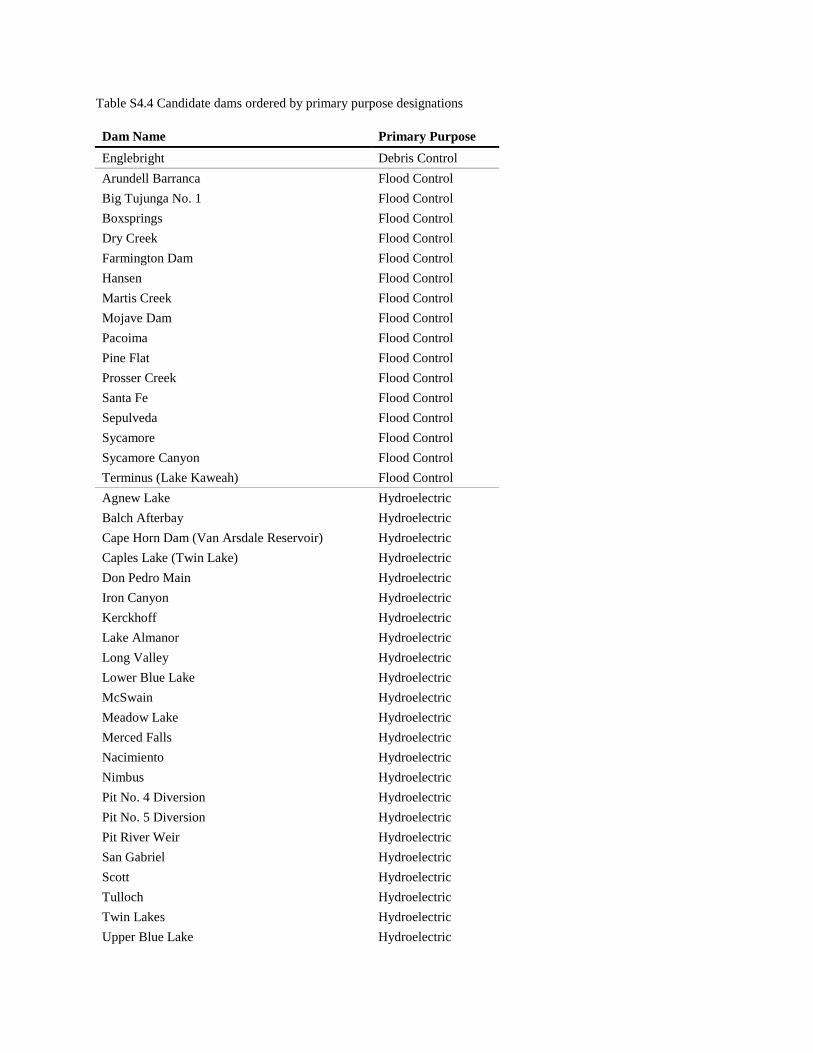
Table S4.4 Candidate dams ordered by primary purpose designations
Dam Name Primary Purpose
Englebright Debris Control
Arundell Barranca Flood Control
Big Tujunga No. 1 Flood Control
Boxsprings Flood Control
Dry Creek Flood Control
Farmington Dam Flood Control
Hansen Flood Control
Martis Creek Flood Control
Mojave Dam Flood Control
Pacoima Flood Control
Pine Flat Flood Control
Prosser Creek Flood Control
Santa Fe Flood Control
Sepulveda Flood Control
Sycamore Flood Control
Sycamore Canyon Flood Control
Terminus (Lake Kaweah) Flood Control
Agnew Lake Hydroelectric
Balch Afterbay Hydroelectric
Cape Horn Dam (Van Arsdale Reservoir) Hydroelectric
Caples Lake (Twin Lake) Hydroelectric
Don Pedro Main Hydroelectric
Iron Canyon Hydroelectric
Kerckhoff Hydroelectric
Lake Almanor Hydroelectric
Long Valley Hydroelectric
Lower Blue Lake Hydroelectric
McSwain Hydroelectric
Meadow Lake Hydroelectric
Merced Falls Hydroelectric
Nacimiento Hydroelectric
Nimbus Hydroelectric
Pit No. 4 Diversion Hydroelectric
Pit No. 5 Diversion Hydroelectric
Pit River Weir Hydroelectric
San Gabriel Hydroelectric
Scott Hydroelectric
Tulloch Hydroelectric
Twin Lakes Hydroelectric
Upper Blue Lake Hydroelectric

Whiskeytown Hydroelectric
Albaugh No 2 Irrigation
Alisal Creek Irrigation
Anderson Cottonwood Irrigation
Bean Hollow #2 (De Los Frijoles) Irrigation
Bean Hollow #3 (De Los Frijoles) Irrigation
Bear Valley Irrigation
Blodgett Irrigation
Bowman Irrigation
Bridgeport Irrigation
Camp Far West Irrigation
Camp Far West Diversion Irrigation
Casitas Irrigation
Castaic Irrigation
Crocker Diversion (Snelling Diversion) Irrigation
Dove Canyon Irrigation
Dry Canyon Irrigation
Edwards Reservoir Irrigation
Elmer J Chesbro Irrigation
Faucherie Lake Main Irrigation
Folsom Irrigation
French Lake Irrigation
Friant Irrigation
Glen Anne Irrigation
Goodwin Irrigation
Grass Valley Irrigation
Guadalupe Irrigation
Hawkins Irrigation
Haynes Res Irrigation
Heenan Lake Irrigation
Herman, Lake Irrigation
Hernandez Irrigation
Jackson Lake Irrigation
Juncal Irrigation
Keswick Irrigation
La Grange Irrigation
Lake Arrowhead Irrigation
Lake Gregory Irrigation
Lake Hemet Irrigation
Lake Sherwood Irrigation
Lake Tahoe Irrigation
Lewiston Irrigation
Lopez Irrigation

Lower Kinney Lake Irrigation
Lucerne, Lake Irrigation
Magalia Irrigation
Matilija Irrigation
McBrien Irrigation
Merlo Irrigation
Modesto Res Irrigation
Monticello Irrigation
Myers Irrigation
Nash Irrigation
North Fork (Pacheco Dam) Irrigation
Paicines Irrigation
Paradise Irrigation
Peoples Weir Irrigation
Pomponio Ranch Irrigation
Putah Diversion Irrigation
Rancho Cielito Irrigation
Rector Creek Irrigation
Red Bluff Diversion Irrigation
Renner Sibley Cr Irrigation
Rodden Lake Irrigation
Ross No 1 Irrigation
San Antonio Irrigation
San Dimas Irrigation
San Justo Irrigation
Searsville Irrigation
Shasta Irrigation
Sulphur Creek Irrigation
SX (Essex) Irrigation
Tejon Storage 2 Irrigation
Tule Lake (Moon Lake) Irrigation
Upper Oso Irrigation
Uvas Irrigation
Vail Irrigation
Van Vleck Irrigation
Virginia Ranch Irrigation
West Valley Irrigation
Westlake Reservoir Irrigation
Whale Rock Irrigation
William, Lake Irrigation
Woodward Irrigation
Weaver Recreation
Clear Lake Unknown

Deer Hill Unknown
Fallen Leaf Unknown
Green Tank Unknown
Iron Gate Unkown
Rubber Dam 1 Unknown
Rubber Dam 2 Unknown
Rubber Dam 3 Unknown
Twitchell Unknown
Warm Springs Unknown
Woodbridge Div Unknown
Alpine Water Supply
Anthony House Water Supply
Bon Tempe Water Supply
Bouquet Canyon Water Supply
Bradbury Water Supply
Calaveras Water Supply
Cedar Springs Water Supply
Chabot Water Supply
Clementia Water Supply
Copper Basin Water Supply
Gibraltar Water Supply
Grant Lake Water Supply
Jackson Meadows Water Supply
James H Turner (San Antonio Reservoir) Water Supply
Lake Anza (C L Tilden Park) Water Supply
Lake Frey Water Supply
Lake Oneill Water Supply
Lauro Water Supply
Lower Crystal Springs Water Supply
Malibu Lake Club Water Supply
Milton Water Supply
Mission Viejo, Lake Water Supply
Morris Water Supply
Municipal Water Supply
New U San Leandro Water Supply
Newell Water Supply
Notre Dame Water Supply
Novato Creek Water Supply
Peters Water Supply
Phoenix Lake Water Supply
Pilarcitos Water Supply
Potrero Water Supply
Pyramid Water Supply

Salinas Water Supply
San Andreas Water Supply
San Pablo Water Supply
Santa Felicia Water Supply
Scout Lake Water Supply
Seeger Water Supply
Soulajule Water Supply
Terminal Water Supply
Thermalito Diversion Water Supply
Tinemaha Water Supply
Trampas Canyon Water Supply
Wood Ranch Water Supply


![Visitor Guide 2011 - Moyle District Council moyle...\]dhih hi^aa ]Vjci i]Z aV`Z# Loughareema 6 adcZan VcY bnhiZg^djh BddgaVcY AV`Z! hdbZi^bZh XVaaZY i]Z ÆKVc^h]^c\ AV`ZÇ# DcZ YVn](https://static.fdocuments.us/doc/165x107/60a97a2536658b1ce43e5915/visitor-guide-2011-moyle-district-moyle-dhih-hiaa-vjci-iz-avz-loughareema.jpg)