Systematic Review: Meta-analysis II The nuts and bolts of the statistics Alka M. Kanaya, M.D....
38
Systematic Review: Meta-analysis II The nuts and bolts of the statistics Alka M. Kanaya, M.D. Assistant Professor of Medicine, Epi/Biostats April 19, 2007
-
Upload
gertrude-gordon -
Category
Documents
-
view
213 -
download
0
Transcript of Systematic Review: Meta-analysis II The nuts and bolts of the statistics Alka M. Kanaya, M.D....

Systematic Review:Meta-analysis II
The nuts and bolts of the statistics
Alka M. Kanaya, M.D.Assistant Professor of Medicine, Epi/Biostats
April 19, 2007

Goals1. Understand statistical issues for MA
summary estimate and variance• models • methods
heterogeneity publication bias
2. Carry on an intelligent conversation with your statistician
3. Know if published MA used appropriate methods
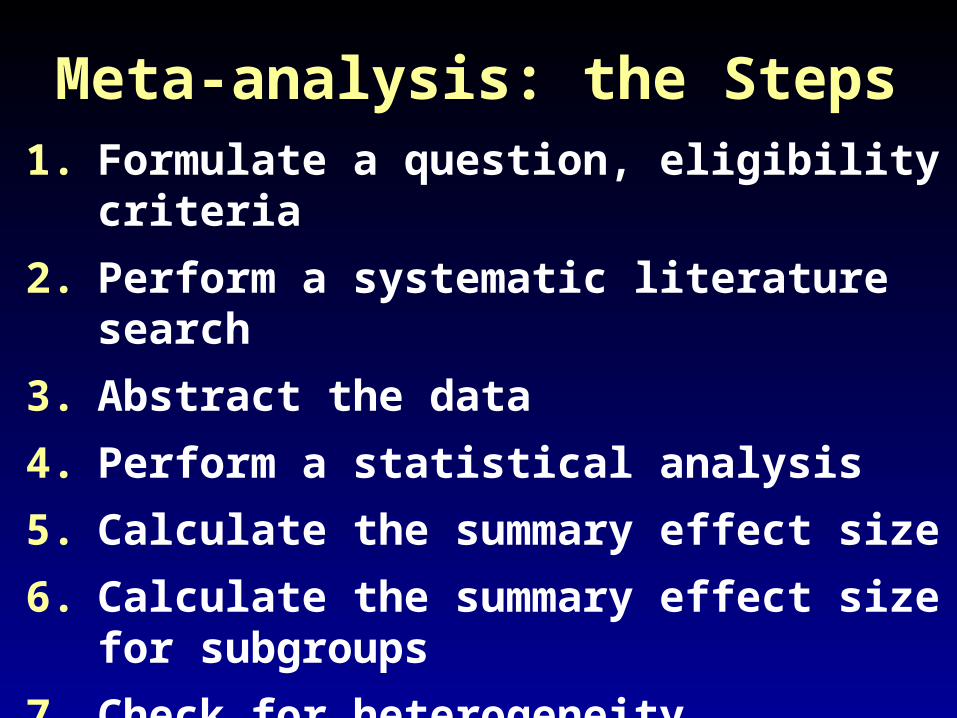
Meta-analysis: the Steps1. Formulate a question, eligibility criteria
2. Perform a systematic literature search
3. Abstract the data
4. Perform a statistical analysis
5. Calculate the summary effect size
6. Calculate the summary effect size for subgroups
7. Check for heterogeneity
8. Check for publication bias

Clinical Case 5 y.o. girl c/o ear pain and is found to
have an acute otitis media. Should she get antibiotics?
Research Questions:
1. Are antibiotics effective for pain relief in children with acute OM?
2. Do antibiotics reduce complications of OM (mastoiditis, hearing problems)?

Systematic Review part
Inclusion criteria:– RCT of antibiotic vs. placebo– Children – Without tympanostomy tubes– With OM (regardless of setting of
recruitment)– Patient-relevant outcomes
8 trials with total of 2,287 kids
Glasziou, Cochrane Review, 2005
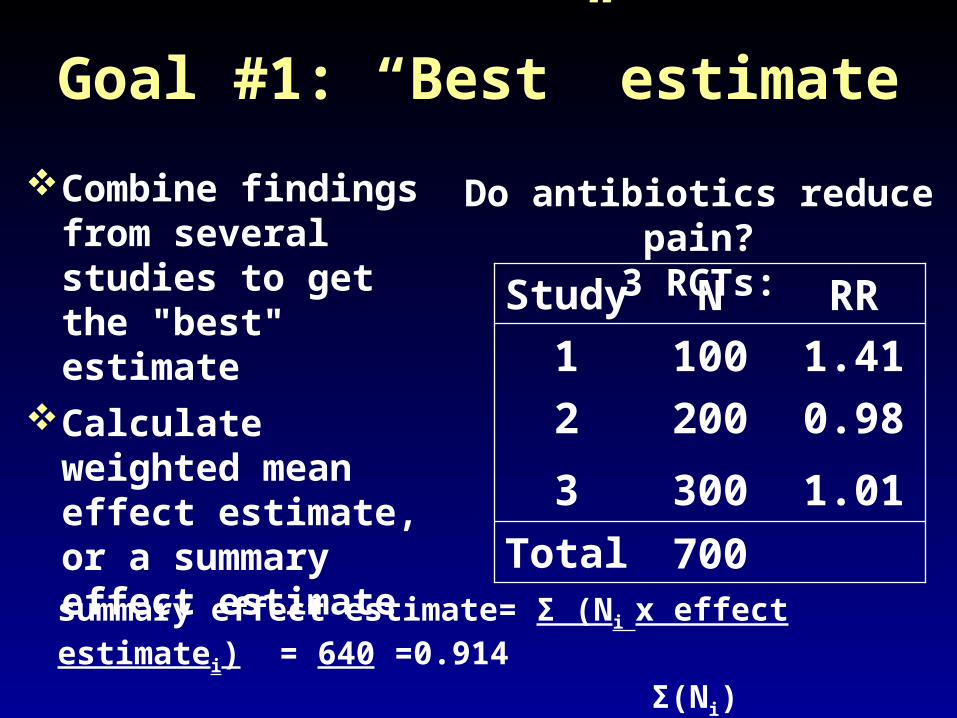
Goal #1: “Best” estimate
Combine findings from several studies to get the "best" estimate
Calculate weighted mean effect estimate, or a summary effect estimate 700Total
1.013003
0.982002
1.411001
RRNStudy
Do antibiotics reduce pain?3 RCTs:
summary effect estimate= Σ (Ni x effect estimatei) = 640 =0.914 Σ(Ni) 700

Goal #1: Calculate weighted mean effect estimate
Summary = Σ (weighti x effect estimatei) = 30.3 = 0.99effect estimate Σ(weighti) 30.5
Study N RR Var RR Weight
1 100 1.41 3.0 0.33
2 200 0.98 0.1 10
3 300 1.01 0.05 20
Total 700
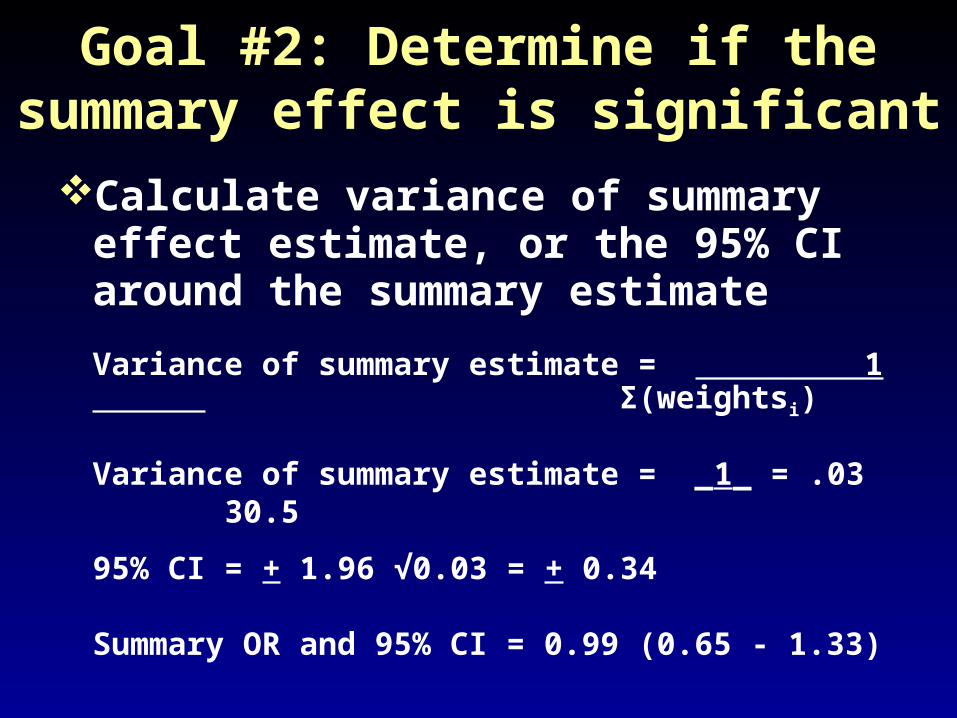
Goal #2: Determine if the summary effect is significantCalculate variance of summary effect
estimate, or the 95% CI around the summary estimate
Variance of summary estimate = 1 Σ(weightsi)
Variance of summary estimate = _1_ = .03 30.5
95% CI = + 1.96 √0.03 = + 0.34
Summary OR and 95% CI = 0.99 (0.65 - 1.33)

Type of Model?
Variance RRs = 1/wiVariance RRs = 1/wi
Weighti = 1 + D
variance RRi
Weighti = 1
variance RRi
Variance of individual studies + variance of differences between studies
Weights: variance of individual studies
Existing studies are a random sample
Existing studies are the entire population
Goal: estimate the “true” effect
Goal: weighted average of risk from existing studies
Random EffectsFixed Effects

Fixed Effects
Model:
Random Effects
Model:
Summary RRb
Summary RRa
Summary RRb
Summary RRa

Random VS. Fixed Effects Models
Practical Implications of the Choice Summary estimates: usually similar Variance: RE model produces large variance of the
summary estimate Confidence intervals: RE model produces wider
confidence intervals Statistical significance: less likely with RE model
BOTTOM LINE: If the individual study findings are similar, the model
makes little difference in estimate or statistical significance.
If the individual study findings are heterogeneous, the model can affect the statistical significance.

Which method?Model Method Effect
estimateData
Fixed Effects:
Mantel-Haenszel
Ratio (OR, RR) Crude (2x2)
General Variance-based
Ratio (OR, RR)Difference (risk, rate)
Adjusted ratio & CICrude (2x2)
RandomEffects:
DerSimonian& Laird
Ratio, difference
Crude (2x2)
General Variance-based
Ratio (OR, RR)Difference (risk, rate)
Adjusted ratio & CICrude (2x2)
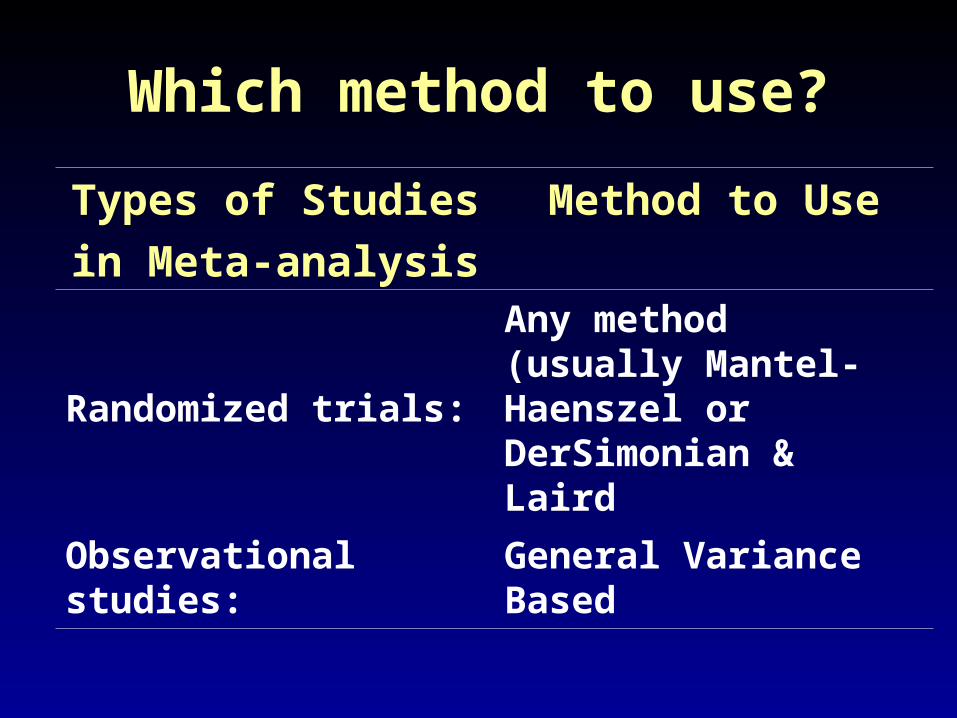
Which method to use?
Types of Studies
in Meta-analysis
Method to Use
Randomized trials:Any method (usually Mantel-Haenszel or DerSimonian & Laird
Observational studies:General Variance Based

Mantel-Haenszel Method (Fixed Effects Model)
Diseased Not diseasedTreated (exposed) ai ci
Not treated (unexposed) bi di
ORi = ai/ ci = ai x di lnORmh = Σ (wi x lnORi )
bi/ di bix ci Σwi
variance lnORi = 1 + 1 + 1+ 1 variance ORmh = 1 ai bi ci di Σ wi
weighti = (wi) = 1 variance lnORi
95% CI = elnORmh (1.96 x √variance lnORmh)

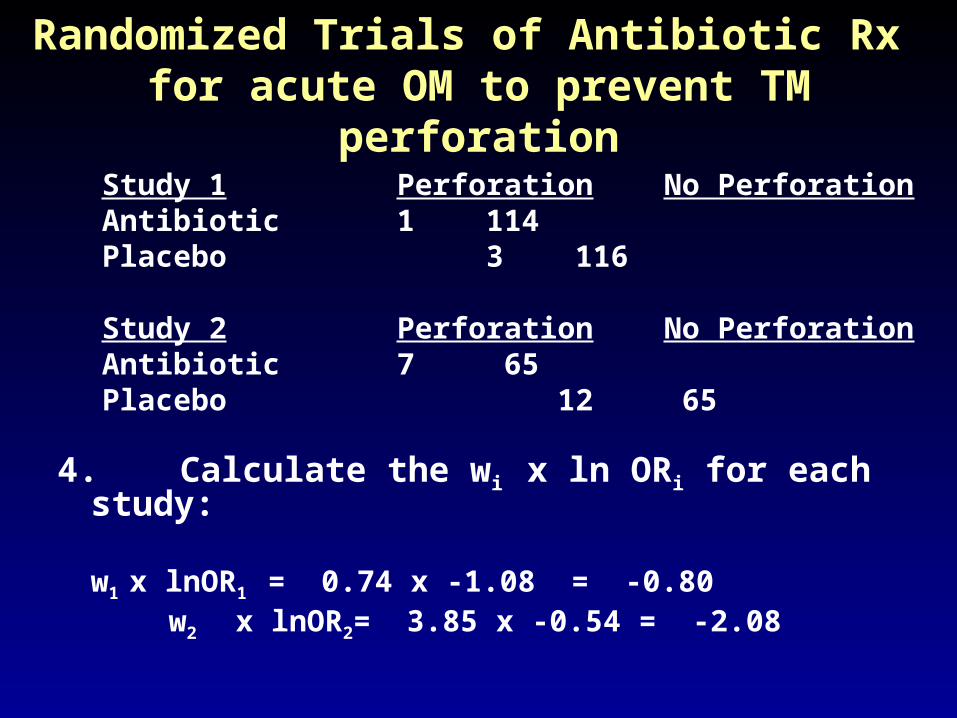
Randomized Trials of Antibiotic Rx for acute OM to prevent TM
perforationStudy 1 Perforation No PerforationAntibiotic 1 114Placebo 3 116
Study 2 Perforation No PerforationAntibiotic 7 65Placebo 12 65
1. Calculate ORi for each study:OR1= 1 x 116 = 0.34 lnOR1 = -1.08
3 x 114
OR2 = _______ = 0.58 lnOR2 = -0.54

Randomized Trials of Antibiotic Rx for acute OM to prevent TM
perforation
2. Calculate variance lnORi for each study:
Var ln OR1 = 1 + 1 + 1 + 1 = 1.35
1 3 114 116
Var ln OR2 = ______________ = 0.26
3. Calculate wi for each study:
w1 = 1 = 0.74
1.35
w2 = ________ = 3.85
Study 1 Perforation No PerforationAntibiotic 1 114Placebo 3 116
Study 2 Perforation No PerforationAntibiotic 7 65Placebo 12 65
4.Calculate the wi x ln ORi for each study: w1 x lnOR1 = 0.74 x -1.08 = -0.80
w2 x lnOR2= 3.85 x -0.54 = -2.08
Randomized Trials of Antibiotic Rx for acute OM to prevent TM
perforation

5. Calculate the sum of the wi
w1 + w2 = 0.74 + 3.85 = 4.59
6. Calculate lnORmh = Σ (wi x lnORi) = -0.80 + -2.08 = -0.63
Σ wi 4.59= ORmh = 0.53
7. Calculate variance ORmh = 1 = 1 = 0.22
Σ wi 4.59
8. Calculate 95% CI = elnORmh + (1.96 x √ variance lnORmh)
= e-.63 + (1.96 x √ 0.22) = 0.21 - 1.34
Summary OR = 0.53 (95% CI 0.21 – 1.34)
Randomized Trials of Antibiotic Rx for acute OM to prevent TM
perforation
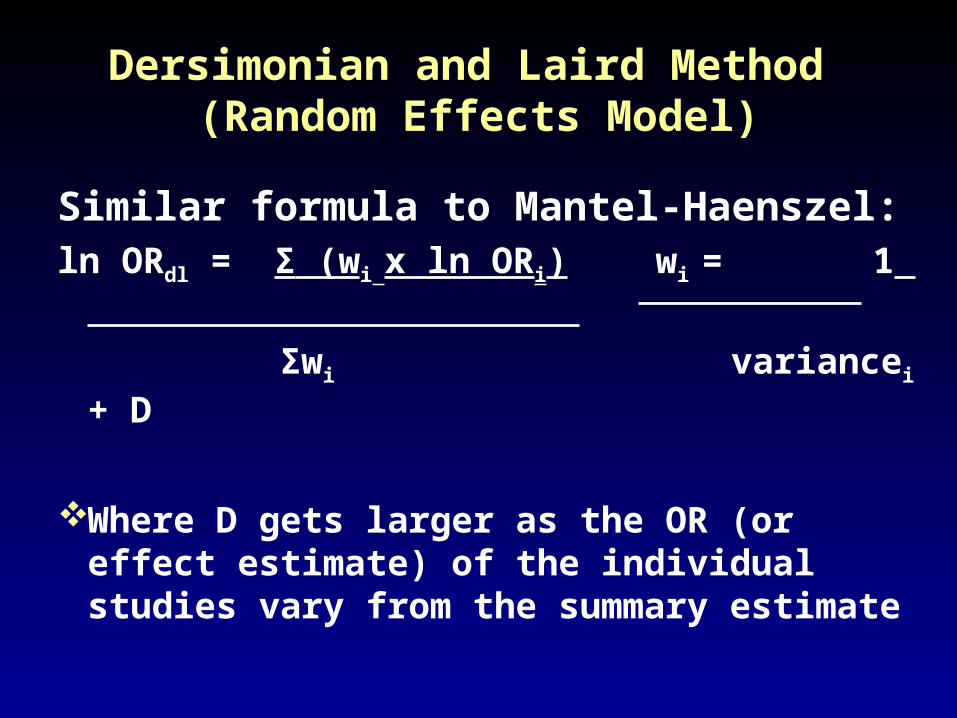
Dersimonian and Laird Method (Random Effects Model)
Similar formula to Mantel-Haenszel:ln ORdl = Σ (wi x ln ORi) wi = 1
Σwi variancei + D
Where D gets larger as the OR (or effect estimate) of the individual studies vary from the summary estimate
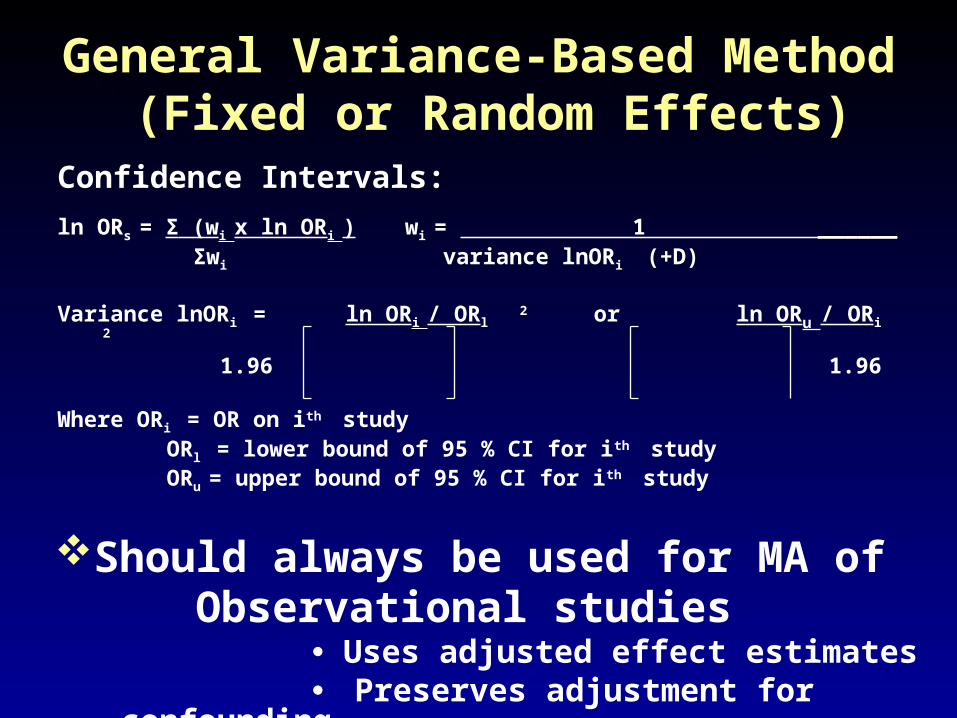
General Variance-Based Method (Fixed or Random Effects)
Confidence Intervals:
ln ORs = Σ (wi x ln ORi ) wi = 1 ______ Σwi variance lnORi (+D)
Variance lnORi = ln ORi / ORl 2 or ln ORu / ORi
2
1.96 1.96
Where ORi = OR on ith study ORl = lower bound of 95 % CI for ith study ORu = upper bound of 95 % CI for ith study
Should always be used for MA of Observational studies
Uses adjusted effect estimates Preserves adjustment for confounding

Choice of Model and Method in Meta-Analysis
What type of studies are you summarizing?
Randomized Trials Observational Studies
Either ModelAny Method
Either ModelConfidence Interval Method
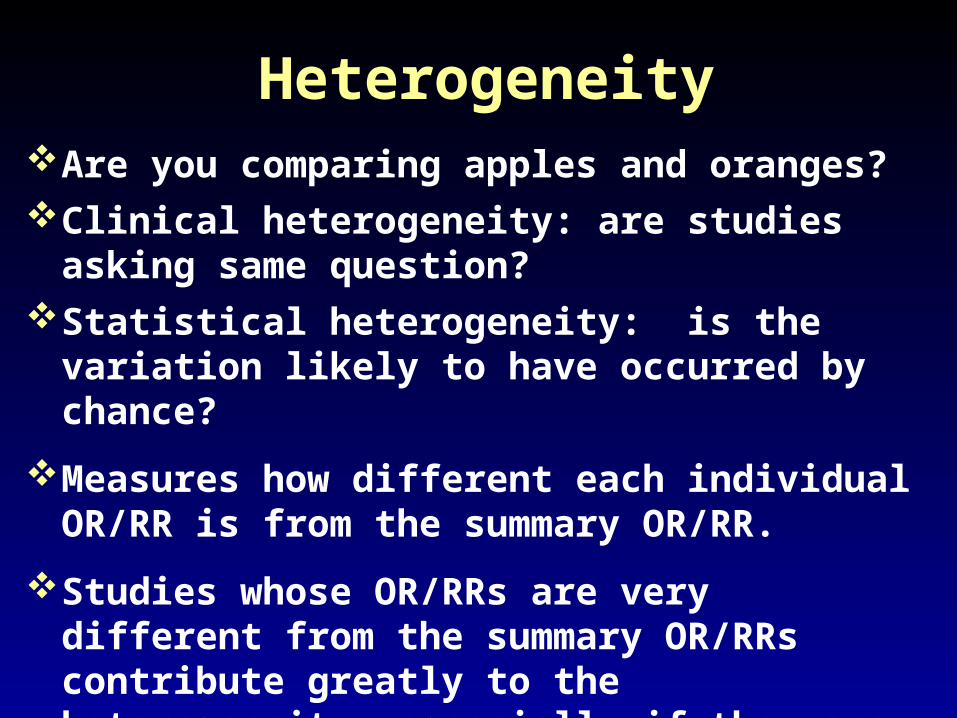
HeterogeneityAre you comparing apples and oranges?Clinical heterogeneity: are studies asking same
question?Statistical heterogeneity: is the variation likely
to have occurred by chance?
Measures how different each individual OR/RR is from the summary OR/RR.
Studies whose OR/RRs are very different from the summary OR/RRs contribute greatly to the heterogeneity, especially if they are weighted heavily.

Problem of Heterogeneity
Study findings are different and should not be combined
Study OR1 0.012 1.03 10.0
Study OR1 0.352 0.563 0.974 1.155 1.756 1.95

Statistical tests of Homogeneity
Is the variation in the individual study findings likely due to chance?
Ho: Effect estimate in each study is the same (or homogeneous)
Ha: Effect estimate in each study is not the same (or heterogeneous)
Q = Σ(wi x (ln ORmh – ln ORi )2) df = (N studies -1)
p < 0.05 or 0.10 = reject null, i.e., studies are heterogeneous
8 trials of antibiotics vs. Po for OM, pain outcome:
Q for homogeneity: p=0.91

Subgroup & Sensitivity Analysis
Subgroup Analysis – MA of a subgroup of eligible studies
age
ethnicity
risk factors
treatment
Sensitivity Analysis – add or delete questionable studies
eligibility
treatment
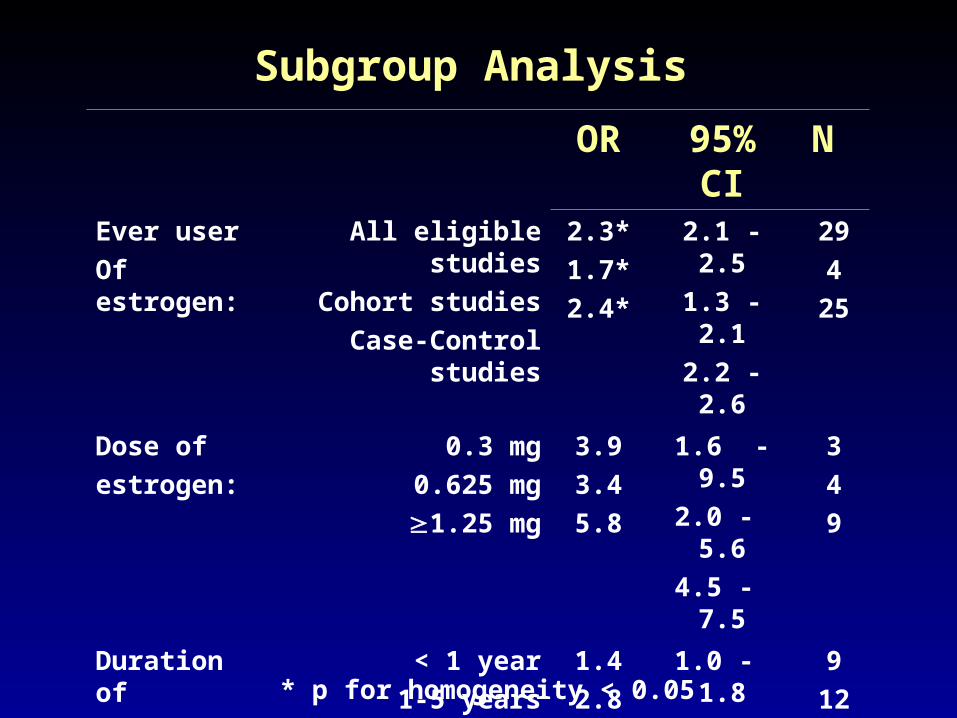
Subgroup Analysis
OR 95% CI N Ever user
Of estrogen:
All eligible studies
Cohort studies
Case-Control studies
2.3*
1.7*
2.4*
2.1 - 2.5
1.3 - 2.1
2.2 - 2.6
29
4
25
Dose of
estrogen:
0.3 mg
0.625 mg
1.25 mg
3.9
3.4
5.8
1.6 - 9.5
2.0 - 5.6
4.5 - 7.5
3
4
9
Duration of
use:
< 1 year
1-5 years
5-10 years
10 years
1.4
2.8
5.9
9.5*
1.0 - 1.8
2.3 - 3.5
4.7 - 7.5
7.4 - 12.3
9
12
10
10
Regimen: Cyclic
Daily
3.0*
2.9*
2.4 - 3.8
2.2 - 3.8
8
8
* p for homogeneity < 0.05

Subgroup AnalysisAntibiotics vs. Placebo for acute OMOutcome: abnormal tympanometry
Study 0 – 1 mo f/u
RR (95% CI)
2 – 3 mo f/u
RR (95% CI)
Appelman, 1991 0.57 (0.25 – 1.26) NA
Burke, 1991 1.07 (0.62 – 1.84) 0.58 (0.31 – 1.08)
Mygind, 1981 0.98 (0.49 – 1.94) 1.09 (0.52 – 2.31)
Summary estimate: 0.91 (0.62 – 1.32) 0.75 (0.47 – 1.21)
p-for-heterogeneity: 0.42 0.20
Sensitivity Analyses
• Performed to test the robustness of the findings
• To fairly assess and acknowledge the limitations
• Address publication bias (funnel plots, number needed to change result, etc..)

Sensitivity AnalysisAspirin + Heparin vs. Aspirin alone for Unstable Angina
MI or Death
Study (reference) Aspirin Aspirin + heparin RR (95% CI)
Theroux et al, 198810 4/121 (3%) 2/122 (2%) 0.50 (0.18-2.66)
RISC Group, 19907 7/189 (4%) 3/210 (1%) 0.39 (0.18-1.47)
Cohen et al, 199011 1/32 (3%) 0/37 (0%) 0.29 (0.06-6.87)
Cohen et al, 199412 9/109 (8%) 4/105 (4%) 0.46 (0.24-1.45)
Holdright et al, 199413 40/131 (31%)
42/154 (27%) 0.89 (0.66-1.29)
Gurfinkel et al, 199514 7/73 (10%) 4/70 (6%) 0.60 (0.29-1.95)
Total/Summary: 68/655 (10%)
55/698 (8%) 0.67 (0.44-1/02) Remove Holdright: RRs = 0.45 (95% CI 0.23 -0.89) ; p-for-hetero=0.71
Add data from two additional trials of LMWH:
RRs = 0.56 (95% CI 0.40-0.80); p for heterogeneity: 0.52
Fixed effects model, Mantel-Haenszel method = same findings

Publication Bias
Published studies may not be representative of all studies ever conducted.
Selective publication of studies based on strength & direction of results & language.
AKA “positive outcome bias”

Minimizing Publication Bias
• Search bibliographies of published papers
• Consult with experts
• Search for unpublished data
• Clinical Trial Registries (NIH, VA)
• Institutional Review Boards
• Pharmaceutical companies
• Hand searches
• Consider studies not published in EnglishStern, BMJ, 2001

Statistical Approaches to Publication Bias
Correlation between study sample size (or weight or variance) and effect estimate
Funnel plotOther fancy statistical methods:
• estimate number of unpublished studies that must exist to invalidate the results of the meta-analysis.
“File drawer”
“Fail-safe N”• eliminate the studies that may have been
published due to bias

Association of Estrogen use and Endometrial Cancer
Correlation of sample size and RR: rho = 0.68; p = 0.08
FUNNEL GRAPH
Relative Risk of Endometrial Cancer
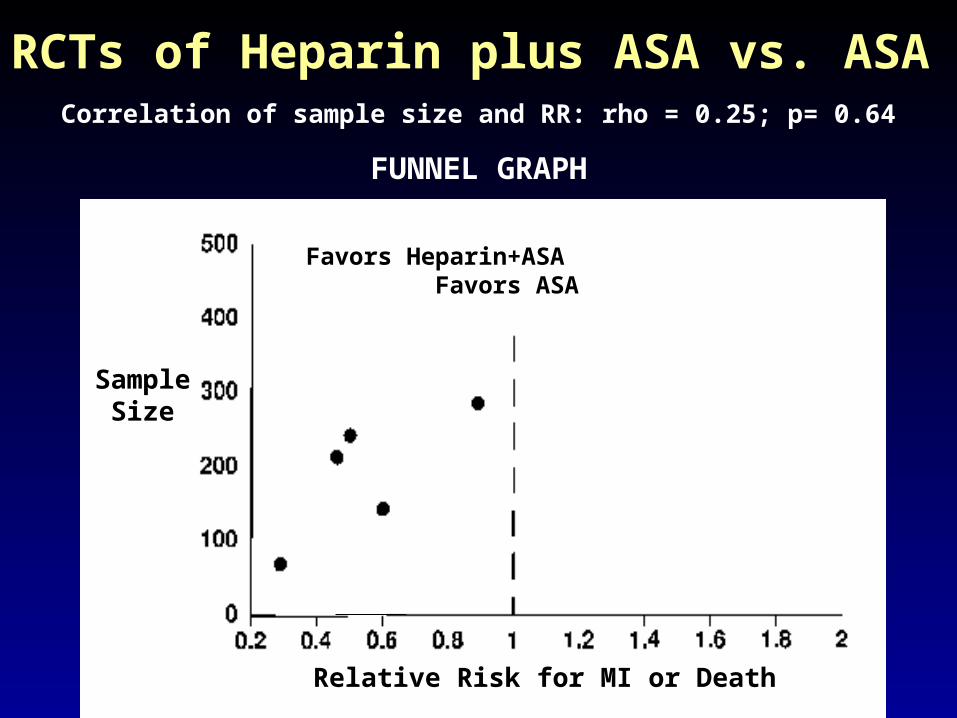
RCTs of Heparin plus ASA vs. ASA Correlation of sample size and RR: rho = 0.25; p= 0.64
FUNNEL GRAPH
Relative Risk for MI or Death
Favors Heparin+ASA Favors ASA
SampleSize

Presentation of the ResultsTables: Study Characteristics
population sample size definition of intervention definition of the outcome important design features (validity of the data)
- randomization- blinding- follow-up- compliance
Study Findings main and secondary outcomes outcomes by subgroup sensitivity analysis findings
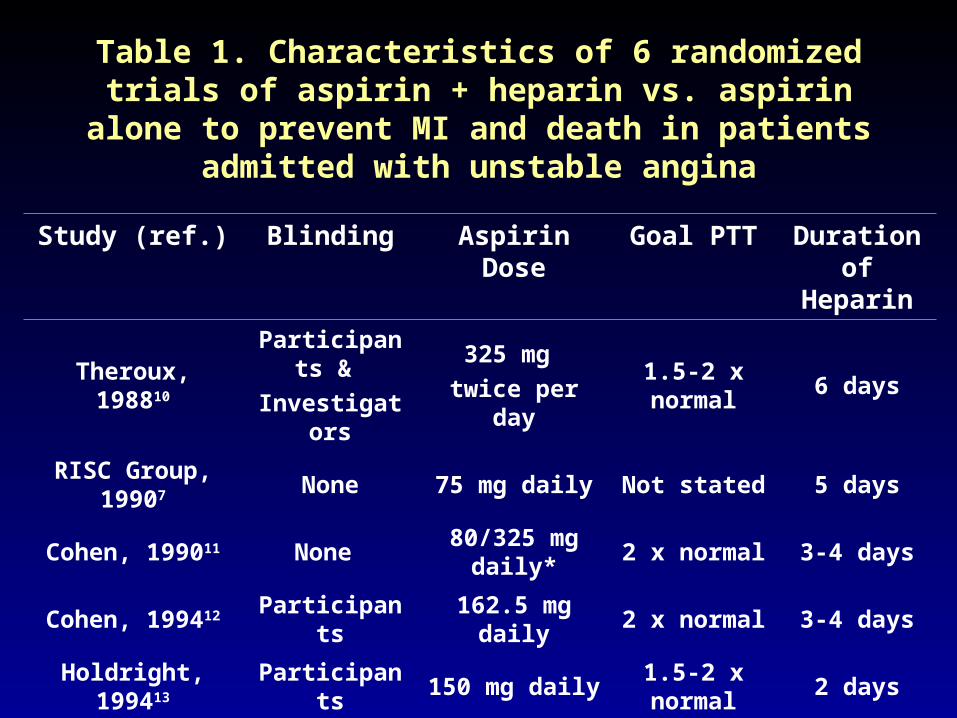
Table 1. Characteristics of 6 randomized trials of aspirin + heparin vs. aspirin alone to prevent MI and
death in patients admitted with unstable angina
Study (ref.) Blinding Aspirin Dose Goal PTT Duration of Heparin
Theroux, 198810Participants &
Investigators
325 mg
twice per day1.5-2 x normal 6 days
RISC Group, 19907 None 75 mg daily Not stated 5 days
Cohen, 199011 None 80/325 mg
daily*2 x normal 3-4 days
Cohen, 199412 Participants 162.5 mg daily 2 x normal 3-4 days
Holdright, 199413 Participants 150 mg daily 1.5-2 x normal 2 days
Gurfinkel, 199514Participants &
Investigators200 mg daily 2 x normal 5-7 days

Bent, AMJ, 1999
No Caption FoundAntibiotics vs. Placebo in Acute Bronchitis
Take Home Messages
You can do a meta-analysisGood start on becoming an expert in
your fieldYour work should be reproducibleYour conclusions should be obviousInclude a statistician on you team