Systematic InSAR monitoring of African active volcanic zones - Doris
6
Systematic InSAR Monitoring of African Active Volcanic Zones: What we have learned in three years, or an harvest beyond our expectations. N. d’Oreye Dept. of Geophysics/Astrophysics National Museum of Natural History 19 rue J. Welter, 7256 Walferdange, Luxembourg [email protected] F. Kervyn, C. Wauthier Dept. of Remote Sensing and Cartog. Royal Museum for Central Africa, Belgium E. Calais Dept. of Earth & Atmospheric Sciences Purdue University, USA V. Cayol Lab. Magma & Volc. - CNRS-UMR 6524 Univ. Blaise Pascal Clermont-Ferrand, France J. Fernández, P. Gonzalez Instituto de Astronomia y Geodesia (CSIC-UCM) Facultad de Ciencias Matematicas Univ. Madrid Spain C. Frischknecht Earth Sciences Section Univ. Geneva, Switzerland S. Heleno ICIST - Inst. Sup. Técnico Lisbon, Portugal A. Oyen, P. Marinkovic Delft Inst. of Earth Obs. and Space Systems Delft Univ. of Tech. Netherlands Abstract— We present here a brief overview of some findings and preliminary results obtained after almost three years of systematic monitoring of active volcanic areas in Africa by means of Differential Synthetic Aperture Radar Interferometry (InSAR). With a database rich of more than 400 SAR scenes of Fogo (Cape Verde), Ol Doinyo Lengai (Tanzania), Nyiragongo- Nyamulagira (DR of Congo) and Mount Cameroon volcanoes, we processed more than 2000 interferograms among which we could detect significant and major geophysical processes: the first dyking event ever captured geodetically in a continental rift (Lake Natron; Northern Tanzania), the co-eruptive deformations of the Lengai, Nyiragongo and Nyamulagira volcanoes, the co-seismic displacements associated to the mb 6.1 February 3 rd 2008 Bukavu earthquake as well as the identification of atmospheric induced phase delays over Fogo and Mount Cameroon volcanoes to be attributed to the seasonal oscillations of the Inter-tropical Convergence Zone (ITCZ). These results have been reached given the abundance of data that increases the chances to capture unpredictable events, and capture them with the most favorable interferometric conditions as possible (e.g. in terms of geometrical and temporal baselines that minimized the vegetation-induced decorrelation). They provided strong scientific material as well as tools for hazard assessment. Keywords: DInSAR; volcano monitoring; East African Rift; continental rifting; co-seismic deformation; Inter-tropical Convergence Zone; Pico de Fogo; Ol Doinyo Lengai; Lake Natron; Mount Cameroon; Nyiragongo; Nyamulagira. I. INTRODUCTION Many African places threatened by geophysical hazards, not to say most of them, suffer from lack of (efficient) monitoring systems either because of political, practical or economical reasons. In addition, the East African Rift (EAR) is regularly affected by earthquakes, dyke intrusions or volcanic eruptions for which scientists miss the essential measurements, preventing them to gain information of primary importance about the driving mechanisms, interactions between tectonics and magmatism… not to mention the hazard assessment. Due to the size of the EAR structure, (5000 km long), it is indeed impossible to deploy ground base networks (e.g. GPS, tiltmeters, seismometers) nor process systematic GPS campaigns, nor install observatories at occidental standards throughout the whole area. Satellite Radar Interferometry is known to be a possible tool to overcome these problems providing that favorable conditions are met. It allows indeed monitoring at low cost remote areas and provides a large amount of measurements points over broad regions. Although the SAR operate in all weather conditions and night and days, the InSAR suffers from the difficulty to operate in Authors acknowledge support from the Belgian Science Policy under projects SAMAAV and GORISK (SR/00/113), and the National Research Fund of Luxembourg under the project FNR/STEREOII/06/01. 1-4244-2547-1/08/$20.00 ©2008 IEEE
Transcript of Systematic InSAR monitoring of African active volcanic zones - Doris

Systematic InSAR Monitoring of African Active Volcanic Zones:
What we have learned in three years, or an harvest beyond our expectations.
N. d’Oreye Dept. of Geophysics/Astrophysics
National Museum of Natural History 19 rue J. Welter, 7256 Walferdange, Luxembourg
F. Kervyn, C. Wauthier Dept. of Remote Sensing and Cartog.
Royal Museum for Central Africa, Belgium
E. Calais Dept. of Earth & Atmospheric Sciences
Purdue University, USA
V. Cayol Lab. Magma & Volc. - CNRS-UMR 6524
Univ. Blaise Pascal Clermont-Ferrand, France
J. Fernández, P. Gonzalez Instituto de Astronomia y Geodesia (CSIC-UCM)
Facultad de Ciencias Matematicas Univ. Madrid
Spain
C. Frischknecht Earth Sciences Section
Univ. Geneva, Switzerland
S. Heleno ICIST - Inst. Sup. Técnico
Lisbon, Portugal
A. Oyen, P. Marinkovic Delft Inst. of Earth Obs. and Space Systems
Delft Univ. of Tech. Netherlands
Abstract— We present here a brief overview of some findings and preliminary results obtained after almost three years of systematic monitoring of active volcanic areas in Africa by means of Differential Synthetic Aperture Radar Interferometry (InSAR). With a database rich of more than 400 SAR scenes of Fogo (Cape Verde), Ol Doinyo Lengai (Tanzania), Nyiragongo-Nyamulagira (DR of Congo) and Mount Cameroon volcanoes, we processed more than 2000 interferograms among which we could detect significant and major geophysical processes: the first dyking event ever captured geodetically in a continental rift (Lake Natron; Northern Tanzania), the co-eruptive deformations of the Lengai, Nyiragongo and Nyamulagira volcanoes, the co-seismic displacements associated to the mb 6.1 February 3rd 2008 Bukavu earthquake as well as the identification of atmospheric induced phase delays over Fogo and Mount Cameroon volcanoes to be attributed to the seasonal oscillations of the Inter-tropical Convergence Zone (ITCZ). These results have been reached given the abundance of data that increases the chances to capture unpredictable events, and capture them with the most favorable interferometric conditions as possible (e.g. in terms of geometrical and temporal baselines that minimized the vegetation-induced decorrelation). They provided strong scientific material as well as tools for hazard assessment.
Keywords: DInSAR; volcano monitoring; East African Rift; continental rifting; co-seismic deformation; Inter-tropical Convergence Zone; Pico de Fogo; Ol Doinyo Lengai; Lake Natron; Mount Cameroon; Nyiragongo; Nyamulagira.
I. INTRODUCTION Many African places threatened by geophysical hazards,
not to say most of them, suffer from lack of (efficient) monitoring systems either because of political, practical or economical reasons.
In addition, the East African Rift (EAR) is regularly affected by earthquakes, dyke intrusions or volcanic eruptions for which scientists miss the essential measurements, preventing them to gain information of primary importance about the driving mechanisms, interactions between tectonics and magmatism… not to mention the hazard assessment.
Due to the size of the EAR structure, (5000 km long), it is indeed impossible to deploy ground base networks (e.g. GPS, tiltmeters, seismometers) nor process systematic GPS campaigns, nor install observatories at occidental standards throughout the whole area.
Satellite Radar Interferometry is known to be a possible tool to overcome these problems providing that favorable conditions are met. It allows indeed monitoring at low cost remote areas and provides a large amount of measurements points over broad regions. Although the SAR operate in all weather conditions and night and days, the InSAR suffers from the difficulty to operate in
Authors acknowledge support from the Belgian Science Policy underprojects SAMAAV and GORISK (SR/00/113), and the National ResearchFund of Luxembourg under the project FNR/STEREOII/06/01.
1-4244-2547-1/08/$20.00 ©2008 IEEE

vegetated area, which is very often the case in equatorial regions and especially on high lands and fertile volcanoes.
We show here however how with a high temporal sampling we could capture the full story of a dyking event, the deformation field of an eruption in a savanna environment and capture unexpected co-seismic deformation of earthquake where no local seismic network was available.
The scope of the present abstract is however not to give detailed descriptions of these works while they are either published in other journals or still in progress.
II. PROCEDURE The systematic ENVISAT ASAR acquisition over the four
above-mentioned test sites (Fig. 1) started in 2005/2006 in the frame of various scientific projects (SAMAAV, GORISK) [1, 2]. The available ERS and ENVISAT archives over these areas, when existed, were also included in the database. At the time of writing, this represents about 400 SAR scenes to be shared unequally between many tracks, swaths (i.e. incidence look angle) and modes (i.e. ascending and descending) (Table 1). A full automated bulk processing procedure was setup based on the use of open source softwares (DORIS [3], SNAPHU [4], GMT [5]) and leading to the production of geo-referenced wrapped phase interferograms, coherence map and unwrapped phase interferograms in common GIS formats (ENVI®) and GMT.
Tanzania) [6, 7]. Seismic activity continued up to early September, culminating in a Mw5.9 pure normal faulting event on July 17, 2007. The crisis did not lead to an eruption at the Gelai volcano though the nearby Ol Doinyo Lengai started erupting in mid-June with effusive activity limited to the crater. It evolved to unusual explosive activity from September 4, in a sequence that bears similarities with the 1966 episode.
TABLE I. THE SAR DATABASE
Target satellite / mode
Track ~Look angle
Period Nr of scenes
Fogo ERS ascending
460
21°
1997-2002
24
ENV ascending 460 21° 2004-Today 35 188 15° 2005-2008 24 *
ERS descending 252 23° 1997-2002 7 ENV descending 252 23° 2005-2008 24 *
Nyiragongo ERS ascending
228
25°
1997-2003
27
ENV ascending 228 24° 2002-2006 36 ** 314 44° 2006-Today 24 42 39° 2008-Today 4 271 34° 2008-Today 1 ** ERS descending 35 23° 1997-2003 5
ENV descending 35 24° 2003-Today 35 221 40° 2008-Today 5 450 44° 2003-Today 21 493 34° 2008-Today 4
ALOS Asc. FH 580 34° 2007 2 ALOS Asc. FD 580 34° 2008 2
ALOS Desc. FH 249 34° 2007 2 Lengai ERS ascending
285
23°
1997
2
Figure 1. Location of the four African Active Volcanic Zones studied here by Systematic InSAR monitoring (red boxes). From left to right: Fogo (Cape
Verde), Mount Cameroon (Cameroon), Nyiragongo-Nyamulagira (DR Congo) and Ol Doinyo Lengai (Tanzania).
Among the ~2.000 different interferograms generated so far, the most interesting ones were re-processed with manual refined procedures (if required) to lead to optimum deformation maps.
The ALOS L-band interferograms are however performed separately since they required specific processing.
III. RESULTS
A. The 2007 Lake Natron rifting event A seismo-magmatic crisis started on July 12th 2007 to the
SW of the Ol Doinyo Gelai volcano, between Lakes Natron and Manyara along the Eastern branch of the EAR (Northern
ENV ascending 328 34° 2005-2006 10 ** 13 18° 2006 10 ** 371 44° 2008 1
ENV descending 92 23° 2003-Today 25 6 41° 2006-Today 17 321 23° 2006-Today 16
ALOS Asc. FD 236 34° 2007 4 ALOS Desc. FH 568 34° 2007 2
Cameroon ENV ascending
287
23°
2004-Today
24
ERS descending 179 22° 1995-1999 9 ENV descending 179 22° 2004-Today 22
* Latest data not ordered yet.
** Further acquisitions cancelled because of ARTEMIS unavailability at equator crossing.
Thanks to the dense SAR acquisition initiated two years before, we had a large amount of interferograms picturing the whole rifting event from its early stage [8]. ENVISAT ASAR C-band interferograms from 3 different orbits, as well as ALOS L-band interferograms (Fig. 2) revealed a large deformation field affecting an area of about 70x50 km centered on the Southern flank of the Gelai volcano. As confirmed by field observations [9], vertical displacements up to 60cm were observed along up to 15km-long surface ruptures forming a fault bounded central graben. More interferograms spanning a period up to only 7 hours prior to the main shock show elliptical deformation pattern collocated with the future “axial graben” identified above.
Thanks to additional GPS data and seismic data from the fortuitous deployment of a local seismic network (SEISMO ‘TANZ’ 07), we could picture the full story of that complex

event [10]. Inverting the deformation maps [11, 12] and computing the normal stress show that the dyke opening was triggered by static stress changes associated with the slow slip of a normal fault during the early stage of the crisis.
Figure 2. The Lake Natron rifting event detected by InSAR. Wrapped ALOS L-band phase delay in radar geometry. Perpendicular baseline: 251m, time
span: 92 days, altitude of ambiguity: 256m. One fringe represents a 11.8 cm satellite-ground range change at a nadir angle of about 34°.
While magmatic processes related to rifting in fully developed oceanic rifts are well documented (e.g. Iceland and Afar), this is the first dyking event ever captured geodetically in a youthful continental rift, i.e. prior to significant crustal thinning. This provides important insights to our understanding of initial stages of continental breakup.
B. The Nyamulagira November 2006 eruption Nyamulagira shield volcano (North Kivu, DR Congo) is
known as the most active volcano in Africa (with an eruption every two years on average over the last century). Unlike Nyiragongo, a neighboring stratovolcano located South East of Nyamulagira, eruptions do not directly threaten the population of the nearby city of Goma (700.000 inhabitants) as most lava flows occur in uninhabited areas North of the volcano.
On November 27th 2006 an unusual eruption took place South of the volcano, along the oblique fracture network linking both volcanoes. A lava flow was reported extending southwards toward the inhabited areas of the Lake Kivu and the main supply road for Goma. Red glowing could be seen from the city attesting the unusual location, but poor weather conditions and heavy fights due to political instability hindered field and airborne observations until December 1st.
An emergency acquisition and InSAR processing procedure were immediately activated. Unfortunately, because of the ARTEMIS failure (i.e. the telecommunication satellite relaying data to the ground), the November 29th acquisition was cancelled. The next ENVISAT flyover on December 5th was delivered 18 hours after its acquisition. Benefiting from the database and the pre-defined parameterization of the InSAR processing, the eruptive center was located and deformations maps were produced within 1h30 after notification of data availability (Fig. 3) [13].
Several interferograms were computed in descending orbits showing displacements associated to the dyke intrusion at the location of recent lava flows, which only cover a small area. One interferogram acquired in ascending orbit had spatial and temporal baselines conditions allowing to overcome some of the vegetation-induced decorrelation and yielded displacements over area much larger than the descending orbits (Figure 2).
In order to determine the source of measured displacements, three descending and one ascending interferograms were analyzed with a 3-D numerical modeling method combined with a near neighborhood inversion algorithm [14]. To evaluate the data fit, data were unwrapped and subsampled at circular girded points and the 4 interferograms were simultaneously used in the inversion. Preliminary results show that two sources are needed to explain the measured displacements. One of the sources corresponds to a dyke located between Nyamulagira and Nyiragongo, which is aligned with the axis linking the two volcanoes. The other source still needs to be determined. As displacements created by both sources are close in space and time, these two sources should be determined simultaneously [15].
Figure 3. ENVISAT interferogram (Sep. 2006 – Dec. 2006) showing deformations associated to the November 2006 eruption of Nyamulagira. Fringes elongated NW-SE from southern flank of Nyamulagira up to SW flank of Nyiragongo. Deflation is also visible at the East of Nyamulagira.
White dashed line depicts the contour of the city of Goma. The fractures in cyan are extracted from the geological map [16]
C. The Bukavu February 2008 Earthquake sequence On February 3rd 2008, the Bukavu area (South Kivu, DR
Congo) was struck by a mb 5.9 Earthquake. The city is located on the Southern shore of the Lake Kivu, about 100km South of Goma.

Following the USGS NEIC catalog (1974-to-present) this is the largest event ever recorded in the area after the magnitude mb 6.2 earthquake of October 24th 2002 that occurred 35km SW of Goma. This 2008 event is of a particular importance because of its shallow depth and because it is associated to an intense seismic activity (i.e. 12 events of magnitude 3.7 and above were recorded in February, among which 3 were of mb >5). Yet another magnitude 5.3 event struck the area on October 5th 2008, few kilometers North of the Nyamulagira volcano.
One should go back in 1977 and 2002 (the years of the two only historical eruptions of the Nyiragongo) to find such an intense activity, when respectively 2 and 7 earthquakes of magnitude > 5 where recorded. Only two other magnitudes >5 events are known respectively in 1981 and in 1995 (the year of the highest level reached by the lava lake in the crater of the Nyiragongo since its drainage in the course of the 1977 eruption). Although this can obviously not be considered as precursory to imminent eruption, it definitely attest the current intense activity of that part of the EAR, as it is also noted e.g. with the intense activity of the Nyiragongo lava lake.
Unfortunately the seismic network maintained by the Goma Volcanological Observatory was not operated at the time of both main events. We therefore miss the local data to better constrain the focal mechanism as well as to confirm the shallow depth. Fortunately the Bukavu area is just South of the area where the systematic SAR acquisition started in 2005. As for the 2006 Nyamulagira eruption, at least one interferogram could be computed with baselines conditions favorable enough to overcome the vegetation-induced decorrelation (Fig. 4). The deformation map was inverted using simplex method [17] and helped to re-locate the event and provided useful information on the focal mechanism [18].
D. The Nyamulagira 2002 eruption On 17th January 2002, Nyiragongo volcano erupted along a
17 kilometers long fracture network extending from its southern flank up to 1.5 km North of Goma airport. Two lava flows entered the city and destroyed 15% of the town [19, 20].
The InSAR data from the ERS satellite show that the eruption was associated to a complex ground displacements pattern affecting a large part of that section of the rift and most likely resulting from a combination of the magmatic activity and the regional tectonic [21]. Unfortunately only sparse compatible ERS data were available in the archives leading to large time span, and therefore low coherence interferograms.
InSAR data corresponding to displacements of the Goma area and the Nyiragongo eruptive fissure are inverted with the same tools as mentioned above for the Nyamulagira 2006 eruption [14]. Several possible combinations of displacement sources have been studied: a dyke associated with the eruptive fissure combined to a deflating reservoir and a dyke combined to a normal fault. We need at least 11 parameters to invert a dyke and a reservoir. For the dyke and fault model, the dip and horizontal angle of the bottom part of the dyke were fixed to 90° and 0° respectively, leading to a 10 parameters inversion.
Figure 4. InSAR co-seismic deformation associated to the mb 5.9 Bukavu Earthquake of Feb. 3rd 2008. (a) Wrapped interferogram (one color cycle represents a 2.8 cm satellite-ground range change at a nadir angle of about
25°). Perpendicular baseline: 15m, Time span: 70 days, (b) Unwrapped phase delay expressed in cm (satellite to ground distance change), (c) Best fit model
in cm, (d) Residuals in cm (Average normalized rms = 0.59 cm).
The best-fit model for a dyke and reservoir poorly fits the data. An inversion with a dyke associated to the eruptive fissures and a West dipping normal fault close to Goma and parallel to the rift gives the best data fit and is mechanically the most plausible (Fig 5. and 6). Our preliminary model shows that a dyke and a normal fault can explain most of InSAR data close to Nyiragongo and city of Goma.
In order to improve the fit of the InSAR data, and to reduce the model uncertainties, more data from the RADARSAT satellite [22] are now included in a simultaneous inversion of the different viewing geometries and extra inversion parameters (dip and horizontal angle of the bottom part of the dyke) are being introduced in the inversions. A fringe pattern in the West and South-West parts of the Nyamulagira volcanic complex is still unexplained. It could be caused by the combination of two factors: an atmospheric contamination of the InSAR signal and the presence of a third deformation source in this area.

Figure 5. From tmodel and residuals blue lines represent
Figure 6. Geome2002 e
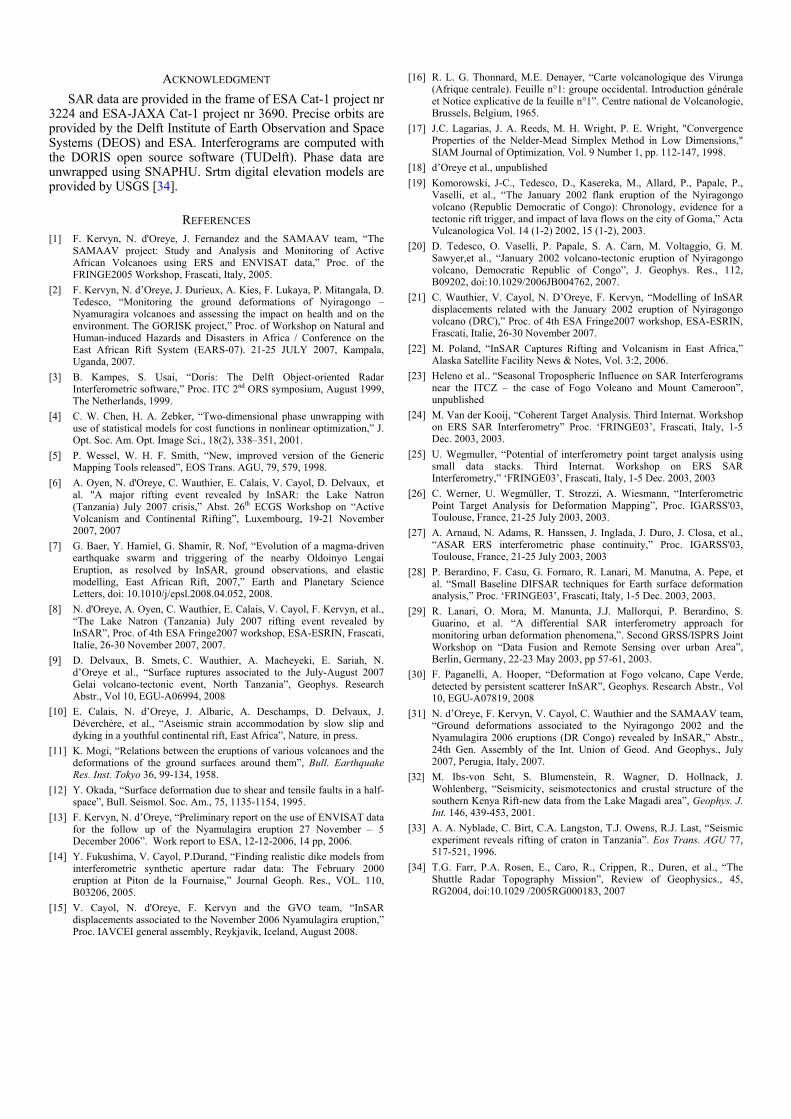
E. ITCZ seasonRich SAR d
delays observed Fogo (Cape Veobserved on higmisinterpreted asthe Mount Came7).
Comparing them with two independent calculations of
op to bottom: Observed ERS phase delay, preliminary for the best-fit bisource model (dyke + fault). Green and resp. the eruptive fissure and the upper part of the fault.
Precipitable Water Vapor in the troposphere (using MODIS and GPS data), reference [23] showed that these phase delays were to be attributed to the annual north-south migration of the Inter-tropical convergence zone (ITCZ), a permanent low-pressure belt surrounding the Earth near the equator and characterized by increased moisture and precipitation.
try of the best-fit sources associated to the Nyiragongo ruption: dyke (in green) and fault (in blue).
al oscillations atabases allowed the proper study of phase on numerous interferograms over Pico de
rde) and Mount Cameroon. These signals h relief volcanic areas could have been
deformations (up to 4 fringes over 2000m for roon and 6 fringes over 2500m for Fogo (Fig.
Figure 7. Example of phase delay observed on Fogo volcano: geocoded wrapped interferogram spanning December 1st 2006 - August 7th 2007
(altitude of ambiguity =275m). The signal is attributed to the effect of water vapor changes in the troposphere due to the seasonal north-south migration of the Inter-tropical convergence zone (ITCZ). Comparison with interferograms
of different altitude of ambiguities refutes a topographic error.
IV. CONCLUSIONS: The systematic INSAR monitoring of African active
volcanic zones proved to be efficient and brought valuable information both for our understanding of geophysical phenomena and for hazard assessment. Although such a rich database provided already results above our expectations, more could be extracted using time-series techniques like PSI, SBAS and related methods [24-29]. Some tests were already carried out with success on Fogo Island data [30] and more are planned shortly (including the other volcanic zones).
That kind of databases would also have most probably facilitated the study of similar events that occurred before our systematic SAR monitoring of these targets such as the Nyiragongo 2002 [21] and the Nyamulagira 2002 eruptions [31], or for events that took place along the EAR like seismic swarms at Lake Magadi in 1998 [32] and Lake Manyara in 1994 [33]; or for many unknown events.
We therefore encourage the use of systematic SAR acquisition (e.g. through ESA satellite’s background mission) over active zones that encompass main tectonic structures in Africa where practical, financial or political problems may limit the use of ground-base monitoring techniques.
ACKNOWLEDGMENT [16] R. L. G. Thonnard, M.E. Denayer, “Carte volcanologique des Virunga (Afrique centrale). Feuille n°1: groupe occidental. Introduction générale et Notice explicative de la feuille n°1”. Centre national de Volcanologie, Brussels, Belgium, 1965.
SAR data are provided in the frame of ESA Cat-1 project nr 3224 and ESA-JAXA Cat-1 project nr 3690. Precise orbits are provided by the Delft Institute of Earth Observation and Space Systems (DEOS) and ESA. Interferograms are computed with the DORIS open source software (TUDelft). Phase data are unwrapped using SNAPHU. Srtm digital elevation models are provided by USGS [34].
[17] J.C. Lagarias, J. A. Reeds, M. H. Wright, P. E. Wright, "Convergence Properties of the Nelder-Mead Simplex Method in Low Dimensions," SIAM Journal of Optimization, Vol. 9 Number 1, pp. 112-147, 1998.
[18] d’Oreye et al., unpublished [19] Komorowski, J-C., Tedesco, D., Kasereka, M., Allard, P., Papale, P.,
Vaselli, et al., “The January 2002 flank eruption of the Nyiragongo volcano (Republic Democratic of Congo): Chronology, evidence for a tectonic rift trigger, and impact of lava flows on the city of Goma,” Acta Vulcanologica Vol. 14 (1-2) 2002, 15 (1-2), 2003.
REFERENCES [1] F. Kervyn, N. d'Oreye, J. Fernandez and the SAMAAV team, “The
SAMAAV project: Study and Analysis and Monitoring of Active African Volcanoes using ERS and ENVISAT data,” Proc. of the FRINGE2005 Workshop, Frascati, Italy, 2005.
[20] D. Tedesco, O. Vaselli, P. Papale, S. A. Carn, M. Voltaggio, G. M. Sawyer,et al., “January 2002 volcano-tectonic eruption of Nyiragongo volcano, Democratic Republic of Congo”, J. Geophys. Res., 112, B09202, doi:10.1029/2006JB004762, 2007.
[2] F. Kervyn, N. d’Oreye, J. Durieux, A. Kies, F. Lukaya, P. Mitangala, D. Tedesco, “Monitoring the ground deformations of Nyiragongo – Nyamuragira volcanoes and assessing the impact on health and on the environment. The GORISK project,” Proc. of Workshop on Natural and Human-induced Hazards and Disasters in Africa / Conference on the East African Rift System (EARS-07). 21-25 JULY 2007, Kampala, Uganda, 2007.
[21] C. Wauthier, V. Cayol, N. D’Oreye, F. Kervyn, “Modelling of InSAR displacements related with the January 2002 eruption of Nyiragongo volcano (DRC),” Proc. of 4th ESA Fringe2007 workshop, ESA-ESRIN, Frascati, Italie, 26-30 November 2007.
[22] M. Poland, “InSAR Captures Rifting and Volcanism in East Africa,” Alaska Satellite Facility News & Notes, Vol. 3:2, 2006.
[23] Heleno et al.. “Seasonal Tropospheric Influence on SAR Interferograms near the ITCZ – the case of Fogo Volcano and Mount Cameroon”, unpublished
[3] B. Kampes, S. Usai, “Doris: The Delft Object-oriented Radar Interferometric software,” Proc. ITC 2nd ORS symposium, August 1999, The Netherlands, 1999.
[24] M. Van der Kooij, “Coherent Target Analysis. Third Internat. Workshop on ERS SAR Interferometry” Proc. ‘FRINGE03’, Frascati, Italy, 1-5 Dec. 2003, 2003.
[4] C. W. Chen, H. A. Zebker, “Two-dimensional phase unwrapping with use of statistical models for cost functions in nonlinear optimization,” J. Opt. Soc. Am. Opt. Image Sci., 18(2), 338–351, 2001.
[25] U. Wegmuller, “Potential of interferometry point target analysis using small data stacks. Third Internat. Workshop on ERS SAR Interferometry,” ‘FRINGE03’, Frascati, Italy, 1-5 Dec. 2003, 2003
[5] P. Wessel, W. H. F. Smith, “New, improved version of the Generic Mapping Tools released”, EOS Trans. AGU, 79, 579, 1998.
[6] A. Oyen, N. d'Oreye, C. Wauthier, E. Calais, V. Cayol, D. Delvaux, et al. "A major rifting event revealed by InSAR: the Lake Natron (Tanzania) July 2007 crisis,” Abst. 26th ECGS Workshop on “Active Volcanism and Continental Rifting”, Luxembourg, 19-21 November 2007, 2007
[26] C. Werner, U. Wegmüller, T. Strozzi, A. Wiesmann, “Interferometric Point Target Analysis for Deformation Mapping”, Proc. IGARSS'03, Toulouse, France, 21-25 July 2003, 2003.
[27] A. Arnaud, N. Adams, R. Hanssen, J. Inglada, J. Duro, J. Closa, et al., “ASAR ERS interferometric phase continuity,” Proc. IGARSS'03, Toulouse, France, 21-25 July 2003, 2003
[7] G. Baer, Y. Hamiel, G. Shamir, R. Nof, “Evolution of a magma-driven earthquake swarm and triggering of the nearby Oldoinyo Lengai Eruption, as resolved by InSAR, ground observations, and elastic modelling, East African Rift, 2007,” Earth and Planetary Science Letters, doi: 10.1010/j/epsl.2008.04.052, 2008.
[28] P. Berardino, F. Casu, G. Fornaro, R. Lanari, M. Manutna, A. Pepe, et al. “Small Baseline DIFSAR techniques for Earth surface deformation analysis,” Proc. ‘FRINGE03’, Frascati, Italy, 1-5 Dec. 2003, 2003.
[8] N. d'Oreye, A. Oyen, C. Wauthier, E. Calais, V. Cayol, F. Kervyn, et al., “The Lake Natron (Tanzania) July 2007 rifting event revealed by InSAR”, Proc. of 4th ESA Fringe2007 workshop, ESA-ESRIN, Frascati, Italie, 26-30 November 2007, 2007.
[29] R. Lanari, O. Mora, M. Manunta, J.J. Mallorqui, P. Berardino, S. Guarino, et al. “A differential SAR interferometry approach for monitoring urban deformation phenomena,”. Second GRSS/ISPRS Joint Workshop on “Data Fusion and Remote Sensing over urban Area”, Berlin, Germany, 22-23 May 2003, pp 57-61, 2003. [9] D. Delvaux, B. Smets, C. Wauthier, A. Macheyeki, E. Sariah, N.
d’Oreye et al., “Surface ruptures associated to the July-August 2007 Gelai volcano-tectonic event, North Tanzania”, Geophys. Research Abstr., Vol 10, EGU-A06994, 2008
[30] F. Paganelli, A. Hooper, “Deformation at Fogo volcano, Cape Verde, detected by persistent scatterer InSAR”, Geophys. Research Abstr., Vol 10, EGU-A07819, 2008
[10] E. Calais, N. d’Oreye, J. Albaric, A. Deschamps, D. Delvaux, J. Déverchère, et al., “Aseismic strain accommodation by slow slip and dyking in a youthful continental rift, East Africa”, Nature, in press.
[31] N. d’Oreye, F. Kervyn, V. Cayol, C. Wauthier and the SAMAAV team, “Ground deformations associated to the Nyiragongo 2002 and the Nyamulagira 2006 eruptions (DR Congo) revealed by InSAR,” Abstr., 24th Gen. Assembly of the Int. Union of Geod. And Geophys., July 2007, Perugia, Italy, 2007.
[11] K. Mogi, “Relations between the eruptions of various volcanoes and the deformations of the ground surfaces around them”, Bull. Earthquake Res. Inst. Tokyo 36, 99-134, 1958. [32] M. Ibs-von Seht, S. Blumenstein, R. Wagner, D. Hollnack, J.
Wohlenberg, “Seismicity, seismotectonics and crustal structure of the southern Kenya Rift-new data from the Lake Magadi area”, Geophys. J. Int. 146, 439-453, 2001.
[12] Y. Okada, “Surface deformation due to shear and tensile faults in a half-space”, Bull. Seismol. Soc. Am., 75, 1135-1154, 1995.
[13] F. Kervyn, N. d’Oreye, “Preliminary report on the use of ENVISAT data for the follow up of the Nyamulagira eruption 27 November – 5 December 2006”. Work report to ESA, 12-12-2006, 14 pp, 2006.
[33] A. A. Nyblade, C. Birt, C.A. Langston, T.J. Owens, R.J. Last, “Seismic experiment reveals rifting of craton in Tanzania”. Eos Trans. AGU 77, 517-521, 1996. [14] Y. Fukushima, V. Cayol, P.Durand, “Finding realistic dike models from
interferometric synthetic aperture radar data: The February 2000 eruption at Piton de la Fournaise,” Journal Geoph. Res., VOL. 110, B03206, 2005.
[15] V. Cayol, N. d'Oreye, F. Kervyn and the GVO team, “InSAR displacements associated to the November 2006 Nyamulagira eruption,” Proc. IAVCEI general assembly, Reykjavik, Iceland, August 2008.
[34] T.G. Farr, P.A. Rosen, E., Caro, R., Crippen, R., Duren, et al., “The Shuttle Radar Topography Mission”, Review of Geophysics., 45, RG2004, doi:10.1029 /2005RG000183, 2007