Systematic Country Diagnostic - World Bank MUR Mauritian Rupee MW Megawatt NCD Non-Communicable...
143
Report No. 92703-MU MAURITIUS Systematic Country Diagnostic June 25, 2015 Public Disclosure Authorized Public Disclosure Authorized Public Disclosure Authorized Public Disclosure Authorized
Transcript of Systematic Country Diagnostic - World Bank MUR Mauritian Rupee MW Megawatt NCD Non-Communicable...
Report No. 92703-MU
MAURITIUS
Systematic Country Diagnostic
June 25, 2015
Pub
lic D
iscl
osur
e A
utho
rized
Pub
lic D
iscl
osur
e A
utho
rized
Pub
lic D
iscl
osur
e A
utho
rized
Pub
lic D
iscl
osur
e A
utho
rized

i
MAURITIUS
Government Fiscal Year January 1 – December 31
ABBREVIATIONS AND ACRONYMS
ACP African, Caribbean and Pacific
AfDB African Development Bank
AGOA Africa Growth and Opportunity Act
BoP Balance of Payment
BPO Business Process Outsourcing
CEB Central Electricity Board
CHCL Cargo Handling Corporation Ltd.
CHSC Cambridge Higher School Certificate
COMESA Common Market for Eastern and Southern Africa
CPE Certificate of Primary Education
CPF Country Partnership Framework
CPI Consumer Price Index
CSC Cambridge School Certificate
CSR Corporate Responsibility Program
CWA Central Water Authority
EEZ Exclusive Economic Zone
EIA Environmental Impact Assessments
EPZ Export Processing Zone
EU European Union
FAD Fishing Aggregating Devices
FDI Foreign Direct Investment
FTTH Fiber-to-the-home
GDP Gross Domestic Product
GER Gross Enrollment Rate
HBS Household Based Survey
HIC High Income Country
HRMIS Human Resource Management Information System
ICT Information and Communication Technology
IFC International Finance Cooperation
IMF International Monetary Fund
IOC Indian Ocean Commission
IPP Independent Power Producers
kWh Kilowatt hour
LPI Logistics Performance Index
LPG Liquefied Petroleum Gas
MIC Middle-Income Country
MID Maurice Ile Durable
M&E Monitoring and Evaluation
MoFED Ministry of Finance and Economic Development
ii
MUR Mauritian Rupee
MW Megawatt
NCD Non-Communicable Disease
NEET Not in Education, Employment or Training
NER Net Enrolment Rate
NTA National Transport Authority
NTB Non-Trade Barrier
OECD Organization for Economic Cooperation and Development
PBB Performance Based Budget
PEFA Public Expenditure and Financial Accountability
PDMA Public Debt Management Act
PER Preliminary Environmental Reports
PISA Program for International Student Assessment
PPP Purchasing Power Parity
RDA Road Development Authority
ROA Return on Assets
ROs Remuneration Orders
Rs Rupees
SACU Southern African Customs Union
SADC Southern African Development Community
SME Small and Medium Enterprise
SOE State-Owned Entity
SRM Social Register of Mauritius
TEU Twenty-foot Equivalent Unit
TFP Total Factor Productivity
TTCI Travel and Tourism Competitiveness Index
TVET Technical and Vocational Education and Training
UAE United Arab Emirates
UN United Nations
UNCTAD United Nations Conference on Trade and Development
USD United States Dollar
WBI World Bank Institute
WDI World Development Indicators
WEO World Economic Outlook
WGI World Governance Indicator
Regional Vice President : Makhtar Diop
Country Director : Mark R. Lundell
Task Team Leader : Rafael Muñoz Moreno
iii
Contents
Acknowledgements .................................................................................................................................... viii
Executive Summary ..................................................................................................................................... ix
Chapter 1. Understanding poverty and vulnerabilities in Mauritius: Sustaining the middle class ......... 1
1.1. Overview: Poverty, shared prosperity and the middle class in Mauritius ..................................... 1
1.2. Who are the poor and the less well off in Mauritius? ................................................................... 5
1.3. Looking ahead: how to tackle poverty while increasing the middle class .................................. 11
Chapter 2. Assessing the drivers of growth in Mauritius ..................................................................... 13
2.1. Mauritius growth model in perspective....................................................................................... 13
2.2. Recent growth trends .................................................................................................................. 17
2.3. Expanding trade and investment and deepening regional integration ......................................... 20
2.4. Building a more competitive private sector ................................................................................ 27
2.5. Sector opportunities to boost economic growth and employment creation ................................ 36
Chapter 3. Supporting Inclusion ........................................................................................................... 49
3.1. Health .......................................................................................................................................... 49
3.2. Basic resources and services ....................................................................................................... 52
3.3. Education and skills .................................................................................................................... 55
3.4. Financial assets ........................................................................................................................... 61
3.5. Social protection system ............................................................................................................. 61
3.6. Labor markets and employment creation .................................................................................... 64
Chapter 4. Sustaining Progress ............................................................................................................. 70
4.1. Natural Hazards and Climate Change ......................................................................................... 70
4.2. Unsustainable Infrastructure policies .......................................................................................... 75
4.3. Macroeconomic policies to achieve high income status ............................................................. 85
4.4. Public sector management: improving service delivery ............................................................. 98
Chapter 5. Summary of the challenges ............................................................................................... 108
5.1. Prioritization approach .............................................................................................................. 109
5.2. Prioritization: final results ......................................................................................................... 115
Annexes
Annex 1: Statistics capacity ...................................................................................................................... 120 Annex 2: Recent analytical work .............................................................................................................. 122 Annex 3: Knowledge gaps ........................................................................................................................ 125 Annex 4: Map of the Republic of Mauritius ............................................................................................. 126
Boxes
Box 1: Why the middle class is important for Mauritius .............................................................................. 5 Box 2: Analyzing alternative poverty and inequality outcomes ................................................................. 12 Box 3: Building consensus to accelerate reforms ....................................................................................... 16 Box 4: Is there a middle income trap? ........................................................................................................ 21
iv
Box 5: The end of preferential access ......................................................................................................... 22 Box 6: The role of the public sector in spurring innovation ....................................................................... 29 Box 7: Brazil aquaculture - A success story ............................................................................................... 41 Box 8: The power of smart regulation and competition in fostering the ICT sector .................................. 48 Box 9: Examples of government interventions to boost skills .................................................................... 60 Box 10: Mauritius – Climate change and increasing natural hazards ......................................................... 72 Box 11: Mauritius: Embracing sustainable development on land and at sea .............................................. 74 Box 12: How vulnerable is the current account balance to external shocks? ............................................. 87 Box 13: Mauritius – Quickly aging population........................................................................................... 91 Box 14: Mauritius medium-term macroeconomic projections ................................................................... 98 Box 15: Understanding recent experiences of PPPs in Mauritius to improve future interventions .......... 102 Box 16: Examples of second generation public sector reforms in other countries ................................... 105
Tables
Table 1: Main challenges identified for boosting competitiveness: moving from industrial policy to
innovation policy ........................................................................................................................................ 48 Table 2: Main challenges identified for improving equity in public service delivery: ensuring employment
opportunities for all ..................................................................................................................................... 69 Table 3: Sectors most impacted by natural hazards and climate change .................................................... 71 Table 4: Main challenges identified for aligning resources and priorities: sustaining development ........ 106 Table 5: Summary of main issues identified ............................................................................................. 108 Table 6: Criteria for prioritizing opportunities and constraints ................................................................ 110 Table 7: Rewards/cost of different challenges .......................................................................................... 117
Figures
Figure 1: Income absolute and relative Poverty, 2007-2012 ........................................................................ 2 Figure 2: Share of consumption for bottom 40% of the population. Mauritius and comparator countries... 2 Figure 3: Annual growth of household income between 2007 and 2012...................................................... 3 Figure 4: Annual growth of household consumption between 2007 and 2012 ............................................. 3 Figure 5: Annual consumption growth of bottom 40 percent of the population, 2007-2012 ....................... 3 Figure 6: Distribution of population by income classes (2007 vs. 2012) ..................................................... 4 Figure 7: The middle class: demographic characteristics, 2012 ................................................................... 4 Figure 8: Poverty by age group ..................................................................................................................... 6 Figure 9: Poverty by age of head .................................................................................................................. 6 Figure 10: Family composition and income poverty, 2007, 2012 ................................................................ 7 Figure 11: Ethnicity and poverty, 2012 ........................................................................................................ 7 Figure 12: Education and income ................................................................................................................. 8 Figure 13: Poverty and unemployment ......................................................................................................... 8 Figure 14: Poverty headcount and poverty gap, selected countries ............................................................. 9 Figure 15: Regional poverty in Mauritius ..................................................................................................... 9 Figure 16: Inequality by income sources ...................................................................................................... 9 Figure 17: Median monthly earnings (Rs.) ................................................................................................... 9 Figure 18: Consumption share, poor vs. non-poor, 2012 ............................................................................ 10 Figure 19: Increase in consumption share poor vs. non-poor, 2007-2012 .................................................. 10 Figure 20: Elasticity of poverty rate to per capita consumption growth ..................................................... 11 Figure 21: Sensitivity of poverty rate to the choice of poverty line ............................................................ 11 Figure 22: Poverty and inequality projections, baseline scenario ............................................................... 12
v
Figure 23: Poverty simulations based on selected policy scenario ............................................................. 12 Figure 24: Decomposition of per capita value added growth, 1990-2013 .................................................. 15 Figure 25: Decomposition of productivity growth by broad sector, 1990-2013 ......................................... 15 Figure 26: Average contribution to annual GDP growth by decade, 1960-2013 ........................................ 15 Figure 27: Unemployment rate and real GDP growth, 1981-2013 ............................................................. 15 Figure 28: Number of new incorporations, 1997-2011 ............................................................................... 17 Figure 29: Ease of starting a business, 2005-2014 ...................................................................................... 17 Figure 30: Employment composition per sector, 2002-2012 ...................................................................... 18 Figure 31: Annual productivity growth in Mauritius, 2003-2013 ............................................................... 18 Figure 32: Gross investment rate, 1994-2012 ............................................................................................. 19 Figure 33: Public and private investment, Mauritius and peer countries, 2007-2011 ................................ 19 Figure 34: Growth decomposition, 2003-2013 ........................................................................................... 19 Figure 35: Consumption and credit: Mauritius vs. peer countries .............................................................. 19 Figure 36: Annual growth of real wages, consumption, 2003-2012 ........................................................... 20 Figure 37: Gross Savings rate (% of GDP), 1994-2012.............................................................................. 20 Figure 38: Exports, imports, and trade balance as share of GDP, 2000-2013 ............................................ 23 Figure 39: Distribution of goods exports as share of GDP, 2003-2012 ...................................................... 23 Figure 40: Mauritius goods exports by continent, Millions of rupees, 1990-2013 ..................................... 23 Figure 41: Concentration (Herfindahl) indices, selected countries, 2004-2013 ......................................... 23 Figure 42: FDI (% of GDP), selected countries, 1978-2012....................................................................... 24 Figure 43: FDI per sector (% of GDP), 2006-2013 .................................................................................... 24 Figure 44: Electricity tariff per consumer, US$ per Kwh, 2012 ................................................................. 26 Figure 45: Water tariff per consumer, US$ per m3, 2012 .......................................................................... 26 Figure 46: Global ranking of knowledge Economy Index: Mauritius and comparators ............................. 27 Figure 47: Key innovation indicators: Mauritius and comparators ............................................................ 27 Figure 48: Labor shortage by sector, 2012 ................................................................................................. 30 Figure 49: Difficulties finding the right candidate, 2014 ............................................................................ 30 Figure 50: Number of registered carrier departures (1,000) ....................................................................... 31 Figure 51: Tourism receipts for passenger transport................................................................................... 31 Figure 52: Air departures and passengers ................................................................................................... 31 Figure 53: Ticket taxes and airport fees for selected countries relative to UK ........................................... 31 Figure 54: Labor Productivity of Airlines ................................................................................................... 32 Figure 55: Liner Shipping Connectivity Index ........................................................................................... 32 Figure 56: Container Traffic: Port Louis (TEU) ......................................................................................... 33 Figure 57: Cargo handling costs ................................................................................................................. 33 Figure 58: Port operation performance ....................................................................................................... 34 Figure 59: Number of water insufficiencies per month .............................................................................. 34 Figure 60: Time required to get electricity (2013), days ............................................................................ 35 Figure 61: Percent of firms identifying electricity as a major constraint .................................................... 35 Figure 62: GDP by manufacturing group, % of GDP, 1999-2013 .............................................................. 42 Figure 63: Employment in the manufacturing sector, 2000-2013 .............................................................. 42 Figure 64: International tourism (Number of arrivals) ............................................................................... 42 Figure 65: Tourism receipts per tourist ....................................................................................................... 42 Figure 66: Hotel and fuel prices .................................................................................................................. 43 Figure 67: Travel & tourism competitiveness Index................................................................................... 43 Figure 68: International bandwidth, 2009 ................................................................................................... 46 Figure 69: International bandwidth, 2013 ................................................................................................... 46 Figure 70: Life Expectancy in Mauritius compared to other upper-MICs .................................................. 50 Figure 71: Infant mortality in Mauritius compared to other upper-MICs ................................................... 50 Figure 72: Health spending as percentage of household income ................................................................ 51 Figure 73: Health spending as percentage of non-food household income ................................................ 51 Figure 74: Percentage of households making out-of-pocket health expenditures ...................................... 51 Figure 75: Percentage of households facing catastrophic health spending ................................................. 51
vi
Figure 76: Comparison of catastrophic health expenditure across peer countries ...................................... 52 Figure 77: Cost of water as percent of household income, 2006, 2012 ...................................................... 53 Figure 78: Sewerage Coverage, percent of households, 2014 .................................................................... 53 Figure 79: Price of Kw in Mauritius and other comparable MICs, 2001 and 2009 .................................... 54 Figure 80: Percentage of household income spent on electricity, 2007 and 2012 ...................................... 54 Figure 81: ICT penetration, 2013 ................................................................................................................ 54 Figure 82: ICT tariffs, 2013 ........................................................................................................................ 54 Figure 83: Education enrollment per level, 2011 ........................................................................................ 56 Figure 84: CPE pass rate, 1980-2012 .......................................................................................................... 57 Figure 85: PISA reading results, 2011 ........................................................................................................ 57 Figure 86: Returns on schooling, 1999-2012 .............................................................................................. 58 Figure 87: Returns on schooling, peer countries, 2011 ............................................................................... 58 Figure 88: Poverty by education of head .................................................................................................... 58 Figure 89: Education by income group, 2007 2012 .................................................................................... 58 Figure 90: Enrolment in TVET as percentage of total secondary enrolment .............................................. 59 Figure 91: Account ownership, Mauritius and other Sub-Saharan countries, 2011 ................................... 61 Figure 92: Access to credit, Mauritius and other Sub-Saharan countries, 2011 ......................................... 61 Figure 93: Benefit incidence of poverty targeted programs in selected middle income countries ............. 63 Figure 94: Employment and labor force growth, 1990-2012 ...................................................................... 65 Figure 95: Labor force participation, Mauritius and peer countries, 2012 ................................................. 65 Figure 96: Annual growth in employment and productivity across sectors, 1990-2013 ............................ 66 Figure 97: Employment creation per sector, 2002-2012 ............................................................................. 66 Figure 98: Female labor market comparison to other MICs (% of labor force) ......................................... 67 Figure 99: Male-Female labor market comparison, 2001 and 2012 (% of labor force).............................. 67 Figure 100: Youth labor market comparison to other MICs (% of labor force) ......................................... 68 Figure 101: Youth labor market comparison, 2001 and 2012 (% of labor force) ....................................... 68 Figure 102: Accumulated growth wages productivity and employment, 2003-2012, 2013=100 ............... 69 Figure 103: Real wages annual growth per sector, 2003-2012 (%) ............................................................ 69 Figure 104: Change in wealth per capita, 1995 - 2010 ............................................................................... 75 Figure 105: Natural capital depletion per capita, 1995 – 2010 ................................................................... 75 Figure 106: Water revenues/service population/GNI (% GNI per capita), 2006 ........................................ 76 Figure 107: Nonrevenue water (%), 2014 ................................................................................................... 76 Figure 108: Rainfall and water use (Mm3), 2012 ....................................................................................... 77 Figure 109: Kw/hab. installed capacity in Mauritius and peer island countries, 2008 ............................... 78 Figure 110: Electricity production per source in 2011 and targets ............................................................. 78 Figure 111: Road density per land area ...................................................................................................... 79 Figure 112: Road density per capita ........................................................................................................... 79 Figure 113: Mauritius: vehicles and GDP per capita .................................................................................. 80 Figure 114: Motorization and income growth ............................................................................................ 80 Figure 115: Distribution of road network by annual average daily traffic .................................................. 81 Figure 116: Morning peak traffic conditions in the central business district .............................................. 81 Figure 117: Road traffic death rate per 100,000 population ....................................................................... 82 Figure 118: Distribution of road accident deaths ........................................................................................ 82 Figure 119: Pump price for gasoline, 2012 (US$ per liter) ......................................................................... 83 Figure 120: Share of transport costs for first quintile households .............................................................. 84 Figure 121: Cost recovery ratio to revenue ................................................................................................. 84 Figure 122: GDP per unit of energy use, PPP$ per kg of oil equivalent .................................................... 84 Figure 123: Cost recovery ratio to revenue, 2000-2012 ............................................................................. 84 Figure 124: Private & public consumption rates (% of GDP) .................................................................... 85 Figure 125: Saving, investment evolution (% of GDP), 2003 and 2013 .................................................... 85 Figure 126: Contributions to the current account dynamics as percent of GDP, 1991-2013...................... 86 Figure 127: Current account projections under shocks to the fiscal balance (% of GDP) .......................... 87 Figure 128: Current account projections under shocks to REER and terms of trade (% of GDP) ............. 87
vii
Figure 129: Fiscal and Debt consolidation, % of GDP, 2005-2013 ............................................................ 88 Figure 130: Public expenditure of upper MICs (% of GDP), 2012 ............................................................ 88 Figure 131: Taxes on goods and services of upper MICs (% of tax revenue), 2011 .................................. 89 Figure 132: Social contributions of upper MICs (% of GDP), 2011 .......................................................... 89 Figure 133: Government expenditure by category, 2007 - 2013 ................................................................ 90 Figure 134: Government expenditure by function, % of GDP, 2003-2013 ................................................ 90 Figure 135: Health sector spending as % of GDP, Mauritius, 2004 - 2013 ................................................ 92 Figure 136: Private sector spending as % of GDP, Mauritius and other MICs, 2013 ................................ 92 Figure 137: Projected long term spending on basic retirement pension ..................................................... 93 Figure 138: Projected benefits from national pension fund ........................................................................ 93 Figure 139: Public spending on education (% of GDP, selected countries, 2008-2011 average ................ 94 Figure 140: Public spending on education by level, 2008-2011 average.................................................... 94 Figure 141: Central and public enterprises debt, 2003 - 2012 .................................................................... 95 Figure 142: Political Stability, 2013 ........................................................................................................... 99 Figure 143: Rule of Law, 2013 ................................................................................................................... 99 Figure 144: Budget management, PEFA indicators, 2007, 2011 ................................................................ 99 Figure 145: PEFA indicators, % of total, 2007, 2011 ................................................................................. 99 Figure 146: Governance effectiveness, 1996-2013 ................................................................................... 100 Figure 147: voice and accountability, 2005-2013 ..................................................................................... 100 Figure 148: Control of corruption, 2005-2013 .......................................................................................... 100 Figure 149: Corruption perception index by institutions, 2012 ................................................................ 100
viii
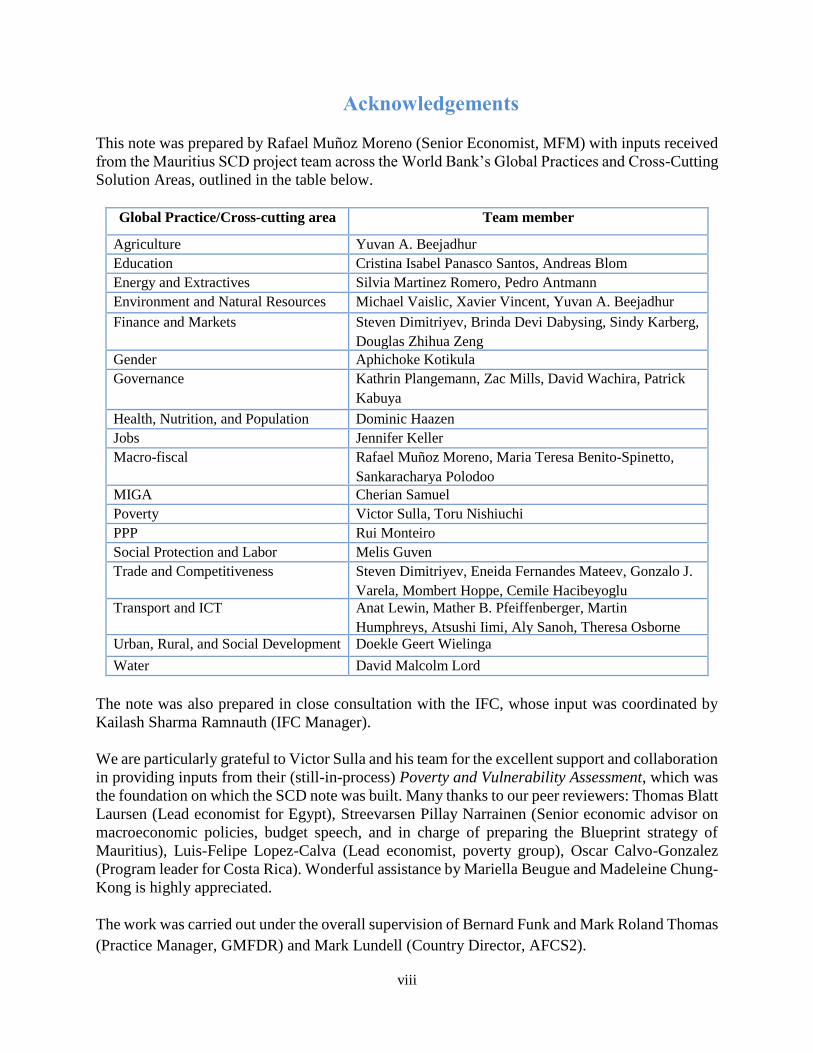
Acknowledgements
This note was prepared by Rafael Muñoz Moreno (Senior Economist, MFM) with inputs received
from the Mauritius SCD project team across the World Bank’s Global Practices and Cross-Cutting
Solution Areas, outlined in the table below.
Global Practice/Cross-cutting area Team member
Agriculture
+
Yuvan A. Beejadhur
Education Cristina Isabel Panasco Santos, Andreas Blom
Energy and Extractives Silvia Martinez Romero, Pedro Antmann
Environment and Natural Resources Michael Vaislic, Xavier Vincent, Yuvan A. Beejadhur
Finance and Markets Steven Dimitriyev, Brinda Devi Dabysing, Sindy Karberg,
Douglas Zhihua Zeng
Gender Aphichoke Kotikula
Governance Kathrin Plangemann, Zac Mills, David Wachira, Patrick
Kabuya
Health, Nutrition, and Population Dominic Haazen
Jobs Jennifer Keller
Macro-fiscal Rafael Muñoz Moreno, Maria Teresa Benito-Spinetto,
Sankaracharya Polodoo
MIGA Cherian Samuel
Poverty Victor Sulla, Toru Nishiuchi
PPP Rui Monteiro
Social Protection and Labor Melis Guven
Trade and Competitiveness Steven Dimitriyev, Eneida Fernandes Mateev, Gonzalo J.
Varela, Mombert Hoppe, Cemile Hacibeyoglu
Transport and ICT Anat Lewin, Mather B. Pfeiffenberger, Martin
Humphreys, Atsushi Iimi, Aly Sanoh, Theresa Osborne
Urban, Rural, and Social Development Doekle Geert Wielinga
Water David Malcolm Lord
The note was also prepared in close consultation with the IFC, whose input was coordinated by
Kailash Sharma Ramnauth (IFC Manager).
We are particularly grateful to Victor Sulla and his team for the excellent support and collaboration
in providing inputs from their (still-in-process) Poverty and Vulnerability Assessment, which was
the foundation on which the SCD note was built. Many thanks to our peer reviewers: Thomas Blatt
Laursen (Lead economist for Egypt), Streevarsen Pillay Narrainen (Senior economic advisor on
macroeconomic policies, budget speech, and in charge of preparing the Blueprint strategy of
Mauritius), Luis-Felipe Lopez-Calva (Lead economist, poverty group), Oscar Calvo-Gonzalez
(Program leader for Costa Rica). Wonderful assistance by Mariella Beugue and Madeleine Chung-
Kong is highly appreciated.
The work was carried out under the overall supervision of Bernard Funk and Mark Roland Thomas
(Practice Manager, GMFDR) and Mark Lundell (Country Director, AFCS2).

ix
Executive Summary
Introduction
1. Mauritius has been a success story since independence, moving from low income to upper
middle-income status. Close public-private partnerships facilitated private sector-led growth in a
stable macroeconomic and institutional environment. The government implemented an active
industrial policy to support private sector competitiveness while exploiting global trade niches
created by preferential access arrangements. As a result, savings were high and reinvested in
diversifying the economy. Starting as a mono-cropped, inward-looking economy, Mauritius
moved toward an export oriented and diversified economy producing textiles, tourism, financial
and ICT services.
2. Mauritius’ social contract is behind its successful inclusive economic model. At the time
of independence, ethnic fragmentation, wealth concentration, mono-crop economy, high
population growth and limited land and natural resources weighed heavily against the chances of
the country to develop in a sustainable and equitable way. Mauritius’ social contract was the
response to this complex reality, and in turn it has shaped the development of the country in terms
of wealth creation and shared prosperity. Ethnic tensions were strong and the political system
ensured that all ethnic groups were adequately represented in the National Assembly while the
public sector ensured that no ethnic group was left economically behind. A balance was struck to
guarantee that owners maintained their assets to create wealth while the political system
established a welfare state to redistribute wealth and respond to the needs of the majority of the
population. Furthermore, close public-private dialogue allowed the government to provide the
private sector with an adequate environment for reallocation of resources into new growing
sectors.
3. As a result, growth was shared among the population at large. Export-led industries
translated into substantial employment creation and subsequent productivity gains supported rise
in salaries. Growing household income not only improved quality of life but also was substantially
reinvested into human capital, through government free education and health programs.
Responsive institutions ensured that public services expanded for all, and significant social
protection programs supported the most vulnerable. This shared economic growth pulled the
majority of the population out of poverty and created a vast middle class.
4. About a decade ago, Mauritius’s economic model showed signs of distress, associated with
the loss of preferential access, negative terms of trade, and growing international competition in
low cost industries. With a limited number of financially sustainable alternatives, a new
government received a clear political mandate to move forward with sweeping reforms. The
government liberalized the economy to facilitate the transition of resources toward the expanding
sectors of the economy. The labor market was reformed, sectors were opened to foreign
investment, the business environment improved, tax compliance was simplified, and fiscal
expenditure was reined in. The reforms paid off quickly in the form of accelerating GDP growth,
employment creation, rising Foreign Direct Investment (FDI), growing private investment, and
declining public debt ratios. Furthermore, the economy become more resilient which helped it to
navigate the global international downturn and the subsequent European economic slowdown.
x
5. Results since 2010 have been less encouraging than expected, and the government is facing
challenges on several fronts. GDP growth is losing steam as the positive impact of reforms wanes
and the external environment remains uncertain. Employment creation remains subpar and
growing inequality is slowly eroding the standard of living for the poor and the most vulnerable.
The public-private dialogue that worked so well in the past is having less impact. What is more
worrisome, it is becoming increasingly difficult to deliver on the social contract as signs of a
strained middle class show. With this situation in mind, the government is facing mounting social
and economic challenges that will make it more difficult to achieve high-income status in the
medium term while ensuring broad-based prosperity.
6. Mauritius is now at a crossroads. On the one hand, it can pursue a path where reinvigorated
public investment boosts economic growth and reinforced public assistance enhances
redistribution. On the other hand, it can select a path where private sector identifies constraints
for growth and the public sector is the enabling agent that removes them, ensuring that proceeds
are adequately shared by targeted assistance and improved service delivery. While the first option
is tempting it will unlikely move the country toward the kind of sustainable economic growth that
would allow the country to reach high-income status. Furthermore, there are high risks that the
country would get stuck in a middle-income trap of relatively low value-added growth and
widening social outcomes. The second option will be harder, as it will require a careful review of
the economic model that has worked successfully thus far. This review will need to acknowledge
the challenges that hold back the country’s potential and the limitations of the more vulnerable
citizens to reap the fruits of economic growth. Yet, it is just such revival of a social contract that
has worked so well in the past, one in which private and public sector dialogue works effectively
and economic diversification and shared prosperity are at the core of this dialogue.
7. In this context, the Systematic Country Diagnostic (SCD) is intended to assess the priorities
of Mauritius to accelerate sustainable economic growth while improving the welfare of the less
well off. The SCD aims to understand why income growth among the bottom 40 percent of the
population has been low relative to the average income. The SCD also addresses how the rate and
structure of aggregate growth can be improved to accelerate income growth among the bottom 40
percent of the population, as well as ensure that overall growth is sustainable. The individual
chapters of the SCD analyze the opportunities and challenges to meeting these objectives with
respect to economic growth, inclusiveness, and sustainability. The SCD concludes with a
prioritization of the key challenges.
Declining poverty, growing inequality and increasing difficulties to retain middle class status
8. Absolute poverty in Mauritius is negligible by international standards. No one lives below
USD1.25 a day and less than 1 percent of the population lives below USD2 a day. Poverty is also
low by national standards and it has fallen over the last five years, with the national poverty rate
down from 8.5 percent in 2007 to 6.9 percent in 2012. However, poverty is higher in households
headed by females and by those with education below the secondary level. Most notably, poverty
is concentrated among children and youth, which has important implications for inclusion and
inter-generational transmission of poverty.
9. During the last five years, there has been a remarkable increase in inequality in Mauritius
and the Gini coefficient after transfers increased from 0.34 to 0.37, slowing down the pace of
xi
poverty reduction. As a result, relative poverty1 has increased from 8.5 percent in 2007 to 9.8
percent in 2012. More importantly, income growth of the bottom 40 percent of the population has
been disappointing and increased at an annual rate of 1.8 percent compared to 3.1 percent for the
population at large.
10. As a result, the middle class has shrunk during the last five years and is increasingly
vulnerable to falling back into poverty, putting growing pressure on the bottom 40 percent of the
population to achieve or retain their middle class status. Indeed, the most important driver of
poverty reduction is employment, and widening differences in salaries across quintiles are the
main explanation for the surge in inequality. Social transfers have played a central role in reducing
poverty and inequality but cannot fully counteract differential labor market outcomes.
11. Poverty is expected to continue its downward trend and micro simulations indicate it could
fall to around 4.9 percent by 2019 should current trends continue. However, inequality is expected
to continue increasing as growth dynamics will be tilted toward high-skilled services sectors and
against the most vulnerable and uneducated. Without ensuring broad-based income growth, it will
be increasingly difficult to eradicate poverty and ease the pressure on the vulnerable and on the
low middle class to retain their status. Furthermore, strong social discontent cannot be ruled out
should broadly shared economic growth slow down. While many have escaped poverty and have
progressed through the income ranks, there are still people at risk of falling back into poverty.
12. Current economic conditions are creating substantial discontent as employment and
income levels remain subpar and those more vulnerable fail to obtain an equitable share of income
growth. These conditions are expected to continue and could potentially be reinforced.2 Failing
to address the challenges identified in this SCD will send Mauritius into what is called a middle-
income trap. If it is unable to move toward higher value-added sectors, the economy will face
growing international competition and be unable to create sufficient employment and income,
raising the dissatisfaction of the population.
Need to move from industrial policy toward innovation policy
13. The liberalization of the industrial model in the mid-2000s brought considerable
diversification to the Mauritian economy. Services boomed at the expense of agriculture and
industrial production. Yet, the model is affected by substantial headwinds in the form of losing
preferential access in textile and sugar production and heightened international competition.
Exports have also evolved toward services but overall remain below the pre-2008 global crisis
levels. Economic growth has been sustained by growing private consumption at the expense of
households’ savings. However, in a context of declining productivity gains, the current growth
model will be difficult to sustain. This is already evidenced by a wage setting mechanism that has
increasingly put pressure to raise salaries above productivity gains, affecting the competitiveness
of certain sectors and lowering private investment and employment creation.
1 The relative poverty line is calculated as a share of median income, and the absolute poverty line is based on a real income (or
consumption) poverty line anchored in 2007 prices. 2 There are four underlying forces that will further challenge Mauritius’ objectives: (i) increasing global competition; (ii) rising
inequality; (iii) aging population; and (iv) extreme vulnerability to natural hazards.
xii
14. This dynamic has set Mauritius on a low value added growth path, unable to deliver on the
government’s and population’s aspirations. Developing a new growth model for Mauritius will
require improving productivity at the firm level to raise the country’s competitiveness. This SCD
identifies three main areas that are holding back the potential of the economy to accelerate
economic growth: limited and inadequate skills, limitations for technology absorption, and
inadequate trade facilitation.
15. Exporting sophisticated products with higher added value depends upon the capability of
the labor force to adopt new technologies and embrace new processes. However, half of the firms
across all sectors in Mauritius note the constraint of a limited pool of workers with adequate
qualifications and skills. As the technological gap between Mauritius and advanced economies
narrows, the need for education and skills at all levels grows. This lack of adequate skills has a
negative impact on the inclusiveness of growth, as the most vulnerable are the most affected.
16. Mauritius’ innovation system ranks 76th in the 2014 global competitiveness index, far
behind other middle-income countries. This undermines the country’s ability to attract additional
FDI and, more importantly, to absorb global knowledge and technology. As a result, economic
diversification toward higher value-added sectors and links to global markets are curtailed. To
address this, a better institutional framework and incentives for innovation are needed. Education
and skills should be improved and realigned towards the needs of the business sector. The linkages
between academia and business should be reinforced to increase R&D. A better enabling
environment supported by adequate intellectual property laws would serve to protect and
encourage knowledge transfer.
17. Mauritius ranks 29th in the 2014 global enabling trade index, reflecting upgrades to port
and airport facilities and the expansion of ICT services. This has improved trade facilitation
substantially, making Mauritius a regional hub for container transshipment and supporting the
development of Information and Communication Technology/Business Process Outsourcing
(ICT/BPO) services. However, current policies, such as those disallowing fifth freedom3 and
foreign ownership of air carriers, undermine the management and operationalization of this
infrastructure, limiting competitiveness and hampering employment creation. Further air
liberalization would enhance market competition, reduce prices and stimulate growth in the
tourism market by reducing airfares and increasing passenger flows by 20-30 percent. Improved
operational efficiency in cargo handling would secure Port Louis as a regional transshipment hub
in a context of growing regional competition. To support the ICT sector, promotion of
infrastructure sharing and unbundling the local loop network would further reduce tariffs for
international bandwidth connectivity.
Improving equity in public service delivery: ensuring employment opportunities for all
18. Wage income is the main driver of prosperity in Mauritius, yet the most vulnerable struggle
to fully reap the benefits of economic growth because not enough employment is created and
many workers lack adequate skills for today’s labor market. The government has substantially
invested in providing widespread and equitable access to basic services, including basic
infrastructure and free health and education for the entire population. Across the board, however,
3 The fifth freedom allows an airline to carry revenue traffic between foreign countries as a part of services connecting the airline's
own country. Rowell David. Freedoms of the Air. The travel Insider. (2012-11-12).

xiii
issues related to the quality of these public services explain diminishing opportunities for the most
vulnerable and intergenerational inequality.
19. Labor market institutions constrain the capacity of the economy to create jobs, and
reinforce gender inequity. The decentralized wage settling mechanism fails to accommodate
salary increases with sector productivity. This is explained by spill-overs from more dynamic
sectors and large public sector salary increases as well as wage growth in line with inflation rather
than productivity. As a result, unit labor costs in certain sectors grow too quickly, undermining
competitiveness and employment creation. Despite the low labor force participation of around 60
percent, the 8 percent unemployment rate is becoming entrenched. Labor market inequity is
evidenced by substantial and persistent gender gaps in terms of low female labor force
participation, higher unemployment rates, and large wage gaps. As a result, female-headed
households face consistently larger poverty rates in comparison to male ones.
20. The education system as currently structured limits human capital growth and fosters
intergenerational inequality. The free public education system provides all children with full
access to education, but the fact that many households finance private schooling and tuition
translates into highly unequal education outcomes. Not only do too many children fail to acquire
the minimum level of education, partially because of failing the Certificate of Primary Education,
but also the overall quality of learning does not compare well with other upper middle-income
countries. The education system is failing to equip many young Mauritians with adequate skills,
which is repeatedly mentioned by the private sector as one of the major constraints to creating
additional employment.
21. Employment is vital in shaping household income in Mauritius. If not adequately corrected
through training later on, inequity in education outcomes results in income inequality, ingraining
substantial intergenerational poverty in the country. Dedicated efforts will be needed to raise the
quality of the entire education system for the population at large, including a vocational stream
responsive to private sector demands. In the short term, large targeted training programs could be
envisaged to retooling the Mauritian labor force in line with current market requirements,
boosting employment and income generation.
22. Existing social protection systems reduce the level and depth of poverty but cannot fully
compensate for the level of income inequality that the labor market generates. Overall, results
could be improved if spending is better targeted to reach poor households and the system is made
more efficient. Furthermore, better integration of sector policies in health, education, and active
labor market programs, could better tackle chronic poverty, facilitate labor market reintegration
at a time of declining population growth, and promote private savings through pension reform.
Aligning resources and priorities: sustaining development
23. Mauritius is committed to sustainable development and has pioneered initiatives such as
Maurice Ile Durable and ocean economy strategies that serve as models for other Small Island
Developing States (SIDS). These initiatives are a reaction to structural factors, particularly the
extreme vulnerability of the country to natural hazards, which will be further worsened because
of climate change. Policies, institutions, tools and practices need to be strengthened to build
resilience and mitigate natural shocks. Also, a reinforced regional approach in many areas could

xiv
not only help sustain natural resources such as fish stock, but also exploit emerging opportunities
including the ocean economy.
24. Aspirations to become a high-income economy will be difficult to achieve unless certain
infrastructure policies are revised and resilience is built in its infrastructure, both public and
private, in terms of location, orientation, construction codes, land management and overall better
public sector management of disaster risks. While water resources abound, the country faces
continuous water shortages as a result of insufficient tariffs, lack of investment, and inadequate
policies and sector governance. Lack of consensus about the development of the electricity sector
is hampering essential investment, putting at risk the expansion of electricity generation at a
reasonable cost. Also, despite substantial expansion of the road network, current transport policies
cannot cope with growing congestion, particularly in the most densely urbanized areas of the
country. Lack of available land will further limit the development of the road network calling for
parallel interventions to manage demand so that pricing adequately reflects congestion and
opportunity costs, while providing adequate public transportation.
25. The extreme vulnerability of the country and the aim to achieve high-income status in the
medium term calls for a careful consideration of the public sector role. On the one hand, the
government will need to ensure that adequate fiscal and monetary tools are always available to
cope with any potential external shock, environmental or economic. Historical analysis indicates
that cyclones alone have been responsible for about US$85 million in damages and losses,
therefore there is a need for adequate fiscal space to cope with disasters, including disaster risk
financing tools and insurance. On the other hand, public resources will need to be reallocated to
emerging priorities in terms of building infrastructure and human capital. This will be particularly
challenging, as the public budget will be under considerable pressure as a result of the aging
population and its impact on health and pension spending. Overall, this may require increasing
the level of public expenditure accompanied by a careful review of policies and a consideration
of trade-offs to reorient public spending toward the most critical needs.
26. Aspirations to become a high-income economy will be difficult to achieve unless
modernization of the public sector accelerates. Public sector efficiency is subpar when compared
with other upper middle-income countries and there are areas where the quality and equity of
public service delivery is inadequate. A new wave of public sector reforms could raise
accountability at all levels, improve planning, procurement, and management processes across
the system, and ingrain a continuous process of monitoring and evaluation to support evidence-
based policy making.
Defining the priorities for achieving the twin goals
27. The analysis presented in the SCD identifies 18 high level challenges across three thematic
areas to achieving inclusive, high-income level status. These are (i) identifying the drivers of
growth, (ii) supporting inclusion, and (iii) sustaining progress. The priorities identified describe
the inputs and environment that will be required for Mauritius’ successful economic
transformation. A range of assessment criteria was used to identify the highest priority challenges,
with the most important criteria focused on the potential impact to eliminating extreme poverty
and ensuring sustainable employment and income for the bottom 40 percent. The prioritization
process aims to balance the relevance of the interventions with a timeline that provides an
xv
inclusive path to reaching high-income status, while reinforcing political capital to move the
reform process forward.
28. In the short term, there is a need to accelerate economic growth and employment. This calls
for unlocking sector specific constraints to boost domestic investment and employment creation.
The government has keenly embraced reforms to support SMEs and skill development as well as
removing some sector constraints to favor private investment. These measures are broadly
accepted by the population at large and could translate into positive impact in a relatively short
period of time. Yet, for these measures to be fully successful they need to be complemented with
some additional and politically costly supply side reforms, especially to remove constraints in
trade facilitation including port management, ICT connectivity, and air access. These reforms
would have a significant impact on the potential for exports of services, boosting employment in
ICT/BPO, tourism, and trade and absorbing losses in declining sectors such as agriculture and
textiles. While the political cost of the latter reforms may be high, the large impact foreseen and
the complementarity with measures already announced by the government could translate into
meaningful impact that would be achieved during the current government’s tenure.
29. In the medium term, there is a need to develop a more competitive economy centered on
higher valued-added sectors. The government needs to establish the right incentives to support
the transition toward a high-income economy, including improved innovation policies and labor
market institutions. Revisiting industrial policies and improved innovation policies can pay off
in the medium term in the form of higher FDI, knowledge transfer, and increased competitiveness
if they are implemented in the short term, helping to overcome relatively low political capital
costs. While reforming labor market institutions may be costly, it would have a large positive
impact if combined with the above reforms, helping to set a more competitive economy.
30. Mauritius’ aspirations will be difficult to achieve and sustain if sustainable policies for
transport, electricity, water and wastewater management and the ocean economy are not put into
place. This improved governance would include policies to manage demand, improve governance
in utility companies, establish sustainable tariffs, and increase investment to sustain the quality of
the services for the entire population. Early implementation of these reforms would help to reap
their benefits during the current government’s tenure.
31. There is a need to build the buffers to cope with natural hazards and design policies to
mitigate their impact. Mauritius remains extremely exposed to natural hazards and this will only
increase over time as climate change continues. Adequately integrating the sustainable policies
of Maurice Ile durable will be important to build the resilience of the country. A comprehensive
Disaster Risk Management and Climate Adaptation Framework can be built incrementally to
mitigate the impact of future disasters at low political cost. Opportunities to exploit natural
resources, from the ocean economy to the tourism industry, call for more concerted regional
cooperation to ensure that these resources are sustainably preserved.
32. Improving public service delivery will require the adoption of a modern public sector
approach based on continuous evaluation and strengthened accountability. Moving forward,
further progress would require tackling some more politically costly reforms. Fiscal space will
need to be created by increasing public resources, eliminating waste and divesting away from
non-priority areas such as State Owned Enterprises (SOEs) so that public services are aligned
xvi
toward the emerging needs of the country in terms of building human capital and infrastructure.
Furthermore, pension and health policies will need to be revisited to cope with growing costs
related to an aging population. Implementing these policies sooner rather than later would
facilitate a more even distribution of its impact among the population, which would ease
resistance to policy reform in these areas.
33. The key to making Mauritius a successful inclusive high-income economy lies in
improving its education system. Raising the quality of education and better aligning skills with
labor market needs will help Mauritians, especially the youth, reap the benefits of economic
growth in the form of expanded employment opportunities and increased income. Not only may
additional public resources be needed to improve the education system but policy reforms such
as implementation of nine years schooling would also serve to achieve more equitable education
results so that the population at large contributes to and benefits from growing opportunities.
However, efforts on this front have a high political cost and will likely pay off only in the long
term. Yet, a new education system that raises quality and equity would not only help to push the
country to a new development path but also break the substantial intergenerational vicious cycle
of poverty that undermines opportunities for much of the bottom 40 percent of the population.
1
Chapter 1. Understanding poverty and vulnerabilities in
Mauritius: Sustaining the middle class4
Main messages – Chapter 1
Absolute poverty in Mauritius is low and has fallen over the last five years, with the national poverty
rate down from 8.5 percent in 2007 to 6.9 percent in 2012.
But poverty levels are higher for female headed households as well as children and youth population.
Education below secondary level is also a major explanation of poverty.
Inequality has increased remarkably and the Gini coefficient after transfers increased from 0.34 to
0.37, slowing down the pace of poverty eradication. As a result, relative poverty has increased from
8.5 percent in 2007 to 9.8 percent in 2012.
Income growth of the bottom 40 percent of the population has been disappointing and increased at an
annual rate of 1.8 percent compared to 3.1 percent for the population at large.
As a result, the middle class has shrunk and is increasingly vulnerable to falling back into poverty.
The most important driver of poverty reduction is employment, and widening salaries across quintiles
are the main explanation for the surge in inequality.
Social transfers have been instrumental in reducing absolute poverty. Without social transfers
absolute poverty would be 16.4 percent in 2012 instead of the actual rate of 6.9 percent, after social
transfers.
Microsimulation exercise suggests that poverty is expected to fall in the coming years, but inequality
will increase. Poverty eradication and providing opportunities to gain and retain middle class status will require
accelerating economic growth and a more inclusive growth path. These will require that the bottom
40 percent of the population has adequate assets and skills to benefit from growing employment
opportunities.
1.1. Overview: Poverty, shared prosperity and the middle class in Mauritius
Reductions in poverty have slowed down due to growing inequality
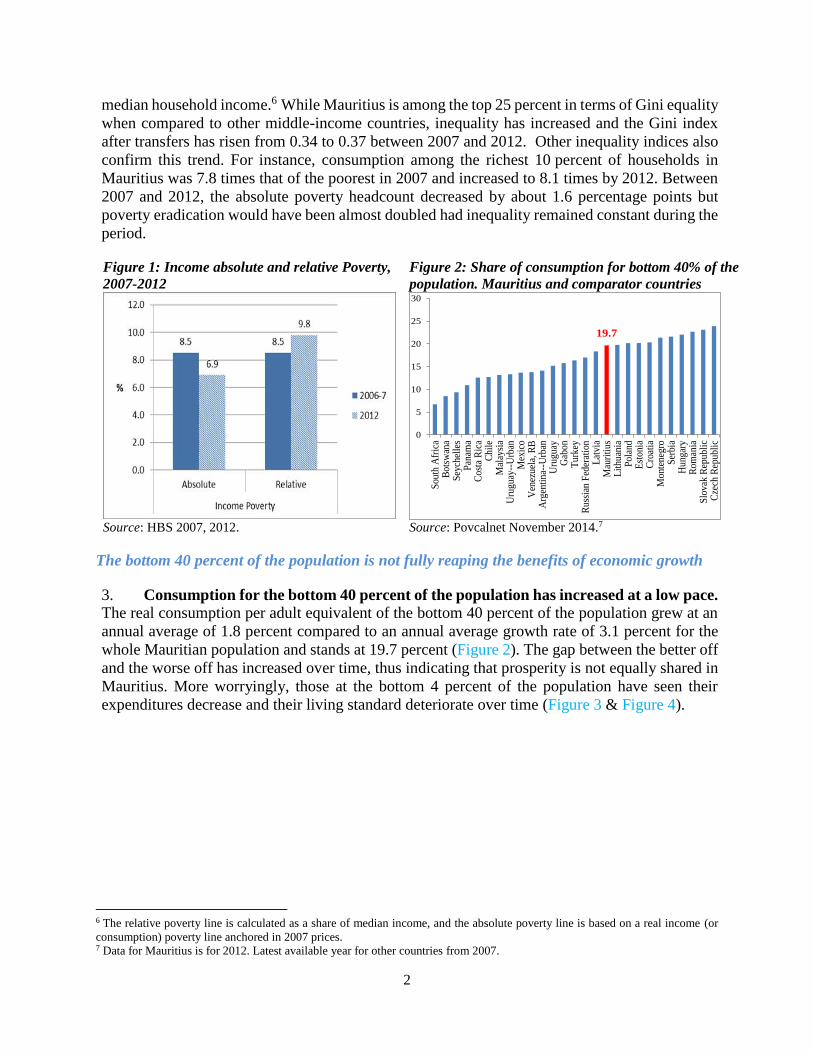
1. Absolute poverty is low in Mauritius and recent economic growth has further reduced
it. Mauritius is a relatively developed economy with no people living on less than USD1.25 a day
and less than 1 percent of the population living below USD2 a day. According to national statistics,
absolute poverty5 has declined from 8.5 percent of the population in 2007 to 6.9 percent in 2012
(Figure 1). This is associated mainly with stable and relatively strong economic growth
experienced over the past few years. The total number of poor individuals has also declined from
108,000 people in 2007 to 89,000 people in 2012.
2. Growing income inequality has increased relative poverty and slowed down poverty
eradication. In relative terms, poverty has increased from 8.5 percent in 2007 to 9.8 percent in
2012. This is associated with an increase in income disparity between those above and below the
4 This chapter draws primarily on the on-going work “Mauritius: Inclusiveness of growth and shared prosperity,” World Bank
(2014). The work is based on the two most recent household surveys – 2012 and 2007. 5 Absolute poverty is defined as household living with less than 3,064 rupee per adult equivalent expressed in 2007 prices.
2
median household income.6 While Mauritius is among the top 25 percent in terms of Gini equality
when compared to other middle-income countries, inequality has increased and the Gini index
after transfers has risen from 0.34 to 0.37 between 2007 and 2012. Other inequality indices also
confirm this trend. For instance, consumption among the richest 10 percent of households in
Mauritius was 7.8 times that of the poorest in 2007 and increased to 8.1 times by 2012. Between
2007 and 2012, the absolute poverty headcount decreased by about 1.6 percentage points but
poverty eradication would have been almost doubled had inequality remained constant during the
period.
Figure 1: Income absolute and relative Poverty,
2007-2012
Source: HBS 2007, 2012.
Figure 2: Share of consumption for bottom 40% of the
population. Mauritius and comparator countries
Source: Povcalnet November 2014.7
The bottom 40 percent of the population is not fully reaping the benefits of economic growth
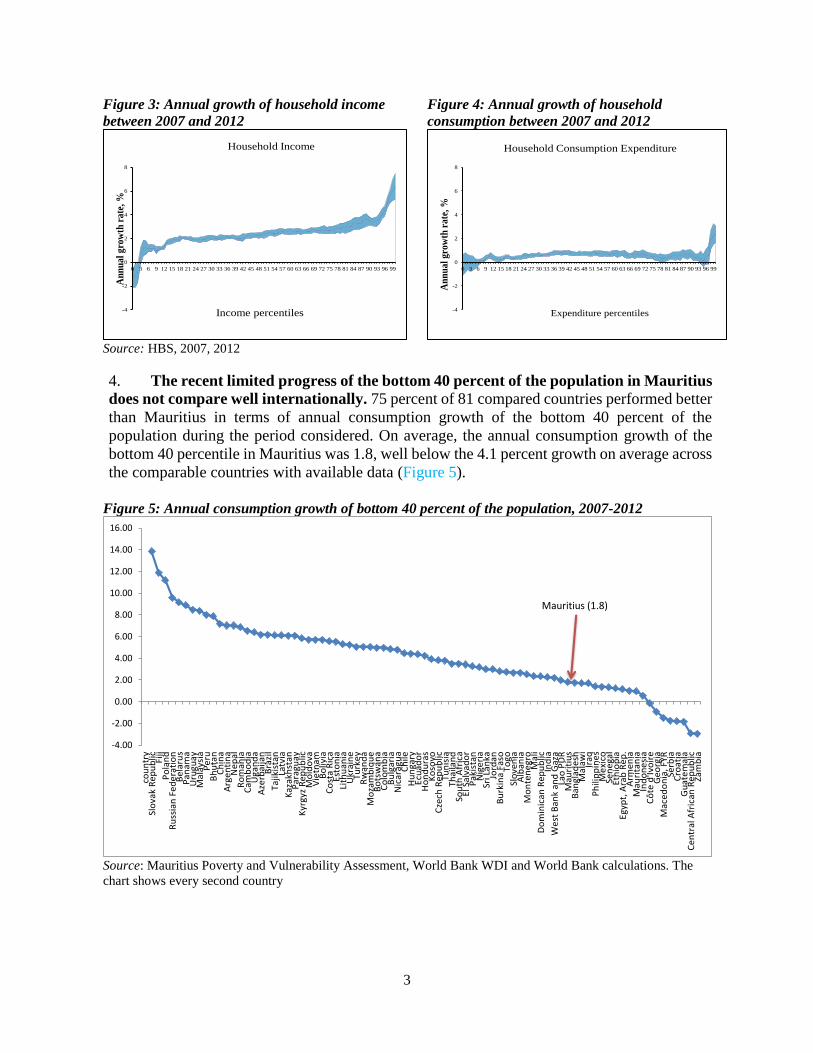
3. Consumption for the bottom 40 percent of the population has increased at a low pace. The real consumption per adult equivalent of the bottom 40 percent of the population grew at an
annual average of 1.8 percent compared to an annual average growth rate of 3.1 percent for the
whole Mauritian population and stands at 19.7 percent (Figure 2). The gap between the better off
and the worse off has increased over time, thus indicating that prosperity is not equally shared in
Mauritius. More worryingly, those at the bottom 4 percent of the population have seen their
expenditures decrease and their living standard deteriorate over time (Figure 3 & Figure 4).
6 The relative poverty line is calculated as a share of median income, and the absolute poverty line is based on a real income (or
consumption) poverty line anchored in 2007 prices. 7 Data for Mauritius is for 2012. Latest available year for other countries from 2007.
19.7
0
5
10
15
20
25
30
Sou
th A
fric
aB
otsw
ana
Sey
chel
les
Pan
ama
Cos
ta R
ica
Chi
leM
alay
sia
Uru
guay
--U
rban
Mex
ico
Ven
ezue
la, R
BA
rgen
tina
--U
rban
Uru
guay
Gab
onT
urke
yR
ussi
an F
eder
atio
nL
atvi
aM
auri
tius
Lit
huan
iaP
olan
dE
ston
iaC
roat
iaM
onte
negr
oS
erbi
aH
unga
ryR
oman
iaS
lova
k R
epub
lic
Cze
ch R
epub
lic
3
Figure 3: Annual growth of household income
between 2007 and 2012
Figure 4: Annual growth of household
consumption between 2007 and 2012
Source: HBS, 2007, 2012
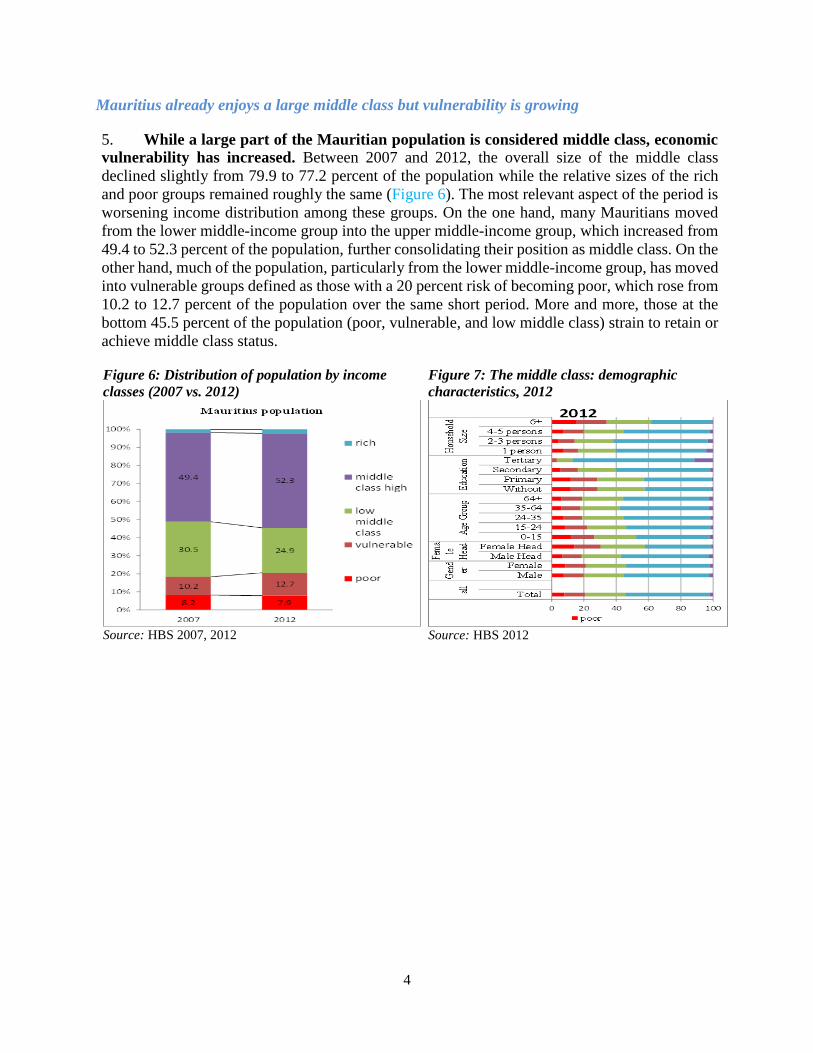
4. The recent limited progress of the bottom 40 percent of the population in Mauritius
does not compare well internationally. 75 percent of 81 compared countries performed better
than Mauritius in terms of annual consumption growth of the bottom 40 percent of the
population during the period considered. On average, the annual consumption growth of the
bottom 40 percentile in Mauritius was 1.8, well below the 4.1 percent growth on average across
the comparable countries with available data (Figure 5).
Figure 5: Annual consumption growth of bottom 40 percent of the population, 2007-2012
Source: Mauritius Poverty and Vulnerability Assessment, World Bank WDI and World Bank calculations. The
chart shows every second country
-4
-2
0
2
4
6
8
0 3 6 9 12 15 18 21 24 27 30 33 36 39 42 45 48 51 54 57 60 63 66 69 72 75 78 81 84 87 90 93 96 99
An
nu
al
gro
wth
ra
te, %
Income percentiles
Household Income
-4
-2
0
2
4
6
8
0 3 6 9 12 15 18 21 24 27 30 33 36 39 42 45 48 51 54 57 60 63 66 69 72 75 78 81 84 87 90 93 96 99
An
nu
al
gro
wth
ra
te, %
Expenditure percentiles
Household Consumption Expenditure
-4.00
-2.00
0.00
2.00
4.00
6.00
8.00
10.00
12.00
14.00
16.00
cou
ntr
ySl
ova
k R
ep
ub
lic Fiji
Po
lan
dR
uss
ian
Fe
de
rati
on
Be
laru
sP
anam
aU
rugu
ayM
alay
sia
Pe
ruB
hu
tan
Ch
ina
Arg
en
tin
aN
ep
alR
om
ania
Cam
bo
dia
Uga
nd
aA
zerb
aija
nB
razi
lT
ajik
ista
nLa
tvia
Kaz
akh
stan
Par
agu
ayK
yrgy
z R
ep
ub
licM
old
ova
Vie
tnam
Bo
livia
Co
sta
Ric
aE
sto
nia
Lith
uan
iaU
krai
ne
Tu
rke
yR
wan
da
Mo
zam
biq
ue
Bo
tsw
ana
Co
lom
bia
Bu
lgar
iaN
icar
agu
aC
hile
Hu
nga
ryEc
uad
or
Ho
nd
ura
sK
oso
voC
zech
Re
pu
blic
Tu
nis
iaT
hai
lan
dSo
uth
Afr
ica
El S
alva
do
rP
akis
tan
Nig
eri
aSr
i Lan
kaJo
rdan
Bu
rkin
a Fa
soT
ogo
Slo
ven
iaA
lban
iaM
on
ten
egr
oM
ali
Do
min
ican
Re
pu
blic
Ind
iaW
est
Ban
k an
d G
aza
Lao
PD
RM
auri
tiu
sB
angl
ade
shM
alaw
iIr
aqP
hili
pp
ine
sM
exi
coSe
ne
gal
Eth
iop
iaE
gyp
t, A
rab
Re
p.
Arm
en
iaM
auri
tan
iaIn
do
ne
sia
Cô
te d
'Ivo
ire
Ge
org
iaM
ace
do
nia
, FY
RSe
rbia
Cro
atia
Gu
ate
mal
aC
en
tral
Afr
ican
Re
pu
blic
Zam
bia
Mauritius (1.8)
4
Mauritius already enjoys a large middle class but vulnerability is growing
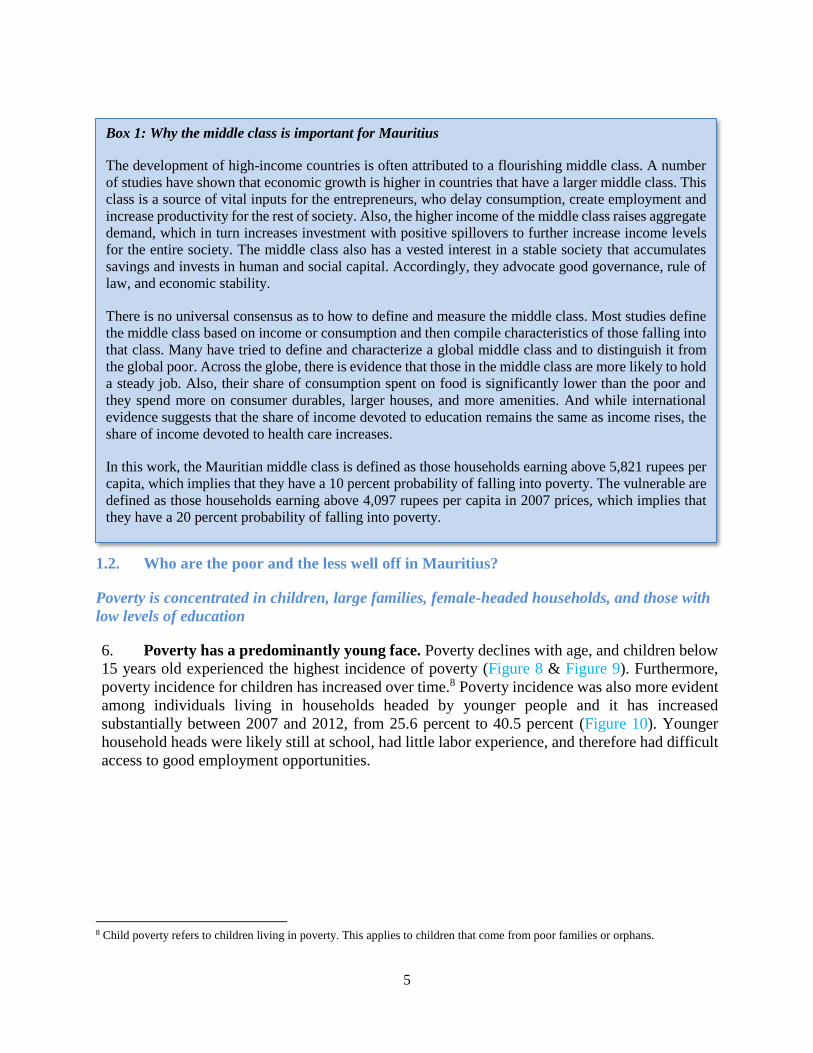
5. While a large part of the Mauritian population is considered middle class, economic
vulnerability has increased. Between 2007 and 2012, the overall size of the middle class
declined slightly from 79.9 to 77.2 percent of the population while the relative sizes of the rich
and poor groups remained roughly the same (Figure 6). The most relevant aspect of the period is
worsening income distribution among these groups. On the one hand, many Mauritians moved
from the lower middle-income group into the upper middle-income group, which increased from
49.4 to 52.3 percent of the population, further consolidating their position as middle class. On the
other hand, much of the population, particularly from the lower middle-income group, has moved
into vulnerable groups defined as those with a 20 percent risk of becoming poor, which rose from
10.2 to 12.7 percent of the population over the same short period. More and more, those at the
bottom 45.5 percent of the population (poor, vulnerable, and low middle class) strain to retain or
achieve middle class status.
Figure 6: Distribution of population by income
classes (2007 vs. 2012)
Source: HBS 2007, 2012
Figure 7: The middle class: demographic
characteristics, 2012
Source: HBS 2012
5
1.2. Who are the poor and the less well off in Mauritius?
Poverty is concentrated in children, large families, female-headed households, and those with
low levels of education
6. Poverty has a predominantly young face. Poverty declines with age, and children below
15 years old experienced the highest incidence of poverty (Figure 8 & Figure 9). Furthermore,
poverty incidence for children has increased over time.8 Poverty incidence was also more evident
among individuals living in households headed by younger people and it has increased
substantially between 2007 and 2012, from 25.6 percent to 40.5 percent (Figure 10). Younger
household heads were likely still at school, had little labor experience, and therefore had difficult
access to good employment opportunities.
8 Child poverty refers to children living in poverty. This applies to children that come from poor families or orphans.
Box 1: Why the middle class is important for Mauritius
The development of high-income countries is often attributed to a flourishing middle class. A number
of studies have shown that economic growth is higher in countries that have a larger middle class. This
class is a source of vital inputs for the entrepreneurs, who delay consumption, create employment and
increase productivity for the rest of society. Also, the higher income of the middle class raises aggregate
demand, which in turn increases investment with positive spillovers to further increase income levels
for the entire society. The middle class also has a vested interest in a stable society that accumulates
savings and invests in human and social capital. Accordingly, they advocate good governance, rule of
law, and economic stability.
There is no universal consensus as to how to define and measure the middle class. Most studies define
the middle class based on income or consumption and then compile characteristics of those falling into
that class. Many have tried to define and characterize a global middle class and to distinguish it from
the global poor. Across the globe, there is evidence that those in the middle class are more likely to hold
a steady job. Also, their share of consumption spent on food is significantly lower than the poor and
they spend more on consumer durables, larger houses, and more amenities. And while international
evidence suggests that the share of income devoted to education remains the same as income rises, the
share of income devoted to health care increases.
In this work, the Mauritian middle class is defined as those households earning above 5,821 rupees per
capita, which implies that they have a 10 percent probability of falling into poverty. The vulnerable are
defined as those households earning above 4,097 rupees per capita in 2007 prices, which implies that
they have a 20 percent probability of falling into poverty.

6
Figure 8: Poverty by age group
Source: HBS 2007, 2012
Figure 9: Poverty by age of head
Source: HBS 2007, 2012
7. Bigger households with larger dependency ratios are significantly more likely to be
poor, particularly those living in households with seven or more members. The poor,
compared to the non-poor, lived in bigger households and with a larger number of children, i.e.
they live in households with larger age-dependency ratios. In 2012, poor families had an average
household size of 4.5 persons compared to 4.2 for the overall population. There was also a high
share of poor people in single member households.
8. The incidence of poverty more than doubled among people living in female-headed
households and the gender gap has increased. Poverty was reduced from 7.8 to 5.6 percent
among those living in male-headed households (Figure 10). However, female-headed households
saw an increase in poverty from 13.2 percent in 2007 to 13.6 percent in 2012, increasing the gap
between female and male-headed households. Two factors help explain this growing disparity.
First, while more than 90 percent of male heads of households are married, in female headed
households that figure is only 10 percent and 60 percent of them were widowed. Second, labor
participation rates among females are significantly lower than their male counterparts, which may
further limit their access to labor income.
9. Family structure also has a large and growing influence on the likelihood of being
poor, with the poverty rate in single-parent families higher than that of families with both
parents. 16.5 percent of households headed by single-parent families are poor compared to just
7.8 percent of married-couple families with children. This is more critical for single mothers with
children, of which 19.8 percent of them are poor. Overall, households with young children under
age 6 are more likely to be living in poverty or to be low-income compared to those with children
under age 18. The lowest poverty is observed among full families without children. Young
families headed by 18-24 year olds have higher poverty, but their situation has improved
since 2007.

7
Figure 10: Family composition and income
poverty, 2007, 2012
Source: HBS 2007, 2012
Figure 11: Ethnicity and poverty, 2012
Source: HBS 2007, 2012
10. Growing poverty has not been homogeneous across ethnic groups. Mauritius has four
main ethnic groups: Hindus, Muslims, Sino-Mauritians, and General Population, an official
designation made up African, European, and other ethnicities. In 2012, Hindus constituted the
biggest share of the population (50 percent), followed by General Population (32 percent),
Muslims (17 percent), and Sino-Mauritians (1 percent) (Figure 11). Yet, Sino-Mauritians were
the least poor and improved substantially between 2007 and 2012.9 Hindus and the General
Population became slightly poorer over time and contributed most to the share of poverty.
Between 2007 and 2012, the relevance of ethnic background between the three biggest ethnic
groups to determine income and poverty has become less significant, although the gap of all the
three ethnic groups with the Sino Mauritians has widened.
11. Poverty is concentrated among those households whose head had less than secondary
education. Having a head of household with only primary school completed was not statistically
different from living with an uneducated head of household. This is particularly relevant as around
half of all households have a head with less than secondary education. Education only mattered
for poverty reduction from secondary level and above. On the one hand, of people living with
heads of household with no education, 33 percent were part of the poorest quintile while only 5
percent were part of the top quintile (Figure 12). On the other hand, of people living with heads
of household who managed to complete the tertiary education level, 83 percent were part of the
richest quintile. Among people living with university educated heads there was no poverty.
12. Poverty is associated with higher unemployment and lower labor force participation. The labor market participation rate tended to increase with income and so did the employment
rate. For the poorest 10 percent or decile, the participation rate was 46 percent among males and
9 The relatively better living standards of the Sino-Mauritians may be explained by their educational attainment and labor market
prospects. Sino-Mauritians had the highest share of people with secondary and tertiary education, and few had no education. They
also had the highest proportion of people employed, with the highest share in managerial and professional occupations. These
characteristics have put Sino-Mauritians in an advantageous position to better benefit from the effects of economic growth. As
expected, median monthly earnings among this population group were the highest and observed the largest percentage increase
over time.
0
5
10
15
20
25
30
Fu
ll f
amil
y n
o c
hil
dre
n
Fu
ll f
amil
y +
ch
ild
ren
0-1
8
Fu
ll f
amil
y +
ch
ild
ren
0-6
Yo
uth
(H
ead
18
-24
y.o
.)
Sin
gle
par
ent
Sin
gle
fem
ale
+ c
hil
dre
n
Mal
e h
eaded
hou
seh
old
Fem
ale
hea
ded
hou
seh
old
Family structure Gender Head
Ab
solu
te p
ov
erty
2007 2012
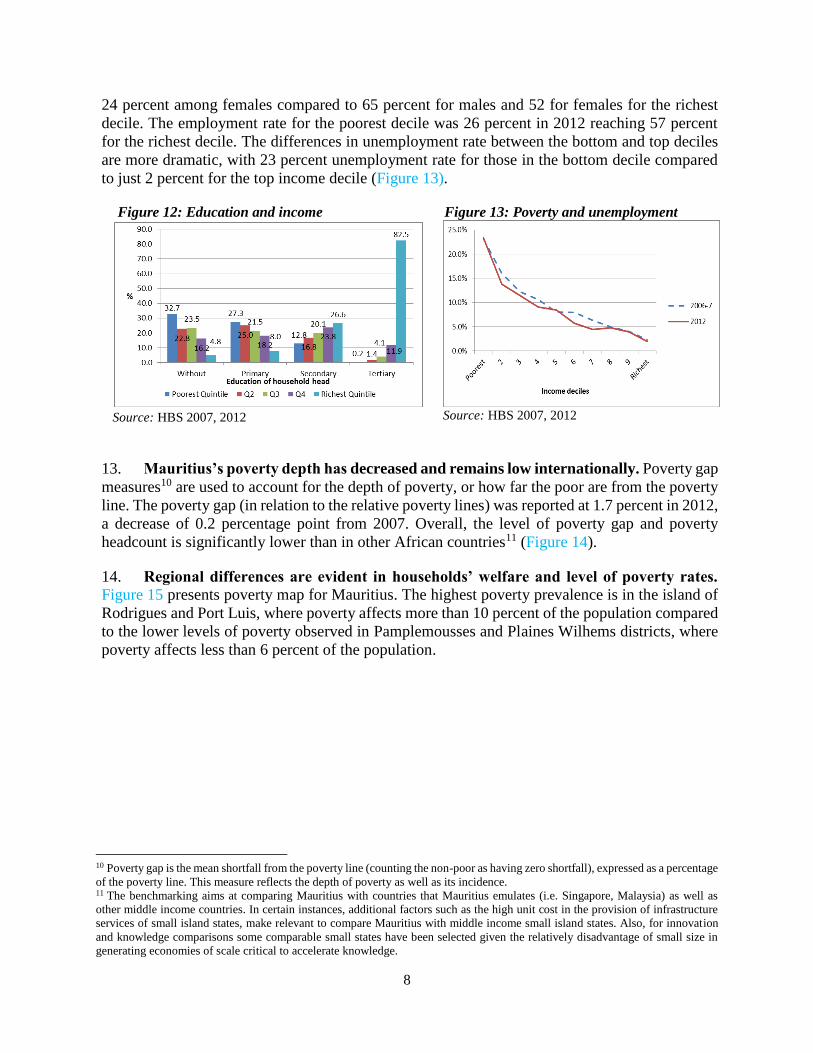
8
24 percent among females compared to 65 percent for males and 52 for females for the richest
decile. The employment rate for the poorest decile was 26 percent in 2012 reaching 57 percent
for the richest decile. The differences in unemployment rate between the bottom and top deciles
are more dramatic, with 23 percent unemployment rate for those in the bottom decile compared
to just 2 percent for the top income decile (Figure 13).
Figure 12: Education and income
Source: HBS 2007, 2012
Figure 13: Poverty and unemployment
Source: HBS 2007, 2012
13. Mauritius’s poverty depth has decreased and remains low internationally. Poverty gap
measures10 are used to account for the depth of poverty, or how far the poor are from the poverty
line. The poverty gap (in relation to the relative poverty lines) was reported at 1.7 percent in 2012,
a decrease of 0.2 percentage point from 2007. Overall, the level of poverty gap and poverty
headcount is significantly lower than in other African countries11 (Figure 14).
14. Regional differences are evident in households’ welfare and level of poverty rates. Figure 15 presents poverty map for Mauritius. The highest poverty prevalence is in the island of
Rodrigues and Port Luis, where poverty affects more than 10 percent of the population compared
to the lower levels of poverty observed in Pamplemousses and Plaines Wilhems districts, where
poverty affects less than 6 percent of the population.
10 Poverty gap is the mean shortfall from the poverty line (counting the non-poor as having zero shortfall), expressed as a percentage
of the poverty line. This measure reflects the depth of poverty as well as its incidence. 11 The benchmarking aims at comparing Mauritius with countries that Mauritius emulates (i.e. Singapore, Malaysia) as well as
other middle income countries. In certain instances, additional factors such as the high unit cost in the provision of infrastructure
services of small island states, make relevant to compare Mauritius with middle income small island states. Also, for innovation
and knowledge comparisons some comparable small states have been selected given the relatively disadvantage of small size in
generating economies of scale critical to accelerate knowledge.
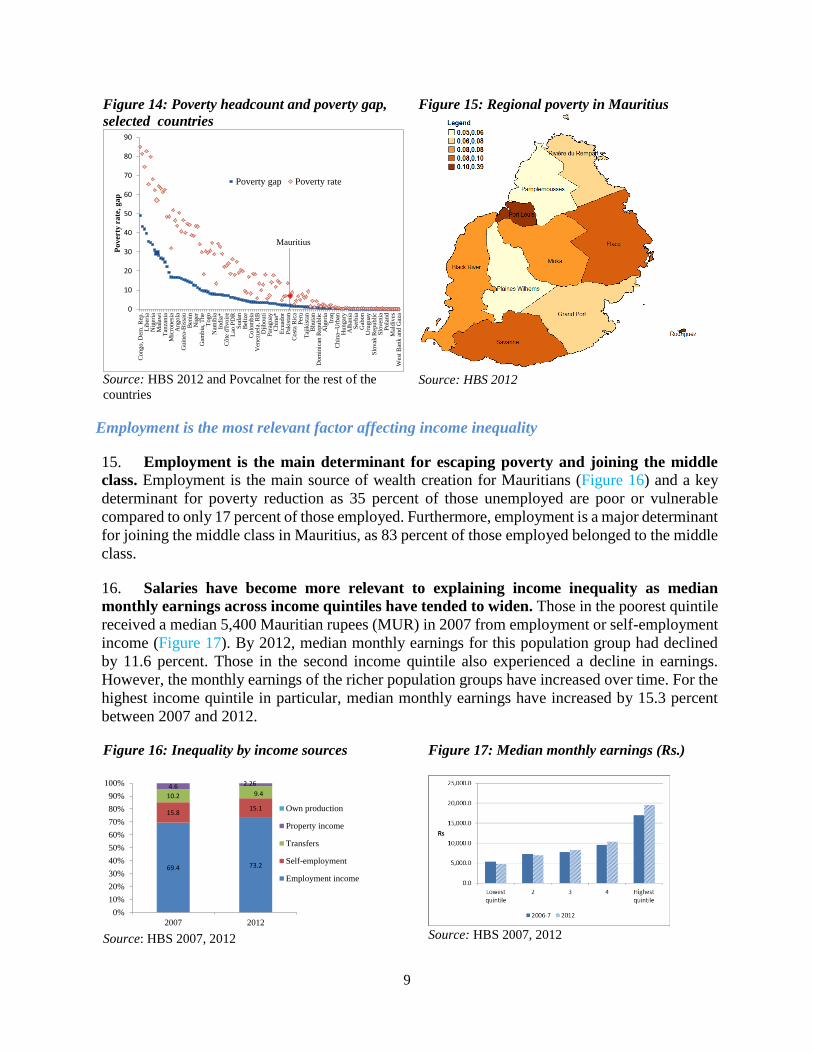
9
Figure 14: Poverty headcount and poverty gap,
selected countries
Source: HBS 2012 and Povcalnet for the rest of the
countries
Figure 15: Regional poverty in Mauritius
Source: HBS 2012
Employment is the most relevant factor affecting income inequality
15. Employment is the main determinant for escaping poverty and joining the middle
class. Employment is the main source of wealth creation for Mauritians (Figure 16) and a key
determinant for poverty reduction as 35 percent of those unemployed are poor or vulnerable
compared to only 17 percent of those employed. Furthermore, employment is a major determinant
for joining the middle class in Mauritius, as 83 percent of those employed belonged to the middle
class.
16. Salaries have become more relevant to explaining income inequality as median
monthly earnings across income quintiles have tended to widen. Those in the poorest quintile
received a median 5,400 Mauritian rupees (MUR) in 2007 from employment or self-employment
income (Figure 17). By 2012, median monthly earnings for this population group had declined
by 11.6 percent. Those in the second income quintile also experienced a decline in earnings.
However, the monthly earnings of the richer population groups have increased over time. For the
highest income quintile in particular, median monthly earnings have increased by 15.3 percent
between 2007 and 2012.
Figure 16: Inequality by income sources
Source: HBS 2007, 2012
Figure 17: Median monthly earnings (Rs.)
Source: HBS 2007, 2012
0
10
20
30
40
50
60
70
80
90C
ongo
, D
em. R
ep.
Lib
eria
Nig
eria
Mal
awi
Tan
zania
Mic
rones
iaA
ng
ola
Guin
ea-B
issa
uB
enin
Nig
erG
ambia
, T
he
Togo
Nam
ibia
India
*C
ôte
d'I
vo
ire
Lao
PD
RS
ud
anB
eliz
eC
olo
mbia
Ven
ezu
ela,
RB
Dji
bouti
Par
aguay
Ch
ina*
Ecu
ador
Pak
ista
nC
ost
a R
ica
Per
uT
ajik
ista
nB
huta
nD
om
inic
an R
epu
bli
cA
lger
iaIr
aqC
hin
a--U
rban
Hun
gar
yA
lban
iaS
erbia
Gab
on
Uru
guay
Slo
vak
Rep
ubli
cS
loven
iaP
ola
nd
Mal
div
esW
est
Ban
k a
nd G
aza
Po
ver
ty r
ate
, g
ap
Poverty gap Poverty rate
Mauritius
69.4 73.2
15.815.1
10.2 9.44.6 2.26
0%
10%
20%
30%
40%
50%
60%
70%
80%
90%
100%
2007 2012
Own production
Property income
Transfers
Self-employment
Employment income

10
17. Being employed in growing sectors of the economy is also key to gaining middle class
status. While 84 percent of those working in services are middle class, only 75 percent of those
employed in agriculture or related services are in the middle class. Of those employed in
agriculture, 25 percent were either poor or vulnerable, compared to only 12 percent of those in
services. Those employed in trade had the largest increases out of poverty and into the upper
middle classes between 2007 and 2012.
18. Overall, government transfers made an important contribution to inclusive growth
in 2012. Existing social insurance and social assistance schemes have managed to decrease the
poverty headcount in 2012 from 16.4 percent (without transfers) to 6.9 percent of the population
(after transfers). Also, the poverty gap in 2012 was reduced from 6.5 percent (without transfers)
to its actual rate of 1.7 (after transfers). It has also helped to mitigate the Gini coefficient from
0.41 that would exist in Mauritius in 2012 if no public transfer would be considered to its actual
0.37 after transfers. These social protections accounted for 18.4 percent of consumption for the
bottom quintile and 2.1 percent for the top quintile.
19. Demographic factors also played an important role in reducing poverty. As a result of
declining fertility, the average household size has been reduced between 2012 and 2007, primarily
in poor households. Subsequently, the dependency ratio for children and elderly fell from 48
percent to 44 percent. This by itself explains around 0.2 percentage points of the poverty reduction
between 2007 and 2012. Certain changes in the size and composition of the middle class over the
five-year period considered also seem to be due to structural factors such as smaller families,
aging of the population, and increased educational levels, or unemployment.
20. Other external factors, such as impact of international food prices, have affected the
poor. More than half of total consumption of poor households is food consumption, a share that
has increased between 2007 and 2012 (Figure 18). This increase, especially among the poor, is
associated with high food price inflation, which increased by 2.3 percent between 2007 and 2012,
approximately 8 percent above the average increase in the CPI (Figure 19). The poor remain
sensitive to food price shocks, as they are less able to scale down or substitute their food
consumption.
Figure 18: Consumption share, poor vs. non-
poor, 2012
Source: HBS 2012
Figure 19: Increase in consumption share poor
vs. non-poor, 2007-2012
Source: HBS 2007, 2012
0
10
20
30
40
50
60
Non-Poor Poor
-1.5
-1.0
-0.5
0.0
0.5
1.0
1.5
2.0
2.5
Non-poor Poor

11
1.3. Looking ahead: how to tackle poverty while increasing the middle class
21. Rapid poverty reduction requires more growth and a more pro-poor pattern of
growth. Mauritius has one of the highest elasticities of poverty to consumption expenditures in
Africa,12 meaning that a relatively high proportion of the population is located close to the poverty
line and consumption growth rates translate into high poverty reduction (Figure 20 & Figure 21).
Economic growth, however, is not sufficient to eradicate poverty in Mauritius. Inequality reducing
polices in conjunction with fast economic growth would accelerate poverty reduction in Mauritius.
Thus, a consumption growth rate of 4 percent per annum would take between 7 to 9 years to halve
poverty, assuming no change in the distribution of aggregate consumption. However should
inequality increase as it has in the recent past, it will take close to 15 years to halve poverty. In a
positive scenario, halving the poverty could be achieved in a 4-year period if the growth is
associated with a 2 percentage point reduction in the Gini coefficient.
22. A substantial share of households are vulnerable should broadly-shared economic
growth slows down. The high poverty to consumption expenditures elasticity in Mauritius means
that relatively small adverse changes in consumption growth may also have a strong impact on
poverty. The majority of households which have escaped poverty remain vulnerable and are at
risk of falling back into it. Also, while the upper middle class has grown to reach 55 percent of
the total population, the low middle class is struggling to retain its status and some of them are
falling back into the vulnerable group. Ensuring that the progress achieved in poverty reduction
and creating a middle class is not reversed will require unlocking the potential to accelerate
economic growth. This will need to be complemented with policies to ensure that the bottom 45.5
percent of the population – the poor, the vulnerable and the low middle class, not only contribute
more to economic growth but also benefits further of it.
Figure 20: Elasticity of poverty rate to per capita
consumption growth
Source: WB calculations. Latest survey for each SACU
country
Figure 21: Sensitivity of poverty rate to the
choice of poverty line
12 Overall, Africa-wide $2.0 a day elasticity is less than 1, well below Mauritius elasticity. See Rati Ram, 2012 “Income elasticity
of poverty in developing countries: updated estimates from new data” Applied Economics Letters, volume 20, Issue 6, pages 554-
558.
-3.05
-2.12-1.85 -1.77
-1.38
-0.82
-3.7
-2.3
-1.3
1.3
2.5
5.4
-20% -10% -5% +5% +10% +20%
Decrease in poverty line Increase in poverty line
Cha
nge
in p
over
ty r
ate
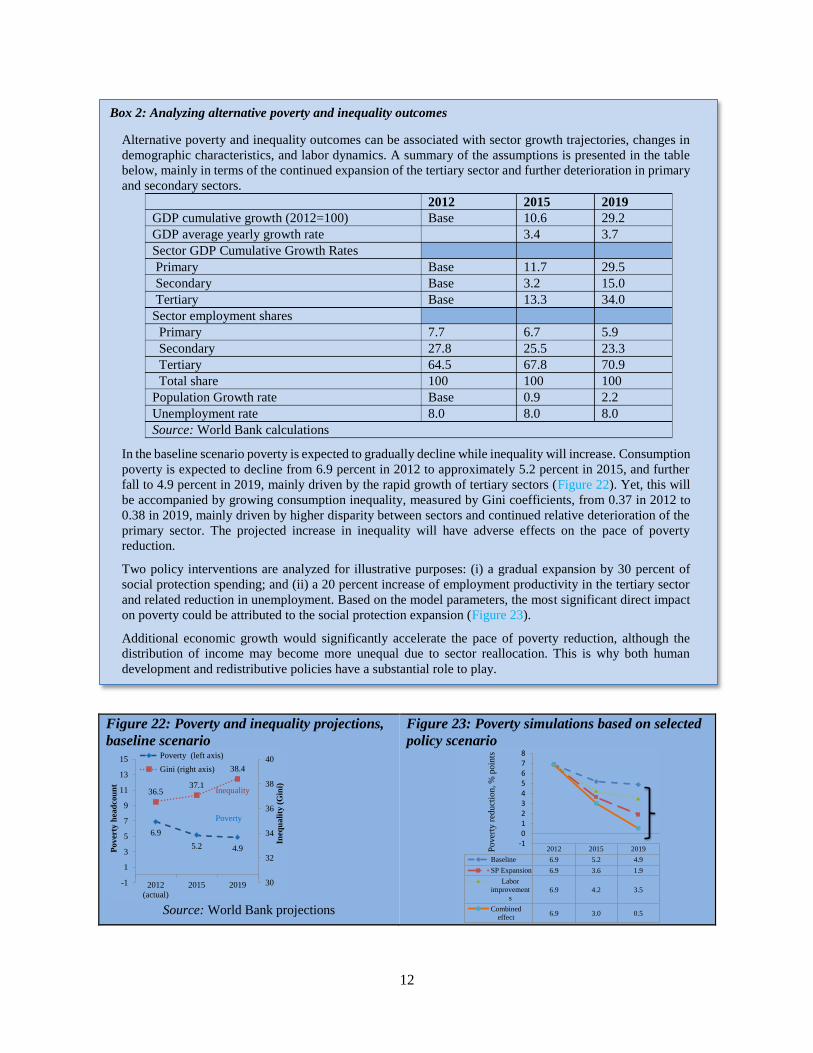
12
Figure 22: Poverty and inequality projections,
baseline scenario
Source: World Bank projections
Figure 23: Poverty simulations based on selected
policy scenario
6.9
5.2 4.9
36.537.1
38.4
30
32
34
36
38
40
-1
1
3
5
7
9
11
13
15
2012
(actual)
2015 2019
Ineq
ua
lity
(G
ini)
Po
ver
ty h
ead
cou
nt
Poverty (left axis)
Gini (right axis)
Poverty
Inequality
2012 2015 2019
Baseline 6.9 5.2 4.9
SP Expansion 6.9 3.6 1.9
Labor
improvement
s6.9 4.2 3.5
Combined
effect6.9 3.0 0.5
-1012345678
Po
ver
ty r
edu
ctio
n, %
po
ints
Box 2: Analyzing alternative poverty and inequality outcomes
Alternative poverty and inequality outcomes can be associated with sector growth trajectories, changes in
demographic characteristics, and labor dynamics. A summary of the assumptions is presented in the table
below, mainly in terms of the continued expansion of the tertiary sector and further deterioration in primary
and secondary sectors.
2012 2015 2019 GDP cumulative growth (2012=100) Base 10.6 29.2 GDP average yearly growth rate 3.4 3.7 Sector GDP Cumulative Growth Rates Primary Base 11.7 29.5 Secondary Base 3.2 15.0 Tertiary Base 13.3 34.0 Sector employment shares Primary 7.7 6.7 5.9 Secondary 27.8 25.5 23.3 Tertiary 64.5 67.8 70.9 Total share 100 100 100 Population Growth rate Base 0.9 2.2 Unemployment rate 8.0 8.0 8.0 Source: World Bank calculations
In the baseline scenario poverty is expected to gradually decline while inequality will increase. Consumption
poverty is expected to decline from 6.9 percent in 2012 to approximately 5.2 percent in 2015, and further
fall to 4.9 percent in 2019, mainly driven by the rapid growth of tertiary sectors (Figure 22). Yet, this will
be accompanied by growing consumption inequality, measured by Gini coefficients, from 0.37 in 2012 to
0.38 in 2019, mainly driven by higher disparity between sectors and continued relative deterioration of the
primary sector. The projected increase in inequality will have adverse effects on the pace of poverty
reduction.
Two policy interventions are analyzed for illustrative purposes: (i) a gradual expansion by 30 percent of
social protection spending; and (ii) a 20 percent increase of employment productivity in the tertiary sector
and related reduction in unemployment. Based on the model parameters, the most significant direct impact
on poverty could be attributed to the social protection expansion (Figure 23).
Additional economic growth would significantly accelerate the pace of poverty reduction, although the
distribution of income may become more unequal due to sector reallocation. This is why both human
development and redistributive policies have a substantial role to play.
13
Chapter 2. Assessing the drivers of growth in Mauritius
Main messages – Chapter 2
Mauritius has had large and diversified economic growth with the backing of solid institutions and
outward looking industrial policy.
Successful liberalization policies in the 2000s facilitated resource reallocation toward the growing
sectors of the economy.
With the end of preferential access and declining productivity, the economy depended on private
consumption to sustain growth, putting pressure on households’ savings and raising doubts about the
sustainability of the current economic model.
The country innovation capacity is not at par with other upper middle income countries and
therefore, despite growing FDI, there is limited transfer of knowledge.
Skills gaps undermine the effort to move toward more value added sectors Relatively good connectivity can be at risk if management of infrastructure is not improved through
better efficiency in port operations, more open air access and more competition in ICT. New opportunities in the ocean economy can revitalize economic growth and shared prosperity but
will need to be accompanied with sector specific reforms. Slowdown of economic reforms undermine employment creation, especially in low skilled sectors,
including hampering the opportunities of SMEs to grow. 2.1. Mauritius growth model in perspective
A history of robust growth based on solid institutions, a strong social contract and outward
looking industrial policy
23. Mauritius has experienced substantial growth since independence. GDP expanded at
an annual average of 5.3 percent between 1969 and 2013 or 4.4 percent in per-capita terms. Such
rapid growth was made possible by strong institutions created at the time of independence and
practical and successful policies subsequently implemented. Mauritius’ rapid growth in the 1980s
and 1990s was built by industrial policies that shaped the way for economic diversification and
employment creation. At the time of independence, agriculture, mainly sugar cane production,
accounted for more than 22 percent of Mauritius’ GDP; by 2013 economic transformation has
brought it to merely 3 percent, compensated by a boom in manufacturing in the 1980s and the
subsequent development of the services sector.
24. Mauritius’ social contract is behind its successful inclusive economic model. At the
time of independence, ethnic fragmentation, wealth concentration, mono-crop economy, high
population growth and limited land and natural resources weighed heavily against the chances of
the country to develop in a sustainable and equitable way. Mauritius’ social contract was the
response to this complex reality, and in turn it has shaped the development of the country in terms
of wealth creation and shared prosperity. Ethnic tensions were strong and the political system
ensured that all ethnic groups were adequately represented in the National Assembly while the
public sector ensured that no ethnic group was left economically behind. A balance was struck to
guarantee that owners maintained their assets to create wealth while the political system
established a welfare state to redistribute wealth and respond to the needs of the majority of the
population. Furthermore, close public-private dialogue allowed the government to provide the
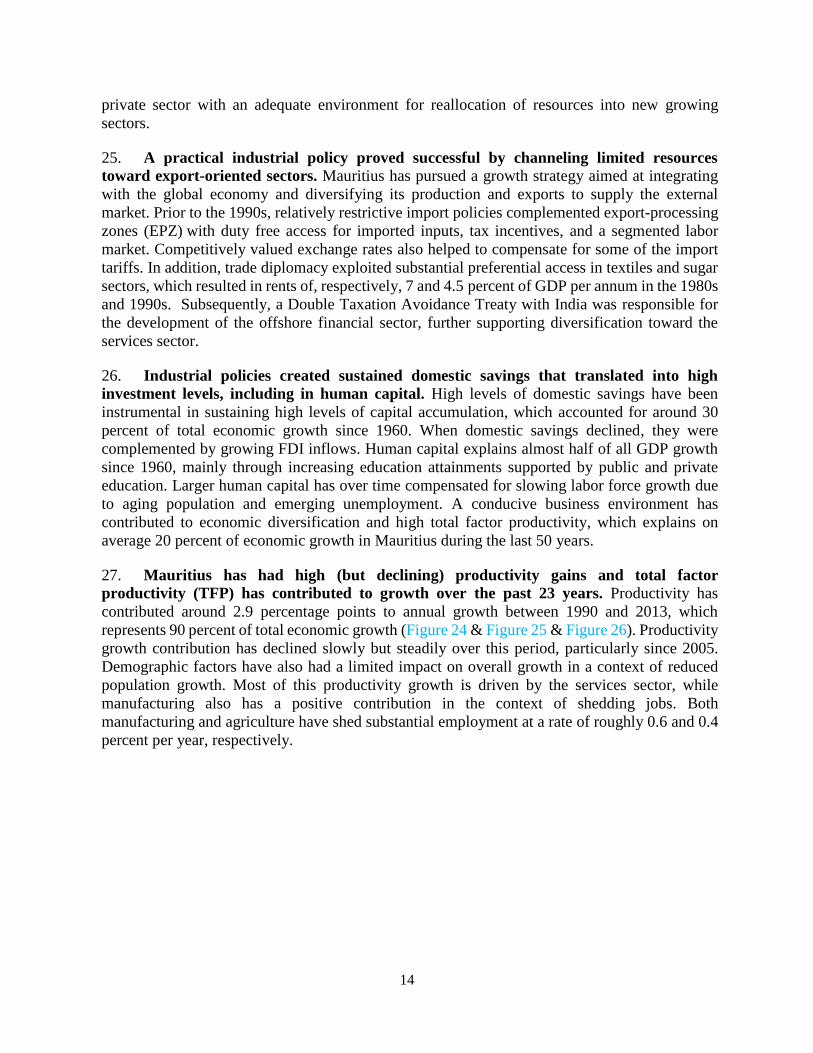
14
private sector with an adequate environment for reallocation of resources into new growing
sectors.
25. A practical industrial policy proved successful by channeling limited resources
toward export-oriented sectors. Mauritius has pursued a growth strategy aimed at integrating
with the global economy and diversifying its production and exports to supply the external
market. Prior to the 1990s, relatively restrictive import policies complemented export-processing
zones (EPZ) with duty free access for imported inputs, tax incentives, and a segmented labor
market. Competitively valued exchange rates also helped to compensate for some of the import
tariffs. In addition, trade diplomacy exploited substantial preferential access in textiles and sugar
sectors, which resulted in rents of, respectively, 7 and 4.5 percent of GDP per annum in the 1980s
and 1990s. Subsequently, a Double Taxation Avoidance Treaty with India was responsible for
the development of the offshore financial sector, further supporting diversification toward the
services sector.
26. Industrial policies created sustained domestic savings that translated into high
investment levels, including in human capital. High levels of domestic savings have been
instrumental in sustaining high levels of capital accumulation, which accounted for around 30
percent of total economic growth since 1960. When domestic savings declined, they were
complemented by growing FDI inflows. Human capital explains almost half of all GDP growth
since 1960, mainly through increasing education attainments supported by public and private
education. Larger human capital has over time compensated for slowing labor force growth due
to aging population and emerging unemployment. A conducive business environment has
contributed to economic diversification and high total factor productivity, which explains on
average 20 percent of economic growth in Mauritius during the last 50 years.
27. Mauritius has had high (but declining) productivity gains and total factor
productivity (TFP) has contributed to growth over the past 23 years. Productivity has
contributed around 2.9 percentage points to annual growth between 1990 and 2013, which
represents 90 percent of total economic growth (Figure 24 & Figure 25 & Figure 26). Productivity
growth contribution has declined slowly but steadily over this period, particularly since 2005.
Demographic factors have also had a limited impact on overall growth in a context of reduced
population growth. Most of this productivity growth is driven by the services sector, while
manufacturing also has a positive contribution in the context of shedding jobs. Both
manufacturing and agriculture have shed substantial employment at a rate of roughly 0.6 and 0.4
percent per year, respectively.
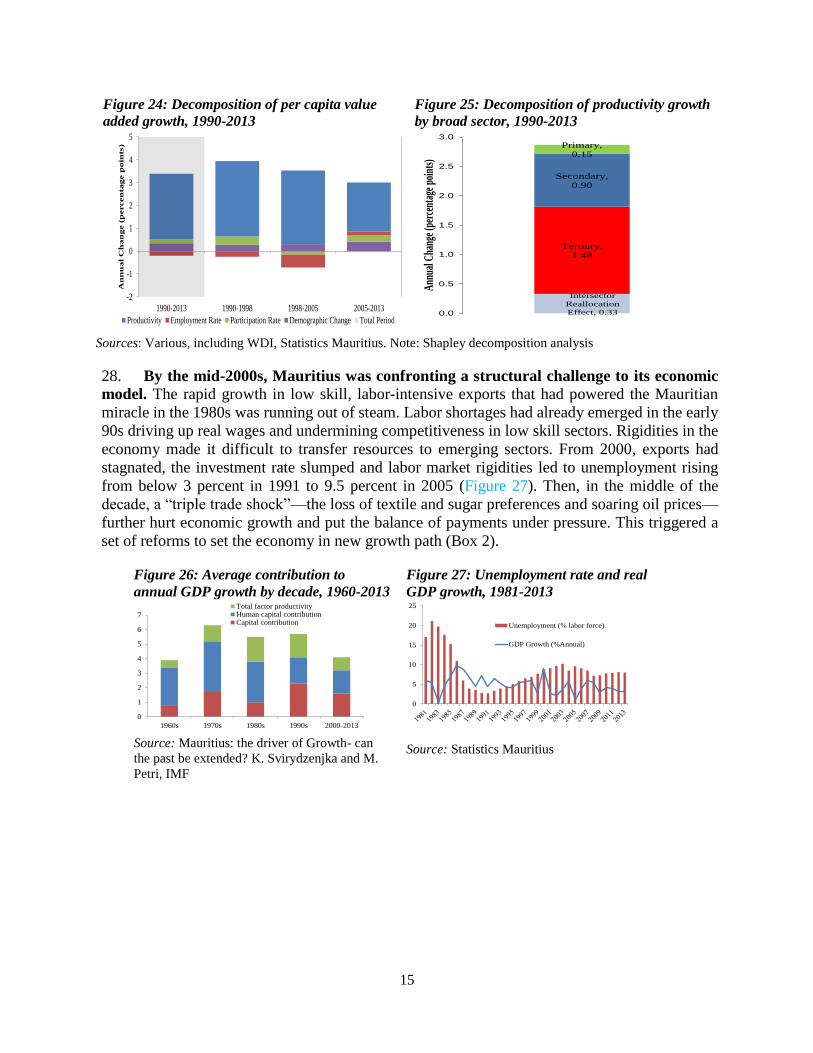
15
Figure 24: Decomposition of per capita value
added growth, 1990-2013
Figure 25: Decomposition of productivity growth
by broad sector, 1990-2013
Sources: Various, including WDI, Statistics Mauritius. Note: Shapley decomposition analysis
28. By the mid-2000s, Mauritius was confronting a structural challenge to its economic
model. The rapid growth in low skill, labor-intensive exports that had powered the Mauritian
miracle in the 1980s was running out of steam. Labor shortages had already emerged in the early
90s driving up real wages and undermining competitiveness in low skill sectors. Rigidities in the
economy made it difficult to transfer resources to emerging sectors. From 2000, exports had
stagnated, the investment rate slumped and labor market rigidities led to unemployment rising
from below 3 percent in 1991 to 9.5 percent in 2005 (Figure 27). Then, in the middle of the
decade, a “triple trade shock”—the loss of textile and sugar preferences and soaring oil prices—
further hurt economic growth and put the balance of payments under pressure. This triggered a
set of reforms to set the economy in new growth path (Box 2).
Figure 26: Average contribution to
annual GDP growth by decade, 1960-2013
Source: Mauritius: the driver of Growth- can
the past be extended? K. Svirydzenjka and M.
Petri, IMF
Figure 27: Unemployment rate and real
GDP growth, 1981-2013
Source: Statistics Mauritius
-2
-1
0
1
2
3
4
5
1990-2013 1990-1998 1998-2005 2005-2013
An
nu
al
Ch
an
ge (
percen
tage p
oin
ts)
Productivity Employment Rate Participation Rate Demographic Change Total Period
Intersector
Reallocation
Effect, 0.33
Tertiary,
1.48
Secondary,
0.90
Primary,
0.15
0.0
0.5
1.0
1.5
2.0
2.5
3.0
Ann
ual C
hang
e (p
erce
ntag
e po
ints
)
0
1
2
3
4
5
6
7
1960s 1970s 1980s 1990s 2000-2013
Total factor productivityHuman capital contributionCapital contribution
0
5
10
15
20
25
Unemployment (% labor force)
GDP Growth (%Annual)
16
A more liberalized economic model to foster higher value economic sectors
29. A sweeping liberalization policy was implemented beginning in 2005. The favorable
tax and regulatory environment that was previously provided exclusively to EPZs was expanded
to the entire economy, opening up the economy to further competition, eliminating distortions,
significantly curtailing custom tariffs and trade barriers, simplifying the tax system with tax rates
set at 15 percent, and simplifying labor and business regulations. In the process, Mauritius
bolstered its credentials as a business friendly economy, leading to increased FDI, reinvigorated
economic growth in high value-added sectors, and lower unemployment. Along with these
structural reforms, the government also dealt with high public deficits and a rising public debt,
removing the medium-term threat to macroeconomic stability. 13 These reforms were also
13 A new Public Debt Management Act enshrined the medium-term sustainability of public finances and as a result, public debt
was reduced from 70 percent in 2005 to 54 percent in 2008.
Box 3: Building consensus to accelerate reforms
The Mauritius institutional setting is prone to building large consensus at times of great need, followed by more “quiet” periods where
policy making is broadly adjusted in a more technocratic way. The last such period of broad reform took place between 2006 and 2010
after the traditional growth engines, which had been declining for some time, came under additional external pressures, such as the
end of the Multi-Fiber Agreement (MFA) for textiles in 2004, the phase-out of the EU-guaranteed price of sugar between 2006 and
2010, and sharp rises in oil and food prices. Not only did GDP growth enter a structural decline but macroeconomic stability was at a
greater risk with increased public debt. Private sector apprehensions were matched by growing social pressures associated with rising
unemployment rates, at a time when increasing public debt made it difficult for the government to postpone a solution.
Mauritius’ political class knew what needed to be done. In fact, the National Long-Term Perspective Study1 started in 1990 with a
goal of opening up and diversifying the economy by moving towards high value-added, skill and knowledge intensive service sectors.
Successive governments moved in that direction but piecemeal reforms did not tackle fundamental and politically complex bottlenecks.
The mounting economic and social pressure and the limited number of financially sustainable alternatives gave a clear political
mandate to a new government to implement a bold package of reforms around four pillars: consolidating fiscal performance and
improving public sector efficiency; enhancing competitiveness; improving the business climate; and widening the circle of opportunity
through participation, social inclusion and sustainability.
Implementation was very successful and brought fundamental improvements to the macroeconomic policy framework and the overall
regulatory environment. Economic growth and employment increased, ensuring that gains were broadly and quickly shared, helping
to consolidate consensus and bring immediate public support around the government’s program. Furthermore, the reforms built
resilience as the economy reoriented toward more competitive sectors and created fiscal space. This was instrumental in cushioning
the impact of the 2008-2010 global crisis, as the private sector was in better shape, and the government could adopt a stimulus package
of about 5 percent of GDP over 2009-10.
Today’s situation is different, which helps to explain the difficulties in mustering consensus to implement a new set of bold reforms.
The issues are less about dealing with a major economic crisis and more about achieving new aspirations, i.e. becoming a high-income
economy in the medium term by bringing the private sector to establish partnerships in existing areas where specific and micro reforms
are urgent and necessary for unlocking efficiencies. This also calls for embracing an innovation approach in sectors where both the
public and private sector need to collaborate closely to elaborate an innovation policy in areas where there is a common agreement on
impact and investment: attracting technology players in e-transactional technology, e-learning, aquaculture, and renewable power
generation.
Yet, the impetus of the previous reforms is still being felt in the economy, and while economic growth is subpar, it is sizeable in the
international context. However, policy makers should not underestimate the brewing social challenges, with a strained middle class
and increasing vulnerabilities. Furthermore, many of the pending reforms will not likely translate into immediate gains and will only
pay off in the medium term, leaving the implementing government to bear all the political costs. These challenges call for a renovated
impetus to cope with the short-term political costs while the reforms bear their fruits.
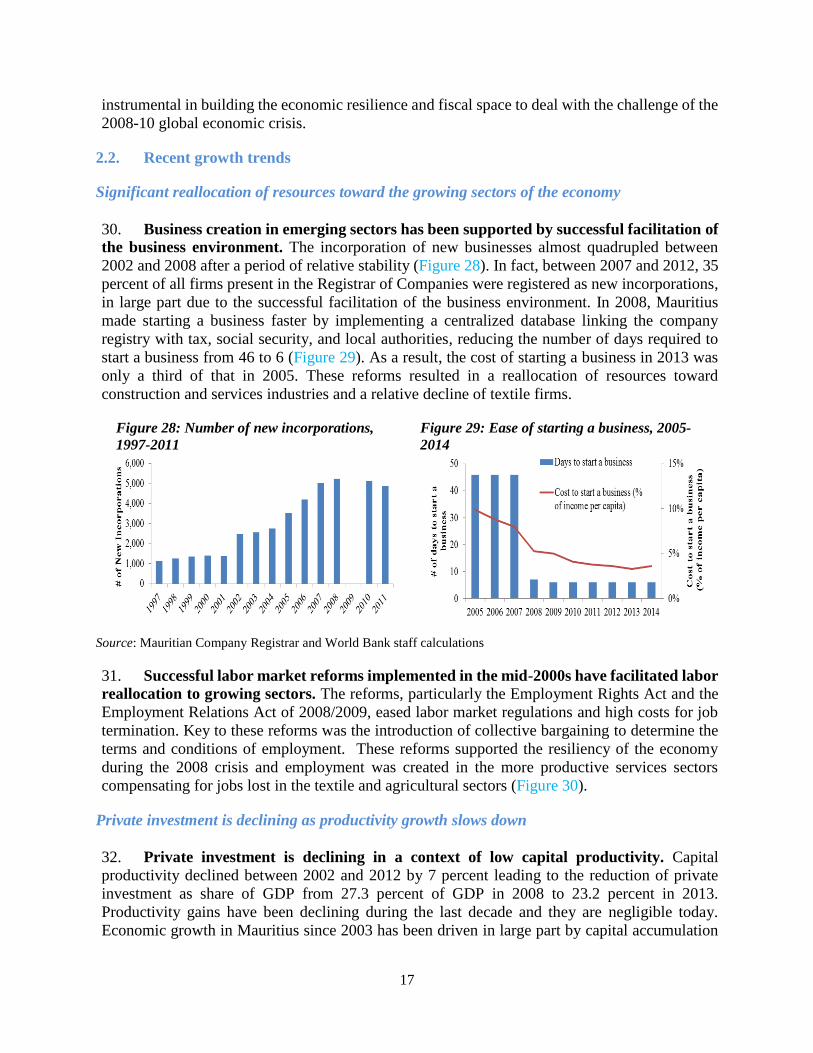
17
instrumental in building the economic resilience and fiscal space to deal with the challenge of the
2008-10 global economic crisis.
2.2. Recent growth trends
Significant reallocation of resources toward the growing sectors of the economy
30. Business creation in emerging sectors has been supported by successful facilitation of
the business environment. The incorporation of new businesses almost quadrupled between
2002 and 2008 after a period of relative stability (Figure 28). In fact, between 2007 and 2012, 35
percent of all firms present in the Registrar of Companies were registered as new incorporations,
in large part due to the successful facilitation of the business environment. In 2008, Mauritius
made starting a business faster by implementing a centralized database linking the company
registry with tax, social security, and local authorities, reducing the number of days required to
start a business from 46 to 6 (Figure 29). As a result, the cost of starting a business in 2013 was
only a third of that in 2005. These reforms resulted in a reallocation of resources toward
construction and services industries and a relative decline of textile firms.
Figure 28: Number of new incorporations,
1997-2011
Figure 29: Ease of starting a business, 2005-
2014
Source: Mauritian Company Registrar and World Bank staff calculations
31. Successful labor market reforms implemented in the mid-2000s have facilitated labor
reallocation to growing sectors. The reforms, particularly the Employment Rights Act and the
Employment Relations Act of 2008/2009, eased labor market regulations and high costs for job
termination. Key to these reforms was the introduction of collective bargaining to determine the
terms and conditions of employment. These reforms supported the resiliency of the economy
during the 2008 crisis and employment was created in the more productive services sectors
compensating for jobs lost in the textile and agricultural sectors (Figure 30).
Private investment is declining as productivity growth slows down
32. Private investment is declining in a context of low capital productivity. Capital
productivity declined between 2002 and 2012 by 7 percent leading to the reduction of private
investment as share of GDP from 27.3 percent of GDP in 2008 to 23.2 percent in 2013.
Productivity gains have been declining during the last decade and they are negligible today.
Economic growth in Mauritius since 2003 has been driven in large part by capital accumulation

18
rather than labor growth. While labor productivity and multifactor productivity contributed
significantly to GDP growth prior to the 2008 global crisis, they have had to compensate for
negative capital productivity since the crisis. Even labor productivity and multifactor productivity
have been trending down and by 2013 they showed no progress, attributing all economic growth
to additional input accumulation, a situation difficult to sustain moving forward (Figure 31).
Figure 30: Employment composition per sector,
2002-2012
Source: Statistics Mauritius
Figure 31: Annual productivity growth in
Mauritius, 2003-2013
Source: Statistics Mauritius, Productivity and
Competitiveness indicators
33. While Mauritius’ business regulatory environment is among the best in the world,
some underperforming areas could be reformed to further cut red tape and stimulate
investment. Most global competitiveness rankings, such as the World Bank Group’s Doing
Business index and the World Economic Forum’s Global Competitiveness Report, recognize
Mauritius as the most business-friendly and competitive economy in Sub-Saharan Africa and
among the best in the world.14 Despite these advantages, Mauritius’ gross investment rate has
slightly declined since 1994, but is on par with the upper middle-income average (Figure 32 &
Figure 33). While the business environment in Mauritius is considered above regional standards
in areas like company registration, paying taxes and cross-border trade, other areas could benefit
from additional reforms such as construction, property registration, and judicial infrastructure.15
Also, strengthening the performance of import and export promotion institutions, as well as
accelerating efforts to strengthen the investment climate, minimizing red tape and promoting
administrative simplification could further support efforts to move towards more innovative
sectors. Furthermore, current efforts to improve the overall business environment may create
marginal gains and the government could further work with the private sector to get feedback
about “micro” constraints at the sector level that hold back much of the investment and
employment potential.
14 In the World Economic Forum’s 2014-15 Global Competitiveness Report Mauritius moved up by six positions to 39th place,
surpassing South Africa and Rwanda. Overall, the country’s relatively strong and transparent public institutions were ranked 36th,
with clear property rights, strong judicial independence, and an efficient government ranked 26th. The World Bank Group’s Doing
Business index ranks Mauritius at the 28th spot, and is the only African economy in the top 30 list of the index. 15 For example, in the area of construction permits, seeking a connection to the wastewater network leads to a waiting list that can
take between 6 and 9 months due to the agency’s “free house connection” policy. Regarding property registration, while efforts to
computerize the registry records have improved processing times, issues relating to valuation along with transaction costs as high
as 10 percent of property value remain bottlenecks for the private sector. Finally, ailing court infrastructure in Mauritius negatively
impacts their efficiency and could benefit from significant improvement and investment, e.g. the e-judiciary system which was
implemented by the Supreme Court’s commercial division but has yet to be implemented widely.
11.5% 7.7%
35.8%
27.8%
52.7%64.5%
0%
10%
20%
30%
40%
50%
60%
70%
80%
90%
100%
2002 2012
Primary Secondary Tertiary
-3
-2
-1
0
1
2
3
4
5
6
2003 2004 2005 2006 2007 2008 2009 2010 2011 2012 2013
labor productivity
capital productivity
Multifactor productivity

19
Figure 32: Gross investment rate, 1994-2012
Source:WBI
Figure 33: Public and private investment,
Mauritius and peer countries, 2007-2011
Source: WB and Statistics Mauritius
A shift to consumption is putting pressure on households savings
34. Growth since the 2008 global economic downturn has been sustained by rising private
consumption. Growth between 2008 and 2013 has averaged 3.5 percent annually, in line with
the world average, and sustained by intense pro-cyclical fiscal and loose monetary policies.
However, since 2010 growth momentum has been waning despite a lower but sustained pro-
cyclical fiscal policy. With the textile, agriculture, construction, and manufacturing sectors facing
significant head winds, growth has been supported by the services sector and consumption (Figure
34 & Figure 35). Net exports have turned even more negative, investment has declined over time,
and household consumption has risen 5.1 percent annually16 compared to a real wages increase
of 2.8 percent (Figure 36). This trend will be difficult to sustain in a context of low wage growth,
weak job creation, lowering savings rates and increasing household debt.
Figure 34: Growth decomposition, 2003-2013
Source: Statistics Mauritius
Figure 35: Consumption and credit: Mauritius
vs. peer countries
Source: WBI
35. High household consumption is behind the falling savings rate. While the declining
savings rate in Mauritius is due to some structural factors, such as the end of the demographic
dividend or reliance on the welfare system, the main driver is likely high household consumption
16 The 5.1 percent increase came over the period 2003-2012. This is 11.2 percent in nominal terms. Overall consumption increased
from 73 percent of GDP to 80 percent of GDP between 2003 and 2013.
0
5
10
15
20
25
30
351994
1995
1996
1997
1998
1999
2000
2001
2002
2003
2004
2005
2006
2007
2008
2009
2010
2011
2012 0
5
10
15
20
25
30
35
40
45
50
Singapore Costa Rica Upper middle income Mauritius
Private Public
73% 80%
8%8%6%6%
17%18%
-6% -12%
-20%
0%
20%
40%
60%
80%
100%
2003-2008 2009-2013
Net Exports Private InvestmentPublic Investment Government Consumption
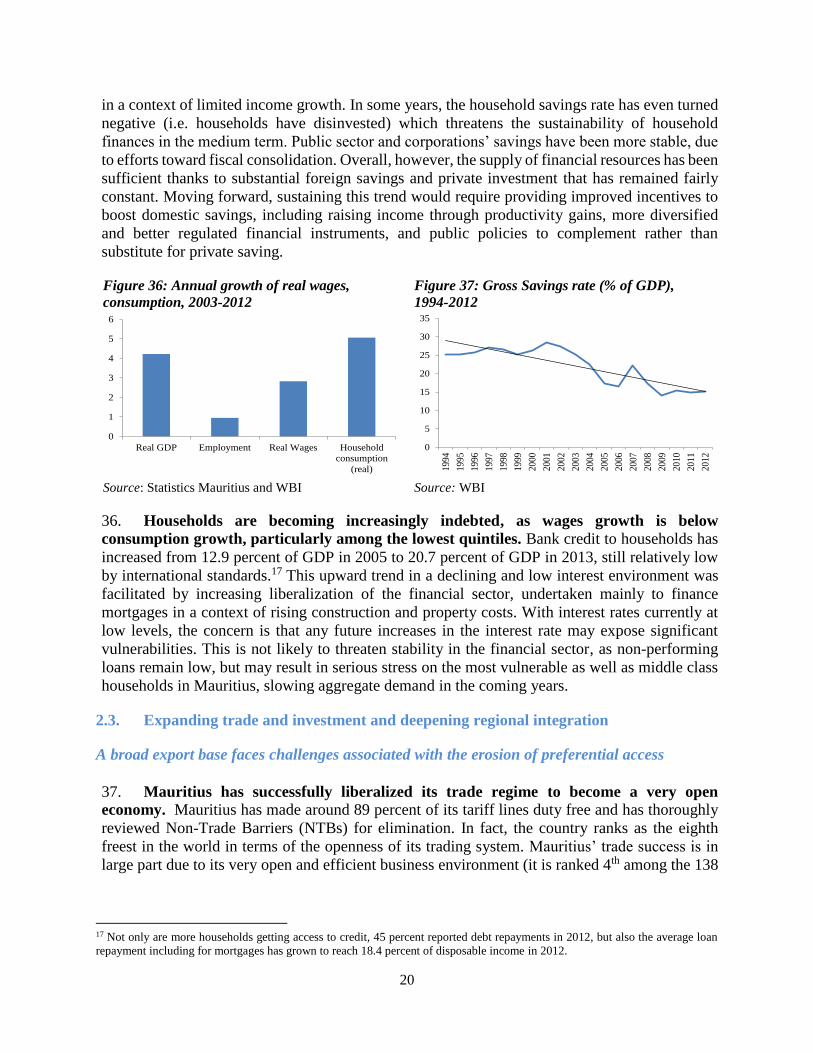
20
in a context of limited income growth. In some years, the household savings rate has even turned
negative (i.e. households have disinvested) which threatens the sustainability of household
finances in the medium term. Public sector and corporations’ savings have been more stable, due
to efforts toward fiscal consolidation. Overall, however, the supply of financial resources has been
sufficient thanks to substantial foreign savings and private investment that has remained fairly
constant. Moving forward, sustaining this trend would require providing improved incentives to
boost domestic savings, including raising income through productivity gains, more diversified
and better regulated financial instruments, and public policies to complement rather than
substitute for private saving.
Figure 36: Annual growth of real wages,
consumption, 2003-2012
Figure 37: Gross Savings rate (% of GDP),
1994-2012
Source: Statistics Mauritius and WBI Source: WBI
36. Households are becoming increasingly indebted, as wages growth is below
consumption growth, particularly among the lowest quintiles. Bank credit to households has
increased from 12.9 percent of GDP in 2005 to 20.7 percent of GDP in 2013, still relatively low
by international standards.17 This upward trend in a declining and low interest environment was
facilitated by increasing liberalization of the financial sector, undertaken mainly to finance
mortgages in a context of rising construction and property costs. With interest rates currently at
low levels, the concern is that any future increases in the interest rate may expose significant
vulnerabilities. This is not likely to threaten stability in the financial sector, as non-performing
loans remain low, but may result in serious stress on the most vulnerable as well as middle class
households in Mauritius, slowing aggregate demand in the coming years.
2.3. Expanding trade and investment and deepening regional integration
A broad export base faces challenges associated with the erosion of preferential access
37. Mauritius has successfully liberalized its trade regime to become a very open
economy. Mauritius has made around 89 percent of its tariff lines duty free and has thoroughly
reviewed Non-Trade Barriers (NTBs) for elimination. In fact, the country ranks as the eighth
freest in the world in terms of the openness of its trading system. Mauritius’ trade success is in
large part due to its very open and efficient business environment (it is ranked 4th among the 138
17 Not only are more households getting access to credit, 45 percent reported debt repayments in 2012, but also the average loan
repayment including for mortgages has grown to reach 18.4 percent of disposable income in 2012.
0
1
2
3
4
5
6
Real GDP Employment Real Wages Household
consumption
(real)
0
5
10
15
20
25
30
35
1994
1995
1996
1997
1998
1999
2000
2001
2002
2003
2004
2005
2006
2007
2008
2009
2010
2011
2012
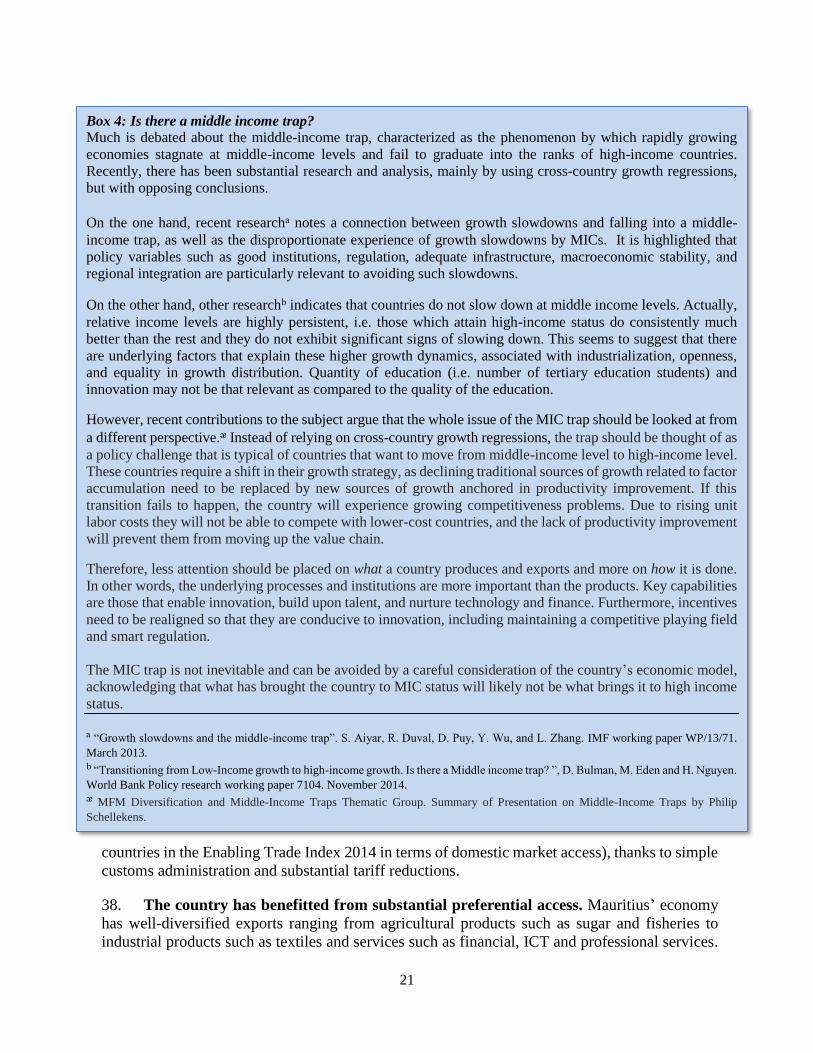
21
countries in the Enabling Trade Index 2014 in terms of domestic market access), thanks to simple
customs administration and substantial tariff reductions.
38. The country has benefitted from substantial preferential access. Mauritius’ economy
has well-diversified exports ranging from agricultural products such as sugar and fisheries to
industrial products such as textiles and services such as financial, ICT and professional services.
Box 4: Is there a middle income trap?
Much is debated about the middle-income trap, characterized as the phenomenon by which rapidly growing
economies stagnate at middle-income levels and fail to graduate into the ranks of high-income countries.
Recently, there has been substantial research and analysis, mainly by using cross-country growth regressions,
but with opposing conclusions.
On the one hand, recent researchᵃ notes a connection between growth slowdowns and falling into a middle-
income trap, as well as the disproportionate experience of growth slowdowns by MICs. It is highlighted that
policy variables such as good institutions, regulation, adequate infrastructure, macroeconomic stability, and
regional integration are particularly relevant to avoiding such slowdowns.
On the other hand, other researchᵇ indicates that countries do not slow down at middle income levels. Actually,
relative income levels are highly persistent, i.e. those which attain high-income status do consistently much
better than the rest and they do not exhibit significant signs of slowing down. This seems to suggest that there
are underlying factors that explain these higher growth dynamics, associated with industrialization, openness,
and equality in growth distribution. Quantity of education (i.e. number of tertiary education students) and
innovation may not be that relevant as compared to the quality of the education.
However, recent contributions to the subject argue that the whole issue of the MIC trap should be looked at from
a different perspective.ᵆ Instead of relying on cross-country growth regressions, the trap should be thought of as
a policy challenge that is typical of countries that want to move from middle-income level to high-income level.
These countries require a shift in their growth strategy, as declining traditional sources of growth related to factor
accumulation need to be replaced by new sources of growth anchored in productivity improvement. If this
transition fails to happen, the country will experience growing competitiveness problems. Due to rising unit
labor costs they will not be able to compete with lower-cost countries, and the lack of productivity improvement
will prevent them from moving up the value chain.
Therefore, less attention should be placed on what a country produces and exports and more on how it is done.
In other words, the underlying processes and institutions are more important than the products. Key capabilities
are those that enable innovation, build upon talent, and nurture technology and finance. Furthermore, incentives
need to be realigned so that they are conducive to innovation, including maintaining a competitive playing field
and smart regulation.
The MIC trap is not inevitable and can be avoided by a careful consideration of the country’s economic model,
acknowledging that what has brought the country to MIC status will likely not be what brings it to high income
status.
ᵃ “Growth slowdowns and the middle-income trap”. S. Aiyar, R. Duval, D. Puy, Y. Wu, and L. Zhang. IMF working paper WP/13/71.
March 2013.
ᵇ “Transitioning from Low-Income growth to high-income growth. Is there a Middle income trap? ”, D. Bulman, M. Eden and H. Nguyen.
World Bank Policy research working paper 7104. November 2014.
ᵆ MFM Diversification and Middle-Income Traps Thematic Group. Summary of Presentation on Middle-Income Traps by Philip
Schellekens.
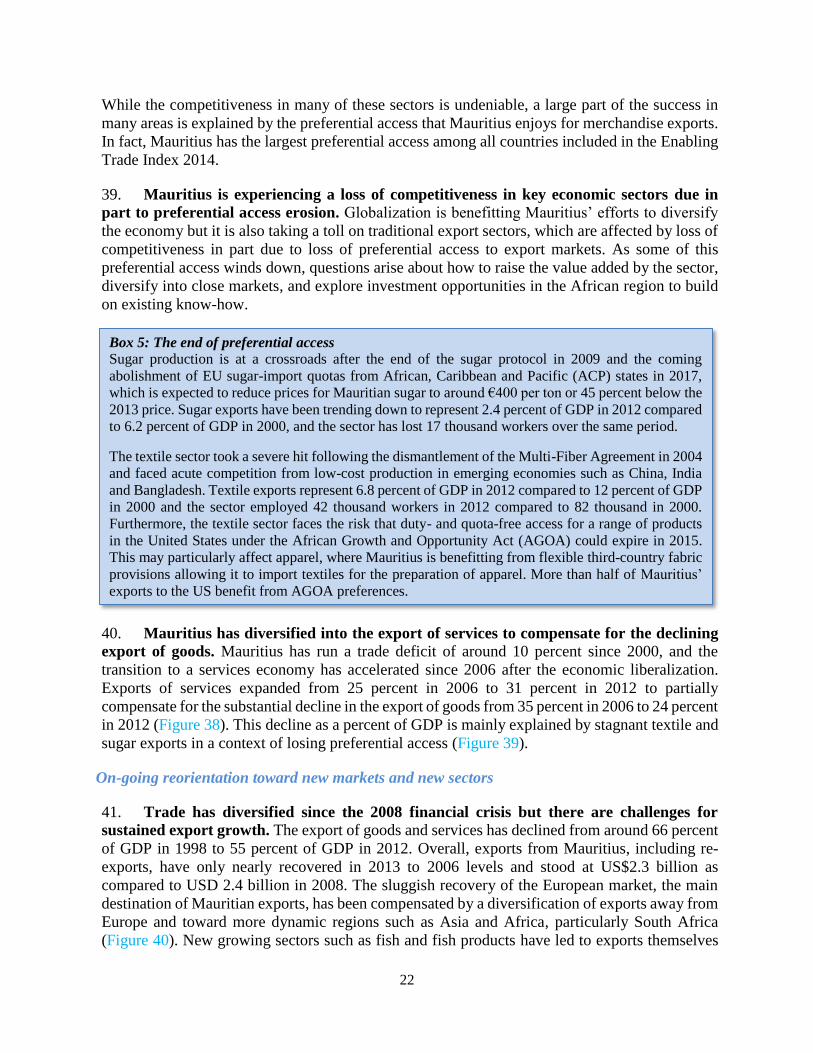
22
While the competitiveness in many of these sectors is undeniable, a large part of the success in
many areas is explained by the preferential access that Mauritius enjoys for merchandise exports.
In fact, Mauritius has the largest preferential access among all countries included in the Enabling
Trade Index 2014.
39. Mauritius is experiencing a loss of competitiveness in key economic sectors due in
part to preferential access erosion. Globalization is benefitting Mauritius’ efforts to diversify
the economy but it is also taking a toll on traditional export sectors, which are affected by loss of
competitiveness in part due to loss of preferential access to export markets. As some of this
preferential access winds down, questions arise about how to raise the value added by the sector,
diversify into close markets, and explore investment opportunities in the African region to build
on existing know-how.
40. Mauritius has diversified into the export of services to compensate for the declining
export of goods. Mauritius has run a trade deficit of around 10 percent since 2000, and the
transition to a services economy has accelerated since 2006 after the economic liberalization.
Exports of services expanded from 25 percent in 2006 to 31 percent in 2012 to partially
compensate for the substantial decline in the export of goods from 35 percent in 2006 to 24 percent
in 2012 (Figure 38). This decline as a percent of GDP is mainly explained by stagnant textile and
sugar exports in a context of losing preferential access (Figure 39).
On-going reorientation toward new markets and new sectors
41. Trade has diversified since the 2008 financial crisis but there are challenges for
sustained export growth. The export of goods and services has declined from around 66 percent
of GDP in 1998 to 55 percent of GDP in 2012. Overall, exports from Mauritius, including re-
exports, have only nearly recovered in 2013 to 2006 levels and stood at US$2.3 billion as
compared to USD 2.4 billion in 2008. The sluggish recovery of the European market, the main
destination of Mauritian exports, has been compensated by a diversification of exports away from
Europe and toward more dynamic regions such as Asia and Africa, particularly South Africa
(Figure 40). New growing sectors such as fish and fish products have led to exports themselves
Box 5: The end of preferential access
Sugar production is at a crossroads after the end of the sugar protocol in 2009 and the coming
abolishment of EU sugar-import quotas from African, Caribbean and Pacific (ACP) states in 2017,
which is expected to reduce prices for Mauritian sugar to around €400 per ton or 45 percent below the
2013 price. Sugar exports have been trending down to represent 2.4 percent of GDP in 2012 compared
to 6.2 percent of GDP in 2000, and the sector has lost 17 thousand workers over the same period.
The textile sector took a severe hit following the dismantlement of the Multi-Fiber Agreement in 2004
and faced acute competition from low-cost production in emerging economies such as China, India
and Bangladesh. Textile exports represent 6.8 percent of GDP in 2012 compared to 12 percent of GDP
in 2000 and the sector employed 42 thousand workers in 2012 compared to 82 thousand in 2000.
Furthermore, the textile sector faces the risk that duty- and quota-free access for a range of products
in the United States under the African Growth and Opportunity Act (AGOA) could expire in 2015.
This may particularly affect apparel, where Mauritius is benefitting from flexible third-country fabric
provisions allowing it to import textiles for the preparation of apparel. More than half of Mauritius’
exports to the US benefit from AGOA preferences.
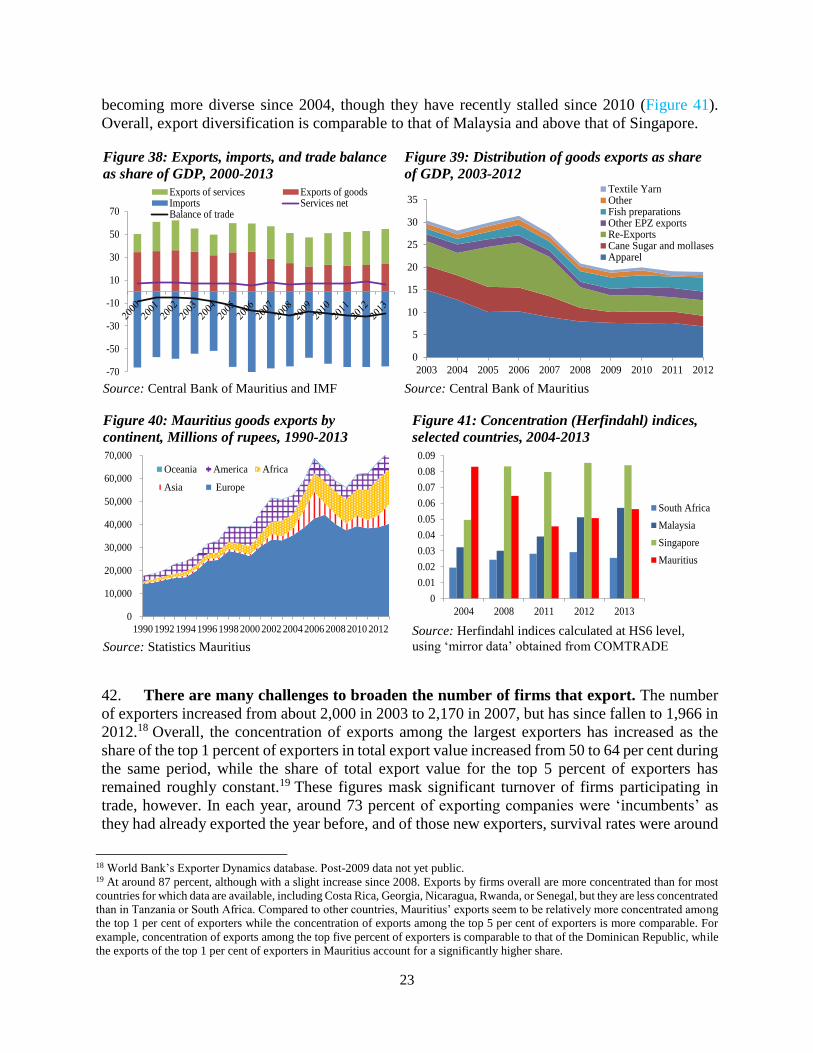
23
becoming more diverse since 2004, though they have recently stalled since 2010 (Figure 41).
Overall, export diversification is comparable to that of Malaysia and above that of Singapore.
Figure 38: Exports, imports, and trade balance
as share of GDP, 2000-2013
Source: Central Bank of Mauritius and IMF
Figure 39: Distribution of goods exports as share
of GDP, 2003-2012
Source: Central Bank of Mauritius
Figure 40: Mauritius goods exports by
continent, Millions of rupees, 1990-2013
Source: Statistics Mauritius
Figure 41: Concentration (Herfindahl) indices,
selected countries, 2004-2013
Source: Herfindahl indices calculated at HS6 level,
using ‘mirror data’ obtained from COMTRADE
42. There are many challenges to broaden the number of firms that export. The number
of exporters increased from about 2,000 in 2003 to 2,170 in 2007, but has since fallen to 1,966 in
2012.18 Overall, the concentration of exports among the largest exporters has increased as the
share of the top 1 percent of exporters in total export value increased from 50 to 64 per cent during
the same period, while the share of total export value for the top 5 percent of exporters has
remained roughly constant.19 These figures mask significant turnover of firms participating in
trade, however. In each year, around 73 percent of exporting companies were ‘incumbents’ as
they had already exported the year before, and of those new exporters, survival rates were around
18 World Bank’s Exporter Dynamics database. Post-2009 data not yet public. 19 At around 87 percent, although with a slight increase since 2008. Exports by firms overall are more concentrated than for most
countries for which data are available, including Costa Rica, Georgia, Nicaragua, Rwanda, or Senegal, but they are less concentrated
than in Tanzania or South Africa. Compared to other countries, Mauritius’ exports seem to be relatively more concentrated among
the top 1 per cent of exporters while the concentration of exports among the top 5 per cent of exporters is more comparable. For
example, concentration of exports among the top five percent of exporters is comparable to that of the Dominican Republic, while
the exports of the top 1 per cent of exporters in Mauritius account for a significantly higher share.
-70
-50
-30
-10
10
30
50
70
Exports of services Exports of goodsImports Services netBalance of trade
0
5
10
15
20
25
30
35
2003 2004 2005 2006 2007 2008 2009 2010 2011 2012
Textile YarnOtherFish preparationsOther EPZ exportsRe-ExportsCane Sugar and mollasesApparel
0
10,000
20,000
30,000
40,000
50,000
60,000
70,000
1990 1992 1994 1996 1998 2000 2002 2004 2006 2008 2010 2012
Oceania America Africa
Asia Europe
0
0.01
0.02
0.03
0.04
0.05
0.06
0.07
0.08
0.09
2004 2008 2011 2012 2013
South Africa
Malaysia
Singapore
Mauritius
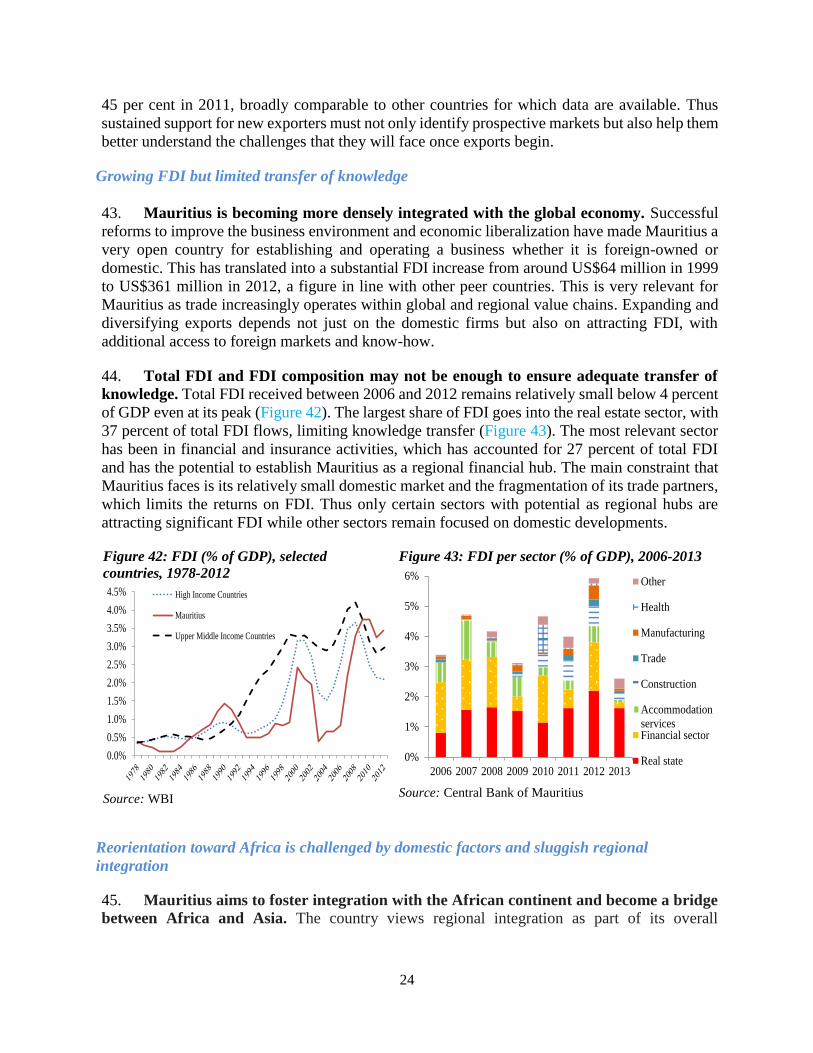
24
45 per cent in 2011, broadly comparable to other countries for which data are available. Thus
sustained support for new exporters must not only identify prospective markets but also help them
better understand the challenges that they will face once exports begin.
Growing FDI but limited transfer of knowledge
43. Mauritius is becoming more densely integrated with the global economy. Successful
reforms to improve the business environment and economic liberalization have made Mauritius a
very open country for establishing and operating a business whether it is foreign-owned or
domestic. This has translated into a substantial FDI increase from around US$64 million in 1999
to US$361 million in 2012, a figure in line with other peer countries. This is very relevant for
Mauritius as trade increasingly operates within global and regional value chains. Expanding and
diversifying exports depends not just on the domestic firms but also on attracting FDI, with
additional access to foreign markets and know-how.
44. Total FDI and FDI composition may not be enough to ensure adequate transfer of
knowledge. Total FDI received between 2006 and 2012 remains relatively small below 4 percent
of GDP even at its peak (Figure 42). The largest share of FDI goes into the real estate sector, with
37 percent of total FDI flows, limiting knowledge transfer (Figure 43). The most relevant sector
has been in financial and insurance activities, which has accounted for 27 percent of total FDI
and has the potential to establish Mauritius as a regional financial hub. The main constraint that
Mauritius faces is its relatively small domestic market and the fragmentation of its trade partners,
which limits the returns on FDI. Thus only certain sectors with potential as regional hubs are
attracting significant FDI while other sectors remain focused on domestic developments.
Figure 42: FDI (% of GDP), selected
countries, 1978-2012
Source: WBI
Figure 43: FDI per sector (% of GDP), 2006-2013
Source: Central Bank of Mauritius
Reorientation toward Africa is challenged by domestic factors and sluggish regional
integration
45. Mauritius aims to foster integration with the African continent and become a bridge
between Africa and Asia. The country views regional integration as part of its overall
0.0%
0.5%
1.0%
1.5%
2.0%
2.5%
3.0%
3.5%
4.0%
4.5% High Income Countries
Mauritius
Upper Middle Income Countries
0%
1%
2%
3%
4%
5%
6%
2006 2007 2008 2009 2010 2011 2012 2013
Other
Health
Manufacturing
Trade
Construction
Accommodation
servicesFinancial sector
Real state
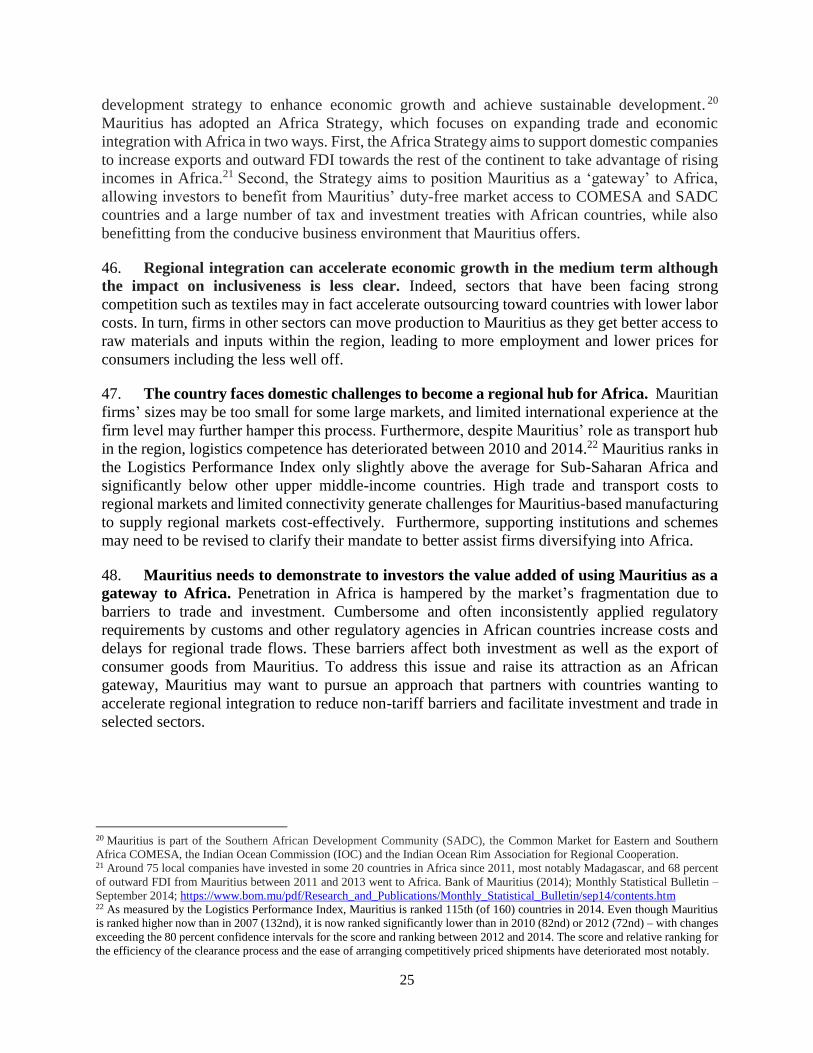
25
development strategy to enhance economic growth and achieve sustainable development. 20
Mauritius has adopted an Africa Strategy, which focuses on expanding trade and economic
integration with Africa in two ways. First, the Africa Strategy aims to support domestic companies
to increase exports and outward FDI towards the rest of the continent to take advantage of rising
incomes in Africa.21 Second, the Strategy aims to position Mauritius as a ‘gateway’ to Africa,
allowing investors to benefit from Mauritius’ duty-free market access to COMESA and SADC
countries and a large number of tax and investment treaties with African countries, while also
benefitting from the conducive business environment that Mauritius offers.
46. Regional integration can accelerate economic growth in the medium term although
the impact on inclusiveness is less clear. Indeed, sectors that have been facing strong
competition such as textiles may in fact accelerate outsourcing toward countries with lower labor
costs. In turn, firms in other sectors can move production to Mauritius as they get better access to
raw materials and inputs within the region, leading to more employment and lower prices for
consumers including the less well off.
47. The country faces domestic challenges to become a regional hub for Africa. Mauritian
firms’ sizes may be too small for some large markets, and limited international experience at the
firm level may further hamper this process. Furthermore, despite Mauritius’ role as transport hub
in the region, logistics competence has deteriorated between 2010 and 2014.22 Mauritius ranks in
the Logistics Performance Index only slightly above the average for Sub-Saharan Africa and
significantly below other upper middle-income countries. High trade and transport costs to
regional markets and limited connectivity generate challenges for Mauritius-based manufacturing
to supply regional markets cost-effectively. Furthermore, supporting institutions and schemes
may need to be revised to clarify their mandate to better assist firms diversifying into Africa.
48. Mauritius needs to demonstrate to investors the value added of using Mauritius as a
gateway to Africa. Penetration in Africa is hampered by the market’s fragmentation due to
barriers to trade and investment. Cumbersome and often inconsistently applied regulatory
requirements by customs and other regulatory agencies in African countries increase costs and
delays for regional trade flows. These barriers affect both investment as well as the export of
consumer goods from Mauritius. To address this issue and raise its attraction as an African
gateway, Mauritius may want to pursue an approach that partners with countries wanting to
accelerate regional integration to reduce non-tariff barriers and facilitate investment and trade in
selected sectors.
20 Mauritius is part of the Southern African Development Community (SADC), the Common Market for Eastern and Southern
Africa COMESA, the Indian Ocean Commission (IOC) and the Indian Ocean Rim Association for Regional Cooperation. 21 Around 75 local companies have invested in some 20 countries in Africa since 2011, most notably Madagascar, and 68 percent
of outward FDI from Mauritius between 2011 and 2013 went to Africa. Bank of Mauritius (2014); Monthly Statistical Bulletin –
September 2014; https://www.bom.mu/pdf/Research_and_Publications/Monthly_Statistical_Bulletin/sep14/contents.htm 22 As measured by the Logistics Performance Index, Mauritius is ranked 115th (of 160) countries in 2014. Even though Mauritius
is ranked higher now than in 2007 (132nd), it is now ranked significantly lower than in 2010 (82nd) or 2012 (72nd) – with changes
exceeding the 80 percent confidence intervals for the score and ranking between 2012 and 2014. The score and relative ranking for
the efficiency of the clearance process and the ease of arranging competitively priced shipments have deteriorated most notably.
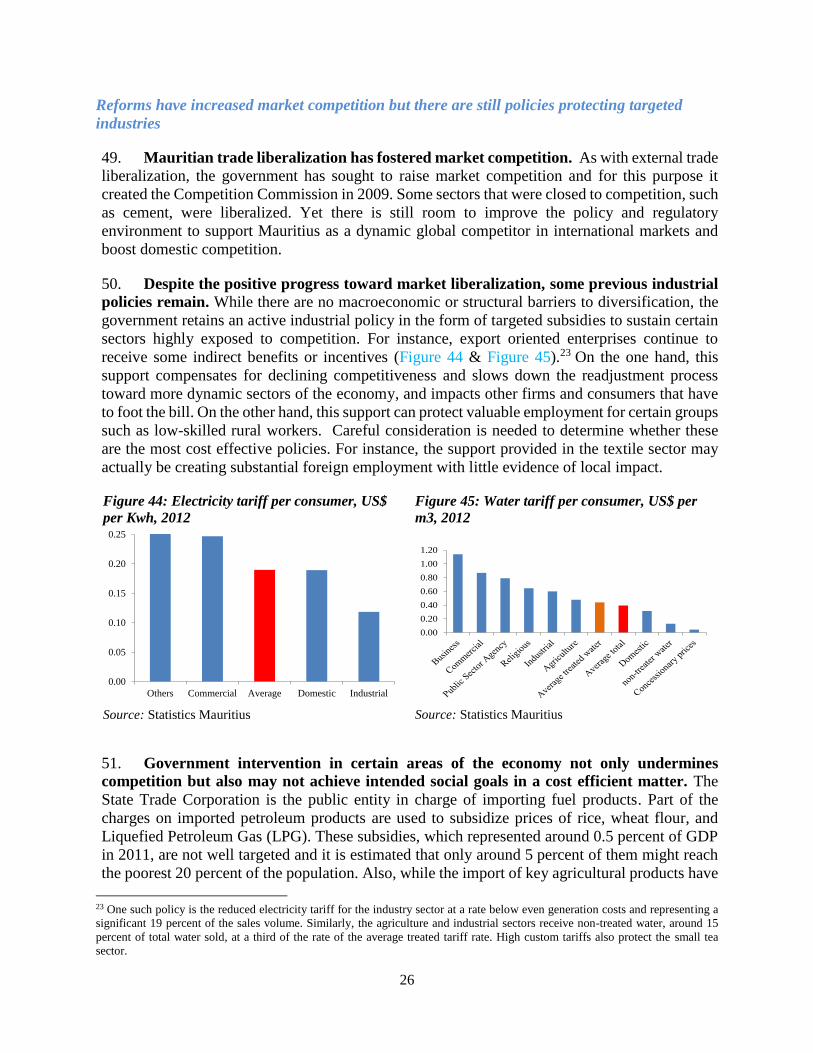
26
Reforms have increased market competition but there are still policies protecting targeted
industries
49. Mauritian trade liberalization has fostered market competition. As with external trade
liberalization, the government has sought to raise market competition and for this purpose it
created the Competition Commission in 2009. Some sectors that were closed to competition, such
as cement, were liberalized. Yet there is still room to improve the policy and regulatory
environment to support Mauritius as a dynamic global competitor in international markets and
boost domestic competition.
50. Despite the positive progress toward market liberalization, some previous industrial
policies remain. While there are no macroeconomic or structural barriers to diversification, the
government retains an active industrial policy in the form of targeted subsidies to sustain certain
sectors highly exposed to competition. For instance, export oriented enterprises continue to
receive some indirect benefits or incentives (Figure 44 & Figure 45).23 On the one hand, this
support compensates for declining competitiveness and slows down the readjustment process
toward more dynamic sectors of the economy, and impacts other firms and consumers that have
to foot the bill. On the other hand, this support can protect valuable employment for certain groups
such as low-skilled rural workers. Careful consideration is needed to determine whether these
are the most cost effective policies. For instance, the support provided in the textile sector may
actually be creating substantial foreign employment with little evidence of local impact.
Figure 44: Electricity tariff per consumer, US$
per Kwh, 2012
Source: Statistics Mauritius
Figure 45: Water tariff per consumer, US$ per
m3, 2012
Source: Statistics Mauritius
51. Government intervention in certain areas of the economy not only undermines
competition but also may not achieve intended social goals in a cost efficient matter. The
State Trade Corporation is the public entity in charge of importing fuel products. Part of the
charges on imported petroleum products are used to subsidize prices of rice, wheat flour, and
Liquefied Petroleum Gas (LPG). These subsidies, which represented around 0.5 percent of GDP
in 2011, are not well targeted and it is estimated that only around 5 percent of them might reach
the poorest 20 percent of the population. Also, while the import of key agricultural products have
23 One such policy is the reduced electricity tariff for the industry sector at a rate below even generation costs and representing a
significant 19 percent of the sales volume. Similarly, the agriculture and industrial sectors receive non-treated water, around 15
percent of total water sold, at a third of the rate of the average treated tariff rate. High custom tariffs also protect the small tea
sector.
0.00
0.05
0.10
0.15
0.20
0.25
Others Commercial Average Domestic Industrial
0.00
0.20
0.40
0.60
0.80
1.00
1.20
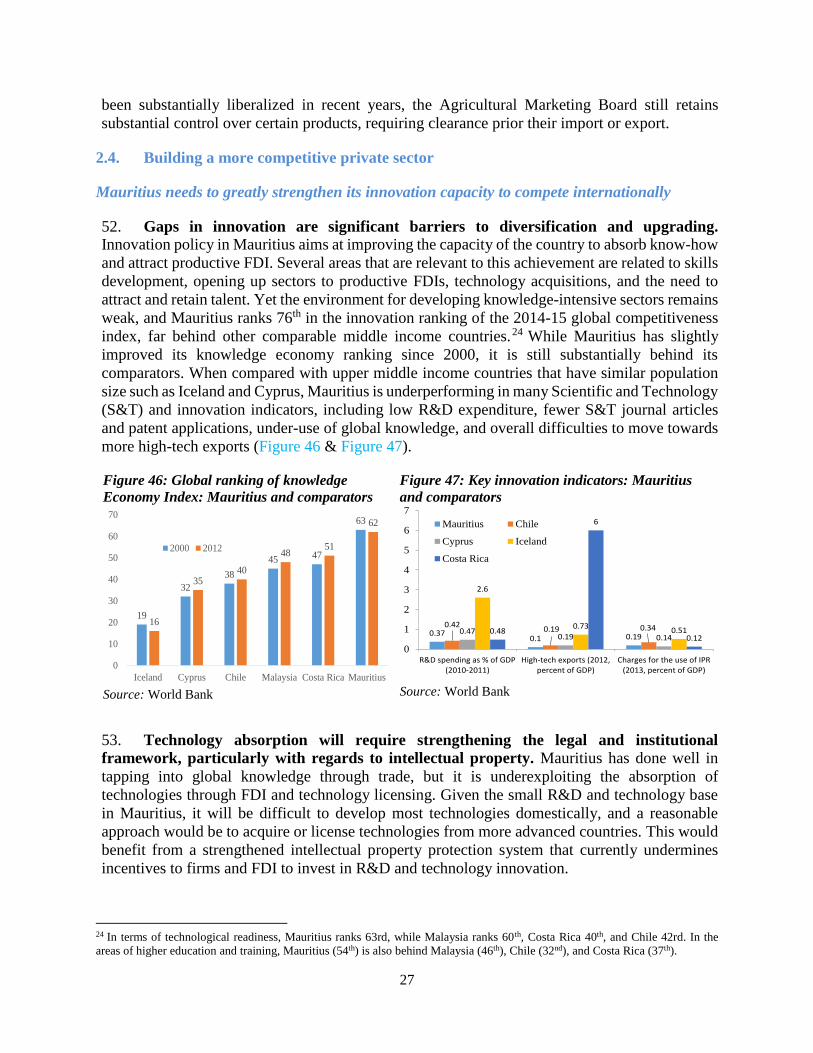
27
been substantially liberalized in recent years, the Agricultural Marketing Board still retains
substantial control over certain products, requiring clearance prior their import or export.
2.4. Building a more competitive private sector
Mauritius needs to greatly strengthen its innovation capacity to compete internationally
52. Gaps in innovation are significant barriers to diversification and upgrading. Innovation policy in Mauritius aims at improving the capacity of the country to absorb know-how
and attract productive FDI. Several areas that are relevant to this achievement are related to skills
development, opening up sectors to productive FDIs, technology acquisitions, and the need to
attract and retain talent. Yet the environment for developing knowledge-intensive sectors remains
weak, and Mauritius ranks 76th in the innovation ranking of the 2014-15 global competitiveness
index, far behind other comparable middle income countries.24 While Mauritius has slightly
improved its knowledge economy ranking since 2000, it is still substantially behind its
comparators. When compared with upper middle income countries that have similar population
size such as Iceland and Cyprus, Mauritius is underperforming in many Scientific and Technology
(S&T) and innovation indicators, including low R&D expenditure, fewer S&T journal articles
and patent applications, under-use of global knowledge, and overall difficulties to move towards
more high-tech exports (Figure 46 & Figure 47).
Figure 46: Global ranking of knowledge
Economy Index: Mauritius and comparators
Source: World Bank
Figure 47: Key innovation indicators: Mauritius
and comparators
Source: World Bank
53. Technology absorption will require strengthening the legal and institutional
framework, particularly with regards to intellectual property. Mauritius has done well in
tapping into global knowledge through trade, but it is underexploiting the absorption of
technologies through FDI and technology licensing. Given the small R&D and technology base
in Mauritius, it will be difficult to develop most technologies domestically, and a reasonable
approach would be to acquire or license technologies from more advanced countries. This would
benefit from a strengthened intellectual property protection system that currently undermines
incentives to firms and FDI to invest in R&D and technology innovation.
24 In terms of technological readiness, Mauritius ranks 63rd, while Malaysia ranks 60th, Costa Rica 40th, and Chile 42rd. In the
areas of higher education and training, Mauritius (54th) is also behind Malaysia (46th), Chile (32nd), and Costa Rica (37th).
19
32
38
45 47
63
16
3540
4851
62
0
10
20
30
40
50
60
70
Iceland Cyprus Chile Malaysia Costa Rica Mauritius
2000 2012
0.370.1 0.19
0.420.19 0.340.47
0.19 0.14
2.6
0.730.510.48
6
0.12
0
1
2
3
4
5
6
7
R&D spending as % of GDP(2010-2011)
High-tech exports (2012,percent of GDP)
Charges for the use of IPR(2013, percent of GDP)
Mauritius Chile
Cyprus Iceland
Costa Rica

28
54. Tertiary education expansion needs to focus on innovation and specialization of skills
for the knowledge economy. Mauritius ranks 54th in higher education and training,25 comparing
unfavorably with countries such as Chile and Malaysia. These ratings are a result of low
enrolment rates in tertiary education, weak collaboration between universities, research, and
industry,26 and low availability of scientists and engineers. Although efforts have been made to
increase the number of researchers and doctors in tertiary education, only 45 percent of teachers
at the University of Mauritius hold a doctoral degree. Furthermore, internationalization of the
University of Mauritius needs to be increased, as it is fundamental for small knowledge
economies to be associated with academic and student mobility as well as close links with
international firms. And while there has been growing emphasis on the provision of science and
engineering courses, the educational system still has a bias towards the humanities.
55. There is a need to increase R&D spending while increasing research-business
linkages. Spending on R&D, a key indicator of the absorptive capacity of a country, is very low
in Mauritius.27 Moreover, R&D in Mauritius is dominated by the public sector, with only 18
percent of private firms performing R&D. Most of Mauritius research expertise lies in the
agricultural and sugar sectors, with virtually no industrial R&D. The current Private Sector
Collaborative Research Grant (PSCRG) is designed to increase research-business linkages but its
impact has been limited thus far. There is no national innovation strategy, and there is a
proliferation of institutions with overlapping mandates. A concerted effort that includes policy
makers from the relevant ministries, academics, researchers, and the private sector could develop
a strategy and clarify the roles and responsibilities of various stakeholders moving forward. Such
a strategy would help streamline the public institutions in charge of R&D and innovation and
make them more responsive to the private sector needs, as evidenced in successful approaches
implemented elsewhere (Box 6). It is also important to better understand the technology needs of
SMEs so that proper instruments such as SME innovation vouchers, grants and incubators can be
designed. This could also be needed to acquire foreign technologies or help to link domestic
firms/R&D institutes with overseas research institutes and centers of excellence.
56. Mauritius needs to attract and retain more talent. For Mauritius to move up the value
chain more effort is needed to improve the availability, quality and relevance of skills in the
country. The need to enter into new markets and sectors and increase the knowledge content of
existing products will require attracting overseas talent. Tapping into the Mauritian Diaspora on
a short-term or long-term basis and dedicating programs for specific skills or sectors may be one
part of the solution. Further attracting foreign talent will require more open and flexible
immigration and visa policies including the system of labor permits.28 Additional elements to
make Mauritius a knowledge hub would require developing services and amenities that create an
international reputation and draw students and businesses from overseas to build economies of
agglomeration.
25 2014 World Economic Forum Global Competitiveness Report. 26 Mauritius is ranked 101st by WEF 2014-2015 in terms of university-industry collaboration in R&D while Malaysia is ranked
12th, Costa Rica 33rd and Chile 39th. 27 Current R&D spending stands at 0.37 percent of GDP up from 0.29 percent in 2000. It is also low when compared with other
peer countries such as Costa Rica (0.48 percent of GDP), Malaysia (1.07 percent of GDP) or China (1.33 percent of GDP). 28 While the country is ranked 30th in openness to foreign labor participation in the 2014 Enabling Trade Index, the existing system
of labor permits causes the country to be ranked 63th in terms of ease of hiring foreign labor.

29
Skill gaps undermine efforts to move toward more value added activities
Box 6: The role of the public sector in spurring innovation
Successfully innovated countries have to strike a balance between the role of the private sector and the
public sector in shaping innovation policies. The public sector coordinates with the private sector to
create a level playing field for innovation to thrive but also pursues active policies and programs to
support innovation and the substantial spillover effects that it has on the economy.
Key for the successes of innovation policies is a consistent dialogue with the private sector, particularly
in shaping innovation strategies. In Finland, the innovation strategy was prepared through a consultative
process led by a steering group and chaired by the President of the Finnish Innovation Fund. Similarly,
Singapore’s Economic Development Board set the strategic direction for Singapore’s overall
development and coordinates the delivery of skills, services and technology to meet industry demand in
a consultative way.
Attraction of talent is another area where the public sector may fill skill gaps. In China, special incentives
are provided to high-end diaspora or foreign talent, who work to fill critical skills gaps, act as
entrepreneurs, or act as members of scientific, technical and business networks to research, teach, or
invest. In Scotland, GlobalScot taps into the skilled Scottish Diaspora and Chile Global, housed in
Foundation Chile, plays a similar role.
The public sector is also playing a role in exposing SMEs to innovation. Norway’s TEFT program seeks
to diffuse technology from research institutes to SMEs. This is done by a TEFT attaché, seconded from
the R&D institutions, who acts as a broker, organizer, or coach to aid SMEs in the innovation process.
The program pays 75 percent of project costs and the company pays the rest. Another possible instrument
is an innovation voucher, which enables firms, especially SMEs, to access technologies from research
institutes or universities.
57. Mauritian firms are hampered by the pool of skills available. In 2014, 54 percent of
responding enterprises across all sectors in Mauritius indicated that they could not recruit the right
number of candidates with the required profiles (Figure 48 & Figure 49).29 An inadequately
educated workforce is identified among the top five most problematic factors for doing business
in Mauritius.30 The shift towards a service-oriented knowledge economy has resulted in demands
for skills that the education and training system do not deliver. Given that recent graduates require
substantial time to secure a job, this points to a skills mismatch between the quality and relevance
of skills provided in the education system. This results in overall underemployment, as many jobs
do not actually require many of the degrees earned.
58. According to Mauritian employers many employees have qualifications but lack the
appropriate skills. Employment surveys also reveal that it is even more difficult to find
employees with appropriate experience and proper attitudes. The ICT and the financial sectors
especially report large labor and skill shortages. Even in the manufacturing sector there is
substantial demand for plant and machinery workers that are not easily found in the market, when
the required skills, experience, and attitudes are requested.
29 2014 employment trend survey (Ministry of Finance and Economic Development). 30 2013-2014 Global Competitiveness Report.
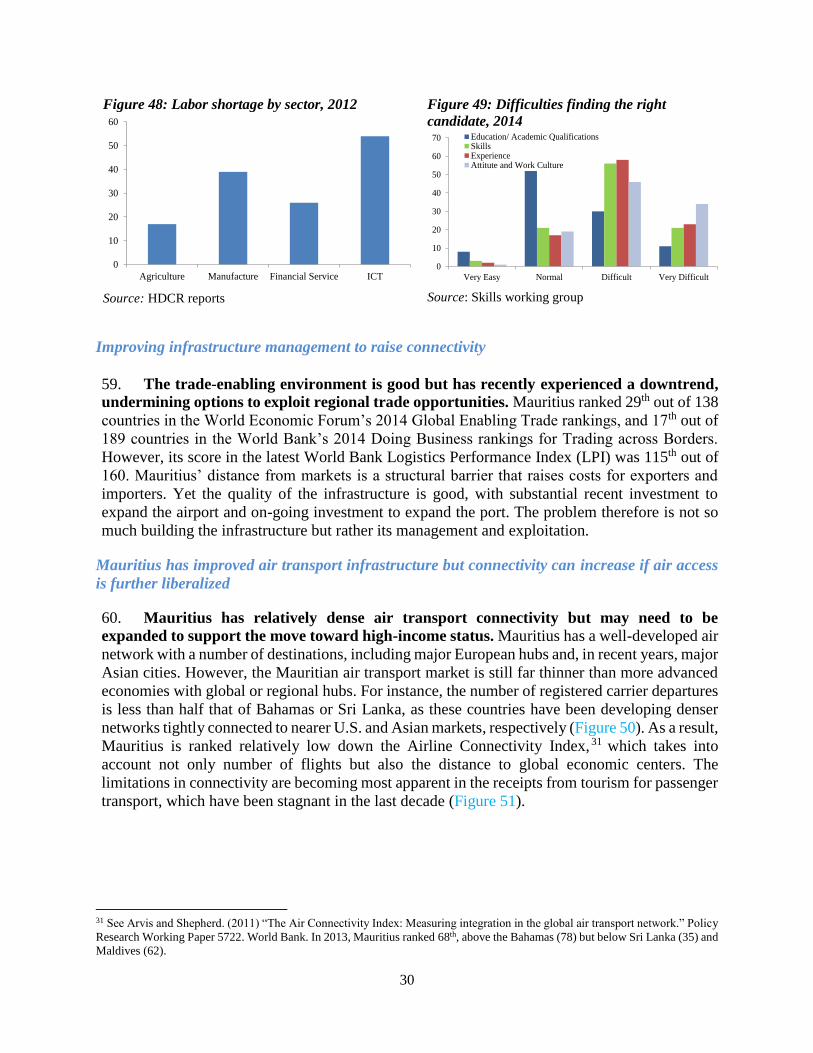
30
Figure 48: Labor shortage by sector, 2012
Source: HDCR reports
Figure 49: Difficulties finding the right
candidate, 2014
Source: Skills working group
Improving infrastructure management to raise connectivity
59. The trade-enabling environment is good but has recently experienced a downtrend,
undermining options to exploit regional trade opportunities. Mauritius ranked 29th out of 138
countries in the World Economic Forum’s 2014 Global Enabling Trade rankings, and 17th out of
189 countries in the World Bank’s 2014 Doing Business rankings for Trading across Borders.
However, its score in the latest World Bank Logistics Performance Index (LPI) was 115th out of
160. Mauritius’ distance from markets is a structural barrier that raises costs for exporters and
importers. Yet the quality of the infrastructure is good, with substantial recent investment to
expand the airport and on-going investment to expand the port. The problem therefore is not so
much building the infrastructure but rather its management and exploitation.
Mauritius has improved air transport infrastructure but connectivity can increase if air access
is further liberalized
60. Mauritius has relatively dense air transport connectivity but may need to be
expanded to support the move toward high-income status. Mauritius has a well-developed air
network with a number of destinations, including major European hubs and, in recent years, major
Asian cities. However, the Mauritian air transport market is still far thinner than more advanced
economies with global or regional hubs. For instance, the number of registered carrier departures
is less than half that of Bahamas or Sri Lanka, as these countries have been developing denser
networks tightly connected to nearer U.S. and Asian markets, respectively (Figure 50). As a result,
Mauritius is ranked relatively low down the Airline Connectivity Index,31 which takes into
account not only number of flights but also the distance to global economic centers. The
limitations in connectivity are becoming most apparent in the receipts from tourism for passenger
transport, which have been stagnant in the last decade (Figure 51).
31 See Arvis and Shepherd. (2011) “The Air Connectivity Index: Measuring integration in the global air transport network.” Policy
Research Working Paper 5722. World Bank. In 2013, Mauritius ranked 68th, above the Bahamas (78) but below Sri Lanka (35) and
Maldives (62).
0
10
20
30
40
50
60
Agriculture Manufacture Financial Service ICT0
10
20
30
40
50
60
70
Very Easy Normal Difficult Very Difficult
Education/ Academic QualificationsSkillsExperienceAttitute and Work Culture
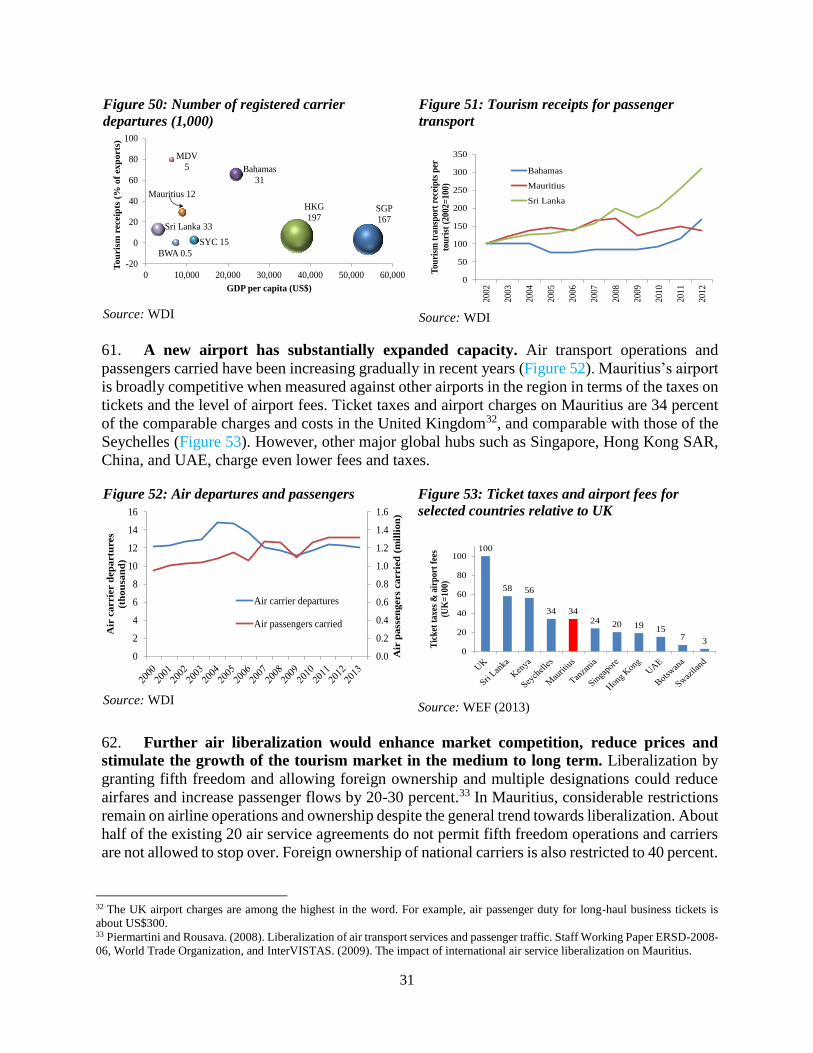
31
Figure 50: Number of registered carrier
departures (1,000)
Source: WDI
Figure 51: Tourism receipts for passenger
transport
Source: WDI
61. A new airport has substantially expanded capacity. Air transport operations and
passengers carried have been increasing gradually in recent years (Figure 52). Mauritius’s airport
is broadly competitive when measured against other airports in the region in terms of the taxes on
tickets and the level of airport fees. Ticket taxes and airport charges on Mauritius are 34 percent
of the comparable charges and costs in the United Kingdom32, and comparable with those of the
Seychelles (Figure 53). However, other major global hubs such as Singapore, Hong Kong SAR,
China, and UAE, charge even lower fees and taxes.
Figure 52: Air departures and passengers
Source: WDI
Figure 53: Ticket taxes and airport fees for
selected countries relative to UK
Source: WEF (2013)
62. Further air liberalization would enhance market competition, reduce prices and
stimulate the growth of the tourism market in the medium to long term. Liberalization by
granting fifth freedom and allowing foreign ownership and multiple designations could reduce
airfares and increase passenger flows by 20-30 percent.33 In Mauritius, considerable restrictions
remain on airline operations and ownership despite the general trend towards liberalization. About
half of the existing 20 air service agreements do not permit fifth freedom operations and carriers
are not allowed to stop over. Foreign ownership of national carriers is also restricted to 40 percent.
32 The UK airport charges are among the highest in the word. For example, air passenger duty for long-haul business tickets is
about US$300. 33 Piermartini and Rousava. (2008). Liberalization of air transport services and passenger traffic. Staff Working Paper ERSD-2008-
06, World Trade Organization, and InterVISTAS. (2009). The impact of international air service liberalization on Mauritius.
SGP
167
HKG
197
Bahamas
31
SYC 15
Mauritius 12
BWA 0.5
MDV
5
Sri Lanka 33
-20
0
20
40
60
80
100
0 10,000 20,000 30,000 40,000 50,000 60,000
Tou
ris
m r
eceip
ts (
% o
f exp
orts
)
GDP per capita (US$)0
50
100
150
200
250
300
350
2002
20
03
20
04
2005
20
06
20
07
20
08
20
09
20
10
20
11
20
12
To
uri
sm t
ran
spo
rt r
ecei
pts
per
tou
rist
(2
002
=1
00
)
Bahamas
Mauritius
Sri Lanka
0.0
0.2
0.4
0.6
0.8
1.0
1.2
1.4
1.6
0
2
4
6
8
10
12
14
16
Air
pass
en
gers
carrie
d (
mil
lion
)
Air
carrie
r d
ep
artu
res
(th
ou
san
d)
Air carrier departures
Air passengers carried
100
58 56
34 3424 20 19 15
7 3
0
20
40
60
80
100
Tic
ket
taxes
& a
irp
ort
fee
s
(UK
=100)

32
The removal of these barriers could have a positive effect on reducing air transport cost,
stimulating connectivity and supporting tourism growth, among other sectors.
63. Further liberalization would require improved efficiency of Air Mauritius. Currently,
Air Mauritius accounts for about half of the Mauritian market (on an available seat basis). Whilst
recent restructuring efforts have restored modest profitability, it remains very weak with a net
profit margin of just 1.6 percent. Further restructuring efforts and increased labor productivity are
required to allow Air Mauritius to deliver improved air connectivity efficiently and profitably,
especially given emerging competition from low-cost carriers that market liberalization would
accelerate (Figure 54).
Figure 54: Labor Productivity of Airlines
Source: CAPA Centre for Aviation (2013)34
Figure 55: Liner Shipping Connectivity Index
Source: UNCTAD
High maritime connectivity may be at risk if there is no improved efficiency in the
management of port operations
64. Maritime connectivity improved in Mauritius between 2004 and 2013, reflecting the
development of Port Louis as a regional transshipment hub. As a result, the country’s
connectivity is above other ports in the region,35 although still far below global and regional hubs
such as UAE and Sri Lanka (Figure 55). The port currently handles between 6-7 million tons per
annum, about half of which is containerized. The throughput of Port Louis has been increasing
steadily in recent years, in line with economic growth.36 Currently, Port Louis plays an important
role in the regional transshipment market and about half of shipping lines at Port Louis are direct
connections from and to Europe and Asia, representing 80 percent of total transshipment market
in the region (Figure 56).
34 CAPA Centre for Aviation. (2013). European airline labor productivity: CAPA rankings. 35 That is, ports of Mombasa in Kenya, Dar es Salaam in Tanzania as well as ports in neighboring countries such as Seychelles and
Comoros. 36 Over the last decade, the traffic increased on average 2 percent per annum, with domestic container traffic increasing by 4 percent,
and transshipment cargo grew by 3 percent, since the introduction of lower charges for transshipment traffic in 2002. While
impressive, this growth is a fraction of the annual growth in Mombasa or Dar es Salaam over the same period (9 and 10 percent,
respectively).
17
710 11 12
16 17
22 22 23
30
0
10
20
30
40
Lab
or
cost
per
reven
ue (
%)
0
10
20
30
40
50
60
70
Lin
er S
hip
pin
g C
on
nec
tivit
y
Ind
ex (
2004 m
ax v
alu
e =
100) UAE
Sri Lanka
Bahamas
Ghana
Mauritius
Kenya
Tanzania
Seychelles
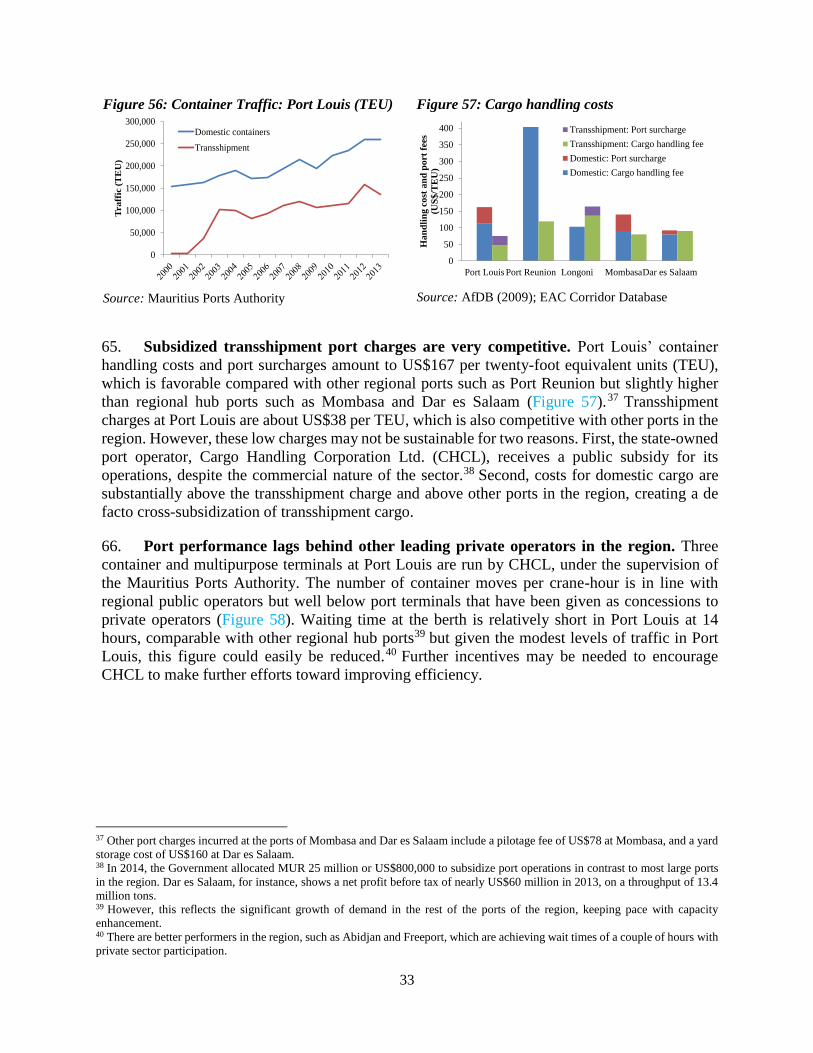
33
Figure 56: Container Traffic: Port Louis (TEU)
Source: Mauritius Ports Authority
Figure 57: Cargo handling costs
Source: AfDB (2009); EAC Corridor Database
65. Subsidized transshipment port charges are very competitive. Port Louis’ container
handling costs and port surcharges amount to US$167 per twenty-foot equivalent units (TEU),
which is favorable compared with other regional ports such as Port Reunion but slightly higher
than regional hub ports such as Mombasa and Dar es Salaam (Figure 57).37 Transshipment
charges at Port Louis are about US$38 per TEU, which is also competitive with other ports in the
region. However, these low charges may not be sustainable for two reasons. First, the state-owned
port operator, Cargo Handling Corporation Ltd. (CHCL), receives a public subsidy for its
operations, despite the commercial nature of the sector.38 Second, costs for domestic cargo are
substantially above the transshipment charge and above other ports in the region, creating a de
facto cross-subsidization of transshipment cargo.
66. Port performance lags behind other leading private operators in the region. Three
container and multipurpose terminals at Port Louis are run by CHCL, under the supervision of
the Mauritius Ports Authority. The number of container moves per crane-hour is in line with
regional public operators but well below port terminals that have been given as concessions to
private operators (Figure 58). Waiting time at the berth is relatively short in Port Louis at 14
hours, comparable with other regional hub ports39 but given the modest levels of traffic in Port
Louis, this figure could easily be reduced.40 Further incentives may be needed to encourage
CHCL to make further efforts toward improving efficiency.
37 Other port charges incurred at the ports of Mombasa and Dar es Salaam include a pilotage fee of US$78 at Mombasa, and a yard
storage cost of US$160 at Dar es Salaam. 38 In 2014, the Government allocated MUR 25 million or US$800,000 to subsidize port operations in contrast to most large ports
in the region. Dar es Salaam, for instance, shows a net profit before tax of nearly US$60 million in 2013, on a throughput of 13.4
million tons. 39 However, this reflects the significant growth of demand in the rest of the ports of the region, keeping pace with capacity
enhancement. 40 There are better performers in the region, such as Abidjan and Freeport, which are achieving wait times of a couple of hours with
private sector participation.
0
50,000
100,000
150,000
200,000
250,000
300,000T
ra
ffic
(T
EU
)
Domestic containers
Transshipment
0
50
100
150
200
250
300
350
400
Port Louis Port Reunion Longoni MombasaDar es Salaam
Ha
nd
lin
g c
ost
an
d p
ort
fee
s
(US
$/T
EU
)
Transshipment: Port surcharge
Transshipment: Cargo handling fee
Domestic: Port surcharge
Domestic: Cargo handling fee

34
Figure 58: Port operation performance
Source: AfDB (2009); Gwilliam (2011)
Figure 59: Number of water insufficiencies per
month
Source: WB enterprise survey, 2010
67. The role of Port Louis as a regional transshipment port is threatened by growing
competition and lower performance. In major regional hub ports, such as Mombasa and Dar es
Salaam, and even closer ones such as Port Reunion, substantial capacity expansions are ongoing
or in preparation.41 By contrast, the recent failure to conclude the concession of the container
terminal and retaining CHCL as the operator is unlikely to provide incentive to shipping lines to
continue to grow their transshipment volumes in Mauritius. This raises the risk that Port Louis
could be downgraded to feeder status, served by smaller ships at higher costs per TEU, with a
concomitant impact on the costs of imports and exports. Furthermore, there are concerns as to
whether Mauritius’s position can be sustained in the medium term, given the move towards larger
vessels serving fewer ports, and increased integration between shipping lines and terminal
operators.
Inadequate water and electric services are raising business costs
68. Inadequate utilities may increase business costs and can constrain development
objectives. Mauritius has a relatively high number of water interruptions when compared to peer
countries (Figure 59). As a result, some private businesses (mostly in tourism) have developed
independent or decentralized water supply and wastewater solutions. This may increase the cost
of doing business and may have an adverse effect on market competitiveness. Furthermore, these
decentralized systems present additional risks for contamination of the water sources42 due to
inadequate development and planning controls and a weak regulatory environment. Although
companies do not seem constrained by electricity service disruptions, the time required to get a
new connection (almost 3 months) is rather long (Figure 60).43 In addition, around 42 percent of
firms identified electricity as constraint, and 25 percent of them also own backup generators
(Figure 61).44 Social accountability mechanisms in the water sector are largely missing and no
social or peer pressure is done with non-compliant customers. Improved demand side governance
41 https://www.cma-cgm.com/static/News/Attachments/CMA%20CGM%20-%202nd%20Quarter%202014%20Results.pdf 42 This contamination would likely stem from both saline intrusions from abstraction in the shallow coastal aquifers and inadequate
treatment and disposal processes for wastewater. 43 WDI, 2013. Time required to get electricity is the number of days to obtain a permanent electricity connection. The measure
captures the median duration that the electricity utility and experts indicate is necessary in practice, rather than required by law, to
complete a procedure. 44 WB enterprise survey, 2009.
20 18 16 1510
24 24
14
60
48
0
10
20
30
40
50
60
70
Dar es
Salaam
Cape Town Port Louis Durban Mombasa
Crane container moves per hour
Container vessel stay (hour)
0
0.5
1
1.5
2
2.5
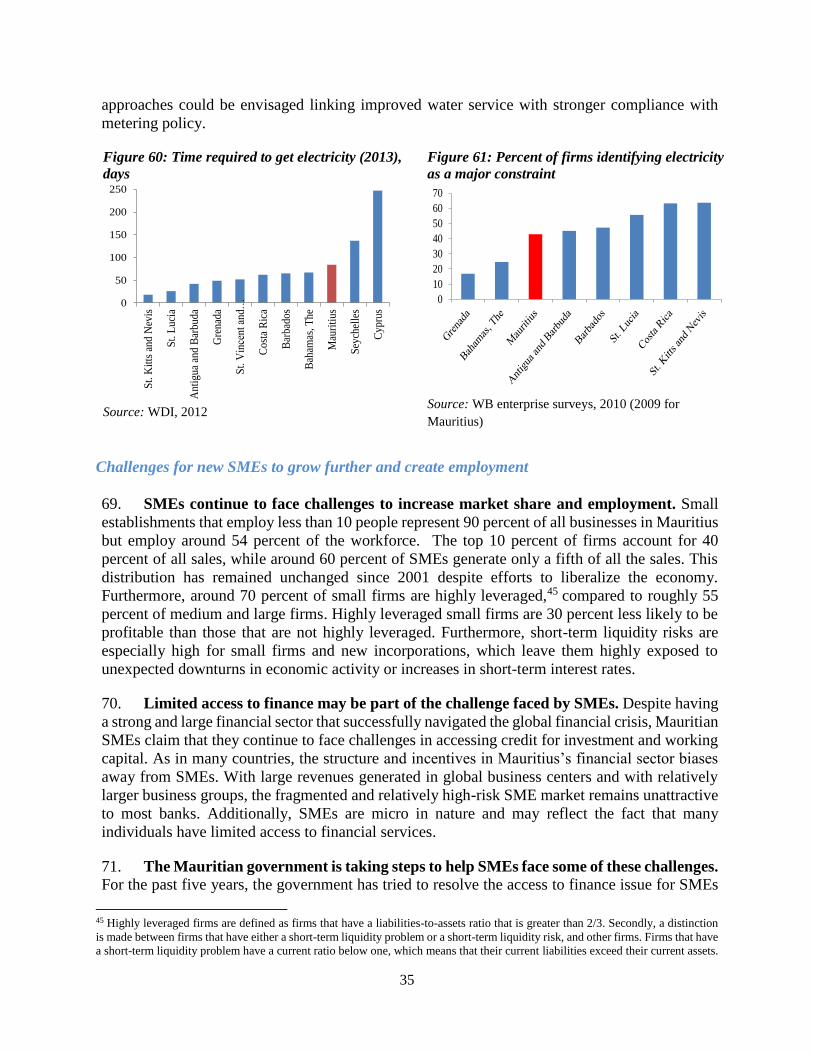
35
approaches could be envisaged linking improved water service with stronger compliance with
metering policy.
Figure 60: Time required to get electricity (2013),
days
Source: WDI, 2012
Figure 61: Percent of firms identifying electricity
as a major constraint
Source: WB enterprise surveys, 2010 (2009 for
Mauritius)
Challenges for new SMEs to grow further and create employment
69. SMEs continue to face challenges to increase market share and employment. Small
establishments that employ less than 10 people represent 90 percent of all businesses in Mauritius
but employ around 54 percent of the workforce. The top 10 percent of firms account for 40
percent of all sales, while around 60 percent of SMEs generate only a fifth of all the sales. This
distribution has remained unchanged since 2001 despite efforts to liberalize the economy.
Furthermore, around 70 percent of small firms are highly leveraged,45 compared to roughly 55
percent of medium and large firms. Highly leveraged small firms are 30 percent less likely to be
profitable than those that are not highly leveraged. Furthermore, short-term liquidity risks are
especially high for small firms and new incorporations, which leave them highly exposed to
unexpected downturns in economic activity or increases in short-term interest rates.
70. Limited access to finance may be part of the challenge faced by SMEs. Despite having
a strong and large financial sector that successfully navigated the global financial crisis, Mauritian
SMEs claim that they continue to face challenges in accessing credit for investment and working
capital. As in many countries, the structure and incentives in Mauritius’s financial sector biases
away from SMEs. With large revenues generated in global business centers and with relatively
larger business groups, the fragmented and relatively high-risk SME market remains unattractive
to most banks. Additionally, SMEs are micro in nature and may reflect the fact that many
individuals have limited access to financial services.
71. The Mauritian government is taking steps to help SMEs face some of these challenges.
For the past five years, the government has tried to resolve the access to finance issue for SMEs
45 Highly leveraged firms are defined as firms that have a liabilities-to-assets ratio that is greater than 2/3. Secondly, a distinction
is made between firms that have either a short-term liquidity problem or a short-term liquidity risk, and other firms. Firms that have
a short-term liquidity problem have a current ratio below one, which means that their current liabilities exceed their current assets.
0
50
100
150
200
250
St.
Kit
ts a
nd N
evis
St.
Luc
ia
Ant
igua
and
Bar
buda
Gre
nada
St.
Vin
cent
and
…
Cos
ta R
ica
Bar
bado
s
Bah
amas
, The
Mau
riti
us
Sey
chel
les
Cyp
rus
0
10
20
30
40
50
60
70
36
by earmarking over MUR 6 billion to the sector through different types of lending and non-
lending instruments.46 Credit is provided at subsidized rates, with partial state guarantees and
even sometimes without the need for collateral or third party guarantees. While these schemes
are in line with the government strategy of improving the SME operating environment, areas of
duplication as well as some gaps continue to exist. Recently, the government has decided to take
further steps to restructure the Development Bank of Mauritius as a micro-finance institution with
a banking license to provide retail micro-financing services to micro and small
enterprises. However, any policy reform in this sector needs an assessment of the effectiveness
of various existing schemes and business development service providers through an appropriate
M&E framework.
KNOWLEDGE GAPS: SMEs’ constraints and access to finance
While there is broad discussions in Mauritius about the challenges that SMEs face, particularly in terms
of access to finance, there have been no comprehensive surveys since 2009 that help to understand the
nature of these challenges. As a new firm census takes place in 2015, this will be an opportunity to
assess SMEs’ challenges and the impact of on-going government measures in key areas such as support
to export, access to finance, and transfer of knowledge, among others.
2.5. Sector opportunities to boost economic growth and employment creation
Agriculture development can have a substantial role in poverty reduction
72. The agriculture sector remains relevant for poverty reduction and food security. While the total land under agricultural production has declined, agriculture still occupies around
44 percent of the arable land area in Mauritius.47 The contribution of agriculture to the economy
was estimated at 23 percent in the late 1970s, and 4 percent in 2010 and employs around 7 percent
of total employment. The sugarcane sector is the major sub-sector, followed by food-crops,
livestock, flowers, fruits and forestry. Agriculture plays a significant role for small-scale farmers
and employment at the estate farms, as well as in terms of food security. Local food production
meets less than a quarter of local food consumption needs and food security could be enhanced
through regional markets integration. Also, increasing the competitiveness and productivity of
the domestic agricultural sector could mitigate the impact of food price shocks on poverty.
Mauritius’ agriculture vision aims at the development of small and medium sized agribusiness
firms, concentrating on safety, supply, quality, innovation and new technology, while supporting
the capacity of large operators in agriculture and agribusinesses to diversify into the Africa region.
73. To achieve its vision for agriculture, Mauritius faces a number of obstacles. First, a
comprehensive marketing strategy with modern market facilities is needed. Second, there will be
a 30-40 percent reduction in sugar prices as part of the reform of the EU Sugar Regime, placing
severe constraints on the sector. Also, the country remains very exposed to global food prices as
it imports about 75 percent of its food, amounting to 19 percent of the country’s total imports
bills. An increasingly dense population with scarce land and other natural resources available will
further limit potential interventions. The sector remains fragmented with a substantial number of
46 There are around 20 or so such schemes, which now provide grants, credit facilities and/or equity for SMEs either through the
Restructuring Working Group, SME agencies, or commercial banks. 47 Of this, sugar accounted for 90 percent, tea 1 percent and other crops around 9 percent in 2002.
37
small planters and limited investments in innovation and technology further undermining its
productivity.
74. With increased global competition and limited land resources, Mauritius needs to
rethink how to revamp its limited landscape. As the country is expected to diversify out of
sugar production, this will open up opportunities to move towards an agricultural sector that is
“Climate-Smart” and “Nutrition Sensitive.” These approaches would embed all pillars of
sustainable development: economic, social, and environmental. 48 With the right level of
investments, knowledge, and partnerships, the sector can cater to the local population, diversify
regionally and internationally, and protect the natural capital of Mauritius. Some potential
approaches include:
Further and fully integrate the agro industry into “strategic clusters” with more focus on
inclusive growth. These can be established for selected strategic commodities such as vegetable
and fruit production as growth poles within targeted agro-ecological zones. The cluster
approach enhances delivery of essential services, exploitation of economies of scale,
development of required infrastructure, bulking of produce, agro-processing and reduction of
transaction costs. The project can target specific crops as strategic commodities for
consumption and for export to the regional markets. Importantly, it can help increase the
incomes of small farmers.
Move towards a regional landscape and oceanscape, positioning agriculture and fishery
production in the global industry (especially for African, Asian and Arab markets). Mauritius
is looking forward to contributing toward a regional development agenda by investing in the
region, as evidenced by investments in Mozambique, Gabon and other places. Policies and
actions have room for more regional initiatives with strong public and private sector focus –
all with international exposure and context. More analysis is needed to understand the current
and future business risks to the private sector and to investors.
Increase scale to gain productivity and push for “Climate Smart Agriculture.” Production of
a larger volume of quality food-crops (and high-added value) to satisfy the growing needs of
tourists and the population. Such efforts can also target niche export and foreign markets,
reducing the cost of production through increased productivity per unit area of land and per
unit cost of investment. This could be supported by innovative ways of reducing land costs and
modernizing and expanding its port system to cater for international needs. Also, “Climate
Smart Agriculture” could be pushed where productivity, resilient yields and carbon storage
feature prominently.
“Nutrition Sensitive” products and diversification toward quality of products and services.
Mauritians suffer from high rates of Non-Communicable Diseases with substantial costs on
the economy. As income per capita grows, the local production will need to shift toward more
healthy and quality food production to meet the demands of a population increasingly aspiring
to a healthier life style.49
Strengthening the Water-Food-Energy Nexus: Irrigation systems are already highly vulnerable
to climate change due to the high dependence on groundwater resources, periodically rendered
48 E.g. Economic – high-end product and services, higher yields/return; Social – insurance programs for farmers, better income for
agricultural jobs, improved food quality for all; and Environmental – resilient products, containment of climate change, etc. 49 Although the level of malnutrition is low by regional standards—around 8 percent of children are underweight and 6 percent are
undernourished, while obesity rates have risen to 10 percent for men and 20 percent for women—malnutrition is in the upper range
for a middle-income country.

38
unusable by saltwater intrusion in groundwater aquifers. 50 Water resources management
should be an essential element of climate smart approaches to agriculture in Mauritius,
important both for the food security prospects of Mauritius and for future drinking water
availability as well as strategic energy security.
Build resilience and responsiveness to natural hazards. Produce food and agricultural products
that are resilient to climate change to protect the environment, such as soil conservation and
prevention of landscape degradation.
Create high added-value products, support innovation and technology. Mauritius can
capitalize on safe and reliable phytosanitary institutions to produce products that are of high
added value. This will require attracting know-how, developing relevant skills and investing
in new technologies, R&D and capacity building.
The ocean economy can bolster economic growth and employment creation
75. The ‘Ocean Economy’ can become a major pillar of Mauritius’ future development
if the right frameworks for the management of ocean resources are put into place in a
sustainable, inclusive, and smart way. 51 The potential of the Mauritian Ocean Economy –
focusing on growth, sustainability, and protection of natural-capital – is enormous for growing
the GDP, creating jobs, sustainable livelihoods and raising real incomes and standards of living
for all. The ocean territory contributes significantly to the wealth of Mauritius. The GDP share
has been estimated at 10.8 per cent in 2012, of which over 90 per cent comes from three
established sectors – coastal tourism and marine leisure, seaport-related activities, and seafood-
related activities. These three sectors have significant scope for future growth. In the coastal
tourism cluster, business opportunities in the currently under-developed marine leisure activities
could quadruple the sector GDP contribution by 2025, bringing its share at par with global
benchmarks.52 Seafood-related activities could also expand with new players entering in the
fisheries sector and expanding in the aquaculture sub-sector. Seaport-related activities could be
expanded, including in areas such as ship repair and maintenance, and bunkering services.
76. New sectors associated with the ocean economy can further bolster contribution of
the ocean to economic development in Mauritius and in the region. The economic potential
of the ocean includes the exploitation of living and non-living resources in Mauritius’s waters, on
the seabed and in the subsoil. This could unlock large opportunities for Mauritius and some of its
neighboring island-states in several key areas such as: fisheries and seafood hubs, energy and
petroleum, land and sea transportation, cargo and port services, sustainable tourism, food and
50 Looking to the future, a structural shift away from sugar cultivation and reorientation toward high-value products will need to
take into account the increasing variability of freshwater availability for irrigation as rainfalls become more erratic and the sea level
rises. Prudent groundwater management, based on integrated groundwater management planning with appropriate supporting
institutions and monitoring and enforcement of water quality and use can significantly reduce the risks of saltwater intrusion in
groundwater. 51 There has been a focus on strengthening country institutions for managing ocean resources and use, particularly the transition to
more sustainable fisheries, establishing coastal and marine protected areas, waste management and infrastructure, and
implementing integrated coastal and marine ecosystem management. Moving forward, a coordinated global effort is needed to
improve the health of the world’s oceans and the benefits they provide to the global economy and human welfare. This is an area
where Mauritius’ leadership could be very useful. 52 “Ocean Economy: A Roadmap for Mauritius” (December 2013) prepared by the National Task Force on the Ocean Economy.
39
agriculture security, transfer of knowledge, and preservation of natural capital. Some of these
opportunities and gains include the following activities:
Logistics: Including the development of an Ocean Business Park53 which would provide
earmarked space for ocean-related developments, especially for the early phases of the Deep
Ocean Water Application downstream activities. Also, Mauritius could become a major hub
in the region for petroleum products, container transshipment and port services, and could
support strategic energy security for the Indian Ocean.
Seafood processing hub, along with aquaculture: Raising economic growth and providing
a secure, nutritious, and safe food security system.54 Furthermore, diversification could take
place in areas such as pearl culture, pharmaceuticals, anti-cancer research, etc.
Tourism and ocean-based leisure sectors: Focusing on Mauritius’s ecosystem and
biodiversity, local assets, cultural heritage, traditional and cultural expression as well as
diversifying around sustainable tourism, cruise tourism and sea sports.
Ocean industry: Developing a world class oceanographic Centre of Excellence devoted to the
Ocean Economy for Small Island Developing States (SIDS) - combining research, business
and applications.
The fisheries sector is moving toward industrialization but with high relevance for poverty
reduction
77. The fisheries sector is a low contributor to the Mauritian GDP, but has a key role in
poverty alleviation. Direct fisheries’ contribution to GDP has been stagnating at around 1-2
percent in the past few years. However, the entire fisheries value chain, including fish processing
and marketing, represents around 4 percent of GDP.55 Seafood exports, including re-export,
amounted to US$460 million in 2013, accounting for close to 20 percent of total annual exports.
The seafood industry alone has had US$560 million in investments since 2000 and is also a solid
transshipment activity accounting for 50,000 tons per year and is expected to increase gradually
to 70,000 tons. There are also two tuna canneries employing 5,000 workers from the poorest
social classes of which 60 percent are Mauritian employees producing 33,000 tons of canned tuna
annually. Finally, artisanal fisheries play a key role in poverty alleviation as there are about 3,200
registered artisanal fishers in Mauritius, 44 percent of which are in Rodrigues.56
78. With artisanal fisheries reaching their limits, there is a need to reorient further the
fisheries sector toward higher value-added activities. Artisanal fisheries provide an important
source of unskilled job and represents half of the domestic production and exclusively feeds the
domestic market. Artisanal fisheries (lagoon and off-reef) are fully exploited in Mauritius and
Rodrigues and there is limited room for expansion of the tuna fisheries by domestic boats.
Nonetheless, the expansion of the sector has strong economic potential, including for poverty
reduction, in several areas:
53 This could include a (i) Marine Economic Zone with floating hotels, undersea tourist attractions, cruise and marina industries,
marine entertainment, etc.; (ii) Industrial Marine Economic Zone with high-tech fishing facilities and activities, high-tech “Marine
Zone Franche”, development of crustacean and algae industries, mariculture and high-value aquaculture. 54 Furthermore, Mauritius and other countries in the region can improve food security in East Africa (with strong focus on fisheries
and aquaculture) given Mauritius’s distance from continents and freedom from epizooties. 55 Total fishing, seafood processing and aquaculture output was estimated at 178,500 tons in 2013, equivalent to US$500 million. 56 In addition, several thousand fishers are unregistered, including fishers on foot or gleaners who are among the most marginalized.
40
Develop artisanal fisheries value-chains that have promising income generation potential for
the poor, particularly in Rodrigues. While controlling access to the fisheries to avoid
overexploitation, developing value chains and higher value-added activities is important to
increase the economic benefits of artisanal fisheries and reduce poverty among fishing
communities. Artisanal fishing aggregating devices (FADs) and mariculture are developing
rapidly.57 However, the sector is still constrained by: (i) lack of adequate cold storage and
processing facilities that depend on private commercial initiatives, usually discouraged by
uncertainty or irregularity of fish catch, which could be partially mitigated by mariculture;
(ii) access to finance; (iii) commercialization; and (iv) food safety and quality practices.
Increase industrial aquaculture fish production for internal consumption, exports and job
creation and explore links with small scale operators. The current industrial aquaculture
production is 500 tons and employs around 120 workers, mainly driven by one private
operator. The sector is highly capital intensive and the private sector has requested significant
financial support from the government. Proactive government policies to adopt a clear legal
framework, especially with respect to environmental guidelines, are essential to attract
technology and feed inputs at competitive prices that could expand production to 8,000 tons
by 2020 and employ around 500 workers while developing a sustainable marine aquaculture.
Inclusive growth in the exploitation of marine aquaculture should be promoted by the
government to reduce conflict of interest between the new company and local fishers.
Exploring aquaculture out-grower schemes linking small operators to large companies could
serve this objective, as Brazil has shown (Box 7).
Develop the industrial sub-sectors to strengthen the seafood hub, expanding the region’s fish
value-chain through transshipment, transformation, processing, and commercialization, and
subsequently increase value-added retention in the region. Industrial fishing in Mauritian
waters is mainly conducted by foreign fleets.58 Given insufficient resources in Mauritian
waters, the development of the seafood hub will require increasing access to the region’s
resources and will likely raise intra-regional competition if not managed adequately.
Sustainable access to final markets will also require greater attention to export certification for
capture and sanitary regulation. There is a huge potential for further growth in the seafood
sector and associated activities, with positive spinoffs in terms of jobs and revenue associated
with port activities and FDI in the sector. The government should continue strengthening its
seafood sector policy and develop robust economic monitoring to ensure benefits are
effectively captured by the local economy.
Expanding the semi-industrial sector, revitalized by the emergence of the demersal fisheries
bank. The potential of Mauritius fisheries bank is limited to 3,000 tons per year or around 30
percent of total domestic fish consumption. However, the resource has been moderately
exploited at about two thirds of its potential due to equipment obsolescence and administrative
constraints faced by the fishing companies. On the other hand, the discovery of a new deep-
water snapper fishery on the Nazareth Bank is reviving the semi-industrial sector, with an
estimated potential production of 1,500 tons per year, compared to 700 tons currently caught.
57 Twenty-four artisanal FADs are maintained off the shore of Mauritius, involving approximately 400 artisanal fishers and
producing around 400 tons annually, and consequently reducing pressure on near-shore stocks. Artisanal mariculture is increasingly
considered an alternative to capture fisheries and could support alternative livelihoods for fishing communities, avoiding new
entrants in the catch fisheries, supporting reduction of fishing effort and feeding the local seafood market. 58 Approximately 250 licenses are sold every year, generating close to US$1.4 million in fees annually.
41
Further linking the fishing sector to the Mauritian tourism sector. Sport fishing is an important
tourism activity that supplies the local market with an additional estimated 350 tons of fish
annually. More importantly, various international big game fishing competitions are held every
year in Mauritius and bring revenue from tourism to the local economy. This calls for closer
attention to resource health, which requires regional coordination due to the migratory behavior
of large game fishes. The progressive development of ecotourism is directing greater attention
to traditional and artisanal fishing activities and cultural values, and is a way of promoting
tourism benefits for fishing communities.
Manufacturing is increasing its productivity at the cost of shedding jobs
79. The textile sector continues to face considerable challenges. Manufacturing still
accounts for around a quarter of GDP compared to an average of over 21 percent in middle-
income countries and employs around 9.2 percent of the Mauritian labor force in 2013. The textile
industry is the main subsector representing 4.9 percent of GDP and employing 53,000 workers,
18,515 of them foreign workers in 2013 (Figure 62 & Figure 63). The sector has made substantial
improvements in productivity at the cost of shedding jobs. However, the profitability of the textile
industry falls short compared to the average profitability of Mauritian firms in other sectors.
80. The existing manufacturing composition may undermine prospects for further
diversification of export goods. As noted in Hausmann and Hidalgo (2010),59 the garment
industry does not necessarily facilitate a country’s expansion of exported goods. Furthermore, the
textile sector faces the possibility that duty- and quota-free access to the United States under
AGOA could expire in 2015 for a range of goods. Also, if the United States opens preferential
access to Asian countries, competition will further increase. This would make it difficult to build
on the existing textile sector to diversify into new manufacturing areas. In this case, there would
59 Ricardo Hausmann and César A. Hidalgo “Country diversification, product ubiquity, and economic divergence,” CID Working
Paper No. 201, October 2010. The paper noted that availability of certain capabilities in a country can be inferred from export
data.
Box 7: Brazil aquaculture - A success story
Aquaculture has grown substantially in Brazil to meet domestic and international demand for Brazilian
fish and seafood that exceed capture production. Total aquaculture production has increased from
approximately 30,000 tons at the beginning of the 1990s to 176,000 tons by 2000, and 944,000 tons in
the first nine months of 2013. As a result, aquaculture has increased from 4.3 percent of total fish
production in 1994 to 38 percent in 2013.
With the creation of the Special Secretariat of Aquaculture and Fisheries in 2003 and the subsequent
establishment of clear rules for lease permit and environmental licensing, the aquaculture sector has
attracted considerable private investment and increased production and job creation. Brazil currently
has 16,000 aquaculture enterprises officially registered, 1,000 percent more than five years ago. The
sector is predominately based on small-scale farming units and employs 100,000 self-employed
farmers, often integrated with other agriculture production activities by small-scale farming enterprises.

42
be an impact in terms of access to know-how and skill spillovers in the manufacturing sector,
which may drag the growth potential of Mauritius down in the medium term.
Figure 62: GDP by manufacturing group, % of
GDP, 1999-2013
Source: Statistics Mauritius
Figure 63: Employment in the manufacturing
sector, 2000-2013
Source: Statistics Mauritius
The tourism sector: excess capacity and domestic constraints
81. The tourism sector has been severely hit by adverse economic shocks in Europe,
compounded by overcapacity and loss of competitiveness. Tourism represents 7 percent of
GDP and 5 percent of total employment in 2012. This is after tourism suffered substantially as a
result of the 2008 global financial crisis and the subsequent European sovereign debt crisis, which
struck hard at the country’s main tourism markets. Arrivals from these markets have been on a
downward trend and only partially offset by arrivals from emerging partners including China, India and
South Africa. Overall, arrivals are well below what the 2002 Tourism Development Plan projected:
2 million tourist arrivals in 2014 as opposed to actual arrivals of just 1 million (Figure 64). This
has resulted in increased competition for fewer tourists and the subsequent stagnation of earnings
per tourist (Figure 65).
Figure 64: International tourism (Number of
arrivals)
Source: WDI
Figure 65: Tourism receipts per tourist
Source: WDI
82. Mauritian tourism is becoming increasingly expensive, possibly reducing demand.
The cost of accommodation and transport in Mauritius are expensive in comparative terms (Figure
66). The limitations in air transport connectivity especially lead to higher access and egress costs,
and raise concern about price competitiveness (Figure 67). Based on a price elasticity estimated
0
5
10
15
20
25 Sugar
Food exc Sugar
Other
Textiles
0
20,000
40,000
60,000
80,000
100,000
120,000
140,000
160,000
Foreign Workers Domestic workers
0.0
0.5
1.0
1.5
2.0
2.5
20
00
20
01
20
02
20
03
20
04
20
05
20
06
20
07
20
08
20
09
20
10
20
11
20
12
Inte
rn
ati
on
al
tou
ris
t a
rriv
als
(mil
lio
n)
Bahamas Sri Lanka
Mauritius Maldives
Seychelles
0
20
40
60
80
100
120
140
160
180
20
02
20
03
20
04
20
05
20
06
20
07
20
08
20
09
20
10
20
11
20
12
To
uris
m r
eceip
ts p
er
tou
ris
t
(20
02
=1
00
)
Bahamas
Mauritius
Sri Lanka
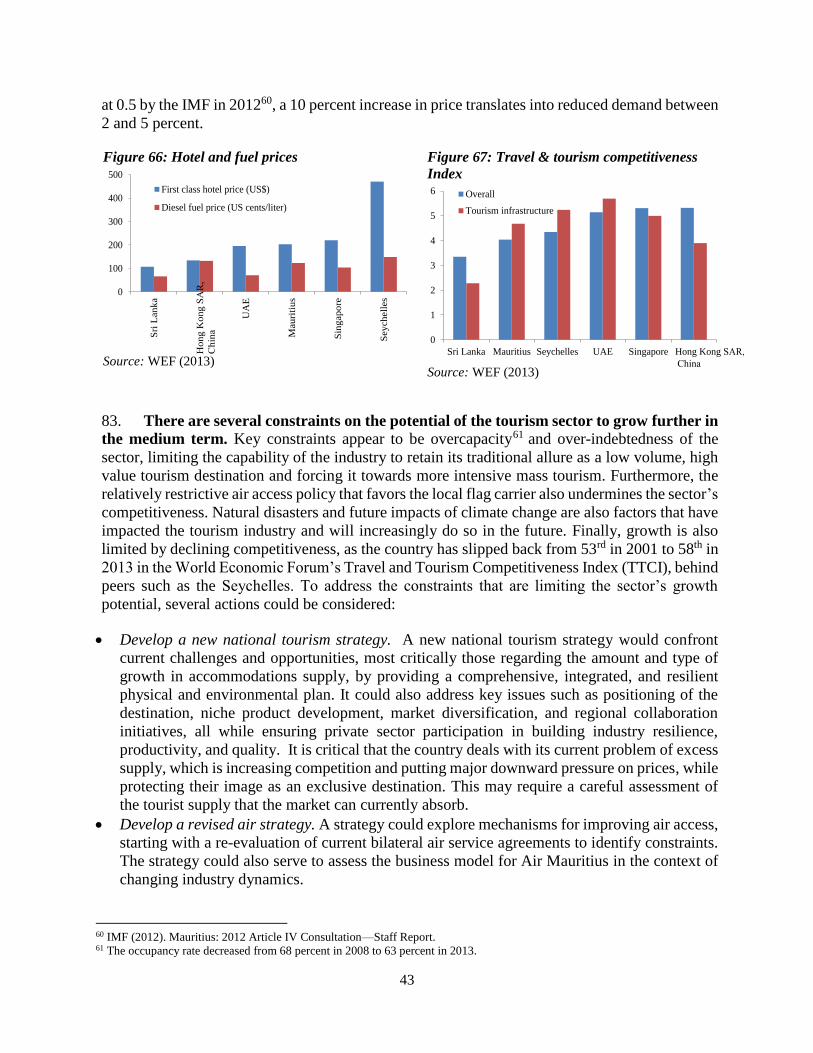
43
at 0.5 by the IMF in 201260, a 10 percent increase in price translates into reduced demand between
2 and 5 percent.
Figure 66: Hotel and fuel prices
Source: WEF (2013)
Figure 67: Travel & tourism competitiveness
Index
Source: WEF (2013)
83. There are several constraints on the potential of the tourism sector to grow further in
the medium term. Key constraints appear to be overcapacity61 and over-indebtedness of the
sector, limiting the capability of the industry to retain its traditional allure as a low volume, high
value tourism destination and forcing it towards more intensive mass tourism. Furthermore, the
relatively restrictive air access policy that favors the local flag carrier also undermines the sector’s
competitiveness. Natural disasters and future impacts of climate change are also factors that have
impacted the tourism industry and will increasingly do so in the future. Finally, growth is also
limited by declining competitiveness, as the country has slipped back from 53rd in 2001 to 58th in
2013 in the World Economic Forum’s Travel and Tourism Competitiveness Index (TTCI), behind
peers such as the Seychelles. To address the constraints that are limiting the sector’s growth
potential, several actions could be considered:
Develop a new national tourism strategy. A new national tourism strategy would confront
current challenges and opportunities, most critically those regarding the amount and type of
growth in accommodations supply, by providing a comprehensive, integrated, and resilient
physical and environmental plan. It could also address key issues such as positioning of the
destination, niche product development, market diversification, and regional collaboration
initiatives, all while ensuring private sector participation in building industry resilience,
productivity, and quality. It is critical that the country deals with its current problem of excess
supply, which is increasing competition and putting major downward pressure on prices, while
protecting their image as an exclusive destination. This may require a careful assessment of
the tourist supply that the market can currently absorb.
Develop a revised air strategy. A strategy could explore mechanisms for improving air access,
starting with a re-evaluation of current bilateral air service agreements to identify constraints.
The strategy could also serve to assess the business model for Air Mauritius in the context of
changing industry dynamics.
60 IMF (2012). Mauritius: 2012 Article IV Consultation—Staff Report. 61 The occupancy rate decreased from 68 percent in 2008 to 63 percent in 2013.
0
100
200
300
400
500
Sri
Lanka
Hong K
ong S
AR
, C
hina
UA
E
Mauri
tius
Sin
gapo
re
Seychell
es
First class hotel price (US$)
Diesel fuel price (US cents/liter)
0
1
2
3
4
5
6
Sri Lanka Mauritius Seychelles UAE Singapore Hong Kong SAR, China
Overall
Tourism infrastructure

44
Diversify markets. To continue the concerted effort to increase arrivals from emerging markets,
a study could examine potential markets in terms of size growth trends, number of visits to
competitor countries, accessibility, and compatibility with current markets.
Improve skills. As competition from cruise lines and hotels elsewhere in the region increases,
stakeholders have reported skills shortages with impacts on the quality of service, increasing
costs, and the need to hire foreign workers. The country’s principal tourism training institute
only meets half of the demand for its courses (1,500 slots for 3,000 applicants) which calls for
strategic investment in training to increase the quantity and quality of the country’s tourism
workforce and position the country as a regional training center for the Africa region.
Reinforce regional tourism cooperation. Cooperation among Indian Ocean tourism
destinations has increased in the past year, largely through the Vanilla Islands Organization.
Mauritius could further benefit from the synergies it creates, including marketing in emerging
destinations, promotion of cruise tourism to the region, and cooperation in other areas such as
training, standards, and air transport.
The financial services sector: increasing value added to become a regional financial center
84. Financial services have expanded as a result of successful financial liberalization and
double taxation agreements. The financial and insurance sectors make up 9 percent of GDP and
employ over 13,400 people, equivalent to around 2.3 percent of the total labor force in 2013. The
sector took off when the government established an offshore financial center in 1989 that has
constantly modernized its legal and regulatory infrastructure in line with global trends. The
success of the financial center is mainly due to its growing Double Tax Agreement (DTA)
network supported by Investment Promotion and Protection Agreements. Since 1994, Mauritius
also has a well-capitalized stock exchange with foreign investors accounting for 40 percent of
daily trading.62 Overall, offshore business represents more than half of banks’ deposit and loan
books in Mauritius.63
85. Reforms in 2006 eliminated the distinction between offshore and onshore banking,
further supporting the development of the sector. Until 2006, there were two separate banking
regimes, offshore and onshore, with only about ten offshore banks admitted in Mauritius. In 2006,
the Banking Act was amended such that all banks were governed by one single banking license
under supervision of the central bank. The domestic banking sector is large in relation to the size
of the economy and banks’ total assets as a percentage of GDP increased from 272 percent to 280
percent over the past five years. Assets held by domestic-owned banks represent 42 percent of
total banking sector assets while subsidiaries and branches of foreign-owned banks held 51
percent and 7 percent of total assets, respectively. Banks dominate the allocation of credit as they
account for around 97 per cent of total credit in the country.
86. Mauritius is facing challenges due to its renegotiation of the double taxation
agreement with India. Mauritius accounted for 42 percent (US$54 billion) of total FDI to India
from 2001 to 2011. The main concern for the sector is the request of India to revise the DTA
agreement to impose more stringent conditions and prevent companies from using the Mauritian
62 Market capitalization of Mauritius’ stock market is 70 percent of GDP compared to 52 percent of GDP for upper middle-income
countries and 111 percent of GDP for high-income countries. 63 There are 23 licensed banks in Mauritius which cater to domestic and offshore businesses.

45
jurisdiction merely for tax purposes. The on-going negotiations have already created uncertainty
that has adversely affected investment flows between the two nations.64 Furthermore, companies
incorporated in Mauritius will need to show that they have a substantial presence in the country
to benefit from the treaty, which will require them to increase the types of services offered as well
as the number of service providers in Mauritius.
87. Mauritius is facing challenges due to increased regulations and competition from
emerging jurisdictions. Mauritius ranks 63rd globally in the latest Global Financial Centers
Index. Future growth drivers of the financial sector will come from the provision of higher value
services but sector development is constrained by several factors including its international
positioning. The available talent pool needs to further deepen its expertise in a range of
sophisticated financial products and services. Cross-border exposures of domestic banks remain
significant and require prudent supervision, removing existing regulatory gaps and strengthening
institutional capacity for effective regulation. Development of related sectors, such as insurance,
is constrained by limited investment opportunities in a small domestic market and competition is
largely focused on the existing business, rather than the development of new markets. However,
in pursuit of its internationalization strategy, the stock exchange aims to gradually move from an
equity-based domestic market to a multi-product internationally oriented one. This would serve
to move products listed/traded on the stock exchange up the value-chain.
The ICT sector: Employment creation is constrained by limited broadband and available skills
88. The Government strategy to develop the ICT as a major pillar of the economy has
translated into substantial employment and firm creation. The strategy has focused on
providing an enabling environment with a solid regulatory framework that promotes
infrastructure deployment and attracts foreign investment to the country. As a result, the sector
has experienced remarkable growth over the past decade, and around 600 ICT companies
currently operate in Mauritius with annual turnover of around US$1 billion and 18,500 employees
in 2013 or 3.2 percent of the total workforce.65 In addition, around US$41 million of FDI has
been attracted into the sector since 2010. Given Mauritius’ ability to service both French- and
English-speaking export markets, business process outsourcing (BPO) has become a particularly
strong segment of the ICT sector with an annual average growth of 14 percent in the 2004-2012
period and around 330 active companies.
89. The government has expanded the international fixed broadband market, which is
key for Mauritius’ BPO sector and other ICT foreign investments. Over the last 12 years,
Mauritius’ supply of international bandwidth has increased through its links to three submarine
cables.66 The government liberalized access to the international landing station, allowing new
players to offer international bandwidth at much lower rates. As a result, the country’s outgoing
64 According to figures compiled by Financial Services Commission (FSC), the share in the number of investments made by global
business companies into India slumped to 15.9 percent in 2012 from 32.2 percent in 2010. 65 The sector includes activities such as software development, call centers, business process outsourcing (BPO), IT-enabled
services, web-enabled services, training, hardware assembly and sales, networking, consultancy, multimedia development, disaster
recovery, and other support services. 66 Since 2002, Mauritius has been linked with Southern Africa and South Asia through the SAFE (MT-backed) cable, since 2009
it has been linked with Madagascar through the first cable of the Lower Indian Ocean Network (LION-1, Orange-backed) and
indirectly to the Eastern African Submarine System (EASSy) cable, and since 2012 it has been linked with Kenya through the
LION-2 cable.

46
international internet bandwidth has increased six-fold over the period 2009-2013 to reach
11.64Gbps in 2013. In addition, Mauritius’ total international bandwidth capacity stood at nearly
23Gbps in 2013, helping to drive demand for BPO, call centers, international voice traffic, mobile
data services, and internet access in Mauritius, all of which are areas the country intends to foster
in the medium term.
90. Despite its considerable potential for growth, the ICT sector is showing signs of
deceleration. Based on the sector’s strong performance during the decade the government
expects that the ICT/BPO sector will contribute 7 percent of GDP by 2014. Yet, a recent
slowdown in sector growth has kept ICT’s contribution to GDP around 6.4 percent since 2010
with a slight decline to 6.3 percent in 2013. This is largely associated with constraints in
broadband tariffs and lack of available skills.
91. Mauritian broadband market remains relatively modest. While international
bandwidth usage in Mauritius grew by 62 percent in 2009-2013, other more liberal markets such
as Kenya grew by 173 percent over the same period (Figure 68 & Figure 69). Thus, although
Kenya’s bandwidth utilization was about twice that of Mauritius in 2009 it then grew to more
than ten times in 2013, giving Kenya a competitive advantage over Mauritius in terms of lower
wholesale bandwidth prices and therefore capacity to attract BPO traffic.
Figure 68: International bandwidth, 2009
Source: TeleGeography
Figure 69: International bandwidth, 2013
Source: TeleGeography
92. If Mauritius wishes to increase the sector’s contribution to GDP, it will need to
address a persistent and growing mismatch between workers’ skills and market needs. The
number of employees needed in the IT/BPO sector is projected at around 18,000 in 2014 and
19,000 in 2015, a significant increase over current levels.67 Employers confirmed that the ICT
sector is facing a labor shortage that is expected to continue or worsen over the next five years.
Key to this was lack of sufficient work experience and qualifications in both technical and soft
skills. Employers complain that neither the training nor the education systems meet market
demands. Government efforts, such as the establishment of an ICT Academy or the ICT Skills
Development Programme have had limited impact as they have yet to meet market needs.
93. The ICT sector may have reached a plateau in terms of the productivity gains that
additional workers can provide and may require workers with more advanced ICT skills.
67 The Human Resource Development Council conducted a study in 2011 among ICT employers in Mauritius on the labor shortage
in the IT/BPO sector.
0
500
1000
1500
2000
2500
3000
35002009
0
20,000
40,000
60,000
80,000
100,000
120,000
140,000 2013

47
New entrants in the Mauritian ICT/BPO sector are turning away from BPO and toward
information processing outsourcing (IPO). 68 For the ICT sector to drive further growth,
Mauritius’ needs to promote higher ICT value services,69 which may require as many as 11,000-
15,000 additional ICT-skilled jobs. This increased contribution of ICT to economic growth
through additional value added will need to overcome also many of the innovation constraints
identified in previous sections.
94. Mauritius can overcome its current regulatory and skills mismatch constraints to
boost ICT employment and GDP growth. A full rollout of broadband with competitive national
and international tariffs combined with a more highly skilled workforce could not only drive
greater ICT sector growth but also boost Mauritius’ efforts to reach high-income status.
Four areas seem particularly relevant to overcome current constraints and seize all ICT
opportunities:
Legally authorize a new licensing regime to promote further market entry. This regime could
consist of two main license types: facilities-based operator (FBO) licenses, which would allow
an operator to deploy and operate telecoms networks, systems, and facilities for both local and
international traffic; and service-based operator (SBO) licenses, which would grant the holder
rights to lease telecom network elements from FBOs for the provision of services or for the
resale of such services to third parties.
Unbundle the local loop. This would allow both fixed and mobile operators to access the “last
mile” of the network owned and operated by the incumbent, Mauritius Telecom (MT), to allow
for supply-side substitution of fixed-line and fixed-wireless broadband in order to foster
competition, bring down prices, and increase the number of broadband subscribers overall.
Unbundling the local loop would also allow other operators besides MT to offer international
private-leased line circuits, thus further reducing tariffs for international bandwidth
connectivity and encouraging firms to invest in local loop networks to service retail markets
instead of just corporate customers, as they do currently. International examples show the
potential that smart regulation can have in further developing the ICT sector (Box 8).
Promote infrastructure sharing wherever possible. This would allow operators to connect to
already-existing broadband networks that may have been laid by other utilities such as oil, gas,
or electricity, and to share infrastructure for 3G and 4G networks.
More integrated and strategic training co-led by the Ministry of ICT, the Ministry of Tertiary
Education and the private sector, with priority given to the private sector’s needs. The skills
mismatch is embedded in larger constraints in the education sector, including the relative
decline in the number of students in the tertiary level enrolled in an ICT field from 12 percent
in 2006 to 7.3 percent in 2013.70 The government can create incentives for the ICT industry to
collaborate more closely with universities to reshape their ICT curriculum and close the
education-market gap by providing courses and degree programs that correspond to the ICT
industry’s needs. The industry should be allowed and encouraged to contribute with
consultants and foreign experts to provide specialized courses as needed. The degree programs
should also have fully integrated apprenticeships/internships along with job placement and
68 Joseph and Troester (2013), p. 79. 69 This includes services such as accounting, R&D, finance, law, medicine, tourism, cloud computing, collection centers for
knowledge processing outsourcing (KPO), and data analytics and research. Joseph and Troester (2013), pp. 85, 87. 70 http://www.gov.mu/portal/sites/indicators/stats_Manpower.html

48
performance follow-up for graduates. Outside of the tertiary sector, the government could
incentivize the private sector to co-create and offer high-level requalification and certification
programs for middle and senior ICT managers in order to quickly boost their skills.
Creation of a stronger innovation ecosystem in Mauritius to stop brain drain and drive the
increase of higher value-added ICT jobs. In this regard, the government could use high-tech
accelerators and mentorship programs in areas such as business support activities, engineering,
IT technical skills, entrepreneurship, and IT management as a new type of school for
entrepreneurs in business schools or other mainstream establishments. All this could be
coupled with widespread and targeted communication campaigns to highlight the prospects
and strong market demand for the IT and engineering professions.
Table 1: Main challenges identified for boosting competitiveness: moving from industrial policy to
innovation policy
Issue Impact on twin goals
Outdated industrial
policy
Cross subsidies and protection measures still support sectors facing strong competition
such as textiles, in part to maintain jobs. Yet this objective is not always fully met, for
example if there is a large proportion of foreign employment in those sectors. This hinders
the development of service sectors that often end up subsidizing less efficient sectors.
Sector specific
constraints
Sector constraints hold back the potential to accelerate investment, attract FDI, and create
employment. The constraints range from fragmentation in the agriculture sector to unclear
legal frameworks for the expansion of aquaculture, to limited regional cooperation in
support of tourism.
Inadequate
innovation policy
Inadequate intellectual property policies, institutions for R&D, and university and
enterprise collaboration hamper the capacity of the economy to absorb new technology
and increase the know-how content of FDI.
Constraints on
SME development
SMEs represent the majority of businesses in Mauritius but fail to create enough
employment or generate enough profits or exports. Their challenges include limited
access to finance as well as inadequate government support in areas such as accessing and
sustaining exports.
Limited amount
and quality of skills
Inadequate skills are holding back the potential of the economy to diversify and increase
competitiveness. This constraint also limits the inclusiveness of growth, as a large part of
the population cannot acquire these skills through education or training.
Constraints on
trade facilitation
and connectivity
Expanded capacity in airport, port and telecom infrastructure is undermined by policies
that constrain operational efficiency.
Box 8: The power of smart regulation and competition in fostering the ICT sector
Korea and Singapore are high-income countries and world broadband leaders. In 1995, Korea had less than 1
percent Internet penetration and Singapore had barely 3 percent. Both countries established strong regulators that
promoted brisk competition based on an open licensing regime, local loop unbundling, and robust infrastructure
sharing. Singapore actually required all operators to interconnect to each other’s networks to ensure seamless
communications throughout the country. Today, both countries have close to 100 percent fixed broadband
penetration as well as widespread mobile broadband penetration. Following the example of these economies,
Lithuania recently established a strong regulatory framework which expanded broadband household penetration
to 81 percent by end-2012, including FTTH deployment to 100 percent of households with connection speeds
between 30 Mbps and >100 Mbps.

49
Chapter 3. Supporting Inclusion
Main messages – Chapter 3
The government of Mauritius ensures that all citizens have access to basic assets and public services,
including universal health and education.
However, some gaps remain in terms of quality of services rendered, particularly in the education
sector, which is not on par with other upper middle income countries.
To compensate for quality gaps, households spend substantial amounts on private education (and
health).
As a result, outcomes of the educational system are very unequal and largely explained by
socioeconomic factors which feed an intergenerational poverty cycle.
Limited and inadequate provision of training cannot compensate for educational gaps.
Also, social assistance is fragmented and limited and, while partially able to compensate for limited
labor income, it cannot break the poverty cycle.
Employment creation remains subpar, with low labor force participation, substantial gender
discrimination, and high youth unemployment, reinforced in part by existing wage settling
mechanisms.
95. This section focuses on the capacity of all individuals in Mauritius to access, build, and
leverage assets to contribute to and benefit from productive growth. It focuses on the level and
equity of access and quality of key resources for asset-building, including:
1. Health
2. Basic services and utilities
3. Education and skills
4. Financial assets
5. Social protection
6. Labor markets and employment creation
96. The Government of Mauritius has invested heavily in ensuring all its citizens, regardless
of status or geography, have access to basic assets and public services, including health,
education, infrastructure, and social safety nets. As a general rule, coverage is broad, although
some gaps remain in the quality of the services delivered. Serious challenges remain in ensuring
quality and consistency of provision and efficiency of spending.
3.1. Health
Coping with NCD prevalence, system inefficiency, and out of pocket spending
97. Mauritius’ health system has achieved good results. Mauritius has a public system of
healthcare financed through general tax revenue that provides services with no user fees,
premiums, or other prepayment schemes. Nonetheless, households spend significantly on health
care in the private sector through health insurance and out-of-pocket payments for care and
treatment. As a result, private sector spending represents around half of total health sector
expenditure. Mauritius’ health indicators are slightly better than expected when compared to other
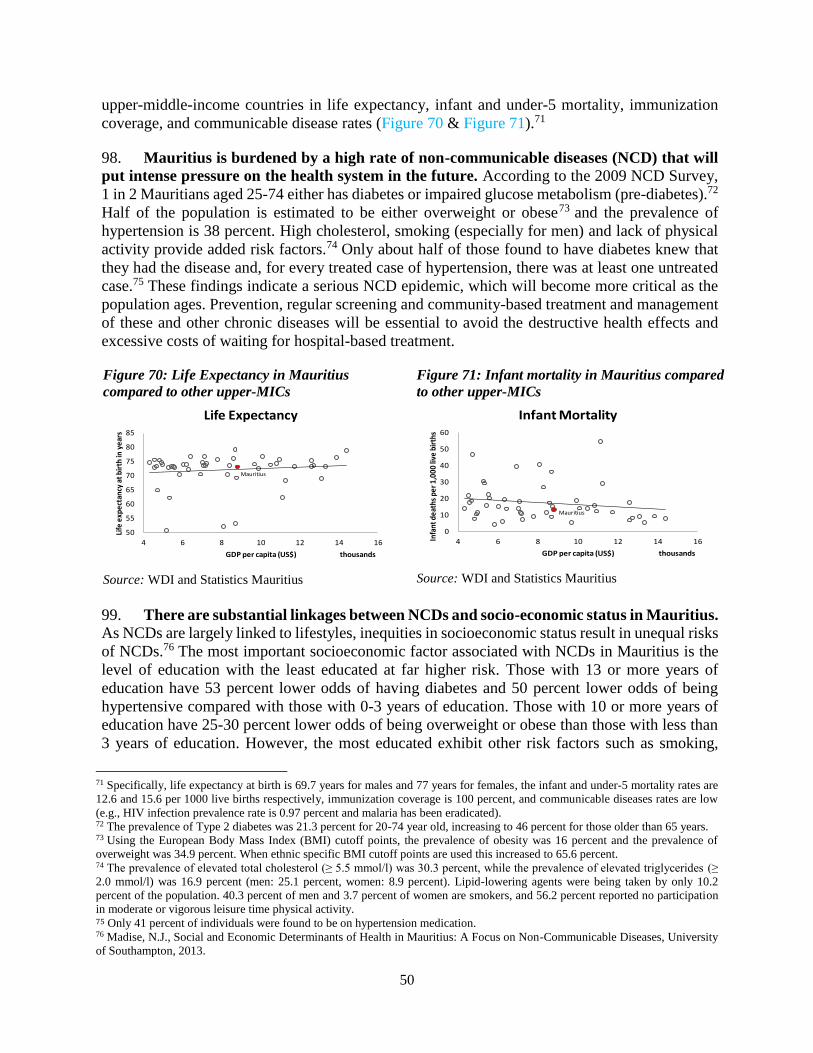
50
upper-middle-income countries in life expectancy, infant and under-5 mortality, immunization
coverage, and communicable disease rates (Figure 70 & Figure 71).71
98. Mauritius is burdened by a high rate of non-communicable diseases (NCD) that will
put intense pressure on the health system in the future. According to the 2009 NCD Survey,
1 in 2 Mauritians aged 25-74 either has diabetes or impaired glucose metabolism (pre-diabetes).72
Half of the population is estimated to be either overweight or obese73 and the prevalence of
hypertension is 38 percent. High cholesterol, smoking (especially for men) and lack of physical
activity provide added risk factors.74 Only about half of those found to have diabetes knew that
they had the disease and, for every treated case of hypertension, there was at least one untreated
case.75 These findings indicate a serious NCD epidemic, which will become more critical as the
population ages. Prevention, regular screening and community-based treatment and management
of these and other chronic diseases will be essential to avoid the destructive health effects and
excessive costs of waiting for hospital-based treatment.
Figure 70: Life Expectancy in Mauritius
compared to other upper-MICs
Source: WDI and Statistics Mauritius
Figure 71: Infant mortality in Mauritius compared
to other upper-MICs
Source: WDI and Statistics Mauritius
99. There are substantial linkages between NCDs and socio-economic status in Mauritius. As NCDs are largely linked to lifestyles, inequities in socioeconomic status result in unequal risks
of NCDs.76 The most important socioeconomic factor associated with NCDs in Mauritius is the
level of education with the least educated at far higher risk. Those with 13 or more years of
education have 53 percent lower odds of having diabetes and 50 percent lower odds of being
hypertensive compared with those with 0-3 years of education. Those with 10 or more years of
education have 25-30 percent lower odds of being overweight or obese than those with less than
3 years of education. However, the most educated exhibit other risk factors such as smoking,
71 Specifically, life expectancy at birth is 69.7 years for males and 77 years for females, the infant and under-5 mortality rates are
12.6 and 15.6 per 1000 live births respectively, immunization coverage is 100 percent, and communicable diseases rates are low
(e.g., HIV infection prevalence rate is 0.97 percent and malaria has been eradicated). 72 The prevalence of Type 2 diabetes was 21.3 percent for 20-74 year old, increasing to 46 percent for those older than 65 years. 73 Using the European Body Mass Index (BMI) cutoff points, the prevalence of obesity was 16 percent and the prevalence of
overweight was 34.9 percent. When ethnic specific BMI cutoff points are used this increased to 65.6 percent. 74 The prevalence of elevated total cholesterol (≥ 5.5 mmol/l) was 30.3 percent, while the prevalence of elevated triglycerides (≥
2.0 mmol/l) was 16.9 percent (men: 25.1 percent, women: 8.9 percent). Lipid-lowering agents were being taken by only 10.2
percent of the population. 40.3 percent of men and 3.7 percent of women are smokers, and 56.2 percent reported no participation
in moderate or vigorous leisure time physical activity. 75 Only 41 percent of individuals were found to be on hypertension medication. 76 Madise, N.J., Social and Economic Determinants of Health in Mauritius: A Focus on Non-Communicable Diseases, University
of Southampton, 2013.
50
55
60
65
70
75
80
85
4 6 8 10 12 14 16
Life
exp
ect
ancy
at
bir
th in
ye
ars
GDP per capita (US$) thousands
Life Expectancy
Mauritius
0
10
20
30
40
50
60
4 6 8 10 12 14 16Infa
nt d
eath
s pe
r 1,0
00 li
ve b
irth
s
GDP per capita (US$) thousands
Infant Mortality
Mauritius
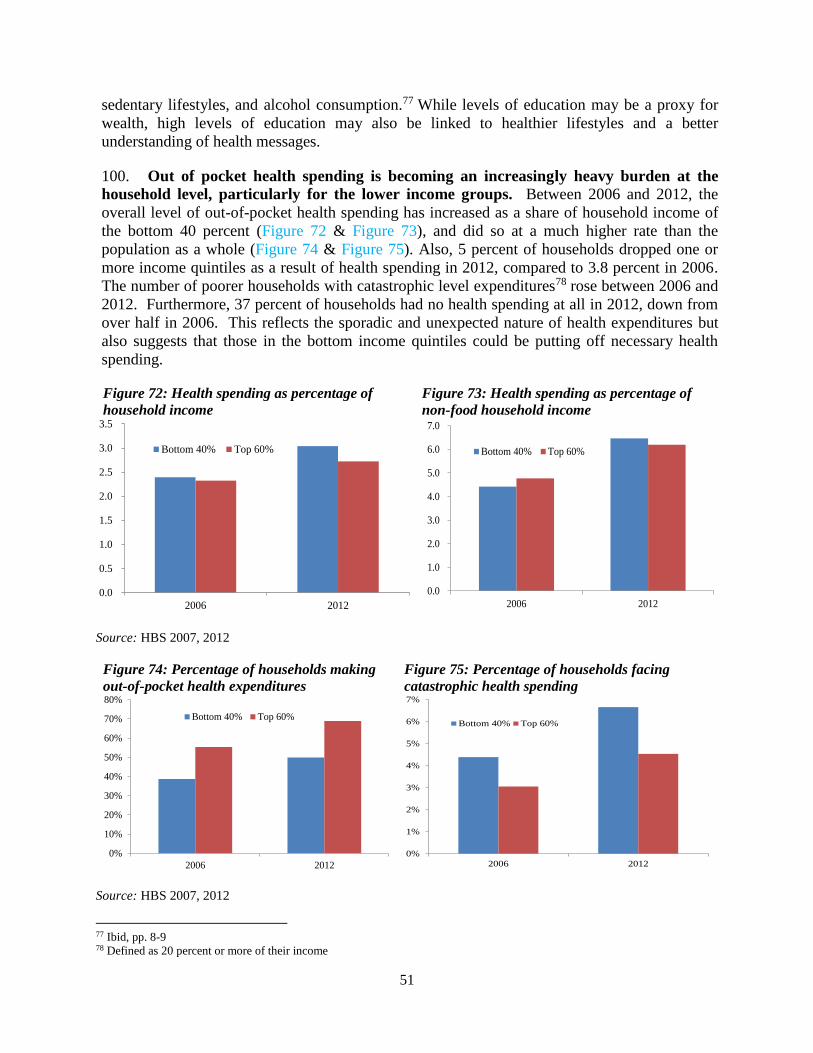
51
sedentary lifestyles, and alcohol consumption.77 While levels of education may be a proxy for
wealth, high levels of education may also be linked to healthier lifestyles and a better
understanding of health messages.
100. Out of pocket health spending is becoming an increasingly heavy burden at the
household level, particularly for the lower income groups. Between 2006 and 2012, the
overall level of out-of-pocket health spending has increased as a share of household income of
the bottom 40 percent (Figure 72 & Figure 73), and did so at a much higher rate than the
population as a whole (Figure 74 & Figure 75). Also, 5 percent of households dropped one or
more income quintiles as a result of health spending in 2012, compared to 3.8 percent in 2006.
The number of poorer households with catastrophic level expenditures78 rose between 2006 and
2012. Furthermore, 37 percent of households had no health spending at all in 2012, down from
over half in 2006. This reflects the sporadic and unexpected nature of health expenditures but
also suggests that those in the bottom income quintiles could be putting off necessary health
spending.
Figure 72: Health spending as percentage of
household income
Figure 73: Health spending as percentage of
non-food household income
Source: HBS 2007, 2012
Figure 74: Percentage of households making
out-of-pocket health expenditures
Figure 75: Percentage of households facing
catastrophic health spending
Source: HBS 2007, 2012
77 Ibid, pp. 8-9 78 Defined as 20 percent or more of their income
0.0
0.5
1.0
1.5
2.0
2.5
3.0
3.5
2006 2012
Bottom 40% Top 60%
0.0
1.0
2.0
3.0
4.0
5.0
6.0
7.0
2006 2012
Bottom 40% Top 60%
0%
10%
20%
30%
40%
50%
60%
70%
80%
2006 2012
Bottom 40% Top 60%
0%
1%
2%
3%
4%
5%
6%
7%
2006 2012
Bottom 40% Top 60%
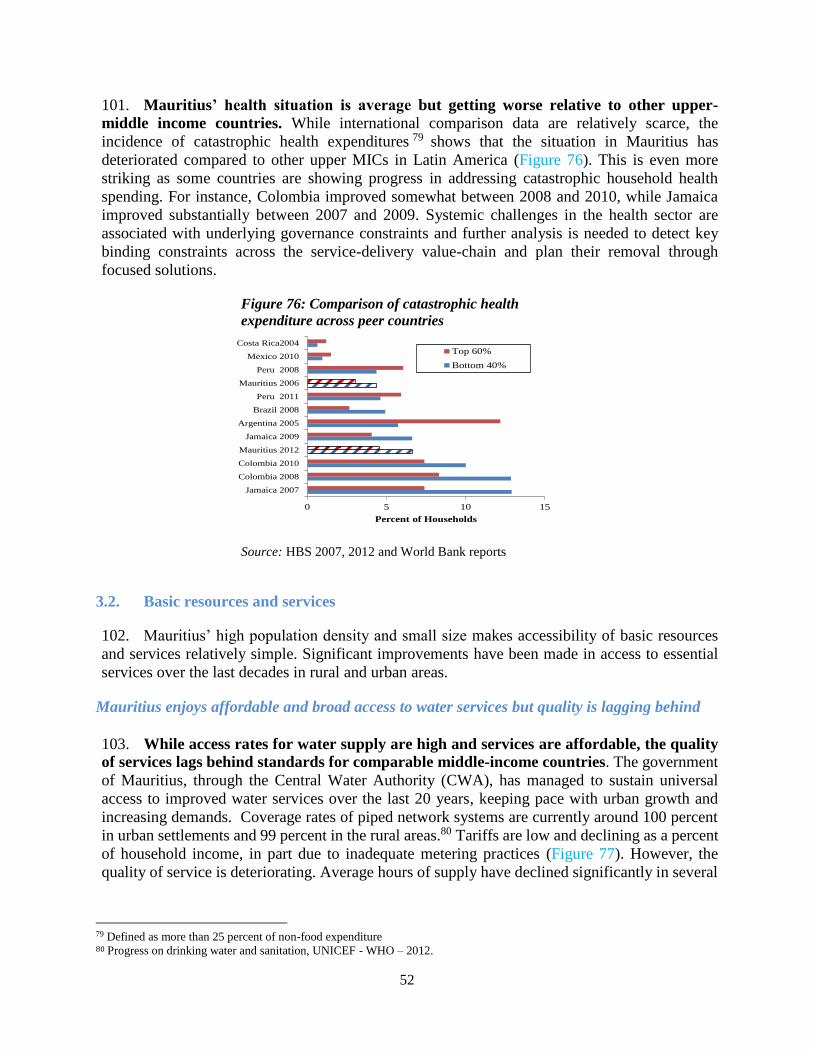
52
101. Mauritius’ health situation is average but getting worse relative to other upper-
middle income countries. While international comparison data are relatively scarce, the
incidence of catastrophic health expenditures 79 shows that the situation in Mauritius has
deteriorated compared to other upper MICs in Latin America (Figure 76). This is even more
striking as some countries are showing progress in addressing catastrophic household health
spending. For instance, Colombia improved somewhat between 2008 and 2010, while Jamaica
improved substantially between 2007 and 2009. Systemic challenges in the health sector are
associated with underlying governance constraints and further analysis is needed to detect key
binding constraints across the service-delivery value-chain and plan their removal through
focused solutions.
Figure 76: Comparison of catastrophic health
expenditure across peer countries
Source: HBS 2007, 2012 and World Bank reports
3.2. Basic resources and services
102. Mauritius’ high population density and small size makes accessibility of basic resources
and services relatively simple. Significant improvements have been made in access to essential
services over the last decades in rural and urban areas.
Mauritius enjoys affordable and broad access to water services but quality is lagging behind
103. While access rates for water supply are high and services are affordable, the quality
of services lags behind standards for comparable middle-income countries. The government
of Mauritius, through the Central Water Authority (CWA), has managed to sustain universal
access to improved water services over the last 20 years, keeping pace with urban growth and
increasing demands. Coverage rates of piped network systems are currently around 100 percent
in urban settlements and 99 percent in the rural areas.80 Tariffs are low and declining as a percent
of household income, in part due to inadequate metering practices (Figure 77). However, the
quality of service is deteriorating. Average hours of supply have declined significantly in several
79 Defined as more than 25 percent of non-food expenditure 80 Progress on drinking water and sanitation, UNICEF - WHO – 2012.
0 5 10 15
Jamaica 2007
Colombia 2008
Colombia 2010
Mauritius 2012
Jamaica 2009
Argentina 2005
Brazil 2008
Peru 2011
Mauritius 2006
Peru 2008
Mexico 2010
Costa Rica2004
Percent of Households
Top 60%
Bottom 40%
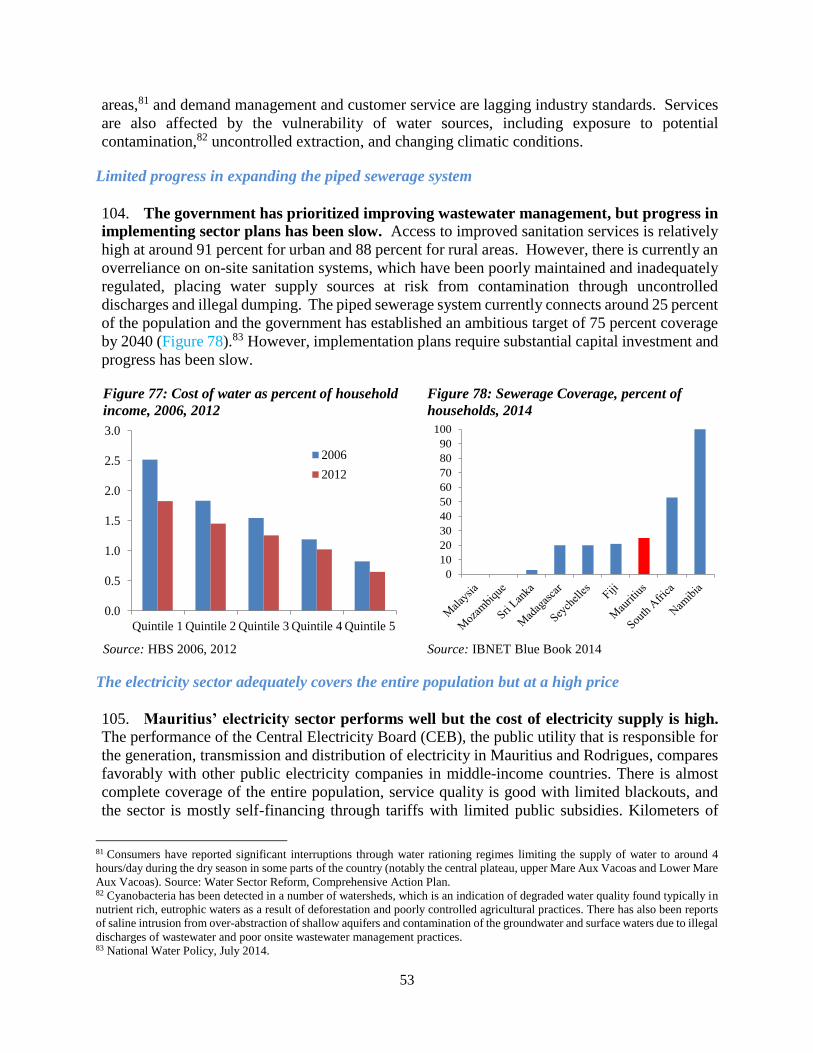
53
areas,81 and demand management and customer service are lagging industry standards. Services
are also affected by the vulnerability of water sources, including exposure to potential
contamination,82 uncontrolled extraction, and changing climatic conditions.
Limited progress in expanding the piped sewerage system
104. The government has prioritized improving wastewater management, but progress in
implementing sector plans has been slow. Access to improved sanitation services is relatively
high at around 91 percent for urban and 88 percent for rural areas. However, there is currently an
overreliance on on-site sanitation systems, which have been poorly maintained and inadequately
regulated, placing water supply sources at risk from contamination through uncontrolled
discharges and illegal dumping. The piped sewerage system currently connects around 25 percent
of the population and the government has established an ambitious target of 75 percent coverage
by 2040 (Figure 78).83 However, implementation plans require substantial capital investment and
progress has been slow.
Figure 77: Cost of water as percent of household
income, 2006, 2012
Source: HBS 2006, 2012
Figure 78: Sewerage Coverage, percent of
households, 2014
Source: IBNET Blue Book 2014
The electricity sector adequately covers the entire population but at a high price
105. Mauritius’ electricity sector performs well but the cost of electricity supply is high.
The performance of the Central Electricity Board (CEB), the public utility that is responsible for
the generation, transmission and distribution of electricity in Mauritius and Rodrigues, compares
favorably with other public electricity companies in middle-income countries. There is almost
complete coverage of the entire population, service quality is good with limited blackouts, and
the sector is mostly self-financing through tariffs with limited public subsidies. Kilometers of
81 Consumers have reported significant interruptions through water rationing regimes limiting the supply of water to around 4
hours/day during the dry season in some parts of the country (notably the central plateau, upper Mare Aux Vacoas and Lower Mare
Aux Vacoas). Source: Water Sector Reform, Comprehensive Action Plan. 82 Cyanobacteria has been detected in a number of watersheds, which is an indication of degraded water quality found typically in
nutrient rich, eutrophic waters as a result of deforestation and poorly controlled agricultural practices. There has also been reports
of saline intrusion from over-abstraction of shallow aquifers and contamination of the groundwater and surface waters due to illegal
discharges of wastewater and poor onsite wastewater management practices. 83 National Water Policy, July 2014.
0.0
0.5
1.0
1.5
2.0
2.5
3.0
Quintile 1 Quintile 2 Quintile 3 Quintile 4 Quintile 5
2006
2012
0
10
20
30
40
50
60
70
80
90
100
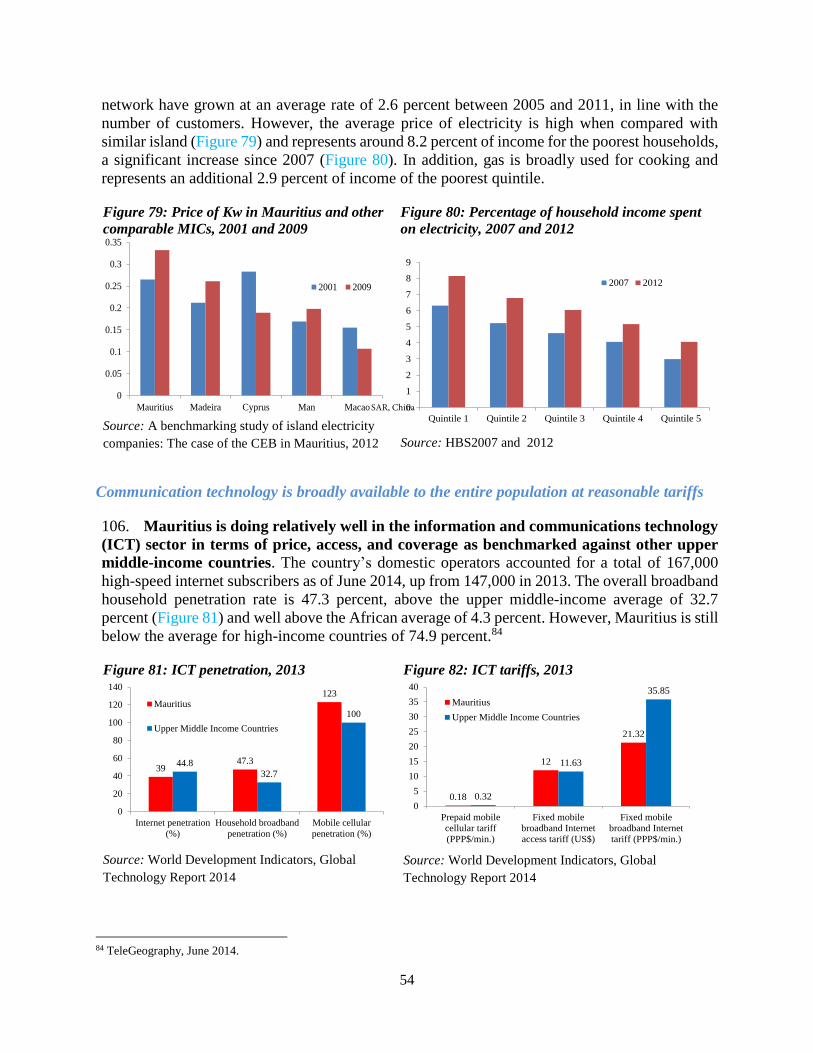
54
network have grown at an average rate of 2.6 percent between 2005 and 2011, in line with the
number of customers. However, the average price of electricity is high when compared with
similar island (Figure 79) and represents around 8.2 percent of income for the poorest households,
a significant increase since 2007 (Figure 80). In addition, gas is broadly used for cooking and
represents an additional 2.9 percent of income of the poorest quintile.
Figure 79: Price of Kw in Mauritius and other
comparable MICs, 2001 and 2009
Source: A benchmarking study of island electricity
companies: The case of the CEB in Mauritius, 2012
Figure 80: Percentage of household income spent
on electricity, 2007 and 2012
Source: HBS2007 and 2012
Communication technology is broadly available to the entire population at reasonable tariffs
106. Mauritius is doing relatively well in the information and communications technology
(ICT) sector in terms of price, access, and coverage as benchmarked against other upper
middle-income countries. The country’s domestic operators accounted for a total of 167,000
high-speed internet subscribers as of June 2014, up from 147,000 in 2013. The overall broadband
household penetration rate is 47.3 percent, above the upper middle-income average of 32.7
percent (Figure 81) and well above the African average of 4.3 percent. However, Mauritius is still
below the average for high-income countries of 74.9 percent.84
Figure 81: ICT penetration, 2013
Source: World Development Indicators, Global
Technology Report 2014
Figure 82: ICT tariffs, 2013
Source: World Development Indicators, Global
Technology Report 2014
84 TeleGeography, June 2014.
0
0.05
0.1
0.15
0.2
0.25
0.3
0.35
Mauritius Madeira Cyprus Man Macao
2001 2009
0
1
2
3
4
5
6
7
8
9
Quintile 1 Quintile 2 Quintile 3 Quintile 4 Quintile 5
2007 2012
3947.3
123
44.832.7
100
0
20
40
60
80
100
120
140
Internet penetration
(%)
Household broadband
penetration (%)
Mobile cellular
penetration (%)
Mauritius
Upper Middle Income Countries
0.18
12
21.32
0.32
11.63
35.85
0
5
10
15
20
25
30
35
40
Prepaid mobile
cellular tariff
(PPP$/min.)
Fixed mobile
broadband Internet
access tariff (US$)
Fixed mobile
broadband Internet
tariff (PPP$/min.)
Mauritius
Upper Middle Income Countries
SAR, China

55
107. The government is supporting the provision of high-bandwidth connections to
households. In 2012, the government adopted an ambitious National Broadband Policy 2012-
2020 that seeks to provide at least 60 percent of homes with affordable download access at
10Mbps speed by 2014, and almost 100 percent of homes with an actual downlink of 100Mbps
by 2020. In the 2013 budget, the government also introduced measures to cap the entry-level price
for broadband below MUR200 per month (US$6.29) (Figure 82). The country’s primary telecom
providers are moving ahead with the rollout of next generation networks and in 2013 fiber-to-the-
home (FTTH) services were available in six locations and around 15,000 customers had migrated
to these services. In addition, new spectrum has been provided for 4G Long Term Evolution
(LTE) technologies with around 195,000 subscribers as of July 2014.
3.3. Education and skills
There is broad access to education but challenges to quality and equity remain
108. Educational opportunities have improved significantly over the years and have
enabled primary and secondary school enrolment levels to reach those of upper-middle and
high-income countries.85 Since 2005, education in Mauritius is compulsory until the age of 16.
Transition between education cycles requires an examination that also certifies completion of the
cycle.86 As a result, practically all Mauritian children attend primary education, and 88 percent
move towards secondary education (Figure 83). Gender parity has been achieved, and in fact more
girls are enrolled in secondary education than boys. Development of post-primary levels has been
particularly impressive with access to secondary education increasing from 75 percent of the
population in 1996 to virtually 100 percent by 2011.87 The tertiary education system, in which
just 10 percent of the population was enrolled in 1996, grew at a similarly impressive rate, with
40 percent of the tertiary school-age population enrolled in 2011.
85 In 2012, Mauritius’ primary net enrolment rate (NER) and secondary gross enrolment rate (GER) were 97.8 percent and 95.9
percent, respectively; NERs and GERs for Mexico and Korea in the same year were, respectively, 96.3 percent and 85.7 percent
(Mexico), and 99.1 percent and 97.2 percent (Korea). 86 Mauritius has a 6+5+2 education structure; that is, six years of primary schooling, followed by five years of secondary education
and a further two years of higher secondary. At the primary level, promotion from one grade to the next is automatic until Grade
6, when pupils sit for the Certificate of Primary Education (CPE). Students can follow both academic and vocational education and
training tracks, and the decision to choose one track or the other often follows the student’s results in the Certificate of Primary
Education (CPE). Students are given two opportunities to sit for and pass the CPE. If unsuccessful in both of them, they are offered
a place in the pre-vocational track and will remain in school until they complete the age of sixteen. Similarly, access to Upper
Secondary is conditioned by successfully passing of the Cambridge School Certificate (CSC) and entry to University is permitted
to pupils who have passed the Cambridge Higher School Certificate (CHSC). 87 Secondary education includes general and pre-vocational education.
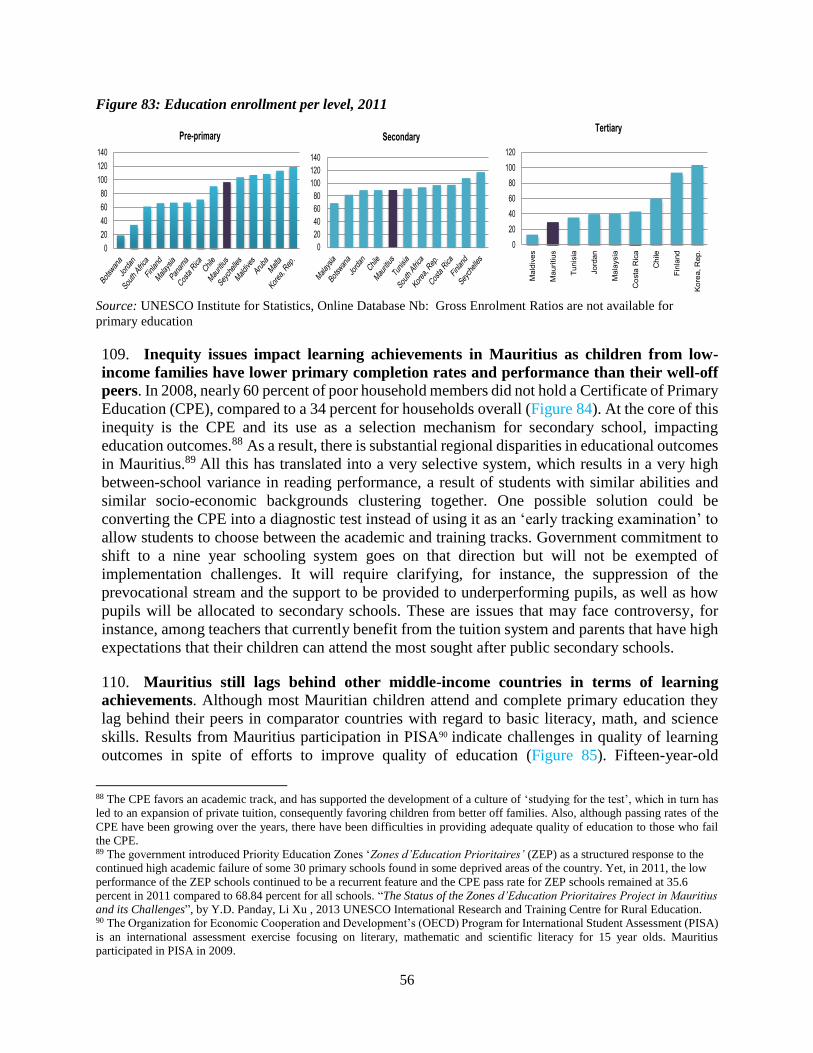
56
Figure 83: Education enrollment per level, 2011
Source: UNESCO Institute for Statistics, Online Database Nb: Gross Enrolment Ratios are not available for
primary education
109. Inequity issues impact learning achievements in Mauritius as children from low-
income families have lower primary completion rates and performance than their well-off
peers. In 2008, nearly 60 percent of poor household members did not hold a Certificate of Primary
Education (CPE), compared to a 34 percent for households overall (Figure 84). At the core of this
inequity is the CPE and its use as a selection mechanism for secondary school, impacting
education outcomes.88 As a result, there is substantial regional disparities in educational outcomes
in Mauritius.89 All this has translated into a very selective system, which results in a very high
between-school variance in reading performance, a result of students with similar abilities and
similar socio-economic backgrounds clustering together. One possible solution could be
converting the CPE into a diagnostic test instead of using it as an ‘early tracking examination’ to
allow students to choose between the academic and training tracks. Government commitment to
shift to a nine year schooling system goes on that direction but will not be exempted of
implementation challenges. It will require clarifying, for instance, the suppression of the
prevocational stream and the support to be provided to underperforming pupils, as well as how
pupils will be allocated to secondary schools. These are issues that may face controversy, for
instance, among teachers that currently benefit from the tuition system and parents that have high
expectations that their children can attend the most sought after public secondary schools.
110. Mauritius still lags behind other middle-income countries in terms of learning
achievements. Although most Mauritian children attend and complete primary education they
lag behind their peers in comparator countries with regard to basic literacy, math, and science
skills. Results from Mauritius participation in PISA90 indicate challenges in quality of learning
outcomes in spite of efforts to improve quality of education (Figure 85). Fifteen-year-old
88 The CPE favors an academic track, and has supported the development of a culture of ‘studying for the test’, which in turn has
led to an expansion of private tuition, consequently favoring children from better off families. Also, although passing rates of the
CPE have been growing over the years, there have been difficulties in providing adequate quality of education to those who fail
the CPE. 89 The government introduced Priority Education Zones ‘Zones d’Education Prioritaires’ (ZEP) as a structured response to the
continued high academic failure of some 30 primary schools found in some deprived areas of the country. Yet, in 2011, the low
performance of the ZEP schools continued to be a recurrent feature and the CPE pass rate for ZEP schools remained at 35.6
percent in 2011 compared to 68.84 percent for all schools. “The Status of the Zones d’Education Prioritaires Project in Mauritius
and its Challenges”, by Y.D. Panday, Li Xu , 2013 UNESCO International Research and Training Centre for Rural Education. 90 The Organization for Economic Cooperation and Development’s (OECD) Program for International Student Assessment (PISA)
is an international assessment exercise focusing on literary, mathematic and scientific literacy for 15 year olds. Mauritius
participated in PISA in 2009.
0
20
40
60
80
100
120
140
Pre-primary
0
20
40
60
80
100
120
140
Secondary
0
20
40
60
80
100
120
Mald
ives
Mauri
tius
Tu
nis
ia
Jo
rda
n
Mala
ysia
Co
sta
Ric
a
Ch
ile
Fin
land
Ko
rea, R
ep
.
Tertiary
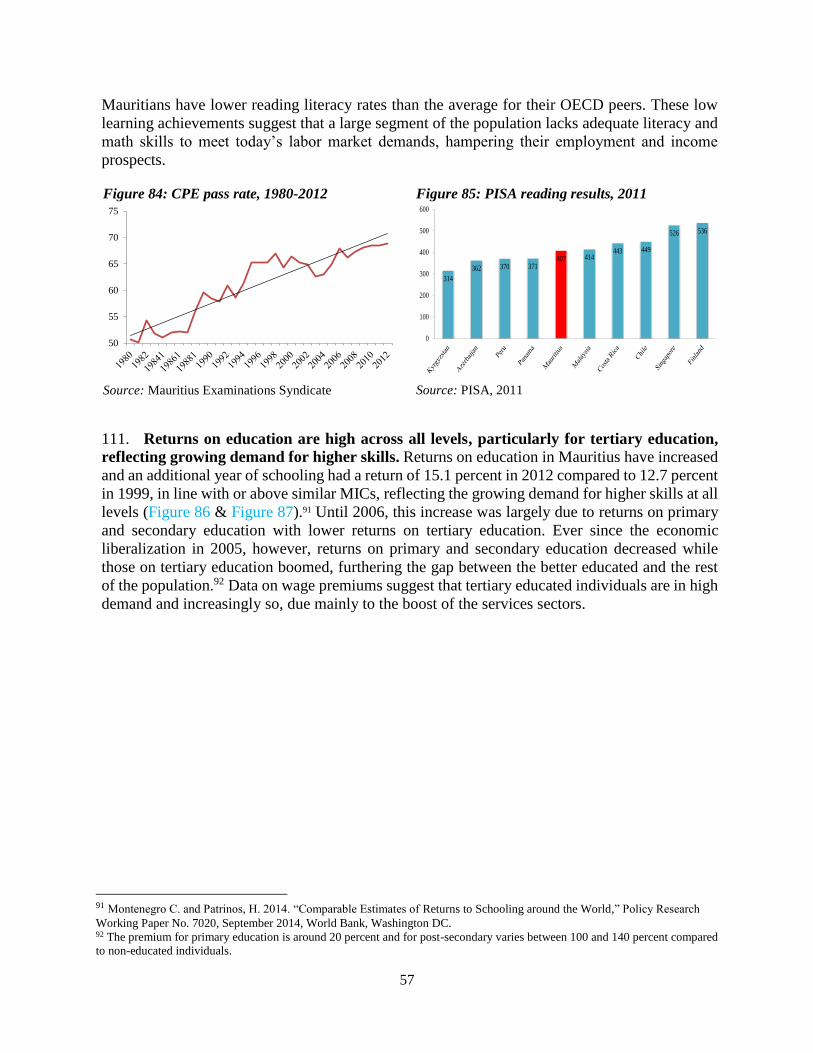
57
Mauritians have lower reading literacy rates than the average for their OECD peers. These low
learning achievements suggest that a large segment of the population lacks adequate literacy and
math skills to meet today’s labor market demands, hampering their employment and income
prospects.
Figure 84: CPE pass rate, 1980-2012
Source: Mauritius Examinations Syndicate
Figure 85: PISA reading results, 2011
Source: PISA, 2011
111. Returns on education are high across all levels, particularly for tertiary education,
reflecting growing demand for higher skills. Returns on education in Mauritius have increased
and an additional year of schooling had a return of 15.1 percent in 2012 compared to 12.7 percent
in 1999, in line with or above similar MICs, reflecting the growing demand for higher skills at all
levels (Figure 86 & Figure 87).91 Until 2006, this increase was largely due to returns on primary
and secondary education with lower returns on tertiary education. Ever since the economic
liberalization in 2005, however, returns on primary and secondary education decreased while
those on tertiary education boomed, furthering the gap between the better educated and the rest
of the population.92 Data on wage premiums suggest that tertiary educated individuals are in high
demand and increasingly so, due mainly to the boost of the services sectors.
91 Montenegro C. and Patrinos, H. 2014. “Comparable Estimates of Returns to Schooling around the World,” Policy Research
Working Paper No. 7020, September 2014, World Bank, Washington DC. 92 The premium for primary education is around 20 percent and for post-secondary varies between 100 and 140 percent compared
to non-educated individuals.
50
55
60
65
70
75
314
362 370 371407 414
443 449
526 536
0
100
200
300
400
500
600

58
Figure 86: Returns on schooling, 1999-2012
Source:Montenegro and Patrinos, World Bank, 2014
Figure 87: Returns on schooling, peer countries,
2011
Source:Montenegro and Patrinos, World Bank, 2014
112. The expansion of tertiary education in Mauritius is important for the knowledge
economy but also for shared prosperity. The expansion of tertiary education is one of the main
objectives of the tertiary education reform, which aims to increase enrollment from 44 percent in
2010 to 72 percent in 2020. Tertiary education in Mauritius pays the highest returns and 83 percent
of people living with household heads with complete tertiary education are part of the richest
quintile. Further, having a degree is fundamental for being employed and the benefits of obtaining
a post-secondary degree have increased over time. Expanding tertiary education will allow for a
higher share of low income and middle class enrolment and as more tertiary graduates enter the
labor market, returns to tertiary education will start to decrease, albeit slowly. These two factors
may lead to a broader distribution of assets, thus contributing to more equity and shared
prosperity.
113. Education outcomes are critical in determining poverty, social mobility, and
increased earnings. Although some improvement has taken place between 2007 and 2012, a
third of households headed by a person without any education were part of the poorest quintile
(Figure 88 & Figure 89). Those with more formal education have higher labor force participation,
employment, and income as they have access to better paid jobs. There is thus a close link between
the level of education and belonging to a social group. Furthermore, holding a secondary
certification and, even more so, holding a tertiary education certification, ensures Mauritians a
place in the country’s middle class.
Figure 88: Poverty by education of head
Source: HBS 2007, 2012
Figure 89: Education by income group, 2007 2012
Source: HBS 2007, 2012
5
7
9
11
13
15
17
19
21
23
25
1999 2001 2002 2003 2004 2005 2006 2007 2008 2009 2010 2012
Additional year of schooling
Primary
Secondary
Tertiary
0
5
10
15
20
25
Additional year
of schooling
Primary Secondary Tertiary
Peru Chile - 2011
Colombia Malaysia
Costa Rica- 2009 Panama
Mauritius
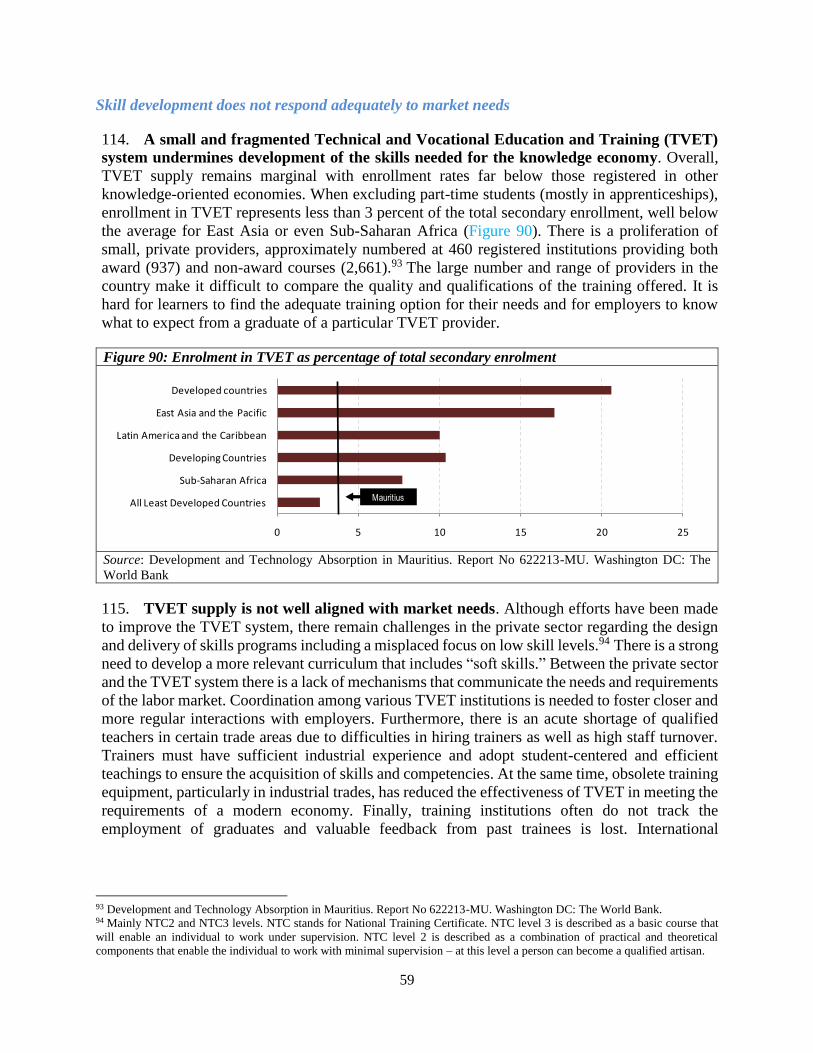
59
Skill development does not respond adequately to market needs
114. A small and fragmented Technical and Vocational Education and Training (TVET)
system undermines development of the skills needed for the knowledge economy. Overall,
TVET supply remains marginal with enrollment rates far below those registered in other
knowledge-oriented economies. When excluding part-time students (mostly in apprenticeships),
enrollment in TVET represents less than 3 percent of the total secondary enrollment, well below
the average for East Asia or even Sub-Saharan Africa (Figure 90). There is a proliferation of
small, private providers, approximately numbered at 460 registered institutions providing both
award (937) and non-award courses (2,661).93 The large number and range of providers in the
country make it difficult to compare the quality and qualifications of the training offered. It is
hard for learners to find the adequate training option for their needs and for employers to know
what to expect from a graduate of a particular TVET provider.
Figure 90: Enrolment in TVET as percentage of total secondary enrolment
Source: Development and Technology Absorption in Mauritius. Report No 622213-MU. Washington DC: The
World Bank
115. TVET supply is not well aligned with market needs. Although efforts have been made
to improve the TVET system, there remain challenges in the private sector regarding the design
and delivery of skills programs including a misplaced focus on low skill levels.94 There is a strong
need to develop a more relevant curriculum that includes “soft skills.” Between the private sector
and the TVET system there is a lack of mechanisms that communicate the needs and requirements
of the labor market. Coordination among various TVET institutions is needed to foster closer and
more regular interactions with employers. Furthermore, there is an acute shortage of qualified
teachers in certain trade areas due to difficulties in hiring trainers as well as high staff turnover.
Trainers must have sufficient industrial experience and adopt student-centered and efficient
teachings to ensure the acquisition of skills and competencies. At the same time, obsolete training
equipment, particularly in industrial trades, has reduced the effectiveness of TVET in meeting the
requirements of a modern economy. Finally, training institutions often do not track the
employment of graduates and valuable feedback from past trainees is lost. International
93 Development and Technology Absorption in Mauritius. Report No 622213-MU. Washington DC: The World Bank. 94 Mainly NTC2 and NTC3 levels. NTC stands for National Training Certificate. NTC level 3 is described as a basic course that
will enable an individual to work under supervision. NTC level 2 is described as a combination of practical and theoretical
components that enable the individual to work with minimal supervision – at this level a person can become a qualified artisan.
0 5 10 15 20 25
All Least Developed Countries
Sub-Saharan Africa
Developing Countries
Latin America and the Caribbean
East Asia and the Pacific
Developed countries
Mauritius
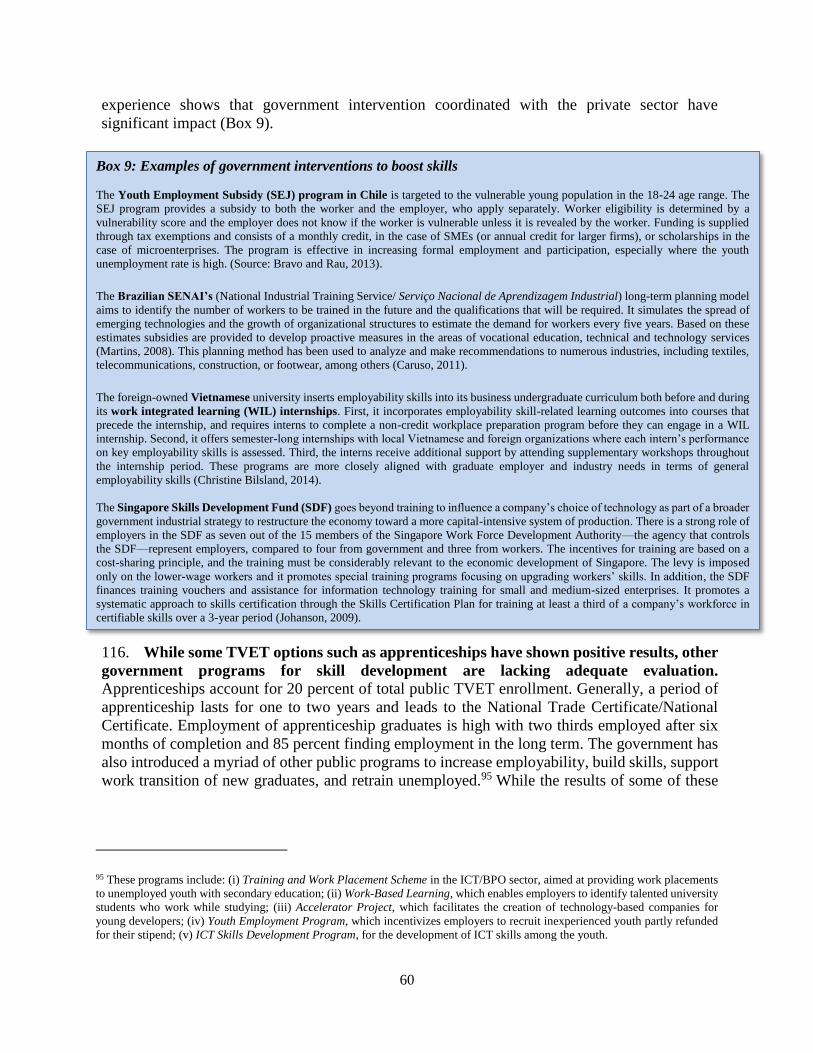
60
experience shows that government intervention coordinated with the private sector have
significant impact (Box 9).
116. While some TVET options such as apprenticeships have shown positive results, other
government programs for skill development are lacking adequate evaluation.
Apprenticeships account for 20 percent of total public TVET enrollment. Generally, a period of
apprenticeship lasts for one to two years and leads to the National Trade Certificate/National
Certificate. Employment of apprenticeship graduates is high with two thirds employed after six
months of completion and 85 percent finding employment in the long term. The government has
also introduced a myriad of other public programs to increase employability, build skills, support
work transition of new graduates, and retrain unemployed.95 While the results of some of these
95 These programs include: (i) Training and Work Placement Scheme in the ICT/BPO sector, aimed at providing work placements
to unemployed youth with secondary education; (ii) Work-Based Learning, which enables employers to identify talented university
students who work while studying; (iii) Accelerator Project, which facilitates the creation of technology-based companies for
young developers; (iv) Youth Employment Program, which incentivizes employers to recruit inexperienced youth partly refunded
for their stipend; (v) ICT Skills Development Program, for the development of ICT skills among the youth.
Box 9: Examples of government interventions to boost skills The Youth Employment Subsidy (SEJ) program in Chile is targeted to the vulnerable young population in the 18-24 age range. The
SEJ program provides a subsidy to both the worker and the employer, who apply separately. Worker eligibility is determined by a
vulnerability score and the employer does not know if the worker is vulnerable unless it is revealed by the worker. Funding is supplied
through tax exemptions and consists of a monthly credit, in the case of SMEs (or annual credit for larger firms), or scholarships in the
case of microenterprises. The program is effective in increasing formal employment and participation, especially where the youth
unemployment rate is high. (Source: Bravo and Rau, 2013).
The Brazilian SENAI’s (National Industrial Training Service/ Serviço Nacional de Aprendizagem Industrial) long-term planning model
aims to identify the number of workers to be trained in the future and the qualifications that will be required. It simulates the spread of
emerging technologies and the growth of organizational structures to estimate the demand for workers every five years. Based on these
estimates subsidies are provided to develop proactive measures in the areas of vocational education, technical and technology services
(Martins, 2008). This planning method has been used to analyze and make recommendations to numerous industries, including textiles,
telecommunications, construction, or footwear, among others (Caruso, 2011).
The foreign-owned Vietnamese university inserts employability skills into its business undergraduate curriculum both before and during
its work integrated learning (WIL) internships. First, it incorporates employability skill-related learning outcomes into courses that
precede the internship, and requires interns to complete a non-credit workplace preparation program before they can engage in a WIL
internship. Second, it offers semester-long internships with local Vietnamese and foreign organizations where each intern’s performance
on key employability skills is assessed. Third, the interns receive additional support by attending supplementary workshops throughout
the internship period. These programs are more closely aligned with graduate employer and industry needs in terms of general
employability skills (Christine Bilsland, 2014).
The Singapore Skills Development Fund (SDF) goes beyond training to influence a company’s choice of technology as part of a broader
government industrial strategy to restructure the economy toward a more capital-intensive system of production. There is a strong role of
employers in the SDF as seven out of the 15 members of the Singapore Work Force Development Authority—the agency that controls
the SDF—represent employers, compared to four from government and three from workers. The incentives for training are based on a
cost-sharing principle, and the training must be considerably relevant to the economic development of Singapore. The levy is imposed
only on the lower-wage workers and it promotes special training programs focusing on upgrading workers’ skills. In addition, the SDF
finances training vouchers and assistance for information technology training for small and medium-sized enterprises. It promotes a
systematic approach to skills certification through the Skills Certification Plan for training at least a third of a company’s workforce in
certifiable skills over a 3-year period (Johanson, 2009).
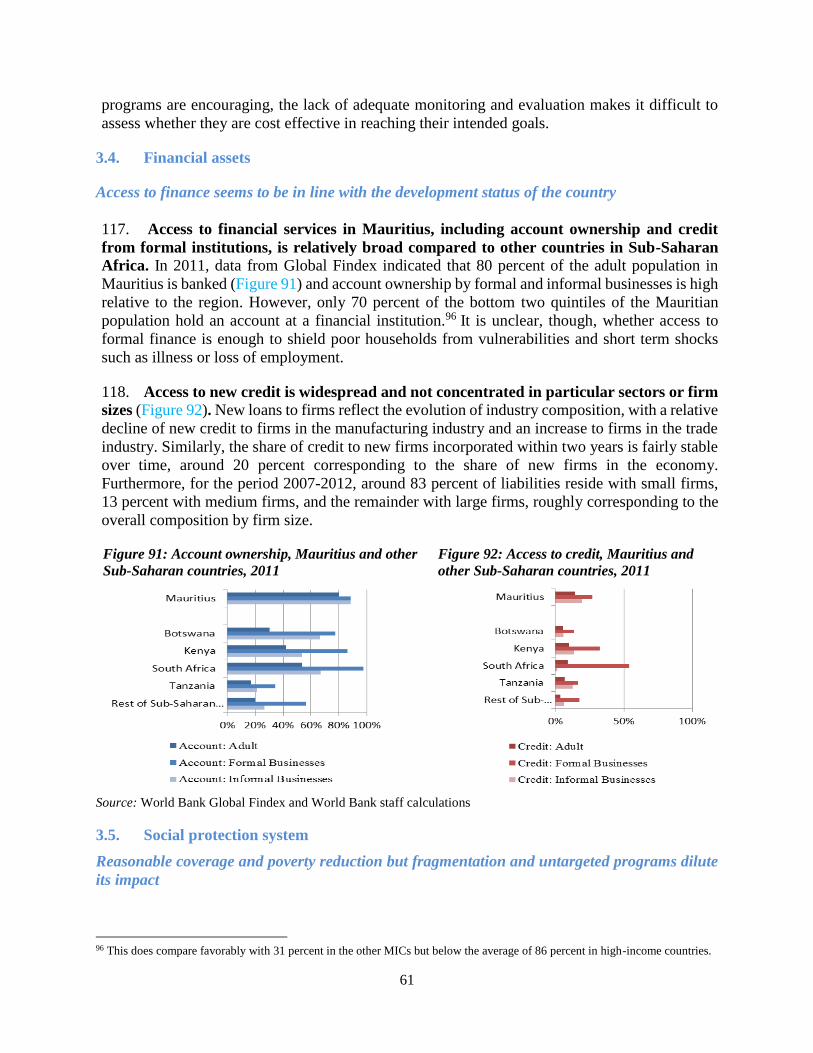
61
programs are encouraging, the lack of adequate monitoring and evaluation makes it difficult to
assess whether they are cost effective in reaching their intended goals.
3.4. Financial assets
Access to finance seems to be in line with the development status of the country
117. Access to financial services in Mauritius, including account ownership and credit
from formal institutions, is relatively broad compared to other countries in Sub-Saharan
Africa. In 2011, data from Global Findex indicated that 80 percent of the adult population in
Mauritius is banked (Figure 91) and account ownership by formal and informal businesses is high
relative to the region. However, only 70 percent of the bottom two quintiles of the Mauritian
population hold an account at a financial institution.96 It is unclear, though, whether access to
formal finance is enough to shield poor households from vulnerabilities and short term shocks
such as illness or loss of employment.
118. Access to new credit is widespread and not concentrated in particular sectors or firm
sizes (Figure 92). New loans to firms reflect the evolution of industry composition, with a relative
decline of new credit to firms in the manufacturing industry and an increase to firms in the trade
industry. Similarly, the share of credit to new firms incorporated within two years is fairly stable
over time, around 20 percent corresponding to the share of new firms in the economy.
Furthermore, for the period 2007-2012, around 83 percent of liabilities reside with small firms,
13 percent with medium firms, and the remainder with large firms, roughly corresponding to the
overall composition by firm size.
Figure 91: Account ownership, Mauritius and other
Sub-Saharan countries, 2011
Figure 92: Access to credit, Mauritius and
other Sub-Saharan countries, 2011
Source: World Bank Global Findex and World Bank staff calculations
3.5. Social protection system
Reasonable coverage and poverty reduction but fragmentation and untargeted programs dilute
its impact
96 This does compare favorably with 31 percent in the other MICs but below the average of 86 percent in high-income countries.

62
119. The social protection system in Mauritius is comprehensive and significant resources
are allocated to it. Mauritius has a comprehensive social protection system made up of social
assistance, pensions, and labor market programs.97 Social protection expenditure accounted for
20 percent of total government expenditures and 5.5 percent of GDP in 2013 of which 1.7 percent
of GDP is on contributory pensions and 3.8 percent of GDP is on social assistance.98 The Basic
Retirement Pension, a program that provides a universal non-contributory pension for persons
above the age of 60 as well as other benefits including universal invalidity and survivor benefits,
represents 81 percent of total social assistance spending, or 3 percent of GDP. Spending on Social
Aid, the government’s cornerstone poverty-focused program, accounts for a meager 0.35 percent
of GDP.
120. Overall, Mauritius’ social protection system makes an important contribution to
inclusive growth.99 In 2012, the social protection system in Mauritius covered 46 percent of the
population counting direct beneficiaries and their household members. Contributory pensions
provide coverage to 18.8 percent of the population while social assistance provides coverage to
40.5 percent of the population. 100 In the absence of existing pensions and social assistance
schemes, poverty in Mauritius would be significantly higher both in terms of the poverty
headcount and the inequality index.101 At the same time, the effectiveness of Mauritius social
protection system has increased over time. Social protection programs that were associated with
an 8.4 percentage point reduction in poverty in 2007 were associated with a 9.5 percentage
reduction in 2012.
121. The social protection system is fragmented, leading to inefficiencies. Currently, there
are around 39 social assistance programs in Mauritius, designed and implemented by multiple
ministries, foundations, and special funds. This results in diseconomies of scale leading to gaps
in monitoring and evaluation, oversight, coordination, accountability, and transparency. The
government has already taken steps towards modernizing its social assistance system. First, it has
established the Social Register of Mauritius (SRM) as the database for social assistance programs
to include an increasing number of existing programs to improve targeting and monitoring and
evaluation. Second, it has introduced more objective eligibility criteria in the identification of
beneficiaries through the use of a proxy means test under the SRM. But while these are positive
steps, they do not address the fragmentation of the system. Given the nature of their
vulnerabilities, this especially penalizes those in the bottom 20 percent of the population, those
most in need of improved access to social protection. These most vulnerable probably require a
97 Pension programs include the National Pension Fund, National Savings Scheme, and Civil Service Pension Scheme. The Basic
Retirement Pension, a non-contributory pension program, provides universal benefits to all elderly above retirement age. There is
an array of social assistance programs, including multiple cash and in-kind programs (the largest and most expensive being the
universal basic pension), active labor market programs, and social care services. The government’s cornerstone targeted cash
transfer program is Social Aid, which is provided to specific eligible groups of households considered to be needy. Social Aid is
complemented by the National Empowerment Foundation (NEF) that implements a number of programs including training,
entrepreneurial support, and job search assistance as well as an array of additional services targeted to poor households. The
government has launched a youth employment program in 2012 and a new income support program in 2014. 98 World Bank calculations based on 2013 data provided by the Mauritius Accountant General Office. 99 Results of the analysis are based on the household survey 2012. 100 Social insurance coverage does not include current contributors to the contributory schemes. Some beneficiaries benefit both
from social insurance and social assistance. 101 The poverty headcount would have increased to 16.4 percent from 6.9 percent, and the poverty gap would have likely quadrupled
from the actual rate of 1.7 to 6.5. The income inequality measured by the Gini coefficient would also be higher, increasing from
the actual level of 0.37 to 0.41.
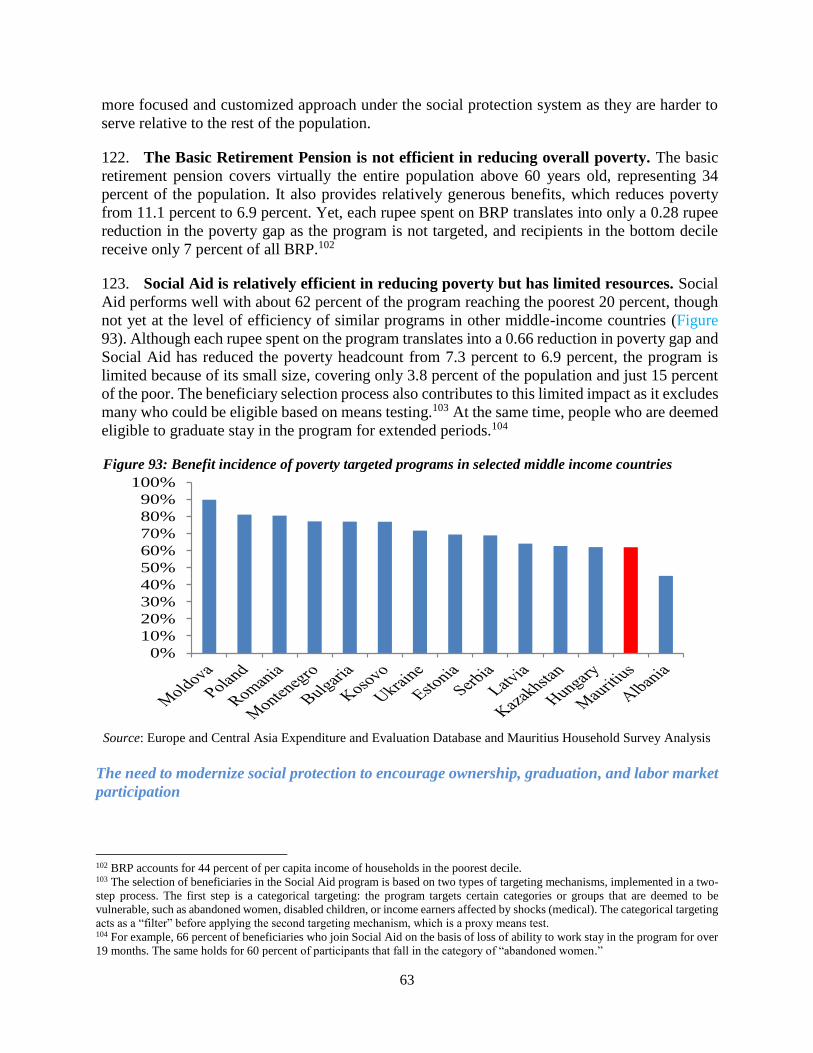
63
more focused and customized approach under the social protection system as they are harder to
serve relative to the rest of the population.
122. The Basic Retirement Pension is not efficient in reducing overall poverty. The basic
retirement pension covers virtually the entire population above 60 years old, representing 34
percent of the population. It also provides relatively generous benefits, which reduces poverty
from 11.1 percent to 6.9 percent. Yet, each rupee spent on BRP translates into only a 0.28 rupee
reduction in the poverty gap as the program is not targeted, and recipients in the bottom decile
receive only 7 percent of all BRP.102
123. Social Aid is relatively efficient in reducing poverty but has limited resources. Social
Aid performs well with about 62 percent of the program reaching the poorest 20 percent, though
not yet at the level of efficiency of similar programs in other middle-income countries (Figure
93). Although each rupee spent on the program translates into a 0.66 reduction in poverty gap and
Social Aid has reduced the poverty headcount from 7.3 percent to 6.9 percent, the program is
limited because of its small size, covering only 3.8 percent of the population and just 15 percent
of the poor. The beneficiary selection process also contributes to this limited impact as it excludes
many who could be eligible based on means testing.103 At the same time, people who are deemed
eligible to graduate stay in the program for extended periods.104
Figure 93: Benefit incidence of poverty targeted programs in selected middle income countries
Source: Europe and Central Asia Expenditure and Evaluation Database and Mauritius Household Survey Analysis
The need to modernize social protection to encourage ownership, graduation, and labor market
participation
102 BRP accounts for 44 percent of per capita income of households in the poorest decile. 103 The selection of beneficiaries in the Social Aid program is based on two types of targeting mechanisms, implemented in a two-
step process. The first step is a categorical targeting: the program targets certain categories or groups that are deemed to be
vulnerable, such as abandoned women, disabled children, or income earners affected by shocks (medical). The categorical targeting
acts as a “filter” before applying the second targeting mechanism, which is a proxy means test. 104 For example, 66 percent of beneficiaries who join Social Aid on the basis of loss of ability to work stay in the program for over
19 months. The same holds for 60 percent of participants that fall in the category of “abandoned women.”
0%
10%
20%
30%
40%
50%
60%
70%
80%
90%
100%
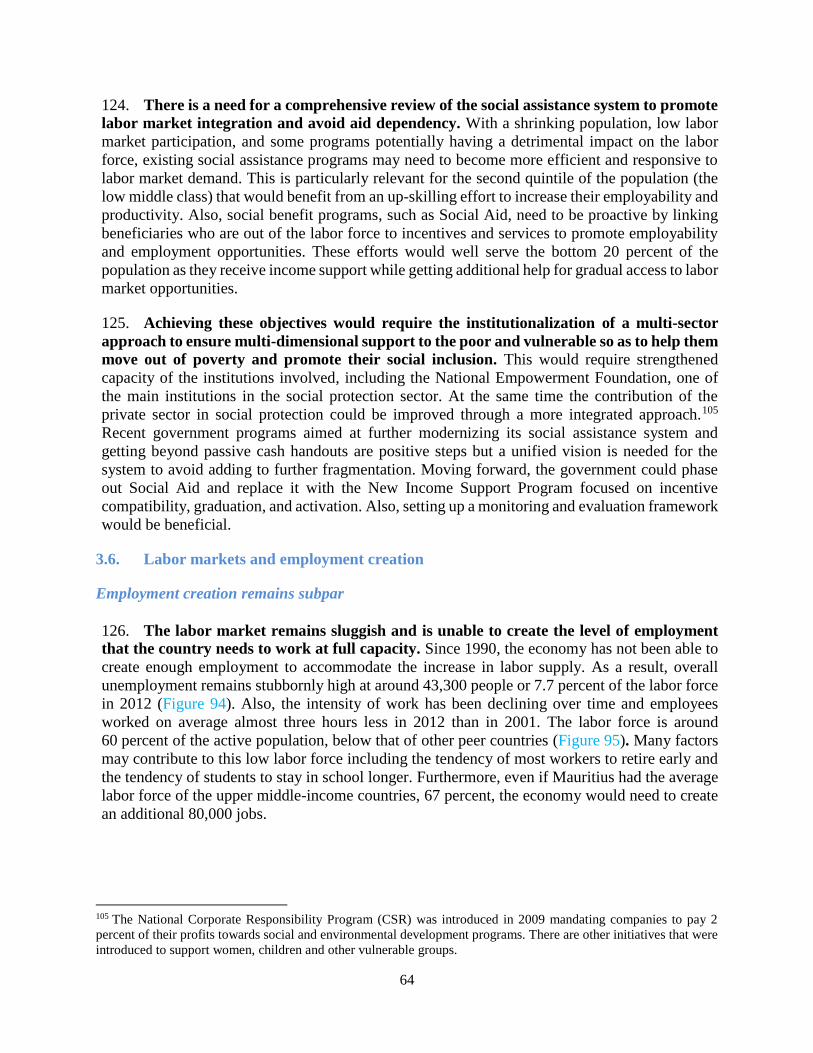
64
124. There is a need for a comprehensive review of the social assistance system to promote
labor market integration and avoid aid dependency. With a shrinking population, low labor
market participation, and some programs potentially having a detrimental impact on the labor
force, existing social assistance programs may need to become more efficient and responsive to
labor market demand. This is particularly relevant for the second quintile of the population (the
low middle class) that would benefit from an up-skilling effort to increase their employability and
productivity. Also, social benefit programs, such as Social Aid, need to be proactive by linking
beneficiaries who are out of the labor force to incentives and services to promote employability
and employment opportunities. These efforts would well serve the bottom 20 percent of the
population as they receive income support while getting additional help for gradual access to labor
market opportunities.
125. Achieving these objectives would require the institutionalization of a multi-sector
approach to ensure multi-dimensional support to the poor and vulnerable so as to help them
move out of poverty and promote their social inclusion. This would require strengthened
capacity of the institutions involved, including the National Empowerment Foundation, one of
the main institutions in the social protection sector. At the same time the contribution of the
private sector in social protection could be improved through a more integrated approach.105
Recent government programs aimed at further modernizing its social assistance system and
getting beyond passive cash handouts are positive steps but a unified vision is needed for the
system to avoid adding to further fragmentation. Moving forward, the government could phase
out Social Aid and replace it with the New Income Support Program focused on incentive
compatibility, graduation, and activation. Also, setting up a monitoring and evaluation framework
would be beneficial.
3.6. Labor markets and employment creation
Employment creation remains subpar
126. The labor market remains sluggish and is unable to create the level of employment
that the country needs to work at full capacity. Since 1990, the economy has not been able to
create enough employment to accommodate the increase in labor supply. As a result, overall
unemployment remains stubbornly high at around 43,300 people or 7.7 percent of the labor force
in 2012 (Figure 94). Also, the intensity of work has been declining over time and employees
worked on average almost three hours less in 2012 than in 2001. The labor force is around
60 percent of the active population, below that of other peer countries (Figure 95). Many factors
may contribute to this low labor force including the tendency of most workers to retire early and
the tendency of students to stay in school longer. Furthermore, even if Mauritius had the average
labor force of the upper middle-income countries, 67 percent, the economy would need to create
an additional 80,000 jobs.
105 The National Corporate Responsibility Program (CSR) was introduced in 2009 mandating companies to pay 2
percent of their profits towards social and environmental development programs. There are other initiatives that were
introduced to support women, children and other vulnerable groups.
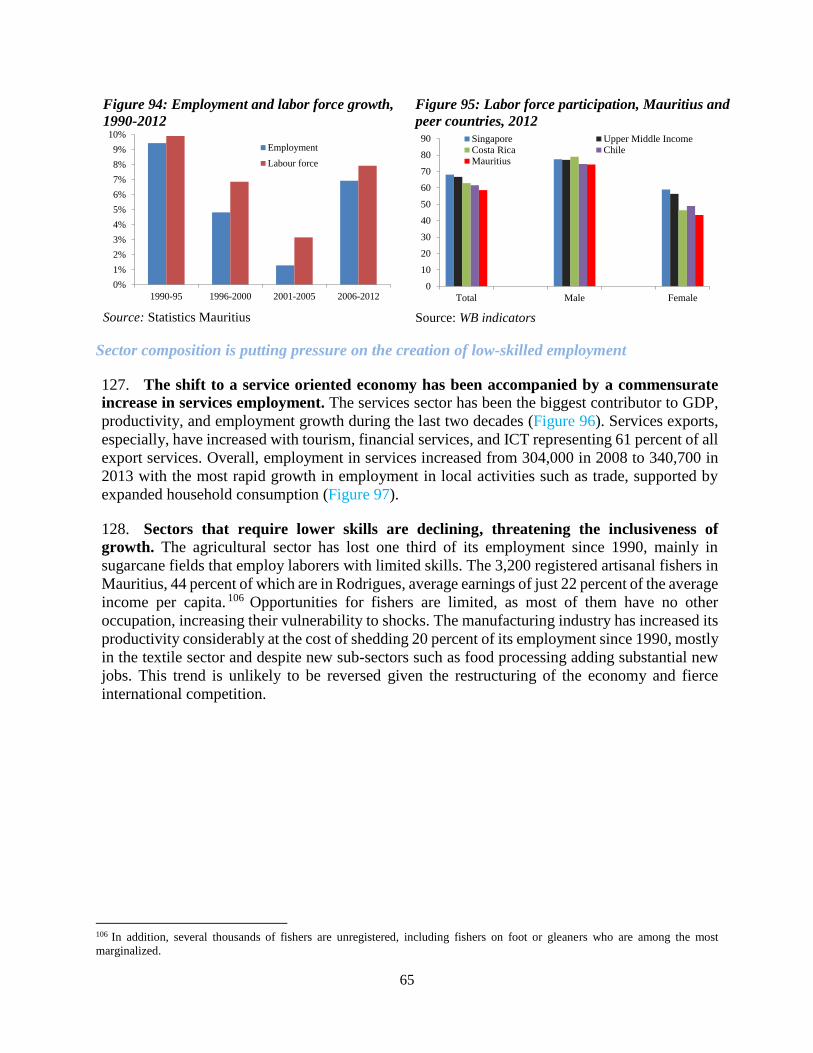
65
Figure 94: Employment and labor force growth,
1990-2012
Source: Statistics Mauritius
Figure 95: Labor force participation, Mauritius and
peer countries, 2012
Source: WB indicators
Sector composition is putting pressure on the creation of low-skilled employment
127. The shift to a service oriented economy has been accompanied by a commensurate
increase in services employment. The services sector has been the biggest contributor to GDP,
productivity, and employment growth during the last two decades (Figure 96). Services exports,
especially, have increased with tourism, financial services, and ICT representing 61 percent of all
export services. Overall, employment in services increased from 304,000 in 2008 to 340,700 in
2013 with the most rapid growth in employment in local activities such as trade, supported by
expanded household consumption (Figure 97).
128. Sectors that require lower skills are declining, threatening the inclusiveness of
growth. The agricultural sector has lost one third of its employment since 1990, mainly in
sugarcane fields that employ laborers with limited skills. The 3,200 registered artisanal fishers in
Mauritius, 44 percent of which are in Rodrigues, average earnings of just 22 percent of the average
income per capita. 106 Opportunities for fishers are limited, as most of them have no other
occupation, increasing their vulnerability to shocks. The manufacturing industry has increased its
productivity considerably at the cost of shedding 20 percent of its employment since 1990, mostly
in the textile sector and despite new sub-sectors such as food processing adding substantial new
jobs. This trend is unlikely to be reversed given the restructuring of the economy and fierce
international competition.
106 In addition, several thousands of fishers are unregistered, including fishers on foot or gleaners who are among the most
marginalized.
0%
1%
2%
3%
4%
5%
6%
7%
8%
9%
10%
1990-95 1996-2000 2001-2005 2006-2012
Employment
Labour force
0
10
20
30
40
50
60
70
80
90
Total Male Female
Singapore Upper Middle IncomeCosta Rica ChileMauritius
66
Figure 96: Annual growth in employment and
productivity across sectors, 1990-2013
Source: Statistics Mauritius, WBI, Shapley
decomposition
Figure 97: Employment creation per sector,
2002-2012
Source: Statistics Mauritius
129. At the low end of the skills scale, there are still obstacles to finding employees for some
firms, prompting many to utilize immigrant workers. Filling certain low-skilled positions is
constrained by many factors such as inadequacy of working conditions and high salary and career
expectations as a result of working conditions in some of the main sectors of the economy such
as tourism and ICT. Because companies cannot find adequately skilled labor at market
conditions, a significant number of foreign workers are brought into the country. Almost half of
manufacturing and ICT companies employ foreign workers, and 3 percent of total workers in the
financial sector are foreign. The majority of work permits are issued in the “skilled worker”
occupational category. Despite an increase of immigrant workers from 14,600 in 2000 to 24,000
in 2008, firm complaints related to the expensive and lengthy process for hiring foreign workers
are common.
The labor market still has significant barriers for the inclusion of women and youth
130. Despite significant gains over the past decade, gender differences in the labor market
remain high and are mainly associated with very low labor market participation. The female
labor force participation rate in 2012 was 47 percent, a slight improvement over 2001 (Figure 98
& Figure 99).107 Despite an absence of legal barriers108, half of Mauritian women of working age
are still outside the labor market. Moreover, compared to men, women in 2012 are still 22 percent
less likely to be employed, 6 percent more likely to be unemployed, and 25 percent more likely
to be out of the labor market. The primary factors for the low female labor force participation are
marriage and family size. A married woman has around a 40 percent higher probability of being
out of the labor force than a married man and as family size increases so does her chance of being
inactive. These probabilities do decrease with higher education levels and women with post-
secondary education actually outperform. Part of the reason for these lower labor force
participation may be inadequate supporting institutions in the form of child day care or assistance
to take care of the elder members of the household.
107 This compares to a higher average in upper middle-income countries of 56 percent or those of comparable countries like
Botswana at 72 percent and Trinidad and Tobago at 53 percent. 108 According to the Bank’s Women, Business, and the Law database, Mauritius’s legal code is fully equal and all laws are applied
to women the same way to men, thus the laws do not hinder women’s participation in the economy.
-1.0
-0.5
0.0
0.5
1.0
1.5
2.0
2.5
Primary Secondary Tertiary
Change in Employment rate
Change in Productivity
-30,000 -20,000 -10,000 0 10,000 20,000 30,000
Primary
Manufacturing
Education, Human…
Public Administration
Transportation
Construction
Accomodation, Food services
Wholesale trade
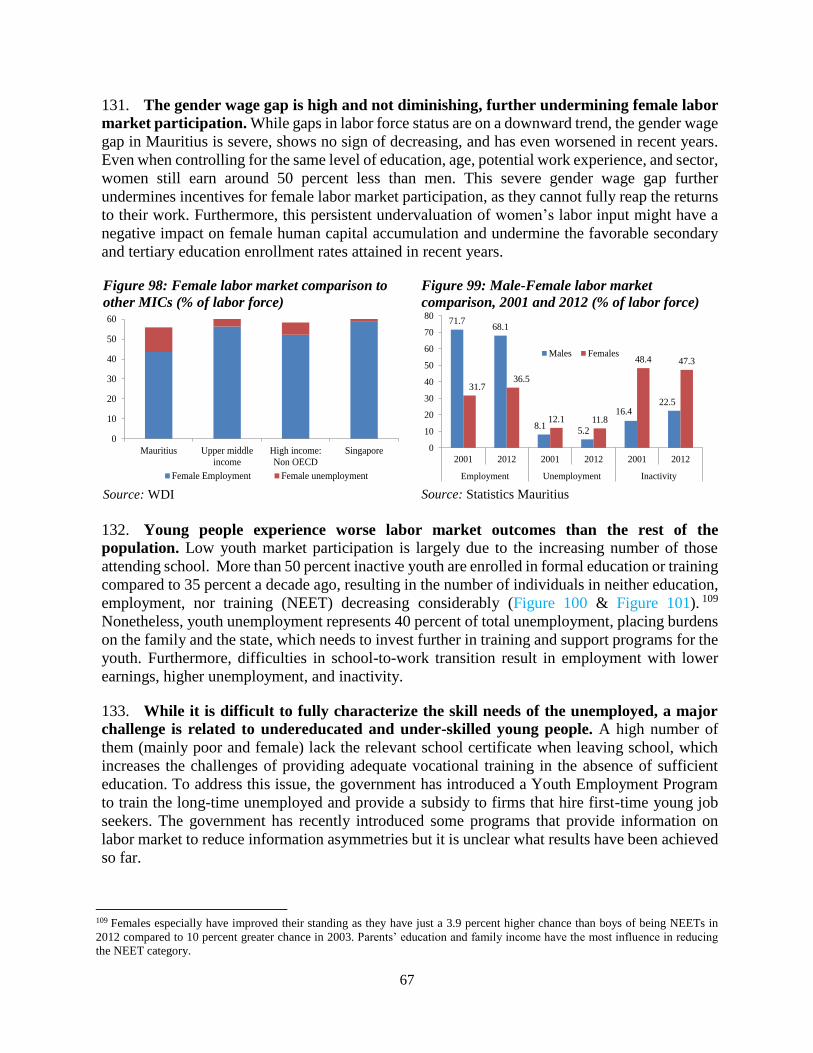
67
131. The gender wage gap is high and not diminishing, further undermining female labor
market participation. While gaps in labor force status are on a downward trend, the gender wage
gap in Mauritius is severe, shows no sign of decreasing, and has even worsened in recent years.
Even when controlling for the same level of education, age, potential work experience, and sector,
women still earn around 50 percent less than men. This severe gender wage gap further
undermines incentives for female labor market participation, as they cannot fully reap the returns
to their work. Furthermore, this persistent undervaluation of women’s labor input might have a
negative impact on female human capital accumulation and undermine the favorable secondary
and tertiary education enrollment rates attained in recent years.
Figure 98: Female labor market comparison to
other MICs (% of labor force)
Source: WDI
Figure 99: Male-Female labor market
comparison, 2001 and 2012 (% of labor force)
Source: Statistics Mauritius
132. Young people experience worse labor market outcomes than the rest of the
population. Low youth market participation is largely due to the increasing number of those
attending school. More than 50 percent inactive youth are enrolled in formal education or training
compared to 35 percent a decade ago, resulting in the number of individuals in neither education,
employment, nor training (NEET) decreasing considerably (Figure 100 & Figure 101). 109
Nonetheless, youth unemployment represents 40 percent of total unemployment, placing burdens
on the family and the state, which needs to invest further in training and support programs for the
youth. Furthermore, difficulties in school-to-work transition result in employment with lower
earnings, higher unemployment, and inactivity.
133. While it is difficult to fully characterize the skill needs of the unemployed, a major
challenge is related to undereducated and under-skilled young people. A high number of
them (mainly poor and female) lack the relevant school certificate when leaving school, which
increases the challenges of providing adequate vocational training in the absence of sufficient
education. To address this issue, the government has introduced a Youth Employment Program
to train the long-time unemployed and provide a subsidy to firms that hire first-time young job
seekers. The government has recently introduced some programs that provide information on
labor market to reduce information asymmetries but it is unclear what results have been achieved
so far.
109 Females especially have improved their standing as they have just a 3.9 percent higher chance than boys of being NEETs in
2012 compared to 10 percent greater chance in 2003. Parents’ education and family income have the most influence in reducing
the NEET category.
0
10
20
30
40
50
60
Mauritius Upper middle
income
High income:
Non OECD
Singapore
Female Employment Female unemployment
71.768.1
8.15.2
16.422.5
31.736.5
12.1 11.8
48.4 47.3
0
10
20
30
40
50
60
70
80
2001 2012 2001 2012 2001 2012
Employment Unemployment Inactivity
Males Females
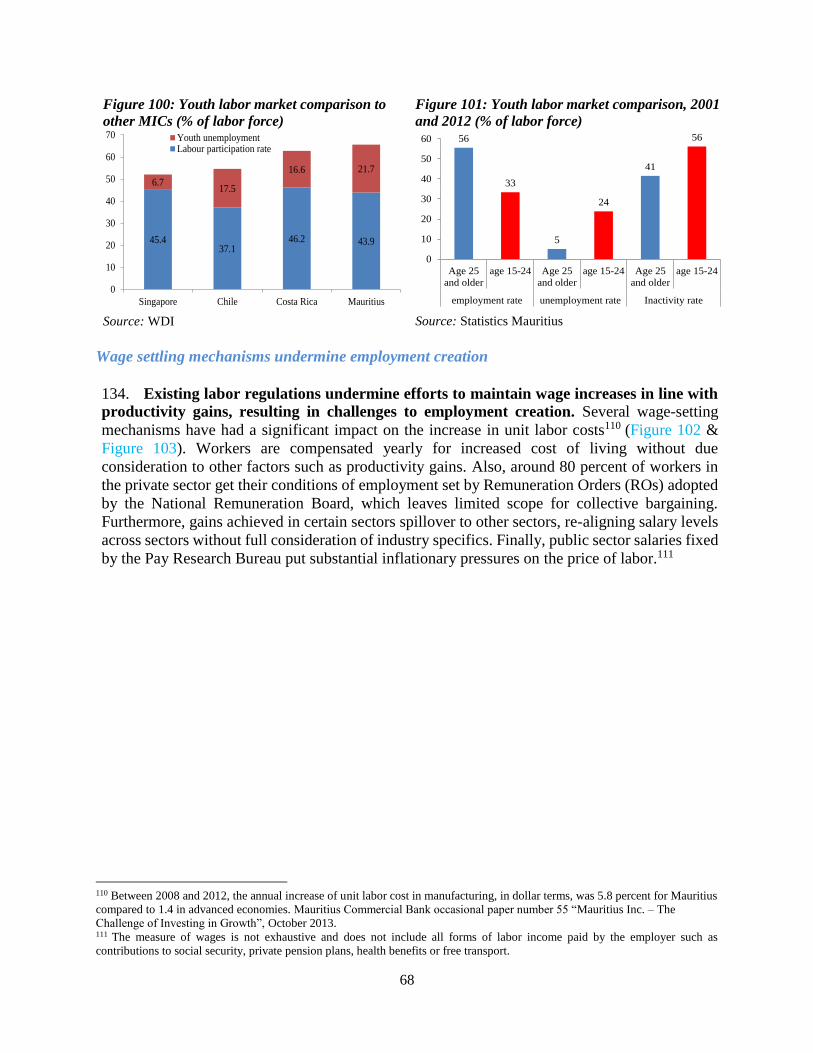
68
Figure 100: Youth labor market comparison to
other MICs (% of labor force)
Source: WDI
Figure 101: Youth labor market comparison, 2001
and 2012 (% of labor force)
Source: Statistics Mauritius
Wage settling mechanisms undermine employment creation
134. Existing labor regulations undermine efforts to maintain wage increases in line with
productivity gains, resulting in challenges to employment creation. Several wage-setting
mechanisms have had a significant impact on the increase in unit labor costs110 (Figure 102 &
Figure 103). Workers are compensated yearly for increased cost of living without due
consideration to other factors such as productivity gains. Also, around 80 percent of workers in
the private sector get their conditions of employment set by Remuneration Orders (ROs) adopted
by the National Remuneration Board, which leaves limited scope for collective bargaining.
Furthermore, gains achieved in certain sectors spillover to other sectors, re-aligning salary levels
across sectors without full consideration of industry specifics. Finally, public sector salaries fixed
by the Pay Research Bureau put substantial inflationary pressures on the price of labor.111
110 Between 2008 and 2012, the annual increase of unit labor cost in manufacturing, in dollar terms, was 5.8 percent for Mauritius
compared to 1.4 in advanced economies. Mauritius Commercial Bank occasional paper number 55 “Mauritius Inc. – The
Challenge of Investing in Growth”, October 2013. 111 The measure of wages is not exhaustive and does not include all forms of labor income paid by the employer such as
contributions to social security, private pension plans, health benefits or free transport.
45.437.1
46.2 43.9
6.717.5
16.6 21.7
0
10
20
30
40
50
60
70
Singapore Chile Costa Rica Mauritius
Youth unemploymentLabour participation rate
56
33
5
24
41
56
0
10
20
30
40
50
60
Age 25
and older
age 15-24 Age 25
and older
age 15-24 Age 25
and older
age 15-24
employment rate unemployment rate Inactivity rate
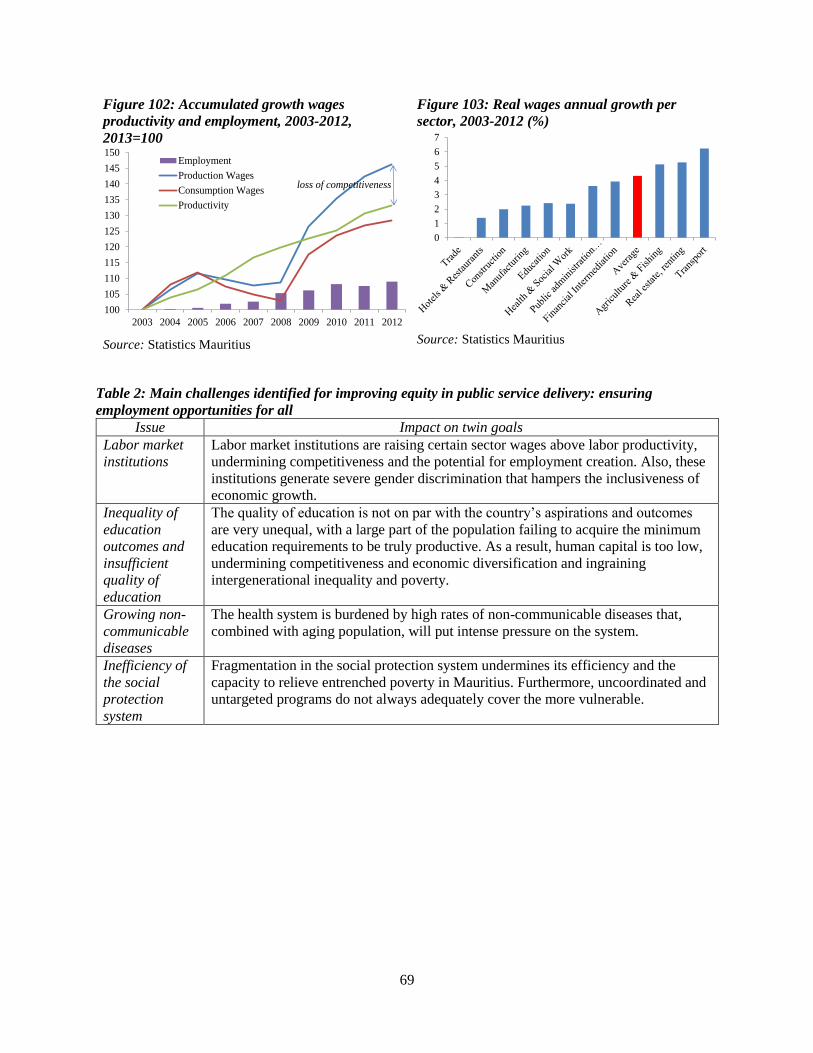
69
Figure 102: Accumulated growth wages
productivity and employment, 2003-2012,
2013=100
Source: Statistics Mauritius
Figure 103: Real wages annual growth per
sector, 2003-2012 (%)
Source: Statistics Mauritius
Table 2: Main challenges identified for improving equity in public service delivery: ensuring
employment opportunities for all
Issue Impact on twin goals
Labor market
institutions
Labor market institutions are raising certain sector wages above labor productivity,
undermining competitiveness and the potential for employment creation. Also, these
institutions generate severe gender discrimination that hampers the inclusiveness of
economic growth.
Inequality of
education
outcomes and
insufficient
quality of
education
The quality of education is not on par with the country’s aspirations and outcomes
are very unequal, with a large part of the population failing to acquire the minimum
education requirements to be truly productive. As a result, human capital is too low,
undermining competitiveness and economic diversification and ingraining
intergenerational inequality and poverty.
Growing non-
communicable
diseases
The health system is burdened by high rates of non-communicable diseases that,
combined with aging population, will put intense pressure on the system.
Inefficiency of
the social
protection
system
Fragmentation in the social protection system undermines its efficiency and the
capacity to relieve entrenched poverty in Mauritius. Furthermore, uncoordinated and
untargeted programs do not always adequately cover the more vulnerable.
100
105
110
115
120
125
130
135
140
145
150
2003 2004 2005 2006 2007 2008 2009 2010 2011 2012
Employment
Production Wages
Consumption Wages
Productivity
loss of competitiveness
0
1
2
3
4
5
6
7

70
Chapter 4. Sustaining Progress
Main messages – Chapter 4
Mauritius is very vulnerable to natural hazards and climate change will further exacerbate this
situation.
Environmental sustainability will require improved information, preparedness and, in some areas,
strengthened regional cooperation.
Sustainability in the provision of infrastructure services calls for improved planning to expand energy
provision, substantial reforms in the water sector, and coping with road congestion through better
demand management and public transportation.
The government needs to contain the public deficit and public debt to create the fiscal space needed
to finance growing human and infrastructure capital needs and rebuild fiscal buffers to cope with
large external and natural vulnerabilities.
Furthermore, a quickly aging population will put additional pressure on public spending though
growing pension and health expenditures.
Public sector management practices are behind other upper middle income countries and need to
improve to raise accountability and the quality of services rendered.
135. While the trajectory in terms of growth over the last decade has been broadly positive,
Mauritius has been less successful in regards to shared prosperity. Significant policy and
institutional reforms are necessary to ensure that its economic status is sustained. Mauritius is a
small island state with significant economic vulnerabilities, most notably natural hazards and
exposure to international markets. This section will look at sustainability in a broad sense
including the capacity of the Mauritian economy to achieve high-income status and improve
shared prosperity. It will discuss key aspects of sustainability for Mauritius including: (i) natural
hazards and climate change risks to Mauritius; (ii) unsustainable infrastructure policies; (iii)
macroeconomic policies to achieve high-income status; and (iv) the capacity of the public sector
to deliver the public services required.
4.1. Natural Hazards and Climate Change
Climate change effects will exacerbate the country’s vulnerability to natural hazards
136. Mauritius is very vulnerable to geophysical hazards and climate change will only
exacerbate this status (Box 10). The country is among the top 10 percent of countries most
exposed to natural disasters. Projections suggest that average global temperatures could rise by
1-2 degrees Celsius by 2060, with water resources decreasing by 13 percent by 2050. As a result,
the range and intensity of natural hazards will increase over time. A large part of the population
and productive assets in Mauritius are exposed to multiple risks, and flooding risk is continuously
increasing, especially in built up areas due to inappropriate drainage infrastructure as well as
people living in the coastal areas. Since most disadvantaged Mauritians live in coastal areas, a
careful assessment should be done on the increased vulnerability of poor people settled in flood-
prone areas. Recent events112 confirm the importance of strengthening the country’s resilience in
order to ensure progress with poverty reduction and shared prosperity.
112 For instance, the flood event of 30 March 2013 in Port-Louis, and Cyclone Bansi in January 2015.
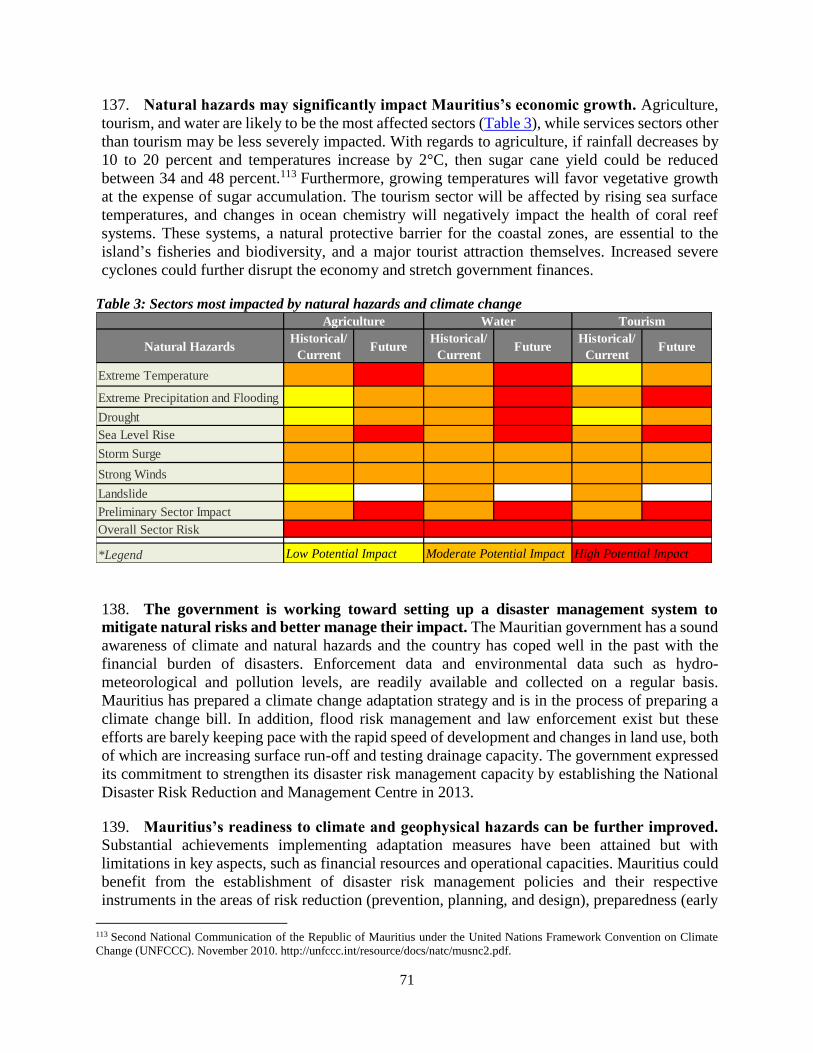
71
137. Natural hazards may significantly impact Mauritius’s economic growth. Agriculture,
tourism, and water are likely to be the most affected sectors (Table 3), while services sectors other
than tourism may be less severely impacted. With regards to agriculture, if rainfall decreases by
10 to 20 percent and temperatures increase by 2°C, then sugar cane yield could be reduced
between 34 and 48 percent.113 Furthermore, growing temperatures will favor vegetative growth
at the expense of sugar accumulation. The tourism sector will be affected by rising sea surface
temperatures, and changes in ocean chemistry will negatively impact the health of coral reef
systems. These systems, a natural protective barrier for the coastal zones, are essential to the
island’s fisheries and biodiversity, and a major tourist attraction themselves. Increased severe
cyclones could further disrupt the economy and stretch government finances.
Table 3: Sectors most impacted by natural hazards and climate change
138. The government is working toward setting up a disaster management system to
mitigate natural risks and better manage their impact. The Mauritian government has a sound
awareness of climate and natural hazards and the country has coped well in the past with the
financial burden of disasters. Enforcement data and environmental data such as hydro-
meteorological and pollution levels, are readily available and collected on a regular basis.
Mauritius has prepared a climate change adaptation strategy and is in the process of preparing a
climate change bill. In addition, flood risk management and law enforcement exist but these
efforts are barely keeping pace with the rapid speed of development and changes in land use, both
of which are increasing surface run-off and testing drainage capacity. The government expressed
its commitment to strengthen its disaster risk management capacity by establishing the National
Disaster Risk Reduction and Management Centre in 2013.
139. Mauritius’s readiness to climate and geophysical hazards can be further improved.
Substantial achievements implementing adaptation measures have been attained but with
limitations in key aspects, such as financial resources and operational capacities. Mauritius could
benefit from the establishment of disaster risk management policies and their respective
instruments in the areas of risk reduction (prevention, planning, and design), preparedness (early
113 Second National Communication of the Republic of Mauritius under the United Nations Framework Convention on Climate
Change (UNFCCC). November 2010. http://unfccc.int/resource/docs/natc/musnc2.pdf.
Historical/ Historical/ Historical/
Current Current Current
Extreme Temperature
Extreme Precipitation and Flooding
Drought
Sea Level Rise
Storm Surge
Strong Winds
Landslide
Preliminary Sector Impact
Overall Sector Risk
*Legend
Agriculture Water Tourism
Natural Hazards Future Future Future
Low Potential Impact Moderate Potential Impact High Potential Impact
72
warning systems), risk financing and recovery and reconstruction. Potential risk scenarios seldom
take into account climate change projections. Also, vulnerability and impact assessments are not
comprehensive or substantial, and there is no national multi-hazard risk assessment with a
common methodology designed to inform planning and development decisions. While
Environmental Impact Assessment (EIA) recommendations are monitored and enforced, there are
insufficient officials for post-monitoring the more than 1,000 Preliminary Environmental Reports
(PERs) and EIAs issued.
Box 10: Mauritius – Climate change and increasing natural hazards
Extreme temperatures will increase. The mean annual temperature has increased by 0.6°C from 1960
to 2006, most rapidly in the first quarter of the year (0.16°C per decade). Temperature is projected to
increase by 1 to 2°C by the 2060s, and 1.1 to 3.4°C by the 2090s, with more ‘hot’ days and less ‘cold’
days than in the current climate.
Extreme precipitation and flooding will likely increase. Whilst there is no evident trend in annual
rainfall, rainfall in the last quarter of the year has declined over the period 1960 – 2006 by 9 percent per
decade. While flooding projections are difficult because of severe, periodic variations in global weather
conditions (e.g. warming of the southern Pacific Ocean or El Niño), rainfall during the third quarter of
the year tends toward a decrease of 6 to 10 percent by the 2090s. Intense rainfall events could particularly
affect key economic areas, cause inundation of cultivated areas and losses in vegetable production,
which could lead to abandonment of cultivable areas, further soil erosion, and the leaching of nutrients.
Mauritius is not directly threatened by desertification but droughts are increasing. The country’s worst
droughts have occurred relatively recently, in 1999 and 2011. The former notably led to a drastic 44
percent fall in the contribution of sugarcane to Mauritius’ economy. Deforestation also remains a
concern, as it could bring about the silting of rivers and lagoons. This would have detrimental effects
on the flora, the fauna, as well as the soil quality.
Acceleration in sea level rise has been noticed. Sea level rise has increased around 3.8 mm/year between
1998 and 2007 and could rise by a 0.13-0.56 mm/year range by the 2090s compared to 1980-1999 sea
levels. Beach erosion has also become a concern, with loss in beach area of about 18,500 m2 over the
last two decades, and coral bleaching has also occurred.
The frequency and strength of storms have increased significantly. The frequency of storms of tropical
cyclone strength or higher has increased significantly over the past three decades, with an increasing
trend in the number of storms reaching tropical cyclone strength (winds above 165 km/h). Also, research
suggests that the number of intense cyclones (wind gusts of up to 299 Km/h) will be increasing at the
expense of weaker cyclones.
Mauritius and Rodrigues are experiencing an increasing number of sites with landslide occurrences.
While in the late nineties there was only one dangerous site in Mauritius requiring strict precautionary
measures, by 2005 this number had risen to 22. With more frequent events of torrential rain, some of
these zones may even need to be evacuated. A similar situation is gradually developing in Rodrigues
in which small landslide occurrences are likely to grow in severity in the future.
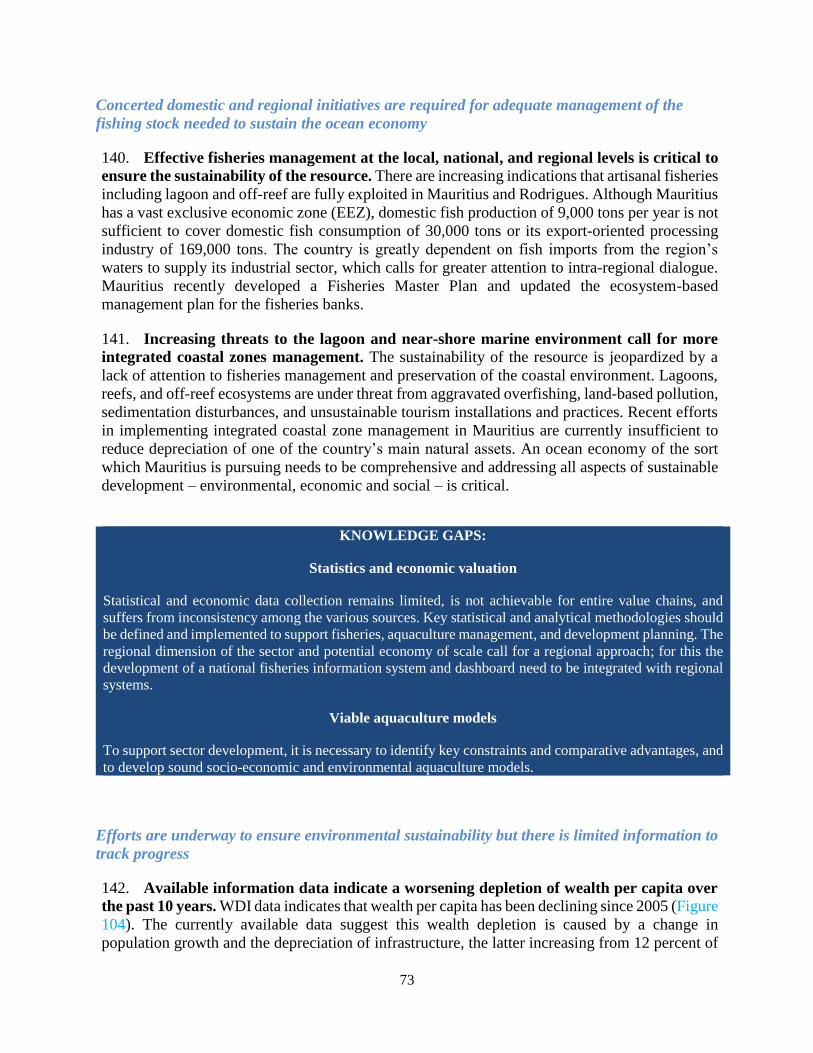
73
Concerted domestic and regional initiatives are required for adequate management of the
fishing stock needed to sustain the ocean economy
140. Effective fisheries management at the local, national, and regional levels is critical to
ensure the sustainability of the resource. There are increasing indications that artisanal fisheries
including lagoon and off-reef are fully exploited in Mauritius and Rodrigues. Although Mauritius
has a vast exclusive economic zone (EEZ), domestic fish production of 9,000 tons per year is not
sufficient to cover domestic fish consumption of 30,000 tons or its export-oriented processing
industry of 169,000 tons. The country is greatly dependent on fish imports from the region’s
waters to supply its industrial sector, which calls for greater attention to intra-regional dialogue.
Mauritius recently developed a Fisheries Master Plan and updated the ecosystem-based
management plan for the fisheries banks.
141. Increasing threats to the lagoon and near-shore marine environment call for more
integrated coastal zones management. The sustainability of the resource is jeopardized by a
lack of attention to fisheries management and preservation of the coastal environment. Lagoons,
reefs, and off-reef ecosystems are under threat from aggravated overfishing, land-based pollution,
sedimentation disturbances, and unsustainable tourism installations and practices. Recent efforts
in implementing integrated coastal zone management in Mauritius are currently insufficient to
reduce depreciation of one of the country’s main natural assets. An ocean economy of the sort
which Mauritius is pursuing needs to be comprehensive and addressing all aspects of sustainable
development – environmental, economic and social – is critical.
Efforts are underway to ensure environmental sustainability but there is limited information to
track progress
142. Available information data indicate a worsening depletion of wealth per capita over
the past 10 years. WDI data indicates that wealth per capita has been declining since 2005 (Figure
104). The currently available data suggest this wealth depletion is caused by a change in
population growth and the depreciation of infrastructure, the latter increasing from 12 percent of
KNOWLEDGE GAPS:
Statistics and economic valuation
Statistical and economic data collection remains limited, is not achievable for entire value chains, and
suffers from inconsistency among the various sources. Key statistical and analytical methodologies should
be defined and implemented to support fisheries, aquaculture management, and development planning. The
regional dimension of the sector and potential economy of scale call for a regional approach; for this the
development of a national fisheries information system and dashboard need to be integrated with regional
systems.
Viable aquaculture models
To support sector development, it is necessary to identify key constraints and comparative advantages, and
to develop sound socio-economic and environmental aquaculture models.

74
GDP in 1995 to 14 percent in 2010, and not just by depletion of natural capital and environmental
resources (Figure 105). Improved information will be critical to implement Mauritius
environmental sustainability agenda (Box 11).
Box 11: Mauritius: Embracing sustainable development on land and at sea
In response to the global energy crisis in 2007, the Government of Mauritius became conscious of the
importance of promoting renewable energy and sustainable development for the wellbeing of its
citizens. In 2008, the Maurice Ile Durable (MID) concept was launched as a new long-term vision for
making Mauritius a sustainable island. This was supported with the MID fund with an initial budget of
MUR 1.3 billion to increase renewables to 35 percent by 2025. Under the MID fund, the government
has already provided grants and soft loans to 25,000 households for purchasing solar thermal systems,
and 650,000 energy saving lamps have been sold at a subsidized rate. Also road lighting is being
replaced by energy efficient systems; a grid code and a feed-in-tariff were developed in 2009 for small
solar, wind and hydro power systems; and small independent power producers were given the
opportunity to produce their own electricity from renewable energy sources and export any excess to
the CEB grid. In 2013, a new strategy was adopted—the “Ocean Economy”—to harness the full
potential of the ocean and ensure a comprehensive approach in handling this new frontier of the
economy—one which embeds growth, inclusiveness, sustainability, and resilience.
Mauritius is among the largest marine territories in the world with a total economic zone of 2.3 million
square km, including an Exclusive Economic Zone (EEZ) of 1.9 million square km and a co-managed
economic zone with Seychelles of 0.4 million square kilometers. For many years, Mauritius has been
benefiting from the “ocean economy” with substantial ocean-related economic activities mainly around
fishing, farming, desalination, maritime transport, ship building, ports, and coastal activities including
hotels, restaurants, sporting, public services, and research centers. Altogether, it is estimated that the
various sectors of the ocean-related activities contributed around 10.8 percent of GDP in 2012, with
hotels and leisure activities making up some 60 per cent of that total.
In December 2013, a High-Level National Task Force on the Ocean Economy was formed and a
roadmap was published. The roadmap articulates ten key objectives that seek to promote the Ocean
Economy over the next decade. In the short term, it seeks to develop Mauritius into a major regional
hub for petroleum products, specifically container transshipment and port services and to promote
Mauritius’ seafood processing hub, along with aquaculture, to play even a more prominent role in export
diversification and consolidation of food security. The roadmap also gives a new impetus to tourism
and ocean-based leisure, with a bigger focus on cruise tourism and sea sport. By 2020, the country will
promote the ocean as a major share of renewable energy sources, harboring a regional platform for
marine finance, ICT and ship registration, and by prospecting the zones with the highest likelihood for
hydrocarbon and mineral resources. By 2015, the goal is that direct contribution of the Ocean Economy
to GDP should reach approximately 20 percent (excluding eventual discovery of hydrocarbons).
Mauritius should become a center of excellence for ocean knowledge, both as a support industry and as
an industry in its own right, with continuous mapping and stock taking of its living and non-living
resources for an ecologically clean and safe ocean

75
Figure 104: Change in wealth per capita, 1995 -
2010
Figure 105: Natural capital depletion per capita,
1995 – 2010
Source: Change in Wealth per Capita Database, World Bank, Version 1.0, March 19, 2014
KNOWLEDGE GAPS: Natural wealth accounting
While Mauritius has demonstrated a strong commitment to developing natural wealth accounts,
considerable work is still needed to fully incorporate all forms of wealth. So far, the parameters used to
calculate natural capital depletion are limited, as they do not include coastal erosion, fisheries, or marine
resources, which are key to Mauritius and might also be drivers of wealth depletion.
4.2. Unsustainable Infrastructure policies
Mauritius has sufficient fresh water resources but inadequate policies may critically affect
service provision and the sustainability of the water system
143. Water service providers are struggling to recover costs and operational inefficiencies
are affecting the sustainability of service delivery (Figure 106). Key sector performance
indicators demonstrate that Mauritian service providers are struggling with increased
urbanization114 and all three service providers (CWA, WMA and IA) are failing to collect enough
revenue to meet operating costs and new investment, impeding their viability. The existing tariff
structure distorts cost perceptions and is overly complex, with a high degree of cross
subsidization. 115 Operational inefficiencies include inadequate asset management and
maintenance, poor distribution pressure control, deficient planning, inadequate billing and
collection, and poor customer services and response. As a result, non-revenue water comprises
55 percent of the total, of which technical losses are 31 percent and commercial losses, 24 percent
114 IBNET Apgar score assesses the health of water utilities / service providers based on six indicators, which provide insight into
the utility’s operational, financial, and social performance. The criteria are (i) water supply coverage, (ii) sewerage coverage, (iii)
non-revenue water, (iv) collection period, (vi) operating cost coverage ratio, and (vi) affordability of water and wastewater services.
Mauritius’s score is placed within the low range, less than the average for lower middle-income countries. (IBNET Blue Book,
2014). 115 Despite a significant adjustment in 2012, the price of water has been kept artificially low, with the average cost of water
estimated to be around MUR 7.16 per cubic meter. (Mauritius Water Sector Reform, Strategic Plan, July, 2012).
-400
-300
-200
-100
0
100
200
300
1995 2000 2005 2008 2010
20
10
US
$ p
er c
ap
ita
0
100
200
300
400
500
600
700
1995 2000 2005 2008 2010
2010
US
$ p
er c
apit
a
Net Forest Depletion
Energy Depletion
Mineral Depletion
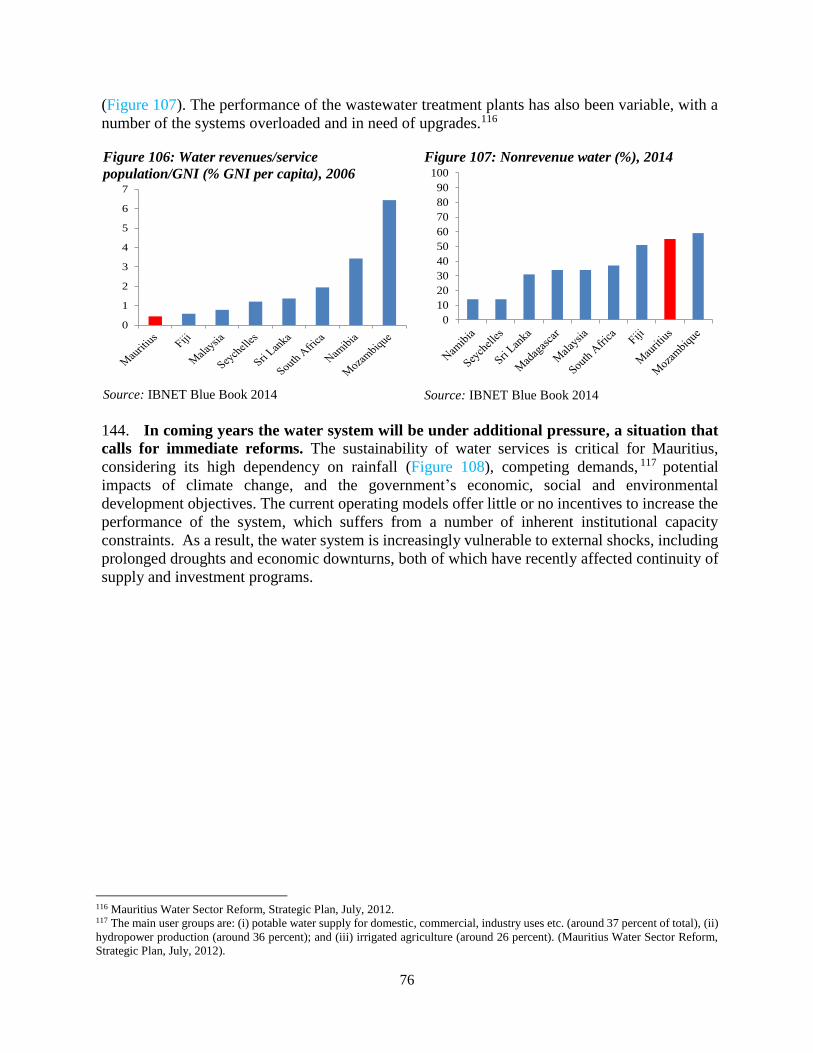
76
(Figure 107). The performance of the wastewater treatment plants has also been variable, with a
number of the systems overloaded and in need of upgrades.116
Figure 106: Water revenues/service
population/GNI (% GNI per capita), 2006
Source: IBNET Blue Book 2014
Figure 107: Nonrevenue water (%), 2014
Source: IBNET Blue Book 2014
144. In coming years the water system will be under additional pressure, a situation that
calls for immediate reforms. The sustainability of water services is critical for Mauritius,
considering its high dependency on rainfall (Figure 108), competing demands, 117 potential
impacts of climate change, and the government’s economic, social and environmental
development objectives. The current operating models offer little or no incentives to increase the
performance of the system, which suffers from a number of inherent institutional capacity
constraints. As a result, the water system is increasingly vulnerable to external shocks, including
prolonged droughts and economic downturns, both of which have recently affected continuity of
supply and investment programs.
116 Mauritius Water Sector Reform, Strategic Plan, July, 2012. 117 The main user groups are: (i) potable water supply for domestic, commercial, industry uses etc. (around 37 percent of total), (ii)
hydropower production (around 36 percent); and (iii) irrigated agriculture (around 26 percent). (Mauritius Water Sector Reform,
Strategic Plan, July, 2012).
0
1
2
3
4
5
6
7
0
10
20
30
40
50
60
70
80
90
100
77
Figure 108: Rainfall and water use (Mm3), 2012
Source: Mauritius Water Sector Reform, Strategic Plan,
July 2012
145. An integrated management approach is required to balance competing demands from
irrigated agriculture, hydropower generation, and potable supplies, while maintaining
environmental flows necessary for the protection of aquatic habitats and coastal
environments and for recharging the groundwater aquifers. There is an urgent need to embark
upon a reform process that leads toward a performance-based organization that enables
operational efficiency for improved service delivery. Improving the technical performance and
financial viability of service providers will enable further investments to enhance water security
and reduce the impact of external shocks likely to be accompanied by climate change. In this
regard, the government will need to accelerate reforms adopted in the 2014 National Water Policy
to restore sustainability to the water system.118
Limited installed capacity in the energy sector requires quick investment in electricity
generation and renewable resources
146. Energy generation and installed capacity has grown slowly. Installed capacity has
expanded by 1.7 percent between 2005 and 2011 while peak demand increased at an average rate
of 2.7 percent over the same period. As a result, operational capacity over installed capacity is
among the lowest when compared to other small islands (Figure 109). Furthermore, electricity
generation over 2005-2011 shows a decline in the share of renewable energy, with an increase in
the share of coal by 10 percent (Figure 110). A recent report from the African Development Bank
(AfDB) points out that in 2013 the Peak Load was 446 MW with overall installed capacity at
489 MW. The existing reserve of 43 MW may be too small as demand grows and repairs of power
plants are scheduled. While this slow expansion could be justified by the low load factors of most
thermal stations, new generation projects will be required, as forecasts indicate that energy
demand is likely to increase by approximately 60 percent over the next 10 years.
118 The National Water Policy published in July, 2014 establishes national water priorities and outlines improved sector governance.
Notable developments from this policy include: (1) reform institutional arrangements to separate planning / oversight, regulation
and service provision functions; (2) integrate water supply, wastewater management and irrigation sub-sectors – including the
consolidation to a single service provider; (3) prioritize water use allocation and rationalize uncontrolled water rights / allocations
granted during the colonial era; (4) establish objectives to improve financial and technical performance of the water service
providers, including reduction of non-water revenues to 20 percent by 2040; (5) establish objectives and mechanisms for the
protection, conservation, and enhancement of water resources and the overall aquatic environment; and (6) introduce potential
areas for PPP in the water sector.
3,700
1,233
633 725
0
500
1,000
1,500
2,000
2,500
3,000
3,500
4,000
Average daily
rainfall
total utilizable
water
water demand -
2012
water demand
2050
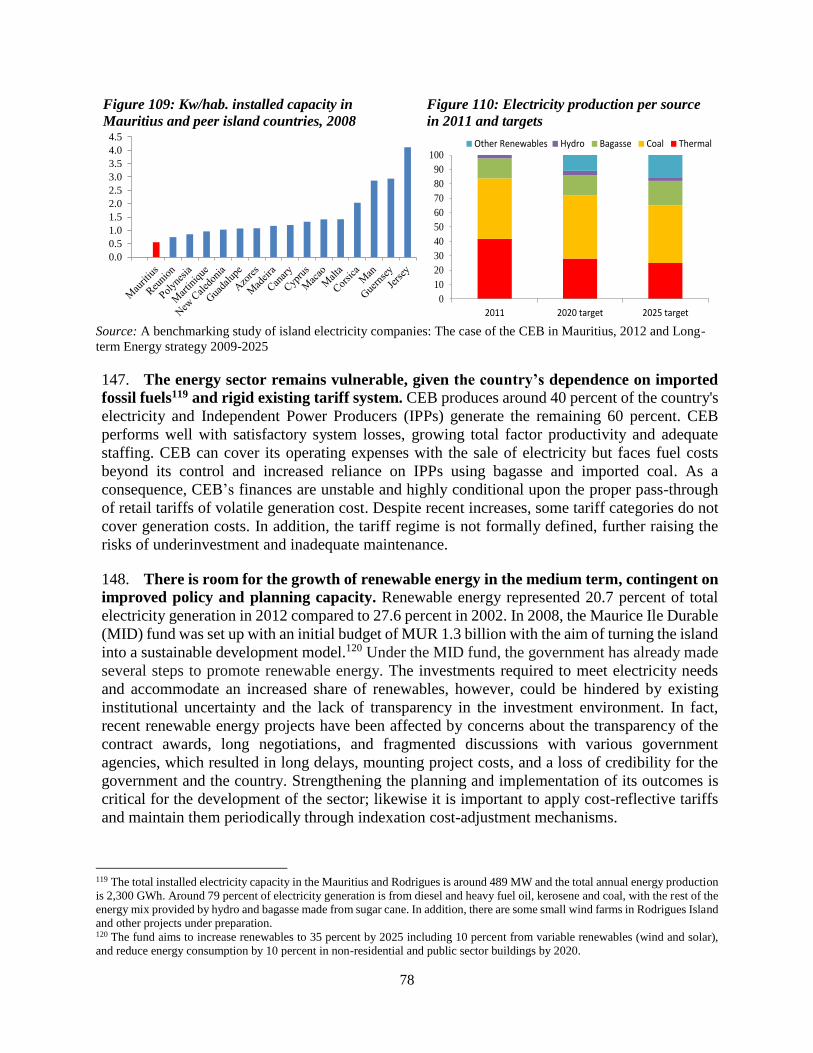
78
Figure 109: Kw/hab. installed capacity in
Mauritius and peer island countries, 2008
Figure 110: Electricity production per source
in 2011 and targets
Source: A benchmarking study of island electricity companies: The case of the CEB in Mauritius, 2012 and Long-
term Energy strategy 2009-2025
147. The energy sector remains vulnerable, given the country’s dependence on imported
fossil fuels119 and rigid existing tariff system. CEB produces around 40 percent of the country's
electricity and Independent Power Producers (IPPs) generate the remaining 60 percent. CEB
performs well with satisfactory system losses, growing total factor productivity and adequate
staffing. CEB can cover its operating expenses with the sale of electricity but faces fuel costs
beyond its control and increased reliance on IPPs using bagasse and imported coal. As a
consequence, CEB’s finances are unstable and highly conditional upon the proper pass-through
of retail tariffs of volatile generation cost. Despite recent increases, some tariff categories do not
cover generation costs. In addition, the tariff regime is not formally defined, further raising the
risks of underinvestment and inadequate maintenance.
148. There is room for the growth of renewable energy in the medium term, contingent on
improved policy and planning capacity. Renewable energy represented 20.7 percent of total
electricity generation in 2012 compared to 27.6 percent in 2002. In 2008, the Maurice Ile Durable
(MID) fund was set up with an initial budget of MUR 1.3 billion with the aim of turning the island
into a sustainable development model.120 Under the MID fund, the government has already made
several steps to promote renewable energy. The investments required to meet electricity needs
and accommodate an increased share of renewables, however, could be hindered by existing
institutional uncertainty and the lack of transparency in the investment environment. In fact,
recent renewable energy projects have been affected by concerns about the transparency of the
contract awards, long negotiations, and fragmented discussions with various government
agencies, which resulted in long delays, mounting project costs, and a loss of credibility for the
government and the country. Strengthening the planning and implementation of its outcomes is
critical for the development of the sector; likewise it is important to apply cost-reflective tariffs
and maintain them periodically through indexation cost-adjustment mechanisms.
119 The total installed electricity capacity in the Mauritius and Rodrigues is around 489 MW and the total annual energy production
is 2,300 GWh. Around 79 percent of electricity generation is from diesel and heavy fuel oil, kerosene and coal, with the rest of the
energy mix provided by hydro and bagasse made from sugar cane. In addition, there are some small wind farms in Rodrigues Island
and other projects under preparation. 120 The fund aims to increase renewables to 35 percent by 2025 including 10 percent from variable renewables (wind and solar),
and reduce energy consumption by 10 percent in non-residential and public sector buildings by 2020.
0.0
0.5
1.0
1.5
2.0
2.5
3.0
3.5
4.0
4.5
0
10
20
30
40
50
60
70
80
90
100
2011 2020 target 2025 target
Other Renewables Hydro Bagasse Coal Thermal

79
Increased exposure to natural hazards poses a serious threat to urban infrastructure settlements
and the livelihood of their inhabitants
149. Urban environmental issues are currently being taken up with the Ministry of Housing and
Land, with limited responsibilities given to municipal councils. Ad-hoc committees are formed
only when environmental issues arise. To meet current challenges it is necessary to (i) strengthen
leadership capacities and institutional frameworks so as to manage natural disasters and climate
change risks and opportunities in an integrated manner at the local level, (ii) mainstream a certain
number of environmental issues (solid waste management, global climate change, pollution, etc.)
in municipal policies and domesticate these issues at the municipal level, and (iii) encourage
inclusive participation of stakeholders and inhabitants to enforce policies.
While road investments have kept pace with demand to date, rapidly growing congestion
threatens the sustainability of the road network.
150. There has been a substantial increase in the road network. Mauritius has been investing
considerable sums in developing its road network to the tune of 6.6 percent of the total public
budget in 2013.121 The country possesses about 2,000 km of roads with a density of 102 km per
100 km2 of land area, well above the African average of 15 km per 100 km2 (Figure 111). On a
per capita basis, Mauritius has already surpassed many higher income countries in part because
more advanced economies often focus more on developing efficient and compact cities, resulting
in lower road density per capita (Figure 112).
Figure 111: Road density per land area
Source: WDI
Figure 112: Road density per capita
Source: WDI
151. Much of the network was not designed to carry the current traffic volume and load. The majority of the existing paved network reflects a gradual improvement over older roads which
were often based on old sugar cane tracks.122 Where expansion and upgrading of the road network
has taken place, it has been undertaken employing a mix of design standards and specifications,
which often do not include considerations of disaster risks. The result is a lack of uniformity in
standards across the network, occasionally resulting in different standards on adjacent sections of
the same category road.
152. The emphasis on developing the network has not been matched by a similar emphasis
on maintenance. Maintenance of roads is done annually through contracts, or directly by the
121 World Bank (2013). “Mauritius Policy Notes: Building Analytical Capacity to Raise Public Sector Efficiency.” 122 For instance, inadequate width on major roads, poor geometry, understrength pavement, poor drainage in built up areas, and
insufficient footways and parking space in business and commercial zones.
481
191 174
110 102
25 50
50100150200250300350400450500
Ro
ad
len
gth
(k
m p
er 1
00
km
2 o
f
lan
d a
rea
)
6.6
5.85.5
1.6
0.7 0.60.3
0
2
4
6
Upper MIC
avg.
Seychelles Sri Lanka Mauritius Singapore UAE Hong
KongSAR, China
Ro
ad
len
gth
(k
m p
er 1
,00
0
po
pu
lati
on
)
SAR, C
hina
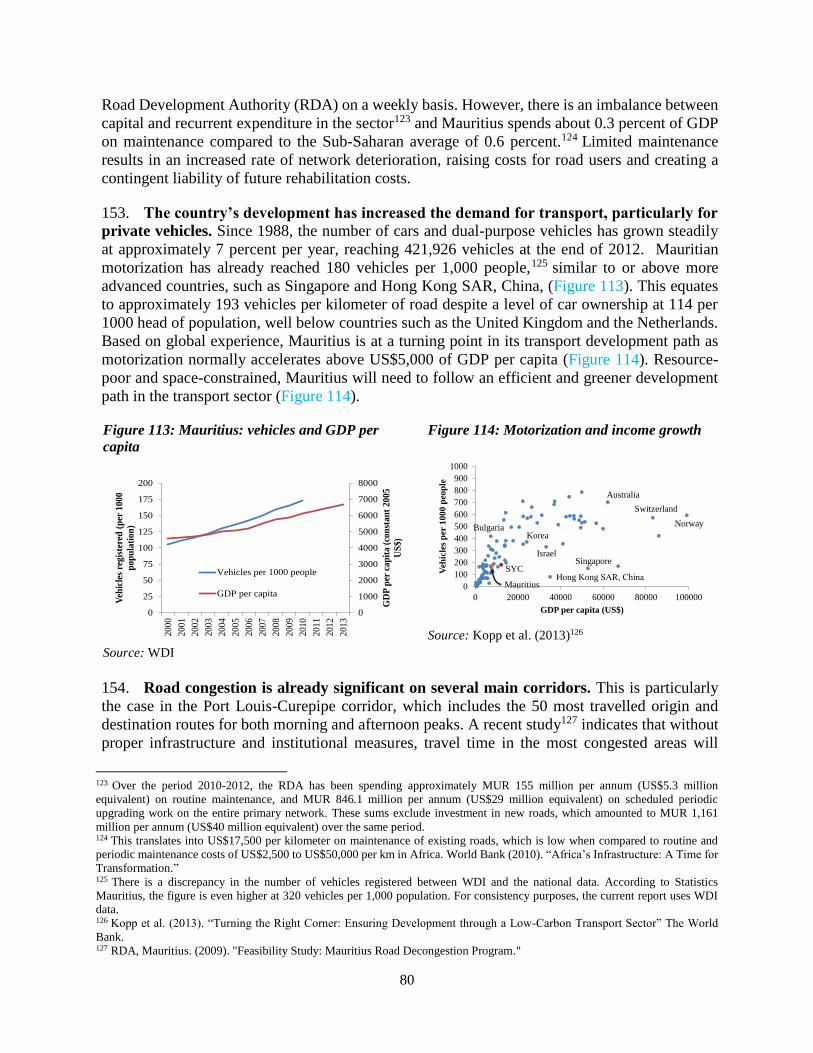
80
Road Development Authority (RDA) on a weekly basis. However, there is an imbalance between
capital and recurrent expenditure in the sector123 and Mauritius spends about 0.3 percent of GDP
on maintenance compared to the Sub-Saharan average of 0.6 percent.124 Limited maintenance
results in an increased rate of network deterioration, raising costs for road users and creating a
contingent liability of future rehabilitation costs.
153. The country’s development has increased the demand for transport, particularly for
private vehicles. Since 1988, the number of cars and dual-purpose vehicles has grown steadily
at approximately 7 percent per year, reaching 421,926 vehicles at the end of 2012. Mauritian
motorization has already reached 180 vehicles per 1,000 people,125 similar to or above more
advanced countries, such as Singapore and Hong Kong SAR, China, (Figure 113). This equates
to approximately 193 vehicles per kilometer of road despite a level of car ownership at 114 per
1000 head of population, well below countries such as the United Kingdom and the Netherlands.
Based on global experience, Mauritius is at a turning point in its transport development path as
motorization normally accelerates above US$5,000 of GDP per capita (Figure 114). Resource-
poor and space-constrained, Mauritius will need to follow an efficient and greener development
path in the transport sector (Figure 114).
Figure 113: Mauritius: vehicles and GDP per
capita
Source: WDI
Figure 114: Motorization and income growth
Source: Kopp et al. (2013)126
154. Road congestion is already significant on several main corridors. This is particularly
the case in the Port Louis-Curepipe corridor, which includes the 50 most travelled origin and
destination routes for both morning and afternoon peaks. A recent study127 indicates that without
proper infrastructure and institutional measures, travel time in the most congested areas will
123 Over the period 2010-2012, the RDA has been spending approximately MUR 155 million per annum (US$5.3 million
equivalent) on routine maintenance, and MUR 846.1 million per annum (US$29 million equivalent) on scheduled periodic
upgrading work on the entire primary network. These sums exclude investment in new roads, which amounted to MUR 1,161
million per annum (US$40 million equivalent) over the same period. 124 This translates into US$17,500 per kilometer on maintenance of existing roads, which is low when compared to routine and
periodic maintenance costs of US$2,500 to US$50,000 per km in Africa. World Bank (2010). “Africa’s Infrastructure: A Time for
Transformation.” 125 There is a discrepancy in the number of vehicles registered between WDI and the national data. According to Statistics
Mauritius, the figure is even higher at 320 vehicles per 1,000 population. For consistency purposes, the current report uses WDI
data. 126 Kopp et al. (2013). “Turning the Right Corner: Ensuring Development through a Low-Carbon Transport Sector” The World
Bank. 127 RDA, Mauritius. (2009). "Feasibility Study: Mauritius Road Decongestion Program."
0
1000
2000
3000
4000
5000
6000
7000
8000
0
25
50
75
100
125
150
175
200
20
00
20
01
20
02
2003
20
04
20
05
20
06
20
07
20
08
20
09
2010
20
11
20
12
20
13
GD
P p
er c
ap
ita
(co
nst
an
t 2
00
5
US
$)
Veh
icle
s re
gis
tere
d (
per
10
00
po
pu
lati
on
)
Vehicles per 1000 people
GDP per capita
Norway
Switzerland
Australia
Singapore
Hong Kong SAR, China
Israel
Korea
SYC
Mauritius
Bulgaria
0
100
200
300
400
500
600
700
800
900
1000
0 20000 40000 60000 80000 100000
Veh
icle
s p
er 1
000 p
eop
le
GDP per capita (US$)
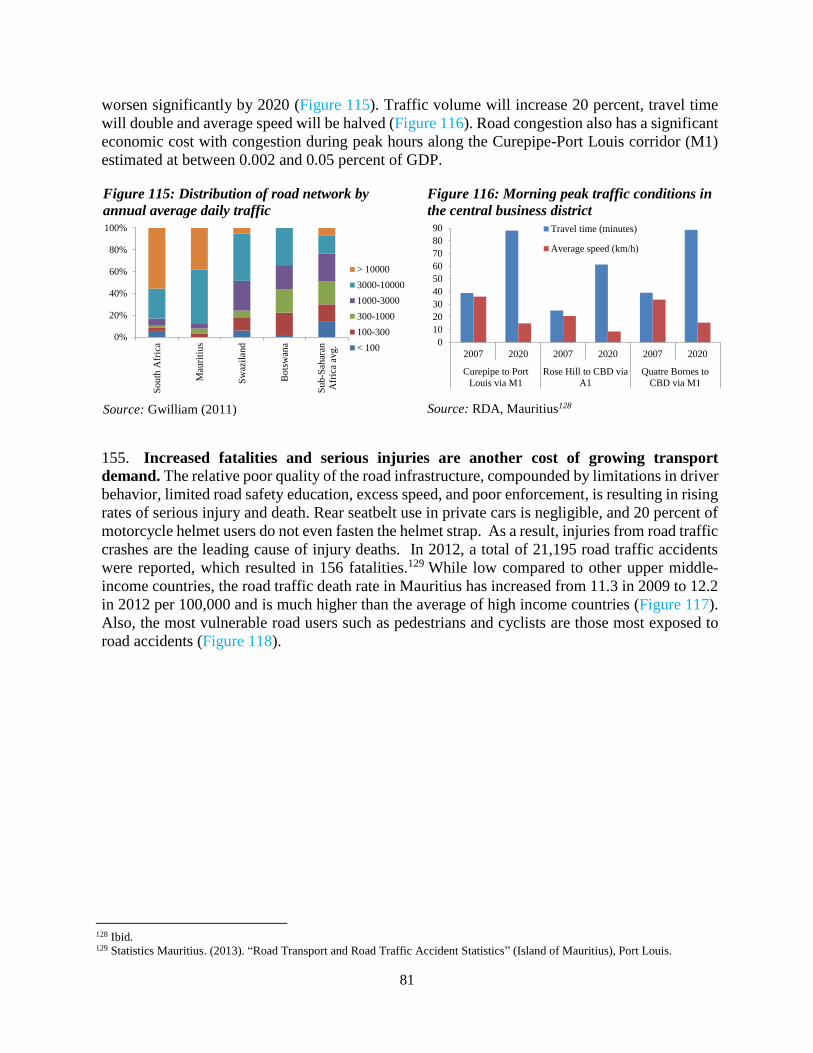
81
worsen significantly by 2020 (Figure 115). Traffic volume will increase 20 percent, travel time
will double and average speed will be halved (Figure 116). Road congestion also has a significant
economic cost with congestion during peak hours along the Curepipe-Port Louis corridor (M1)
estimated at between 0.002 and 0.05 percent of GDP.
Figure 115: Distribution of road network by
annual average daily traffic
Source: Gwilliam (2011)
Figure 116: Morning peak traffic conditions in
the central business district
Source: RDA, Mauritius128
155. Increased fatalities and serious injuries are another cost of growing transport
demand. The relative poor quality of the road infrastructure, compounded by limitations in driver
behavior, limited road safety education, excess speed, and poor enforcement, is resulting in rising
rates of serious injury and death. Rear seatbelt use in private cars is negligible, and 20 percent of
motorcycle helmet users do not even fasten the helmet strap. As a result, injuries from road traffic
crashes are the leading cause of injury deaths. In 2012, a total of 21,195 road traffic accidents
were reported, which resulted in 156 fatalities.129 While low compared to other upper middle-
income countries, the road traffic death rate in Mauritius has increased from 11.3 in 2009 to 12.2
in 2012 per 100,000 and is much higher than the average of high income countries (Figure 117).
Also, the most vulnerable road users such as pedestrians and cyclists are those most exposed to
road accidents (Figure 118).
128 Ibid. 129 Statistics Mauritius. (2013). “Road Transport and Road Traffic Accident Statistics” (Island of Mauritius), Port Louis.
0%
20%
40%
60%
80%
100%
South
Afr
ica
Mau
riti
us
Sw
azil
and
Bots
wan
a
Sub-S
ahar
an
Afr
ica
avg.
> 10000
3000-10000
1000-3000
300-1000
100-300
< 1000
10
20
30
40
50
60
70
80
90
2007 2020 2007 2020 2007 2020
Curepipe to Port
Louis via M1
Rose Hill to CBD via
A1
Quatre Bornes to
CBD via M1
Travel time (minutes)
Average speed (km/h)

82
Figure 117: Road traffic death rate per 100,000
population
Source: WHO Global Health Observatory (GHO)
Figure 118: Distribution of road accident
deaths
Source: WHO Global Health Observatory (GHO)
Sustainable transport policies are required to manage demand while providing high quality
public transport
156. Improved demand-side management is needed to deal with growing congestion and
to ensure financial and environmental sustainability of transport sector development. Mauritius may be over-dependent on private vehicles. To provide the right incentives, transport
prices need to be rationalized to reflect the social and economic cost of the choice of
transportation.130 Thus, higher taxes and charges on car ownership and use could serve to retain
a socially optimal use of private vehicles, mitigating the social and economic costs. Various price
measures can be used to this end, including further raising fuel taxes or raising registration fees
for new purchased and imported vehicles, despite both of these being largely in line with other
upper-middle and higher income countries (Figure 119). A parking policy could provide
appropriate incentives to road users given that parking even in cities is between US$0.28 and
US$0.6 per hour, which is below the norm in advanced economies where the parking rates are
US$3-10 per hour or US$18-30 per day.131
130 The literature indicates that the price elasticity of passenger car transport demand ranges from -0.03 to -0.4 in the short run and
-0.6 to -1.1 in the long run (Chamon et al. 2008). 131 Although it generally accounts for a tiny fraction of total roads, road pricing has certain potential to mitigate congestion as
international experiences show that relatively minor investments have reduced vehicle travel substantially. A congestion charge of
MUR 100 for private vehicles and MUR 200 for freight vehicles was proposed by the government in 2006 but never implemented.
7.8
16.117.8
20.6
3.75.1
12.2 12.7 13.7 15
20.823.4
31.9
0
5
10
15
20
25
30
35
0%
20%
40%
60%
80%
100%
Swaziland Mauritius Botswana Singapore UK
Other Cyclists Driver & vehicle passengers Pedestrians
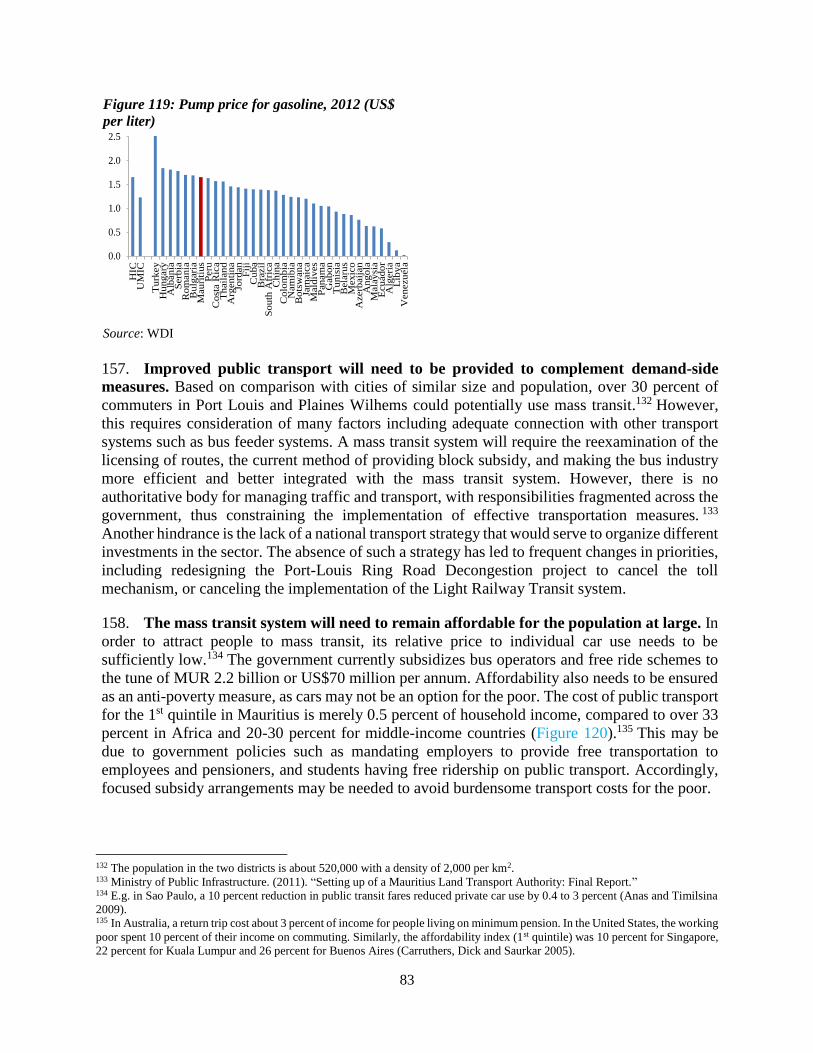
83
Figure 119: Pump price for gasoline, 2012 (US$
per liter)
Source: WDI
157. Improved public transport will need to be provided to complement demand-side
measures. Based on comparison with cities of similar size and population, over 30 percent of
commuters in Port Louis and Plaines Wilhems could potentially use mass transit.132 However,
this requires consideration of many factors including adequate connection with other transport
systems such as bus feeder systems. A mass transit system will require the reexamination of the
licensing of routes, the current method of providing block subsidy, and making the bus industry
more efficient and better integrated with the mass transit system. However, there is no
authoritative body for managing traffic and transport, with responsibilities fragmented across the
government, thus constraining the implementation of effective transportation measures. 133
Another hindrance is the lack of a national transport strategy that would serve to organize different
investments in the sector. The absence of such a strategy has led to frequent changes in priorities,
including redesigning the Port-Louis Ring Road Decongestion project to cancel the toll
mechanism, or canceling the implementation of the Light Railway Transit system.
158. The mass transit system will need to remain affordable for the population at large. In
order to attract people to mass transit, its relative price to individual car use needs to be
sufficiently low.134 The government currently subsidizes bus operators and free ride schemes to
the tune of MUR 2.2 billion or US$70 million per annum. Affordability also needs to be ensured
as an anti-poverty measure, as cars may not be an option for the poor. The cost of public transport
for the 1st quintile in Mauritius is merely 0.5 percent of household income, compared to over 33
percent in Africa and 20-30 percent for middle-income countries (Figure 120).135 This may be
due to government policies such as mandating employers to provide free transportation to
employees and pensioners, and students having free ridership on public transport. Accordingly,
focused subsidy arrangements may be needed to avoid burdensome transport costs for the poor.
132 The population in the two districts is about 520,000 with a density of 2,000 per km2. 133 Ministry of Public Infrastructure. (2011). “Setting up of a Mauritius Land Transport Authority: Final Report.” 134 E.g. in Sao Paulo, a 10 percent reduction in public transit fares reduced private car use by 0.4 to 3 percent (Anas and Timilsina
2009). 135 In Australia, a return trip cost about 3 percent of income for people living on minimum pension. In the United States, the working
poor spent 10 percent of their income on commuting. Similarly, the affordability index (1st quintile) was 10 percent for Singapore,
22 percent for Kuala Lumpur and 26 percent for Buenos Aires (Carruthers, Dick and Saurkar 2005).
0.0
0.5
1.0
1.5
2.0
2.5H
ICU
MIC
Tu
rkey
Hun
gary
Alb
ania
Serb
iaR
om
ania
Bu
lgari
aM
au
riti
us
Peru
Cost
a R
ica
Thail
an
dA
rgenti
na
Jord
an
Fij
iC
ub
aB
razil
Sou
th A
fric
aC
hin
aC
olo
mbia
Nam
ibia
Bots
wana
Jam
aic
aM
ald
ives
Panam
aG
abo
nT
unis
iaB
ela
rus
Mexic
oA
zerb
aij
an
An
go
laM
ala
ysi
aE
cuad
or
Alg
eri
aL
iby
aV
enezuela
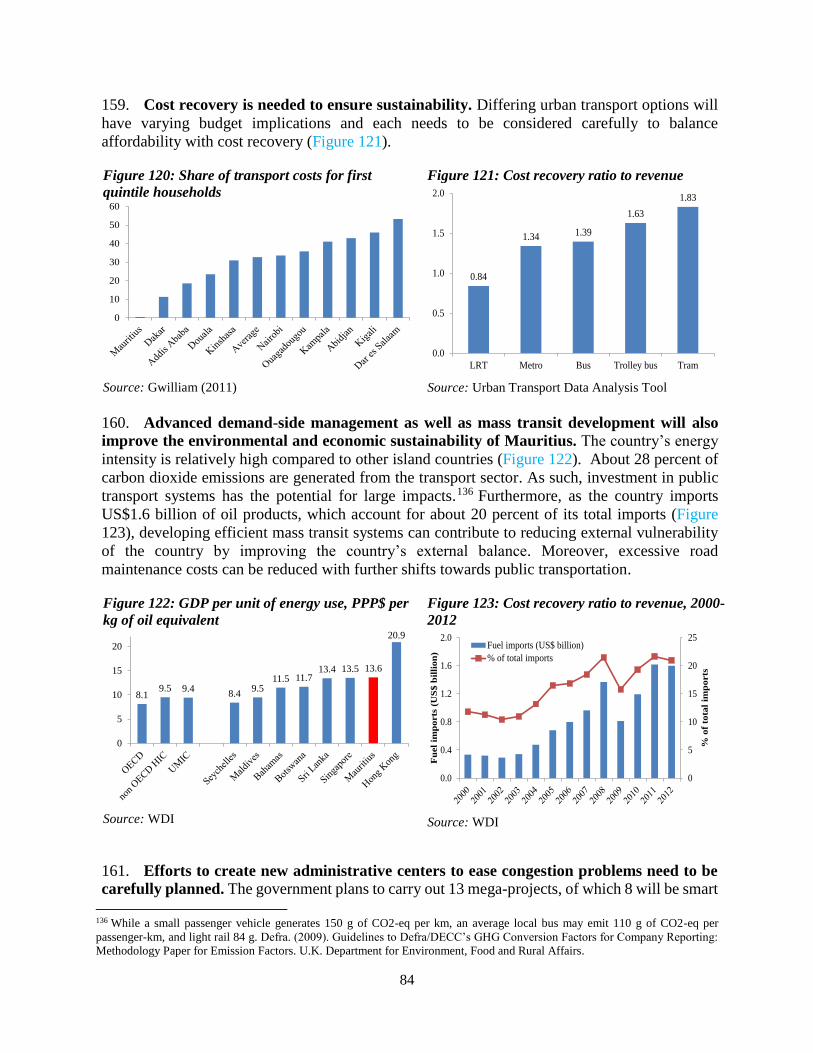
84
159. Cost recovery is needed to ensure sustainability. Differing urban transport options will
have varying budget implications and each needs to be considered carefully to balance
affordability with cost recovery (Figure 121).
Figure 120: Share of transport costs for first
quintile households
Source: Gwilliam (2011)
Figure 121: Cost recovery ratio to revenue
Source: Urban Transport Data Analysis Tool
160. Advanced demand-side management as well as mass transit development will also
improve the environmental and economic sustainability of Mauritius. The country’s energy
intensity is relatively high compared to other island countries (Figure 122). About 28 percent of
carbon dioxide emissions are generated from the transport sector. As such, investment in public
transport systems has the potential for large impacts.136 Furthermore, as the country imports
US$1.6 billion of oil products, which account for about 20 percent of its total imports (Figure
123), developing efficient mass transit systems can contribute to reducing external vulnerability
of the country by improving the country’s external balance. Moreover, excessive road
maintenance costs can be reduced with further shifts towards public transportation.
Figure 122: GDP per unit of energy use, PPP$ per
kg of oil equivalent
Source: WDI
Figure 123: Cost recovery ratio to revenue, 2000-
2012
Source: WDI
161. Efforts to create new administrative centers to ease congestion problems need to be
carefully planned. The government plans to carry out 13 mega-projects, of which 8 will be smart
136 While a small passenger vehicle generates 150 g of CO2-eq per km, an average local bus may emit 110 g of CO2-eq per
passenger-km, and light rail 84 g. Defra. (2009). Guidelines to Defra/DECC’s GHG Conversion Factors for Company Reporting:
Methodology Paper for Emission Factors. U.K. Department for Environment, Food and Rural Affairs.
0
10
20
30
40
50
60
0.84
1.34 1.39
1.63
1.83
0.0
0.5
1.0
1.5
2.0
LRT Metro Bus Trolley bus Tram
8.19.5 9.4
8.49.5
11.5 11.713.4 13.5 13.6
20.9
0
5
10
15
20
0
5
10
15
20
25
0.0
0.4
0.8
1.2
1.6
2.0
% o
f to
tal
imp
orts
Fu
el
imp
orts
(U
S$
bil
lio
n)
Fuel imports (US$ billion)
% of total imports
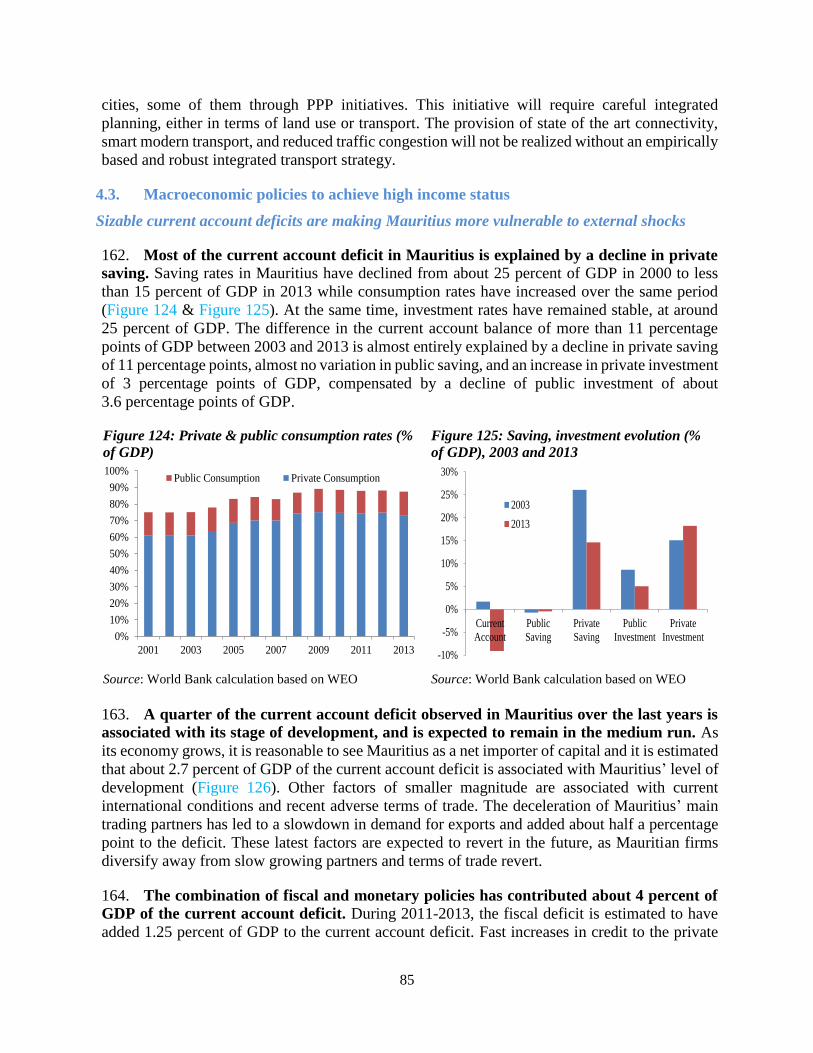
85
cities, some of them through PPP initiatives. This initiative will require careful integrated
planning, either in terms of land use or transport. The provision of state of the art connectivity,
smart modern transport, and reduced traffic congestion will not be realized without an empirically
based and robust integrated transport strategy.
4.3. Macroeconomic policies to achieve high income status
Sizable current account deficits are making Mauritius more vulnerable to external shocks
162. Most of the current account deficit in Mauritius is explained by a decline in private
saving. Saving rates in Mauritius have declined from about 25 percent of GDP in 2000 to less
than 15 percent of GDP in 2013 while consumption rates have increased over the same period
(Figure 124 & Figure 125). At the same time, investment rates have remained stable, at around
25 percent of GDP. The difference in the current account balance of more than 11 percentage
points of GDP between 2003 and 2013 is almost entirely explained by a decline in private saving
of 11 percentage points, almost no variation in public saving, and an increase in private investment
of 3 percentage points of GDP, compensated by a decline of public investment of about
3.6 percentage points of GDP.
Figure 124: Private & public consumption rates (%
of GDP)
Figure 125: Saving, investment evolution (%
of GDP), 2003 and 2013
Source: World Bank calculation based on WEO Source: World Bank calculation based on WEO
163. A quarter of the current account deficit observed in Mauritius over the last years is
associated with its stage of development, and is expected to remain in the medium run. As
its economy grows, it is reasonable to see Mauritius as a net importer of capital and it is estimated
that about 2.7 percent of GDP of the current account deficit is associated with Mauritius’ level of
development (Figure 126). Other factors of smaller magnitude are associated with current
international conditions and recent adverse terms of trade. The deceleration of Mauritius’ main
trading partners has led to a slowdown in demand for exports and added about half a percentage
point to the deficit. These latest factors are expected to revert in the future, as Mauritian firms
diversify away from slow growing partners and terms of trade revert.
164. The combination of fiscal and monetary policies has contributed about 4 percent of
GDP of the current account deficit. During 2011-2013, the fiscal deficit is estimated to have
added 1.25 percent of GDP to the current account deficit. Fast increases in credit to the private
0%
10%
20%
30%
40%
50%
60%
70%
80%
90%
100%
2001 2003 2005 2007 2009 2011 2013
Public Consumption Private Consumption
-10%
-5%
0%
5%
10%
15%
20%
25%
30%
Current
Account
Public
Saving
Private
Saving
Public
Investment
Private
Investment
2003
2013
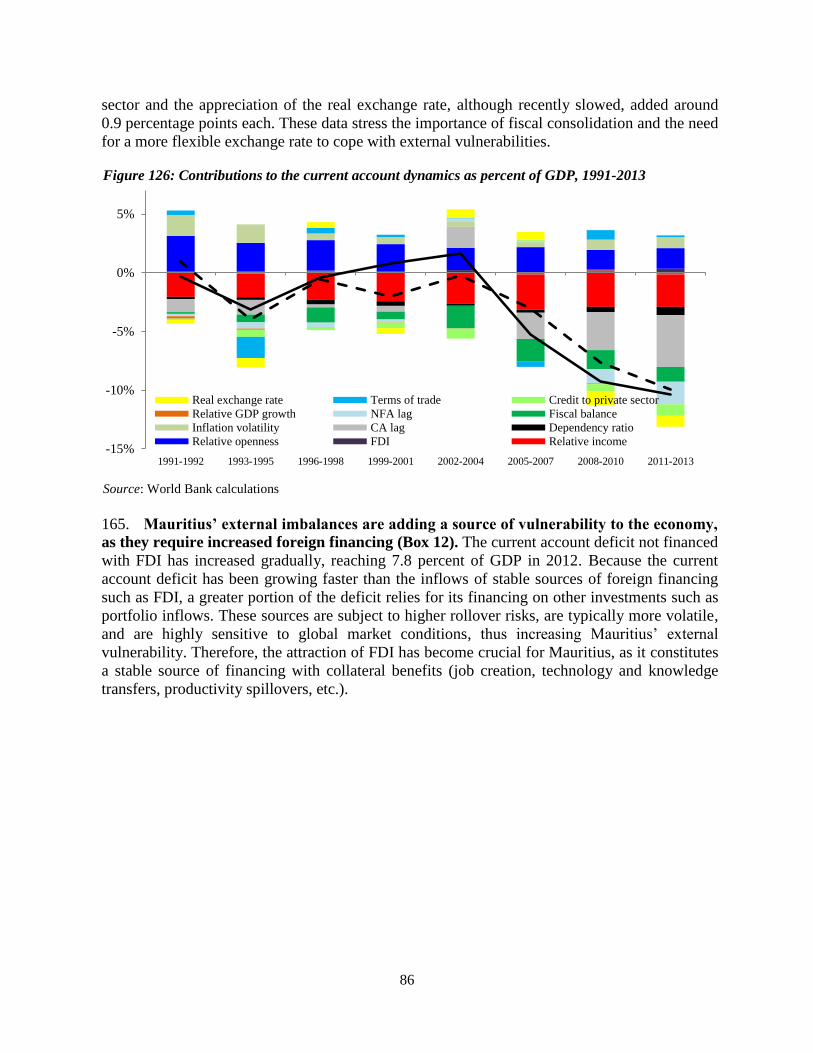
86
sector and the appreciation of the real exchange rate, although recently slowed, added around
0.9 percentage points each. These data stress the importance of fiscal consolidation and the need
for a more flexible exchange rate to cope with external vulnerabilities.
Figure 126: Contributions to the current account dynamics as percent of GDP, 1991-2013
Source: World Bank calculations
165. Mauritius’ external imbalances are adding a source of vulnerability to the economy,
as they require increased foreign financing (Box 12). The current account deficit not financed
with FDI has increased gradually, reaching 7.8 percent of GDP in 2012. Because the current
account deficit has been growing faster than the inflows of stable sources of foreign financing
such as FDI, a greater portion of the deficit relies for its financing on other investments such as
portfolio inflows. These sources are subject to higher rollover risks, are typically more volatile,
and are highly sensitive to global market conditions, thus increasing Mauritius’ external
vulnerability. Therefore, the attraction of FDI has become crucial for Mauritius, as it constitutes
a stable source of financing with collateral benefits (job creation, technology and knowledge
transfers, productivity spillovers, etc.).
-15%
-10%
-5%
0%
5%
1991-1992 1993-1995 1996-1998 1999-2001 2002-2004 2005-2007 2008-2010 2011-2013
Real exchange rate Terms of trade Credit to private sector
Relative GDP growth NFA lag Fiscal balance
Inflation volatility CA lag Dependency ratio
Relative openness FDI Relative income
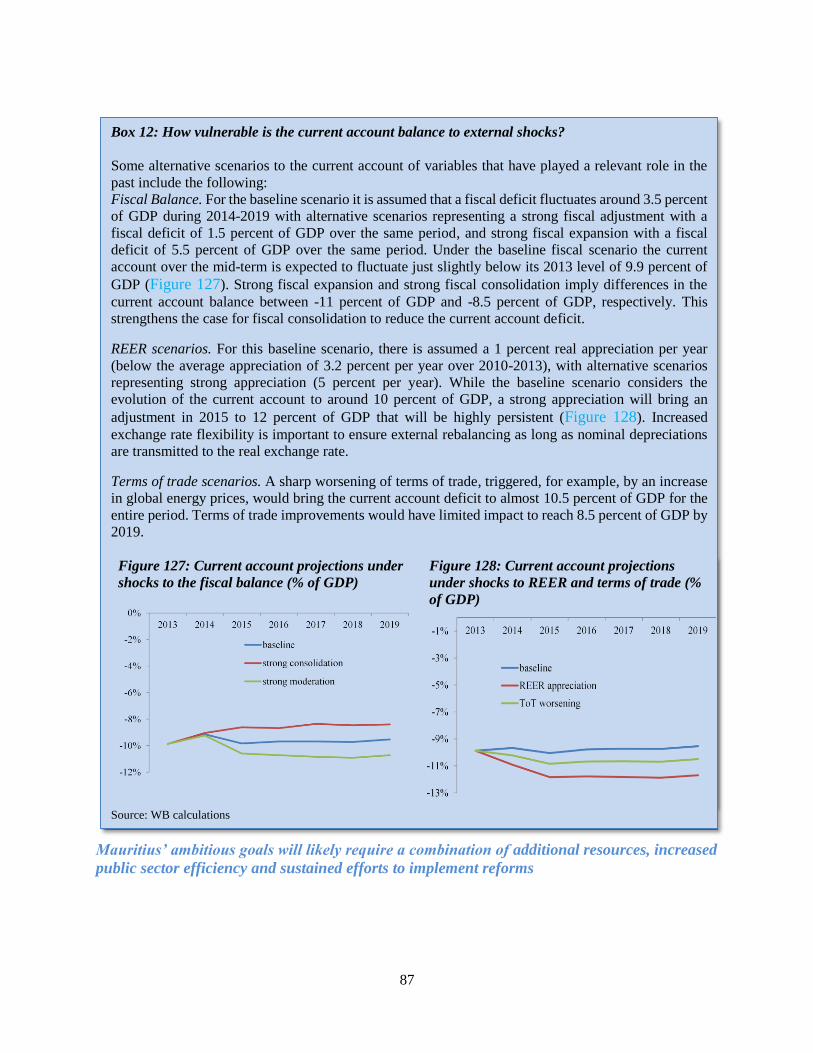
87
Mauritius’ ambitious goals will likely require a combination of additional resources, increased
public sector efficiency and sustained efforts to implement reforms
Box 12: How vulnerable is the current account balance to external shocks?
Some alternative scenarios to the current account of variables that have played a relevant role in the
past include the following:
Fiscal Balance. For the baseline scenario it is assumed that a fiscal deficit fluctuates around 3.5 percent
of GDP during 2014-2019 with alternative scenarios representing a strong fiscal adjustment with a
fiscal deficit of 1.5 percent of GDP over the same period, and strong fiscal expansion with a fiscal
deficit of 5.5 percent of GDP over the same period. Under the baseline fiscal scenario the current
account over the mid-term is expected to fluctuate just slightly below its 2013 level of 9.9 percent of
GDP (Figure 127). Strong fiscal expansion and strong fiscal consolidation imply differences in the
current account balance between -11 percent of GDP and -8.5 percent of GDP, respectively. This
strengthens the case for fiscal consolidation to reduce the current account deficit.
REER scenarios. For this baseline scenario, there is assumed a 1 percent real appreciation per year
(below the average appreciation of 3.2 percent per year over 2010-2013), with alternative scenarios
representing strong appreciation (5 percent per year). While the baseline scenario considers the
evolution of the current account to around 10 percent of GDP, a strong appreciation will bring an
adjustment in 2015 to 12 percent of GDP that will be highly persistent (Figure 128). Increased
exchange rate flexibility is important to ensure external rebalancing as long as nominal depreciations
are transmitted to the real exchange rate.
Terms of trade scenarios. A sharp worsening of terms of trade, triggered, for example, by an increase
in global energy prices, would bring the current account deficit to almost 10.5 percent of GDP for the
entire period. Terms of trade improvements would have limited impact to reach 8.5 percent of GDP by
2019.
Figure 127: Current account projections under
shocks to the fiscal balance (% of GDP)
Figure 128: Current account projections
under shocks to REER and terms of trade (%
of GDP)
Source: WB calculations
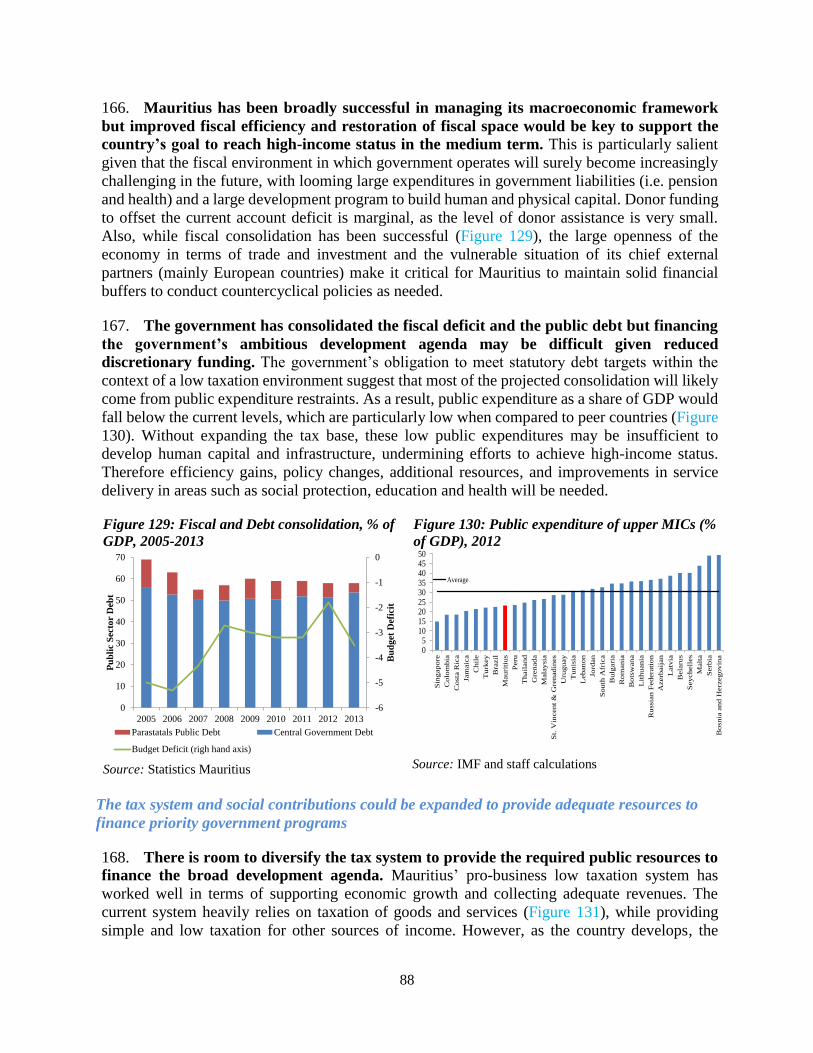
88
166. Mauritius has been broadly successful in managing its macroeconomic framework
but improved fiscal efficiency and restoration of fiscal space would be key to support the
country’s goal to reach high-income status in the medium term. This is particularly salient
given that the fiscal environment in which government operates will surely become increasingly
challenging in the future, with looming large expenditures in government liabilities (i.e. pension
and health) and a large development program to build human and physical capital. Donor funding
to offset the current account deficit is marginal, as the level of donor assistance is very small.
Also, while fiscal consolidation has been successful (Figure 129), the large openness of the
economy in terms of trade and investment and the vulnerable situation of its chief external
partners (mainly European countries) make it critical for Mauritius to maintain solid financial
buffers to conduct countercyclical policies as needed.
167. The government has consolidated the fiscal deficit and the public debt but financing
the government’s ambitious development agenda may be difficult given reduced
discretionary funding. The government’s obligation to meet statutory debt targets within the
context of a low taxation environment suggest that most of the projected consolidation will likely
come from public expenditure restraints. As a result, public expenditure as a share of GDP would
fall below the current levels, which are particularly low when compared to peer countries (Figure
130). Without expanding the tax base, these low public expenditures may be insufficient to
develop human capital and infrastructure, undermining efforts to achieve high-income status.
Therefore efficiency gains, policy changes, additional resources, and improvements in service
delivery in areas such as social protection, education and health will be needed.
Figure 129: Fiscal and Debt consolidation, % of
GDP, 2005-2013
Source: Statistics Mauritius
Figure 130: Public expenditure of upper MICs (%
of GDP), 2012
Source: IMF and staff calculations
The tax system and social contributions could be expanded to provide adequate resources to
finance priority government programs
168. There is room to diversify the tax system to provide the required public resources to
finance the broad development agenda. Mauritius’ pro-business low taxation system has
worked well in terms of supporting economic growth and collecting adequate revenues. The
current system heavily relies on taxation of goods and services (Figure 131), while providing
simple and low taxation for other sources of income. However, as the country develops, the
-6
-5
-4
-3
-2
-1
0
0
10
20
30
40
50
60
70
2005 2006 2007 2008 2009 2010 2011 2012 2013
Bu
dget
Def
icit
Pu
bli
c S
ecto
r D
ebt
Parastatals Public Debt Central Government Debt
Budget Deficit (righ hand axis)
05
101520253035404550
Sin
gap
ore
Co
lom
bia
Co
sta
Ric
a
Jam
aic
a
Ch
ile
Tu
rkey
Bra
zil
Mau
riti
us
Peru
Th
ail
an
d
Gre
nad
a
Mala
ysia
St.
Vin
cen
t &
Gre
nad
ines
Uru
gu
ay
Tu
nis
ia
Leb
an
on
Jo
rdan
So
uth
Afr
ica
Bu
lgari
a
Ro
man
ia
Bo
tsw
an
a
Lit
hu
an
ia
Ru
ssi
an
Fed
era
tio
n
Azerb
aij
an
Latv
ia
Bela
rus
Sey
ch
ell
es
Malt
a
Serb
ia
Bo
snia
an
d H
erz
ego
vin
a
Average
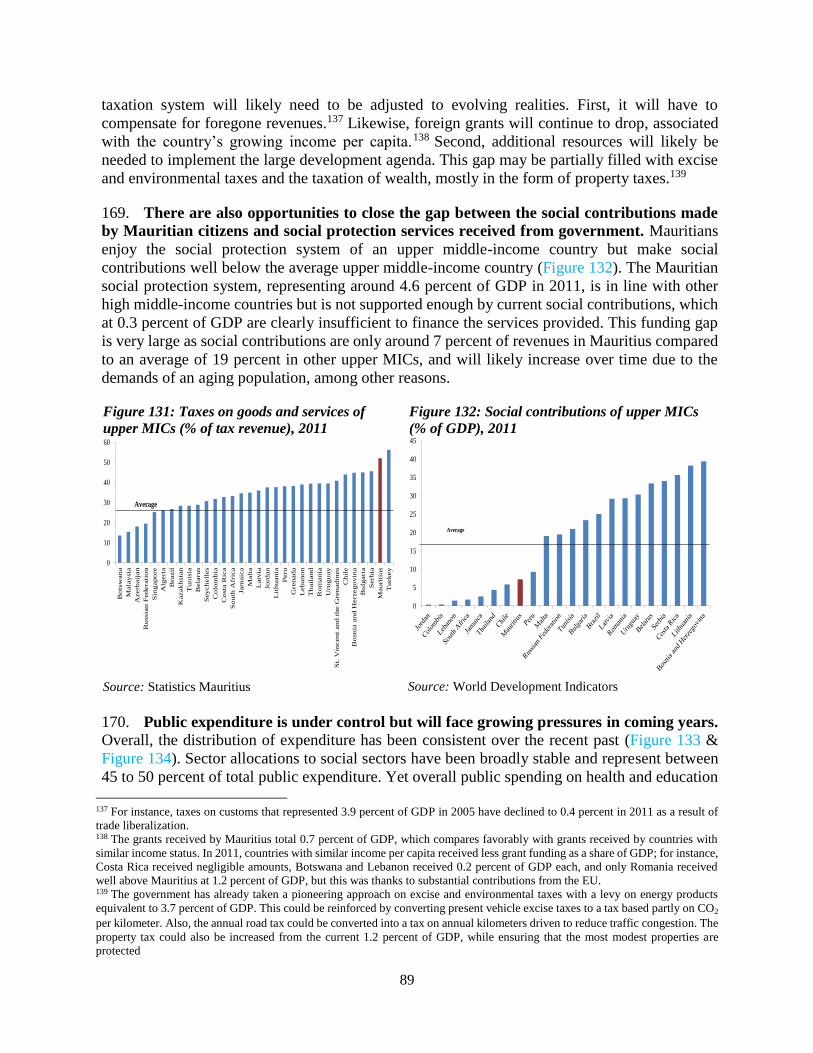
89
taxation system will likely need to be adjusted to evolving realities. First, it will have to
compensate for foregone revenues.137 Likewise, foreign grants will continue to drop, associated
with the country’s growing income per capita.138 Second, additional resources will likely be
needed to implement the large development agenda. This gap may be partially filled with excise
and environmental taxes and the taxation of wealth, mostly in the form of property taxes.139
169. There are also opportunities to close the gap between the social contributions made
by Mauritian citizens and social protection services received from government. Mauritians
enjoy the social protection system of an upper middle-income country but make social
contributions well below the average upper middle-income country (Figure 132). The Mauritian
social protection system, representing around 4.6 percent of GDP in 2011, is in line with other
high middle-income countries but is not supported enough by current social contributions, which
at 0.3 percent of GDP are clearly insufficient to finance the services provided. This funding gap
is very large as social contributions are only around 7 percent of revenues in Mauritius compared
to an average of 19 percent in other upper MICs, and will likely increase over time due to the
demands of an aging population, among other reasons.
Figure 131: Taxes on goods and services of
upper MICs (% of tax revenue), 2011
Source: Statistics Mauritius
Figure 132: Social contributions of upper MICs
(% of GDP), 2011
Source: World Development Indicators
170. Public expenditure is under control but will face growing pressures in coming years.
Overall, the distribution of expenditure has been consistent over the recent past (Figure 133 &
Figure 134). Sector allocations to social sectors have been broadly stable and represent between
45 to 50 percent of total public expenditure. Yet overall public spending on health and education
137 For instance, taxes on customs that represented 3.9 percent of GDP in 2005 have declined to 0.4 percent in 2011 as a result of
trade liberalization. 138 The grants received by Mauritius total 0.7 percent of GDP, which compares favorably with grants received by countries with
similar income status. In 2011, countries with similar income per capita received less grant funding as a share of GDP; for instance,
Costa Rica received negligible amounts, Botswana and Lebanon received 0.2 percent of GDP each, and only Romania received
well above Mauritius at 1.2 percent of GDP, but this was thanks to substantial contributions from the EU. 139 The government has already taken a pioneering approach on excise and environmental taxes with a levy on energy products
equivalent to 3.7 percent of GDP. This could be reinforced by converting present vehicle excise taxes to a tax based partly on CO2
per kilometer. Also, the annual road tax could be converted into a tax on annual kilometers driven to reduce traffic congestion. The
property tax could also be increased from the current 1.2 percent of GDP, while ensuring that the most modest properties are
protected
0
10
20
30
40
50
60
Bo
tsw
an
a
Mala
ysia
Azerb
aij
an
Ru
ssia
n F
ed
era
tion
Sin
gapo
re
Alg
eri
a
Bra
zil
Kazakh
sta
n
Tun
isia
Bela
rus
Sey
ch
ell
es
Co
lom
bia
Co
sta
Ric
a
So
uth
Afr
ica
Jam
aic
a
Malt
a
Latv
ia
Jo
rdan
Lit
hu
an
ia
Peru
Gre
nada
Leban
on
Thail
and
Ro
man
ia
Uru
gu
ay
St.
Vin
cen
t and
the G
renad
ines
Ch
ile
Bo
sn
ia a
nd H
erz
ego
vin
a
Bu
lgari
a
Serb
ia
Mauri
tiu
s
Tu
rkey
Average
0
5
10
15
20
25
30
35
40
45
Average
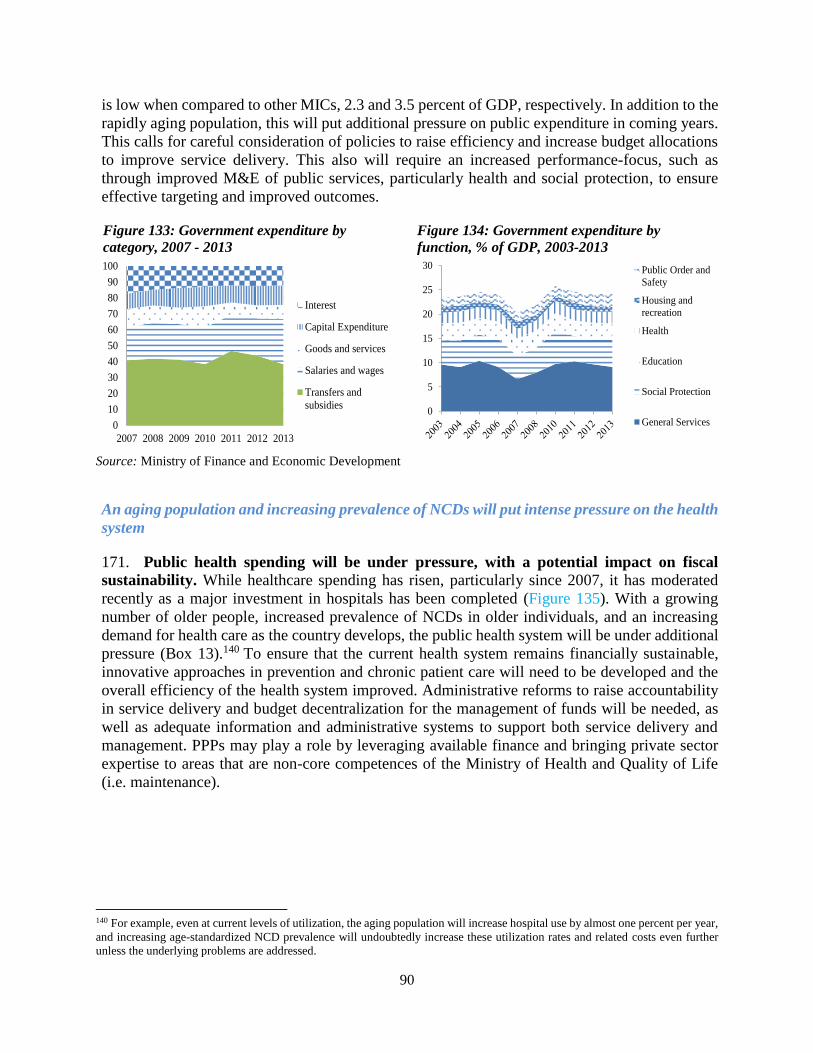
90
is low when compared to other MICs, 2.3 and 3.5 percent of GDP, respectively. In addition to the
rapidly aging population, this will put additional pressure on public expenditure in coming years.
This calls for careful consideration of policies to raise efficiency and increase budget allocations
to improve service delivery. This also will require an increased performance-focus, such as
through improved M&E of public services, particularly health and social protection, to ensure
effective targeting and improved outcomes.
Figure 133: Government expenditure by
category, 2007 - 2013
Figure 134: Government expenditure by
function, % of GDP, 2003-2013
Source: Ministry of Finance and Economic Development
An aging population and increasing prevalence of NCDs will put intense pressure on the health
system
171. Public health spending will be under pressure, with a potential impact on fiscal
sustainability. While healthcare spending has risen, particularly since 2007, it has moderated
recently as a major investment in hospitals has been completed (Figure 135). With a growing
number of older people, increased prevalence of NCDs in older individuals, and an increasing
demand for health care as the country develops, the public health system will be under additional
pressure (Box 13).140 To ensure that the current health system remains financially sustainable,
innovative approaches in prevention and chronic patient care will need to be developed and the
overall efficiency of the health system improved. Administrative reforms to raise accountability
in service delivery and budget decentralization for the management of funds will be needed, as
well as adequate information and administrative systems to support both service delivery and
management. PPPs may play a role by leveraging available finance and bringing private sector
expertise to areas that are non-core competences of the Ministry of Health and Quality of Life
(i.e. maintenance).
140 For example, even at current levels of utilization, the aging population will increase hospital use by almost one percent per year,
and increasing age-standardized NCD prevalence will undoubtedly increase these utilization rates and related costs even further
unless the underlying problems are addressed.
0
10
20
30
40
50
60
70
80
90
100
2007 2008 2009 2010 2011 2012 2013
Interest
Capital Expenditure
Goods and services
Salaries and wages
Transfers and
subsidies0
5
10
15
20
25
30 Public Order and
Safety
Housing and
recreation
Health
Education
Social Protection
General Services
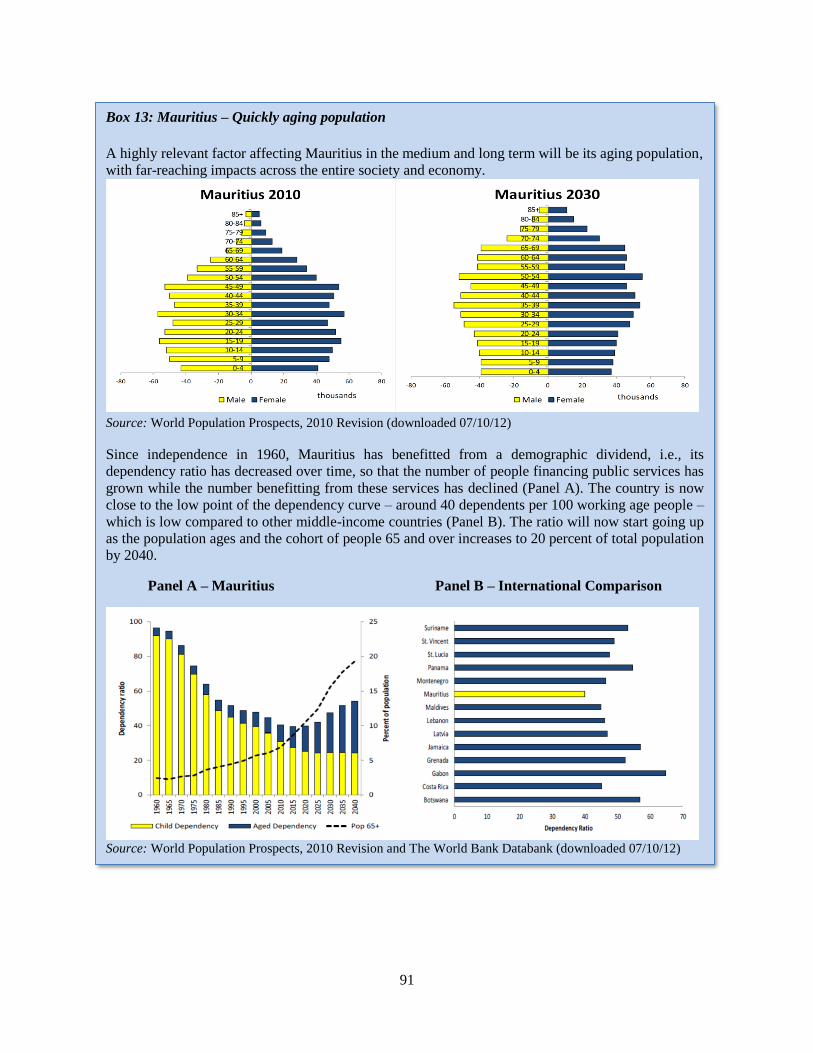
91
Box 13: Mauritius – Quickly aging population
A highly relevant factor affecting Mauritius in the medium and long term will be its aging population,
with far-reaching impacts across the entire society and economy.
Source: World Population Prospects, 2010 Revision (downloaded 07/10/12)
Since independence in 1960, Mauritius has benefitted from a demographic dividend, i.e., its
dependency ratio has decreased over time, so that the number of people financing public services has
grown while the number benefitting from these services has declined (Panel A). The country is now
close to the low point of the dependency curve – around 40 dependents per 100 working age people –
which is low compared to other middle-income countries (Panel B). The ratio will now start going up
as the population ages and the cohort of people 65 and over increases to 20 percent of total population
by 2040.
Panel A – Mauritius Panel B – International Comparison
Source: World Population Prospects, 2010 Revision and The World Bank Databank (downloaded 07/10/12)
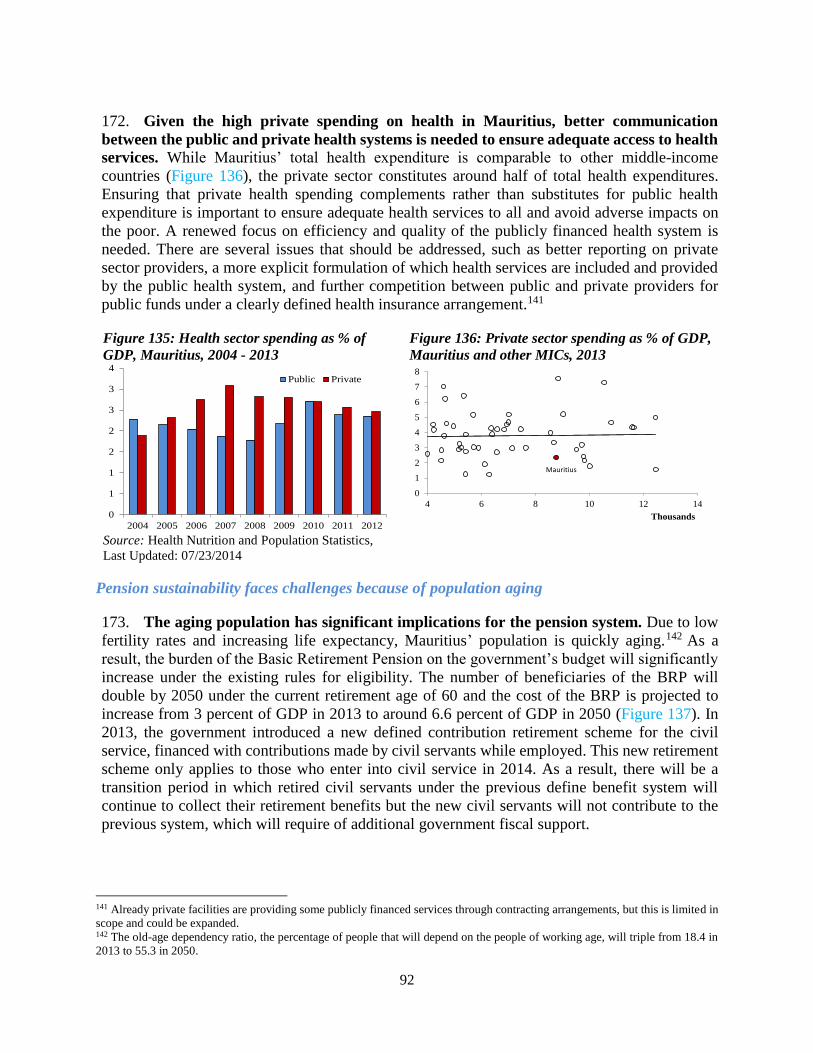
92
172. Given the high private spending on health in Mauritius, better communication
between the public and private health systems is needed to ensure adequate access to health
services. While Mauritius’ total health expenditure is comparable to other middle-income
countries (Figure 136), the private sector constitutes around half of total health expenditures.
Ensuring that private health spending complements rather than substitutes for public health
expenditure is important to ensure adequate health services to all and avoid adverse impacts on
the poor. A renewed focus on efficiency and quality of the publicly financed health system is
needed. There are several issues that should be addressed, such as better reporting on private
sector providers, a more explicit formulation of which health services are included and provided
by the public health system, and further competition between public and private providers for
public funds under a clearly defined health insurance arrangement.141
Figure 135: Health sector spending as % of
GDP, Mauritius, 2004 - 2013
Source: Health Nutrition and Population Statistics,
Last Updated: 07/23/2014
Figure 136: Private sector spending as % of GDP,
Mauritius and other MICs, 2013
Pension sustainability faces challenges because of population aging
173. The aging population has significant implications for the pension system. Due to low
fertility rates and increasing life expectancy, Mauritius’ population is quickly aging.142 As a
result, the burden of the Basic Retirement Pension on the government’s budget will significantly
increase under the existing rules for eligibility. The number of beneficiaries of the BRP will
double by 2050 under the current retirement age of 60 and the cost of the BRP is projected to
increase from 3 percent of GDP in 2013 to around 6.6 percent of GDP in 2050 (Figure 137). In
2013, the government introduced a new defined contribution retirement scheme for the civil
service, financed with contributions made by civil servants while employed. This new retirement
scheme only applies to those who enter into civil service in 2014. As a result, there will be a
transition period in which retired civil servants under the previous define benefit system will
continue to collect their retirement benefits but the new civil servants will not contribute to the
previous system, which will require of additional government fiscal support.
141 Already private facilities are providing some publicly financed services through contracting arrangements, but this is limited in
scope and could be expanded. 142 The old-age dependency ratio, the percentage of people that will depend on the people of working age, will triple from 18.4 in
2013 to 55.3 in 2050.
0
1
1
2
2
3
3
4
2004 2005 2006 2007 2008 2009 2010 2011 2012
Public Private
0
1
2
3
4
5
6
7
8
4 6 8 10 12 14
Thousands
Mauritius

93
174. The government needs to take measures today to address the growing fiscal burden
of pensions in the future. Given the nature of the pension schemes, benefits of reforms are
typically reaped in the medium to long term, which calls for immediate actions to ensure adequate
preparation for future pensioners and adequate burden sharing among present and future
pensioners. As a first step, the government may consider gradually increasing the retirement age
of the BRP to 65 in line with the contributory pension scheme and implementing a pension test
that would allow for receipt of BRP only by those without contributory pensions. In the future,
the government may consider targeting the BRP to weed out better-off beneficiaries who probably
do not rely on the BRP as a major source of income.
175. The contributory scheme under the National Pension Fund will be fiscally balanced
at the expense of decreasing benefits.143 To cope with increasing beneficiaries and decreasing
contributors, the government is gradually increasing the retirement age from 60 to 65 by 2018,
although this does not apply to the BRP. However, the impact has been limited as 95 percent of
new retirees in 2013 retired at 60144 due to a lack of incentives to contribute longer years and
declare correct earnings (Figure 138).145 The contributory scheme may lose its relevance given
that it is not expected to provide meaningful benefits to participants while putting additional
pressure on government to contribute additional public resources. In a context where declining
national savings need to be boosted and incentives to work longer years need to be provided, the
system should be reviewed to provide incentives to declare correct earnings. As a first step, the
contribution ceiling could be removed or significantly increased to allow people to contribute on
what they actually earn.146
Figure 137: Projected long term spending
on basic retirement pension
Source: World Bank calculations, using PROST
model
Figure 138: Projected benefits from national pension
fund147
Building the human capital required to move to a knowledge-based economy will require
additional public resources
176. Mauritius does not invest a large amount in education and training, and this amount
has been progressively decreasing from 4.5 percent of GDP in 2003 to 3.5 percent of GDP
in 2012 (Figure 139 & Figure 140). Although this is somewhat compensated by private spending
on education, overall funding for education is insufficient to attain the government’s goals.
143 Projections were conducted using the World Bank PROST (Pension Reform Options Simulation Toolkit) model. 144 This figure reflects “official” retirement only: up to one third of retirees continued to work past their 60th birthday. 145 40 percent of pensioners collect just the minimum pension. 146 The contribution ceiling is regressive as it allows high-income workers to cap their contributions, de facto providing them with
the option to get a minimum pension with minimal contributions. 147 Benefits presented are replacement rates for new pensioners calculated as a ratio of the new pension and average wage in a
specific year.
0%
1%
2%
3%
4%
5%
6%
7%
8%
2013
2016
2019
2022
2025
2028
2031
2034
2037
2040
2043
2046
2049
2052
2055
2058
2061
2064
2067
2070
0%
10%
20%
30%
2014 2024 2034 2044 2054
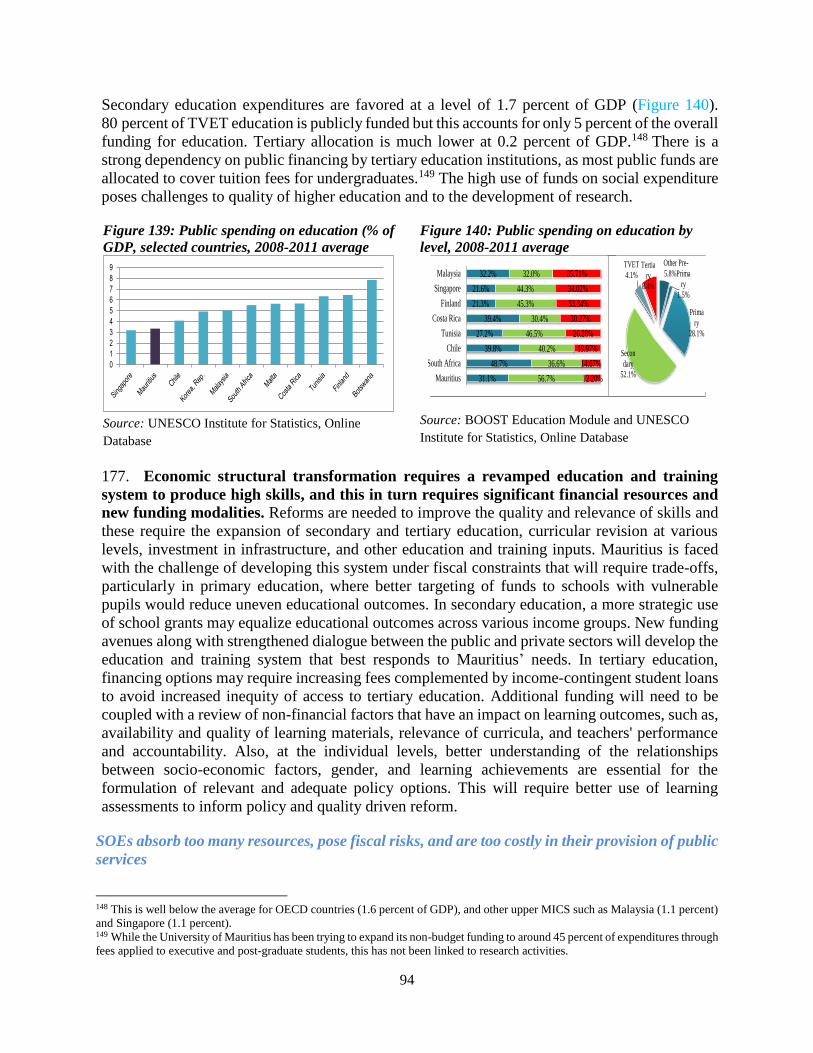
94
Secondary education expenditures are favored at a level of 1.7 percent of GDP (Figure 140).
80 percent of TVET education is publicly funded but this accounts for only 5 percent of the overall
funding for education. Tertiary allocation is much lower at 0.2 percent of GDP.148 There is a
strong dependency on public financing by tertiary education institutions, as most public funds are
allocated to cover tuition fees for undergraduates.149 The high use of funds on social expenditure
poses challenges to quality of higher education and to the development of research.
Figure 139: Public spending on education (% of
GDP, selected countries, 2008-2011 average
Source: UNESCO Institute for Statistics, Online
Database
Figure 140: Public spending on education by
level, 2008-2011 average
Source: BOOST Education Module and UNESCO
Institute for Statistics, Online Database
177. Economic structural transformation requires a revamped education and training
system to produce high skills, and this in turn requires significant financial resources and
new funding modalities. Reforms are needed to improve the quality and relevance of skills and
these require the expansion of secondary and tertiary education, curricular revision at various
levels, investment in infrastructure, and other education and training inputs. Mauritius is faced
with the challenge of developing this system under fiscal constraints that will require trade-offs,
particularly in primary education, where better targeting of funds to schools with vulnerable
pupils would reduce uneven educational outcomes. In secondary education, a more strategic use
of school grants may equalize educational outcomes across various income groups. New funding
avenues along with strengthened dialogue between the public and private sectors will develop the
education and training system that best responds to Mauritius’ needs. In tertiary education,
financing options may require increasing fees complemented by income-contingent student loans
to avoid increased inequity of access to tertiary education. Additional funding will need to be
coupled with a review of non-financial factors that have an impact on learning outcomes, such as,
availability and quality of learning materials, relevance of curricula, and teachers' performance
and accountability. Also, at the individual levels, better understanding of the relationships
between socio-economic factors, gender, and learning achievements are essential for the
formulation of relevant and adequate policy options. This will require better use of learning
assessments to inform policy and quality driven reform.
SOEs absorb too many resources, pose fiscal risks, and are too costly in their provision of public
services
148 This is well below the average for OECD countries (1.6 percent of GDP), and other upper MICS such as Malaysia (1.1 percent)
and Singapore (1.1 percent). 149 While the University of Mauritius has been trying to expand its non-budget funding to around 45 percent of expenditures through
fees applied to executive and post-graduate students, this has not been linked to research activities.
0
1
2
3
4
5
6
7
8
9
31.1%
48.7%
39.8%
27.2%
39.4%
21.3%
21.6%
32.2%
56.7%
36.6%
40.2%
46.5%
30.4%
45.3%
44.3%
32.0%
12.20%
14.67%
19.97%
26.28%
30.27%
33.34%
34.02%
35.71%
Mauritius
South Africa
Chile
Tunisia
Costa Rica
Finland
Singapore
MalaysiaOther
5.8%
Pre-
Prima
ry
1.5%
Prima
ry
28.1%
Secon
dary
52.1%
TVET
4.1%Tertia
ry
8.4%
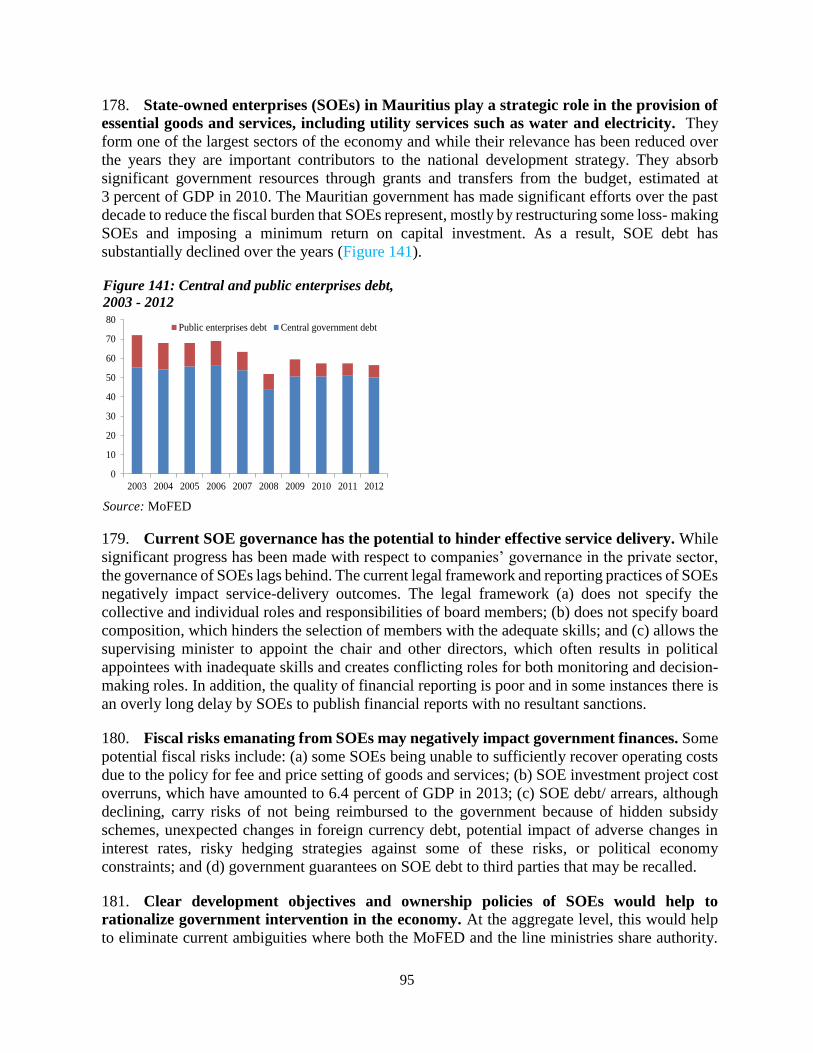
95
178. State-owned enterprises (SOEs) in Mauritius play a strategic role in the provision of
essential goods and services, including utility services such as water and electricity. They
form one of the largest sectors of the economy and while their relevance has been reduced over
the years they are important contributors to the national development strategy. They absorb
significant government resources through grants and transfers from the budget, estimated at
3 percent of GDP in 2010. The Mauritian government has made significant efforts over the past
decade to reduce the fiscal burden that SOEs represent, mostly by restructuring some loss- making
SOEs and imposing a minimum return on capital investment. As a result, SOE debt has
substantially declined over the years (Figure 141).
Figure 141: Central and public enterprises debt,
2003 - 2012
Source: MoFED
179. Current SOE governance has the potential to hinder effective service delivery. While
significant progress has been made with respect to companies’ governance in the private sector,
the governance of SOEs lags behind. The current legal framework and reporting practices of SOEs
negatively impact service-delivery outcomes. The legal framework (a) does not specify the
collective and individual roles and responsibilities of board members; (b) does not specify board
composition, which hinders the selection of members with the adequate skills; and (c) allows the
supervising minister to appoint the chair and other directors, which often results in political
appointees with inadequate skills and creates conflicting roles for both monitoring and decision-
making roles. In addition, the quality of financial reporting is poor and in some instances there is
an overly long delay by SOEs to publish financial reports with no resultant sanctions.
180. Fiscal risks emanating from SOEs may negatively impact government finances. Some
potential fiscal risks include: (a) some SOEs being unable to sufficiently recover operating costs
due to the policy for fee and price setting of goods and services; (b) SOE investment project cost
overruns, which have amounted to 6.4 percent of GDP in 2013; (c) SOE debt/ arrears, although
declining, carry risks of not being reimbursed to the government because of hidden subsidy
schemes, unexpected changes in foreign currency debt, potential impact of adverse changes in
interest rates, risky hedging strategies against some of these risks, or political economy
constraints; and (d) government guarantees on SOE debt to third parties that may be recalled.
181. Clear development objectives and ownership policies of SOEs would help to
rationalize government intervention in the economy. At the aggregate level, this would help
to eliminate current ambiguities where both the MoFED and the line ministries share authority.
0
10
20
30
40
50
60
70
80
2003 2004 2005 2006 2007 2008 2009 2010 2011 2012
Public enterprises debt Central government debt
96
These policies would support a proper classification of SOEs as per their policy objectives and
commercial realities to identify the areas and developmental objectives for which SOEs are
relevant. The government should then develop and issue an ownership policy relevant for each
category, providing stakeholders, market participants and the general public with an
understanding of the state’s objectives as an owner, particularly with regard to policies on
ownership and management diversification (through share sales and PPPs, for example). The legal
framework for SOEs can be reviewed to simplify, streamline, and harmonize the legal form under
which the different SOEs operate, either through the Companies Act or dedicated legislation
governing SOEs.
182. Accelerating the pace of SOE governance reforms would play a critical role in raising
SOE accountability. Senior managerial positions, including the nomination of decision makers
and many board members in SOEs, are strongly linked to political patronage and loyalty rather
than the business experience, capability, and integrity. Given human resource constraints these
are serious barriers to the intended objective of inclusive and sustainable growth. At the firm
level, efficiency can be enhanced by putting in place measures to empower SOE boards of
directors by nominating the most qualified and appropriate individuals as directors. Also,
accountability of SOEs should be made clear either through corporate objectives anchored in
laws, regulations, or cabinet decisions or through performance contracts disclosed to the public.
Oversight capacity, currently spread between OPSG, MoFED and sector ministries, needs to be
strengthened technically and politically to effectively supervise and monitor SOE performance in
order to help promote accountability, transparency and fiscal discipline as well as assist in
determining areas for operational and/or financial restructuring.
There is a need to rebuild the fiscal buffers to cope with external shocks
183. A prudent macro-fiscal framework and fiscal consolidation is necessary to reach
public debt targets (Box 14). The government has taken important steps to improve
macroeconomic management of a succession of severe external shocks. These include a
significant reduction of debt to GDP ratio during the last decade from 69 percent of GDP in June
2005 to below 52 percent of GDP in 2008. This reduction was temporally halted by the
implementation of stimulus packages in 2009 and 2010, so that total debt increased to 60 percent
of GDP in 2009 before falling back slowly in subsequent years. While the adoption of the 2008
Public Debt Management Act (PDMA) has supported debt reduction and offset the fiscal deficit,
the major driver has been economic growth. In view of the low tax strategy of the country,
reductions in overall spending relative to GDP are needed to achieve a 50 percent to GDP public
debt reduction by 2018. This will require the acceleration of fiscal consolidation efforts after the
limited progress achieved recently.
184. Growth moderation, public spending pressure, and an uncertain external
environment produce additional fiscal risks that could make the country less resilient to
shocks and more prone to macroeconomic instability. This would challenge Mauritius’
development model of an international trade platform that relies on country stability to attract
foreign investment and move up in the ranks of middle-income economies. Financing of the
deficit is not currently a problem. Excess liquidity in the financial sector, low inflation, and a
positive interest rate environment translate into adequate financing with limited rollover risks.
However, a reversal of this scenario could develop quickly and require large rapid policy

97
adjustments. At issue is not just fiscal sustainability but also the consistency of the development
model of Mauritius, which requires predictability and proactive risk management to provide an
adequate environment to attract foreign investment.
185. While savings can be found across the board by eliminating ineffective programs and
policies, piecemeal efforts are unlikely to achieve cost and efficiency savings. Instead, a
comprehensive and sustainable approach will likely require an acceleration of public sector
reforms to improve service delivery. This will require ingraining a comprehensive approach in
the public sector to improve evidence-based policy decision-making, raise accountability, and
focus on service delivery. Further efforts to address efficiency and equity issues in the delivery
of services across the public sector, including improved planning, financial management, and
monitoring and evaluation, will ensure the incentives to sustain implementation of reforms.
Overall, reforms to unlock supply side constraints would have improve medium term
macroeconomic projections (Box 14).
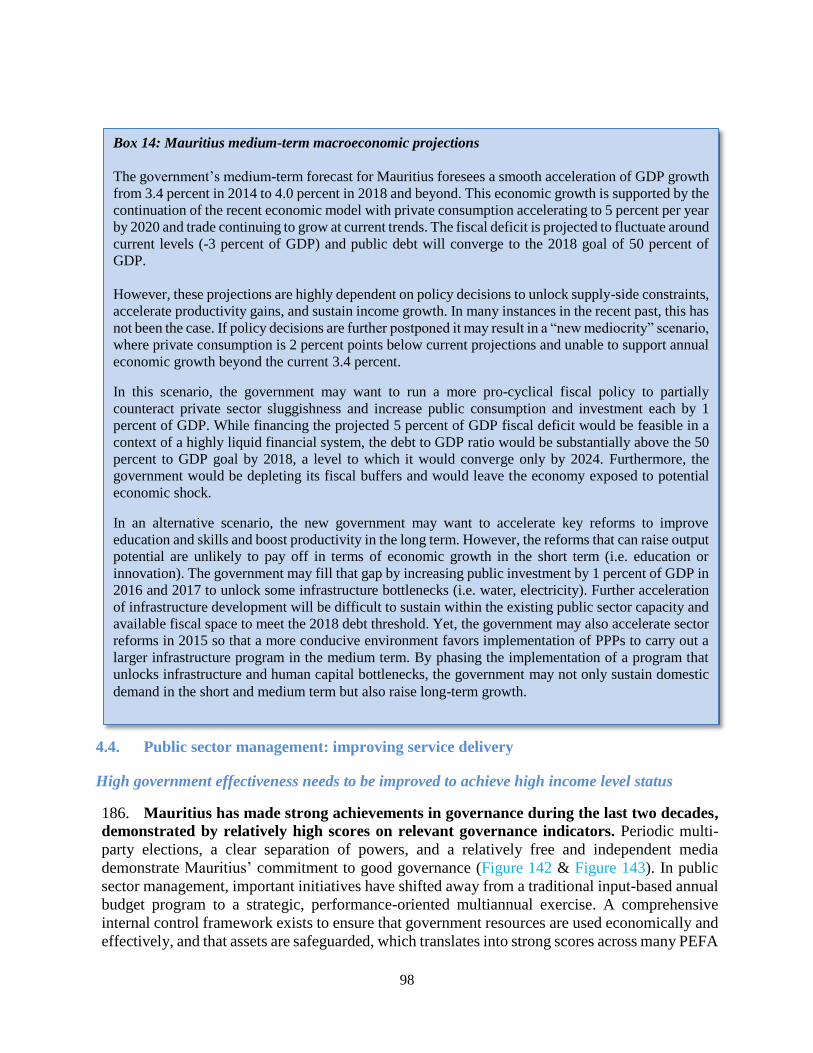
98
4.4. Public sector management: improving service delivery
High government effectiveness needs to be improved to achieve high income level status
186. Mauritius has made strong achievements in governance during the last two decades,
demonstrated by relatively high scores on relevant governance indicators. Periodic multi-
party elections, a clear separation of powers, and a relatively free and independent media
demonstrate Mauritius’ commitment to good governance (Figure 142 & Figure 143). In public
sector management, important initiatives have shifted away from a traditional input-based annual
budget program to a strategic, performance-oriented multiannual exercise. A comprehensive
internal control framework exists to ensure that government resources are used economically and
effectively, and that assets are safeguarded, which translates into strong scores across many PEFA
Box 14: Mauritius medium-term macroeconomic projections
The government’s medium-term forecast for Mauritius foresees a smooth acceleration of GDP growth
from 3.4 percent in 2014 to 4.0 percent in 2018 and beyond. This economic growth is supported by the
continuation of the recent economic model with private consumption accelerating to 5 percent per year
by 2020 and trade continuing to grow at current trends. The fiscal deficit is projected to fluctuate around
current levels (-3 percent of GDP) and public debt will converge to the 2018 goal of 50 percent of
GDP.
However, these projections are highly dependent on policy decisions to unlock supply-side constraints,
accelerate productivity gains, and sustain income growth. In many instances in the recent past, this has
not been the case. If policy decisions are further postponed it may result in a “new mediocrity” scenario,
where private consumption is 2 percent points below current projections and unable to support annual
economic growth beyond the current 3.4 percent.
In this scenario, the government may want to run a more pro-cyclical fiscal policy to partially
counteract private sector sluggishness and increase public consumption and investment each by 1
percent of GDP. While financing the projected 5 percent of GDP fiscal deficit would be feasible in a
context of a highly liquid financial system, the debt to GDP ratio would be substantially above the 50
percent to GDP goal by 2018, a level to which it would converge only by 2024. Furthermore, the
government would be depleting its fiscal buffers and would leave the economy exposed to potential
economic shock.
In an alternative scenario, the new government may want to accelerate key reforms to improve
education and skills and boost productivity in the long term. However, the reforms that can raise output
potential are unlikely to pay off in terms of economic growth in the short term (i.e. education or
innovation). The government may fill that gap by increasing public investment by 1 percent of GDP in
2016 and 2017 to unlock some infrastructure bottlenecks (i.e. water, electricity). Further acceleration
of infrastructure development will be difficult to sustain within the existing public sector capacity and
available fiscal space to meet the 2018 debt threshold. Yet, the government may also accelerate sector
reforms in 2015 so that a more conducive environment favors implementation of PPPs to carry out a
larger infrastructure program in the medium term. By phasing the implementation of a program that
unlocks infrastructure and human capital bottlenecks, the government may not only sustain domestic
demand in the short and medium term but also raise long-term growth.
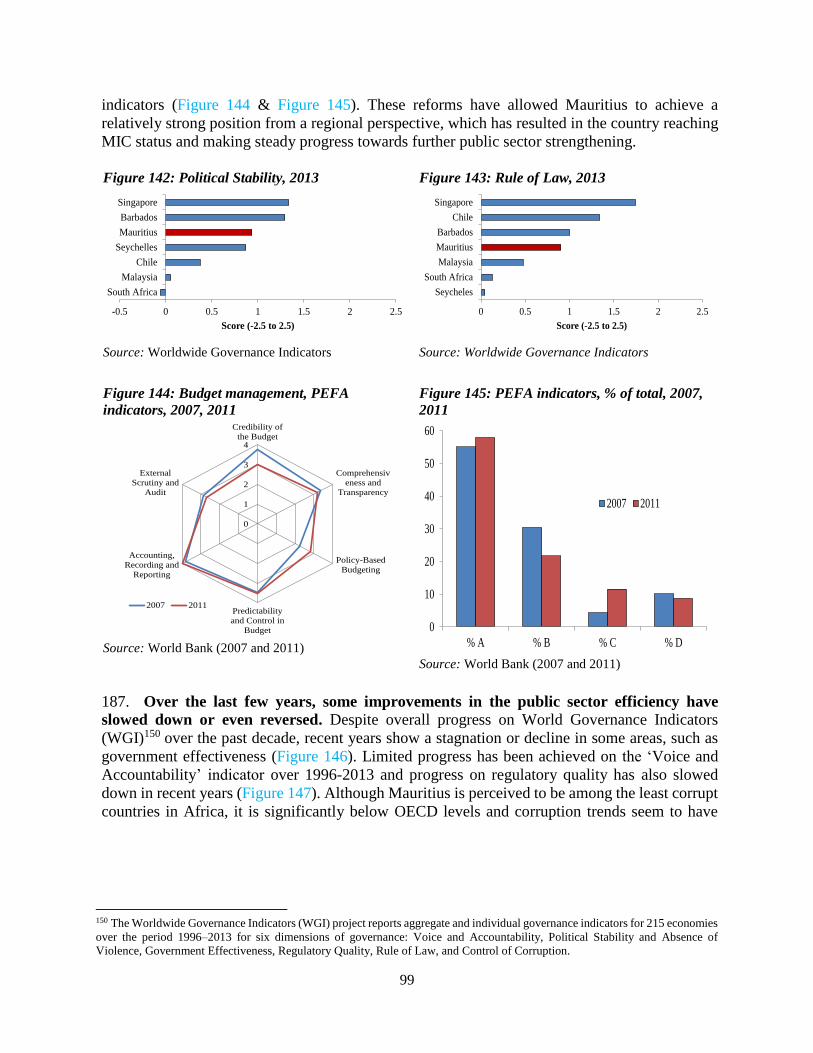
99
indicators (Figure 144 & Figure 145). These reforms have allowed Mauritius to achieve a
relatively strong position from a regional perspective, which has resulted in the country reaching
MIC status and making steady progress towards further public sector strengthening.
Figure 142: Political Stability, 2013
Source: Worldwide Governance Indicators
Figure 143: Rule of Law, 2013
Source: Worldwide Governance Indicators
Figure 144: Budget management, PEFA
indicators, 2007, 2011
Source: World Bank (2007 and 2011)
Figure 145: PEFA indicators, % of total, 2007,
2011
Source: World Bank (2007 and 2011)
187. Over the last few years, some improvements in the public sector efficiency have
slowed down or even reversed. Despite overall progress on World Governance Indicators
(WGI)150 over the past decade, recent years show a stagnation or decline in some areas, such as
government effectiveness (Figure 146). Limited progress has been achieved on the ‘Voice and
Accountability’ indicator over 1996-2013 and progress on regulatory quality has also slowed
down in recent years (Figure 147). Although Mauritius is perceived to be among the least corrupt
countries in Africa, it is significantly below OECD levels and corruption trends seem to have
150 The Worldwide Governance Indicators (WGI) project reports aggregate and individual governance indicators for 215 economies
over the period 1996–2013 for six dimensions of governance: Voice and Accountability, Political Stability and Absence of
Violence, Government Effectiveness, Regulatory Quality, Rule of Law, and Control of Corruption.
-0.5 0 0.5 1 1.5 2 2.5
South Africa
Malaysia
Chile
Seychelles
Mauritius
Barbados
Singapore
Score (-2.5 to 2.5)
0 0.5 1 1.5 2 2.5
Seycheles
South Africa
Malaysia
Mauritius
Barbados
Chile
Singapore
Score (-2.5 to 2.5)
0
1
2
3
4
Credibility of
the Budget
Comprehensiv
eness and
Transparency
Policy-Based
Budgeting
Predictability
and Control in
Budget
Execution
Accounting,
Recording and
Reporting
External
Scrutiny and
Audit
2007 2011
0
10
20
30
40
50
60
% A % B % C % D
2007 2011
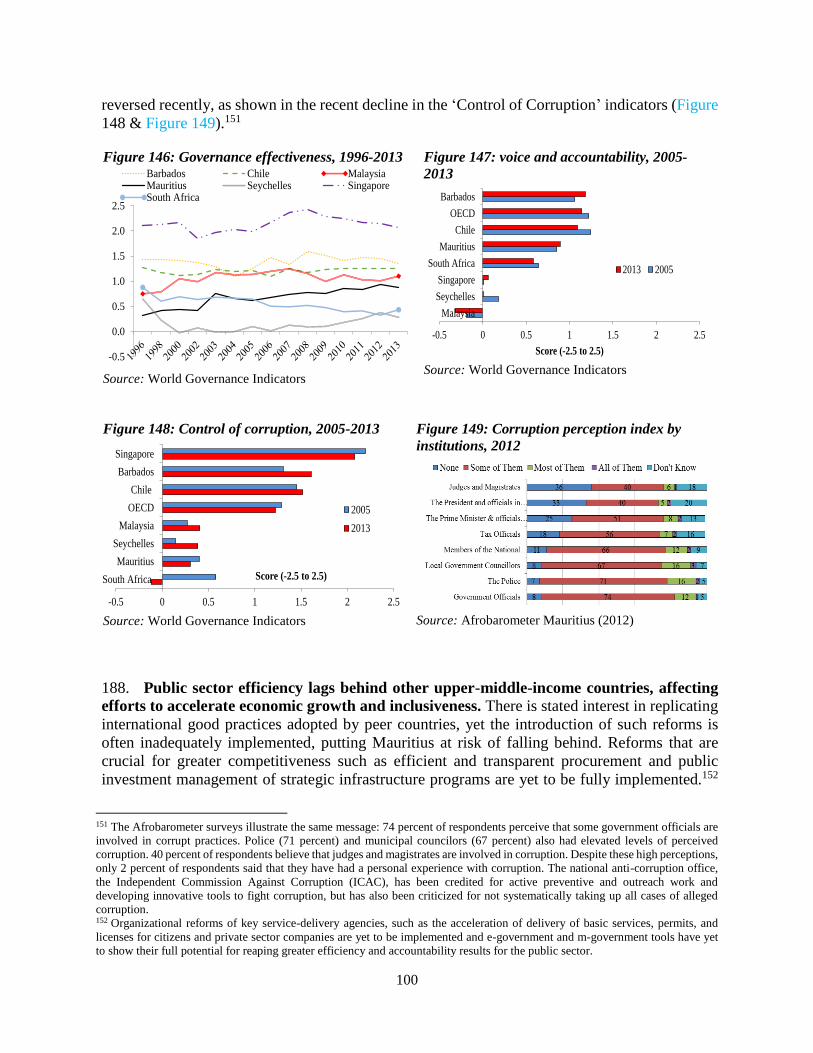
100
reversed recently, as shown in the recent decline in the ‘Control of Corruption’ indicators (Figure
148 & Figure 149).151
Figure 146: Governance effectiveness, 1996-2013
Source: World Governance Indicators
Figure 147: voice and accountability, 2005-
2013
Source: World Governance Indicators
Figure 148: Control of corruption, 2005-2013
Source: World Governance Indicators
Figure 149: Corruption perception index by
institutions, 2012
Source: Afrobarometer Mauritius (2012)
188. Public sector efficiency lags behind other upper-middle-income countries, affecting
efforts to accelerate economic growth and inclusiveness. There is stated interest in replicating
international good practices adopted by peer countries, yet the introduction of such reforms is
often inadequately implemented, putting Mauritius at risk of falling behind. Reforms that are
crucial for greater competitiveness such as efficient and transparent procurement and public
investment management of strategic infrastructure programs are yet to be fully implemented.152
151 The Afrobarometer surveys illustrate the same message: 74 percent of respondents perceive that some government officials are
involved in corrupt practices. Police (71 percent) and municipal councilors (67 percent) also had elevated levels of perceived
corruption. 40 percent of respondents believe that judges and magistrates are involved in corruption. Despite these high perceptions,
only 2 percent of respondents said that they have had a personal experience with corruption. The national anti-corruption office,
the Independent Commission Against Corruption (ICAC), has been credited for active preventive and outreach work and
developing innovative tools to fight corruption, but has also been criticized for not systematically taking up all cases of alleged
corruption. 152 Organizational reforms of key service-delivery agencies, such as the acceleration of delivery of basic services, permits, and
licenses for citizens and private sector companies are yet to be implemented and e-government and m-government tools have yet
to show their full potential for reaping greater efficiency and accountability results for the public sector.
-0.5
0.0
0.5
1.0
1.5
2.0
2.5
Barbados Chile MalaysiaMauritius Seychelles SingaporeSouth Africa
-0.5 0 0.5 1 1.5 2 2.5
Malaysia
Seychelles
Singapore
South Africa
Mauritius
Chile
OECD
Barbados
Score (-2.5 to 2.5)
2013 2005
-0.5 0 0.5 1 1.5 2 2.5
South Africa
Mauritius
Seychelles
Malaysia
OECD
Chile
Barbados
Singapore
Score (-2.5 to 2.5)
2005
2013
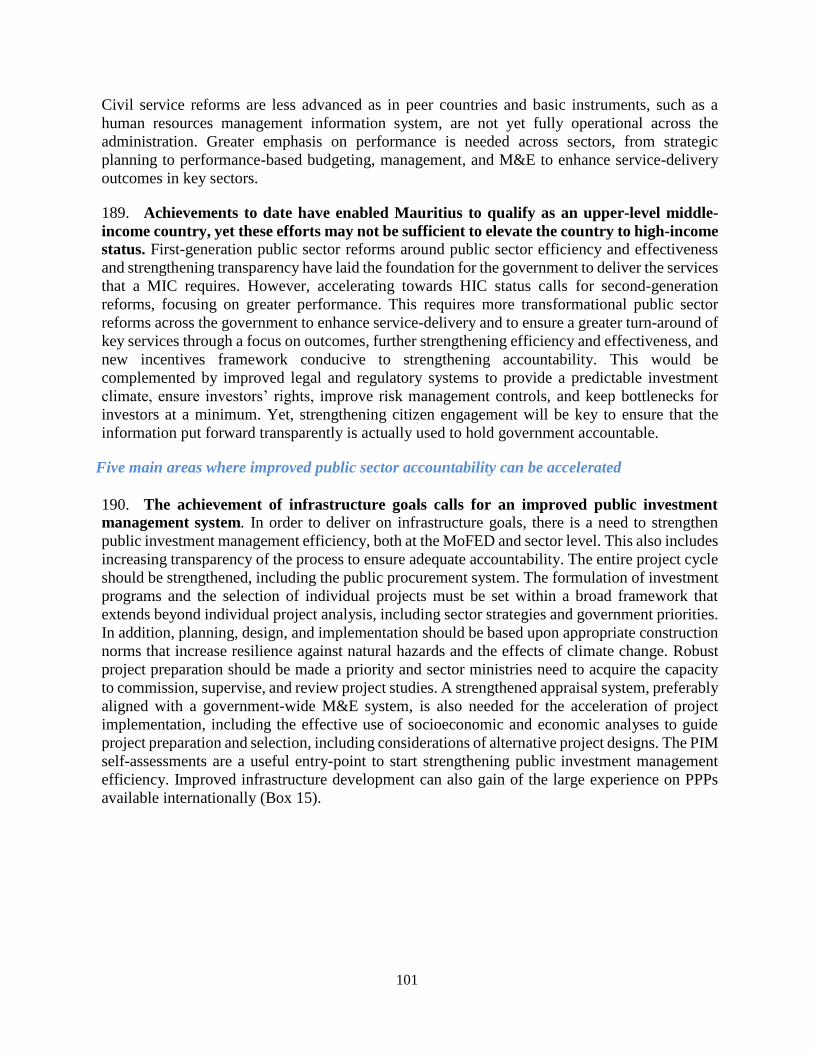
101
Civil service reforms are less advanced as in peer countries and basic instruments, such as a
human resources management information system, are not yet fully operational across the
administration. Greater emphasis on performance is needed across sectors, from strategic
planning to performance-based budgeting, management, and M&E to enhance service-delivery
outcomes in key sectors.
189. Achievements to date have enabled Mauritius to qualify as an upper-level middle-
income country, yet these efforts may not be sufficient to elevate the country to high-income
status. First-generation public sector reforms around public sector efficiency and effectiveness
and strengthening transparency have laid the foundation for the government to deliver the services
that a MIC requires. However, accelerating towards HIC status calls for second-generation
reforms, focusing on greater performance. This requires more transformational public sector
reforms across the government to enhance service-delivery and to ensure a greater turn-around of
key services through a focus on outcomes, further strengthening efficiency and effectiveness, and
new incentives framework conducive to strengthening accountability. This would be
complemented by improved legal and regulatory systems to provide a predictable investment
climate, ensure investors’ rights, improve risk management controls, and keep bottlenecks for
investors at a minimum. Yet, strengthening citizen engagement will be key to ensure that the
information put forward transparently is actually used to hold government accountable.
Five main areas where improved public sector accountability can be accelerated
190. The achievement of infrastructure goals calls for an improved public investment
management system. In order to deliver on infrastructure goals, there is a need to strengthen
public investment management efficiency, both at the MoFED and sector level. This also includes
increasing transparency of the process to ensure adequate accountability. The entire project cycle
should be strengthened, including the public procurement system. The formulation of investment
programs and the selection of individual projects must be set within a broad framework that
extends beyond individual project analysis, including sector strategies and government priorities.
In addition, planning, design, and implementation should be based upon appropriate construction
norms that increase resilience against natural hazards and the effects of climate change. Robust
project preparation should be made a priority and sector ministries need to acquire the capacity
to commission, supervise, and review project studies. A strengthened appraisal system, preferably
aligned with a government-wide M&E system, is also needed for the acceleration of project
implementation, including the effective use of socioeconomic and economic analyses to guide
project preparation and selection, including considerations of alternative project designs. The PIM
self-assessments are a useful entry-point to start strengthening public investment management
efficiency. Improved infrastructure development can also gain of the large experience on PPPs
available internationally (Box 15).
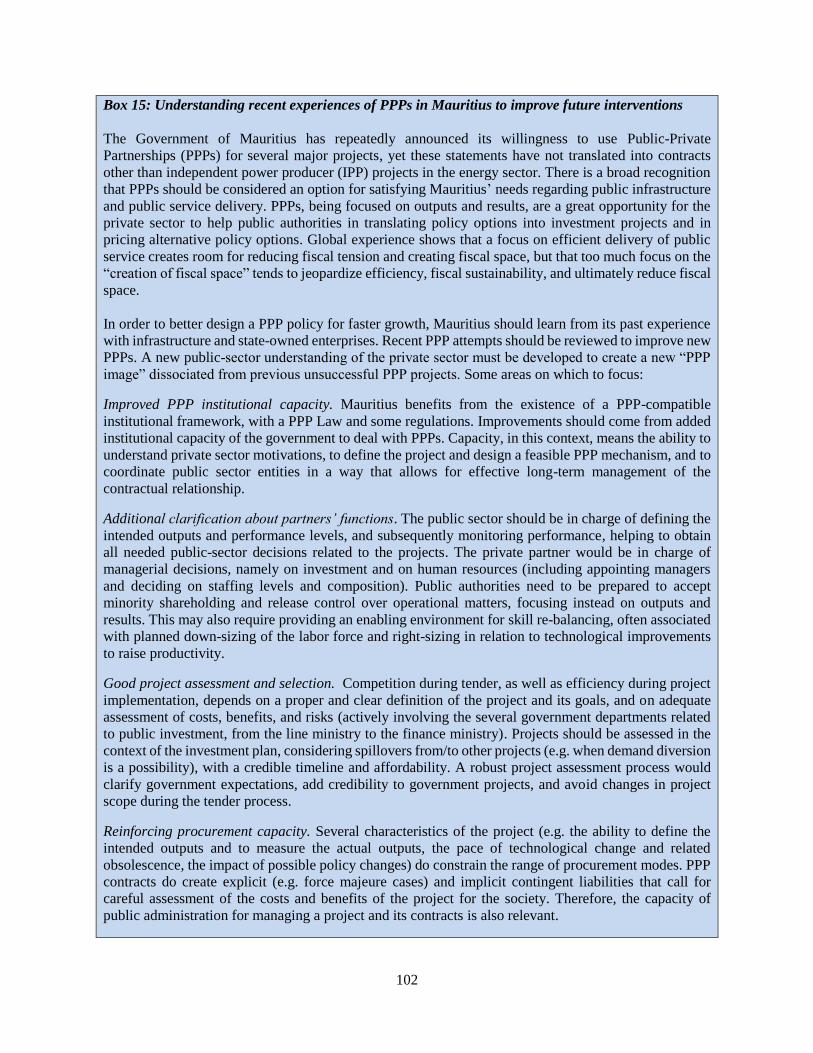
102
Box 15: Understanding recent experiences of PPPs in Mauritius to improve future interventions
The Government of Mauritius has repeatedly announced its willingness to use Public-Private
Partnerships (PPPs) for several major projects, yet these statements have not translated into contracts
other than independent power producer (IPP) projects in the energy sector. There is a broad recognition
that PPPs should be considered an option for satisfying Mauritius’ needs regarding public infrastructure
and public service delivery. PPPs, being focused on outputs and results, are a great opportunity for the
private sector to help public authorities in translating policy options into investment projects and in
pricing alternative policy options. Global experience shows that a focus on efficient delivery of public
service creates room for reducing fiscal tension and creating fiscal space, but that too much focus on the
“creation of fiscal space” tends to jeopardize efficiency, fiscal sustainability, and ultimately reduce fiscal
space.
In order to better design a PPP policy for faster growth, Mauritius should learn from its past experience
with infrastructure and state-owned enterprises. Recent PPP attempts should be reviewed to improve new
PPPs. A new public-sector understanding of the private sector must be developed to create a new “PPP
image” dissociated from previous unsuccessful PPP projects. Some areas on which to focus:
Improved PPP institutional capacity. Mauritius benefits from the existence of a PPP-compatible
institutional framework, with a PPP Law and some regulations. Improvements should come from added
institutional capacity of the government to deal with PPPs. Capacity, in this context, means the ability to
understand private sector motivations, to define the project and design a feasible PPP mechanism, and to
coordinate public sector entities in a way that allows for effective long-term management of the
contractual relationship.
Additional clarification about partners’ functions. The public sector should be in charge of defining the
intended outputs and performance levels, and subsequently monitoring performance, helping to obtain
all needed public-sector decisions related to the projects. The private partner would be in charge of
managerial decisions, namely on investment and on human resources (including appointing managers
and deciding on staffing levels and composition). Public authorities need to be prepared to accept
minority shareholding and release control over operational matters, focusing instead on outputs and
results. This may also require providing an enabling environment for skill re-balancing, often associated
with planned down-sizing of the labor force and right-sizing in relation to technological improvements
to raise productivity.
Good project assessment and selection. Competition during tender, as well as efficiency during project
implementation, depends on a proper and clear definition of the project and its goals, and on adequate
assessment of costs, benefits, and risks (actively involving the several government departments related
to public investment, from the line ministry to the finance ministry). Projects should be assessed in the
context of the investment plan, considering spillovers from/to other projects (e.g. when demand diversion
is a possibility), with a credible timeline and affordability. A robust project assessment process would
clarify government expectations, add credibility to government projects, and avoid changes in project
scope during the tender process.
Reinforcing procurement capacity. Several characteristics of the project (e.g. the ability to define the
intended outputs and to measure the actual outputs, the pace of technological change and related
obsolescence, the impact of possible policy changes) do constrain the range of procurement modes. PPP
contracts do create explicit (e.g. force majeure cases) and implicit contingent liabilities that call for
careful assessment of the costs and benefits of the project for the society. Therefore, the capacity of
public administration for managing a project and its contracts is also relevant.

103
Understanding private sector motivation and behavior. The PPP contract needs to establish a real
“business” out of serving public needs, mitigating and optimally allocating to the parties the risks of
delivering the project. If rewards correspond to the risks, and the public sector establishes a clear
framework for contract and fiscal management, then private entities (investors and financiers) will bid
for the contract. However, the government needs to create an environment conducive for that “business”
to arise. When that is not the case, namely when policy options (for instance on jobs, or on innovation)
diverge from efficient management (and so require policy relaxation or adequate consideration in the
design of the PPP business model) additional reward may be required. Also, the absence of a proper
business definition may attract rent-seekers that bid to get contracts and then push for opportunistic
renegotiation.
Mauritius enjoys an advantage not common to many other countries: a large financial sector, potentially
able to finance the infrastructure needs of the country and a private sector able to carry out the due
diligence that is so relevant of the PPP process. Moving forward, this will need to be matched with a new
PPP approach that also carefully addresses fiscal costs and risks.
191. The budget process should be strengthened to improve allocative and operational
efficiency, identify areas where efficiency can be raised, and upgrade reporting. Despite the
significant progress made in implementation of Programme Based Budgeting (PBB) since 2008/9,
the government has reverted to traditional input-based budgeting from the 2015 budget. The PBB
shifted budgeting from traditional input-based annual programming to a strategic performance-
oriented multiannual budget exercise and this translated into an improvement across many
indicators in the 2011 PEFA assessment (Figure 144 & Figure 145). The restored budget approach
reverts to appropriations being done by vote of expenditure – department/division. In addition,
the budget (now) only presents key outputs for the current budget year that are much less than the
detailed 3 year performance information – outcome, efficiency and outcome indicators – provided
under the PBB approach. The new approach limits the ability of the government to allocate
resources to priority policy objectives and also limits the performance information presented to
the public and National Assembly for accountability. This moves away from good practices
implemented by other peer countries to enhance allocative and operational efficiency of public
resources. Moving forward, the government could use the upcoming PEFA assessment to identify
areas of improvement especially those in strategic planning and credibility of budget. To enhance
the credibility of the performance information in the government annual report, the government
should subject such information to audit by the Director of Audit. While procurement systems
focus on compliance, there is a need to strengthen the planning functions and monitor results
against spending. The current financial statements include minimal information relating to public
assets and liabilities, limiting the government’s accountability. Additionally, accrual-based
accounting standards should be adopted in preparing financial statements and enshrined in law
with improved provisions for fiscal responsibility, fiscal risk management and government
accountability. Greater parliamentary oversight, e.g. through the Public Accounts Committee,
would also be needed.
192. Improved M&E would better align national development objectives to public sector
service delivery. Developing a well sequenced, actionable, and budgeted strategy for
implementing and tracking select national priorities can be introduced under a national
development plan or the budget speech. Strong political leadership and technical expertise will
be needed to move away from a culture of compliance to a culture of learning and improvement
104
to enhance government efficiency. This requires a better link between strategic priorities and
strategic planning, performance-based budgeting, and performance management. Both
monitoring and evaluation tools need to be strengthened to ensure the most effective monitoring
of government goals, policies, and projects. Statistical capacity and oversight mechanisms also
need further strengthening for the utilization of M&E findings in policy-making and
implementation.
193. The civil service needs to be strengthened to focus on delivering results. The civil
service in Mauritius fares relatively well in regional terms and there have been recent public sector
performance modernization efforts including Citizen Charters, Quality Management
Frameworks, and Public Service Awards. However, Mauritius risks falling behind more reform-
oriented peer countries in terms of civil service performance. The civil service is still structured
in a traditional way, with little reform momentum. Senior management lacks the authority and
flexibility to manage human resources effectively. These constraints translate into high turnover
rates, difficulties in retaining technical specialists, lengthy recruitment processes, and insufficient
multi-year human resource planning. As a result, individual performance may drift. Capacity
constraints at medium- and lower levels of the administration also negatively impact greater
responsiveness to citizens’ needs. Some scarce skills may be hard to attract and retain within the
public sector and mobility between the private and public sector is limited. Efforts to strengthen
meritocracy are only nascent. There is a limited amount of key data available on the civil service,
which makes the management, monitoring, and performance of civil servants difficult. Reform
momentum needs to be invigorated to identify and implement areas for improved performance
and accountability and become more focused on delivering key results across sectors. A more
direct link between governmental goals, departmental performance management systems and the
program objectives is needed to hold officers and senior management more accountable. A greater
performance focus and enhanced used of e-government tools would help to set free a greater
potential for innovation, enhance civil service accountability, transparency and efficiency and
make service-delivery faster, generate economies of scale, and could provide greater service-
options for citizens. Many countries have implemented many of the “second-generation” reforms
presented above successfully (Box 16).
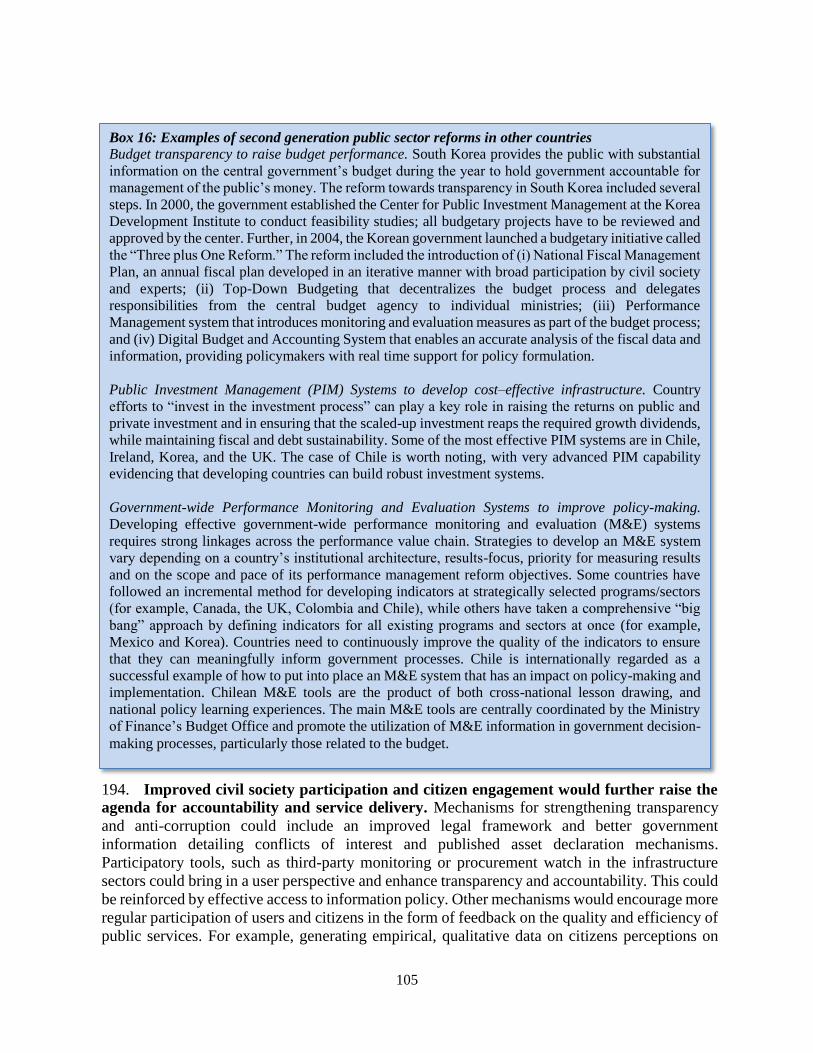
105
194. Improved civil society participation and citizen engagement would further raise the
agenda for accountability and service delivery. Mechanisms for strengthening transparency
and anti-corruption could include an improved legal framework and better government
information detailing conflicts of interest and published asset declaration mechanisms.
Participatory tools, such as third-party monitoring or procurement watch in the infrastructure
sectors could bring in a user perspective and enhance transparency and accountability. This could
be reinforced by effective access to information policy. Other mechanisms would encourage more
regular participation of users and citizens in the form of feedback on the quality and efficiency of
public services. For example, generating empirical, qualitative data on citizens perceptions on
Box 16: Examples of second generation public sector reforms in other countries
Budget transparency to raise budget performance. South Korea provides the public with substantial
information on the central government’s budget during the year to hold government accountable for
management of the public’s money. The reform towards transparency in South Korea included several
steps. In 2000, the government established the Center for Public Investment Management at the Korea
Development Institute to conduct feasibility studies; all budgetary projects have to be reviewed and
approved by the center. Further, in 2004, the Korean government launched a budgetary initiative called
the “Three plus One Reform.” The reform included the introduction of (i) National Fiscal Management
Plan, an annual fiscal plan developed in an iterative manner with broad participation by civil society
and experts; (ii) Top-Down Budgeting that decentralizes the budget process and delegates
responsibilities from the central budget agency to individual ministries; (iii) Performance
Management system that introduces monitoring and evaluation measures as part of the budget process;
and (iv) Digital Budget and Accounting System that enables an accurate analysis of the fiscal data and
information, providing policymakers with real time support for policy formulation.
Public Investment Management (PIM) Systems to develop cost–effective infrastructure. Country
efforts to “invest in the investment process” can play a key role in raising the returns on public and
private investment and in ensuring that the scaled-up investment reaps the required growth dividends,
while maintaining fiscal and debt sustainability. Some of the most effective PIM systems are in Chile,
Ireland, Korea, and the UK. The case of Chile is worth noting, with very advanced PIM capability
evidencing that developing countries can build robust investment systems.
Government-wide Performance Monitoring and Evaluation Systems to improve policy-making.
Developing effective government-wide performance monitoring and evaluation (M&E) systems
requires strong linkages across the performance value chain. Strategies to develop an M&E system
vary depending on a country’s institutional architecture, results-focus, priority for measuring results
and on the scope and pace of its performance management reform objectives. Some countries have
followed an incremental method for developing indicators at strategically selected programs/sectors
(for example, Canada, the UK, Colombia and Chile), while others have taken a comprehensive “big
bang” approach by defining indicators for all existing programs and sectors at once (for example,
Mexico and Korea). Countries need to continuously improve the quality of the indicators to ensure
that they can meaningfully inform government processes. Chile is internationally regarded as a
successful example of how to put into place an M&E system that has an impact on policy-making and
implementation. Chilean M&E tools are the product of both cross-national lesson drawing, and
national policy learning experiences. The main M&E tools are centrally coordinated by the Ministry
of Finance’s Budget Office and promote the utilization of M&E information in government decision-
making processes, particularly those related to the budget.
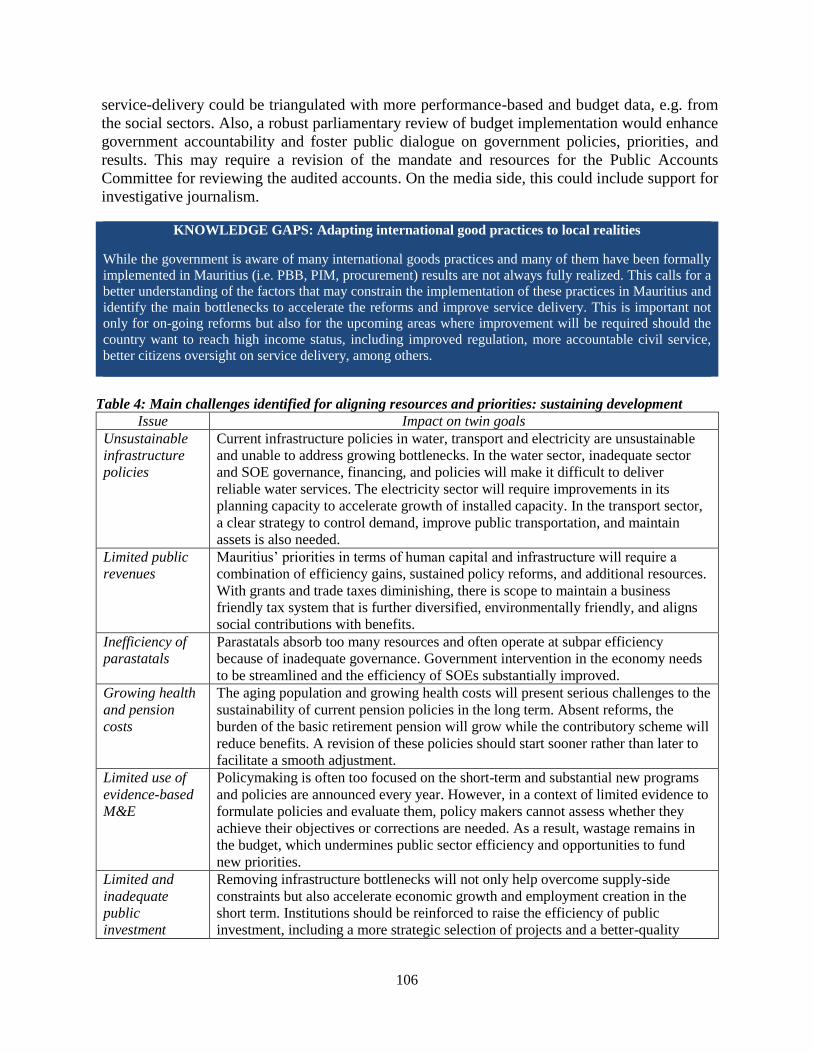
106
service-delivery could be triangulated with more performance-based and budget data, e.g. from
the social sectors. Also, a robust parliamentary review of budget implementation would enhance
government accountability and foster public dialogue on government policies, priorities, and
results. This may require a revision of the mandate and resources for the Public Accounts
Committee for reviewing the audited accounts. On the media side, this could include support for
investigative journalism.
KNOWLEDGE GAPS: Adapting international good practices to local realities
While the government is aware of many international goods practices and many of them have been formally
implemented in Mauritius (i.e. PBB, PIM, procurement) results are not always fully realized. This calls for a
better understanding of the factors that may constrain the implementation of these practices in Mauritius and
identify the main bottlenecks to accelerate the reforms and improve service delivery. This is important not
only for on-going reforms but also for the upcoming areas where improvement will be required should the
country want to reach high income status, including improved regulation, more accountable civil service,
better citizens oversight on service delivery, among others.
Table 4: Main challenges identified for aligning resources and priorities: sustaining development
Issue Impact on twin goals
Unsustainable
infrastructure
policies
Current infrastructure policies in water, transport and electricity are unsustainable
and unable to address growing bottlenecks. In the water sector, inadequate sector
and SOE governance, financing, and policies will make it difficult to deliver
reliable water services. The electricity sector will require improvements in its
planning capacity to accelerate growth of installed capacity. In the transport sector,
a clear strategy to control demand, improve public transportation, and maintain
assets is also needed.
Limited public
revenues
Mauritius’ priorities in terms of human capital and infrastructure will require a
combination of efficiency gains, sustained policy reforms, and additional resources.
With grants and trade taxes diminishing, there is scope to maintain a business
friendly tax system that is further diversified, environmentally friendly, and aligns
social contributions with benefits.
Inefficiency of
parastatals
Parastatals absorb too many resources and often operate at subpar efficiency
because of inadequate governance. Government intervention in the economy needs
to be streamlined and the efficiency of SOEs substantially improved.
Growing health
and pension
costs
The aging population and growing health costs will present serious challenges to the
sustainability of current pension policies in the long term. Absent reforms, the
burden of the basic retirement pension will grow while the contributory scheme will
reduce benefits. A revision of these policies should start sooner rather than later to
facilitate a smooth adjustment.
Limited use of
evidence-based
M&E
Policymaking is often too focused on the short-term and substantial new programs
and policies are announced every year. However, in a context of limited evidence to
formulate policies and evaluate them, policy makers cannot assess whether they
achieve their objectives or corrections are needed. As a result, wastage remains in
the budget, which undermines public sector efficiency and opportunities to fund
new priorities.
Limited and
inadequate
public
investment
Removing infrastructure bottlenecks will not only help overcome supply-side
constraints but also accelerate economic growth and employment creation in the
short term. Institutions should be reinforced to raise the efficiency of public
investment, including a more strategic selection of projects and a better-quality

107
implementation process. Given these large needs, the framework for public private
partnerships should be revamped to attract funding and raise operational efficiency.
Insufficient
regional
cooperation to
protect natural
resources
Emerging opportunities, such as the ocean economy, may drive economic
diversification and employment creation. Yet, despite a large Exclusive Economic
Zone, regional collaboration remains key in order to protect natural resources and
exploit economies of scale for the region at large.
Exposure to
natural hazards
and climate
change
Mauritius is extremely vulnerable to natural hazards, and this will increase as a
result of climate change. The potential impact in terms of sustaining economic
growth is very high and the country needs to develop a proper mix of capacities,
shared between sectors, institutions and the civil society, for risk identification, risk
reduction (prevention, planning, and design), preparedness (early warning systems),
risk financing and rapid recovery. The timeline is uncertain but the overall impact
undeniable, therefore continuous work is required to ensure the country is well
prepared when affected by natural hazards.
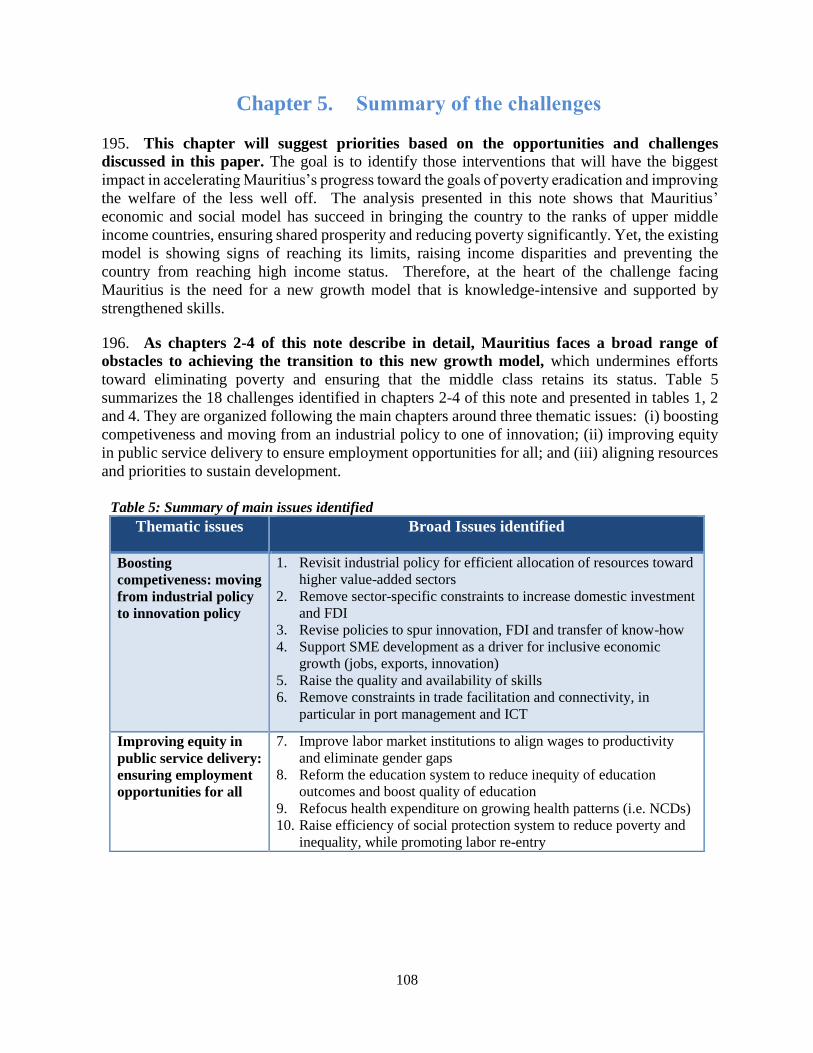
108
Chapter 5. Summary of the challenges
195. This chapter will suggest priorities based on the opportunities and challenges
discussed in this paper. The goal is to identify those interventions that will have the biggest
impact in accelerating Mauritius’s progress toward the goals of poverty eradication and improving
the welfare of the less well off. The analysis presented in this note shows that Mauritius’
economic and social model has succeed in bringing the country to the ranks of upper middle
income countries, ensuring shared prosperity and reducing poverty significantly. Yet, the existing
model is showing signs of reaching its limits, raising income disparities and preventing the
country from reaching high income status. Therefore, at the heart of the challenge facing
Mauritius is the need for a new growth model that is knowledge-intensive and supported by
strengthened skills.
196. As chapters 2-4 of this note describe in detail, Mauritius faces a broad range of
obstacles to achieving the transition to this new growth model, which undermines efforts
toward eliminating poverty and ensuring that the middle class retains its status. Table 5
summarizes the 18 challenges identified in chapters 2-4 of this note and presented in tables 1, 2
and 4. They are organized following the main chapters around three thematic issues: (i) boosting
competiveness and moving from an industrial policy to one of innovation; (ii) improving equity
in public service delivery to ensure employment opportunities for all; and (iii) aligning resources
and priorities to sustain development.
Table 5: Summary of main issues identified
Thematic issues Broad Issues identified
Boosting
competiveness: moving
from industrial policy
to innovation policy
1. Revisit industrial policy for efficient allocation of resources toward
higher value-added sectors
2. Remove sector-specific constraints to increase domestic investment
and FDI
3. Revise policies to spur innovation, FDI and transfer of know-how
4. Support SME development as a driver for inclusive economic
growth (jobs, exports, innovation)
5. Raise the quality and availability of skills
6. Remove constraints in trade facilitation and connectivity, in
particular in port management and ICT
Improving equity in
public service delivery:
ensuring employment
opportunities for all
7. Improve labor market institutions to align wages to productivity
and eliminate gender gaps
8. Reform the education system to reduce inequity of education
outcomes and boost quality of education
9. Refocus health expenditure on growing health patterns (i.e. NCDs)
10. Raise efficiency of social protection system to reduce poverty and
inequality, while promoting labor re-entry

109
Thematic issues Broad Issues identified
Aligning resources and
priorities: sustaining
development
11. Revisit unsustainable infrastructure policies in water, transport and
electricity
12. Increase public revenues to finance new priorities (i.e. education)
13. Increase fiscal space by raising efficiency of parastatals
14. Reexamine health and pension policies to cope with growing costs
of aging population
15. Ingrain evidence-based and M&E policies to raise public sector
efficiency
16. Revise public investment and PPP policies to improve public
investment leverage and efficiency
17. Develop regional approach to protect natural resources (i.e.
fisheries stock) in line with future industry development (e.g. ocean
economy and tourism)
18. Strengthen policies, institutions and implementation mechanisms to
increase resilience against natural hazards and climate change
5.1. Prioritization approach
197. Each of the challenges in Table 5 was assessed to identify the expected results that could
be obtained by removing these constraints and the impact on the twin goals of poverty elimination
and shared prosperity. In order to define priority interventions, each of the 18 challenges identified
in this note was assessed against the following criteria:
Impact on goals: To what degree will the reforms proposed impact the elimination of
poverty and ensure a sustainable increase in the welfare of the less well off? The main area
assessed in here is the impact that the proposed reform has on raising the income of the
poor and the most vulnerable, taking mainly into account prospects for additional
employment creation and productivity gains in sectors where the most vulnerable can take
advantage of opportunities.
Time horizon of impacts: Over what timeframe will the impact be realized? While the focus
of the CPF is a 5 to 7 year period, some of the priority issues will be longer term, as many
of the challenges are structural and related to moving the country to a new growth path that
will require time to be implemented. Short period is considered when impact of the reforms
could be achieved in 1-2 years, medium in 3-5 years and long period beyond 5 years.
Preconditions: To what degree does this issue need to be addressed in order to unlock wider
potential in other areas? This criteria assess whether the reform identified would serve as
a building block to reforms supported in other areas.
Complementarities: To what degree does the issue have influence across different domains
(growth, inequality, sustainability) and/or would magnify the positive impact of addressing
other constraints? The assessment scores strong if affects all the three domains, medium if
affect two domains and weak if only affects one domain.
Evidence-base: Based on the quality of the evidence, how confident are we in the
identification of the issue as a priority? This criterion acknowledges reforms where not
enough granularity can be offered and additional analytical work is required to better detail
a reform plan.
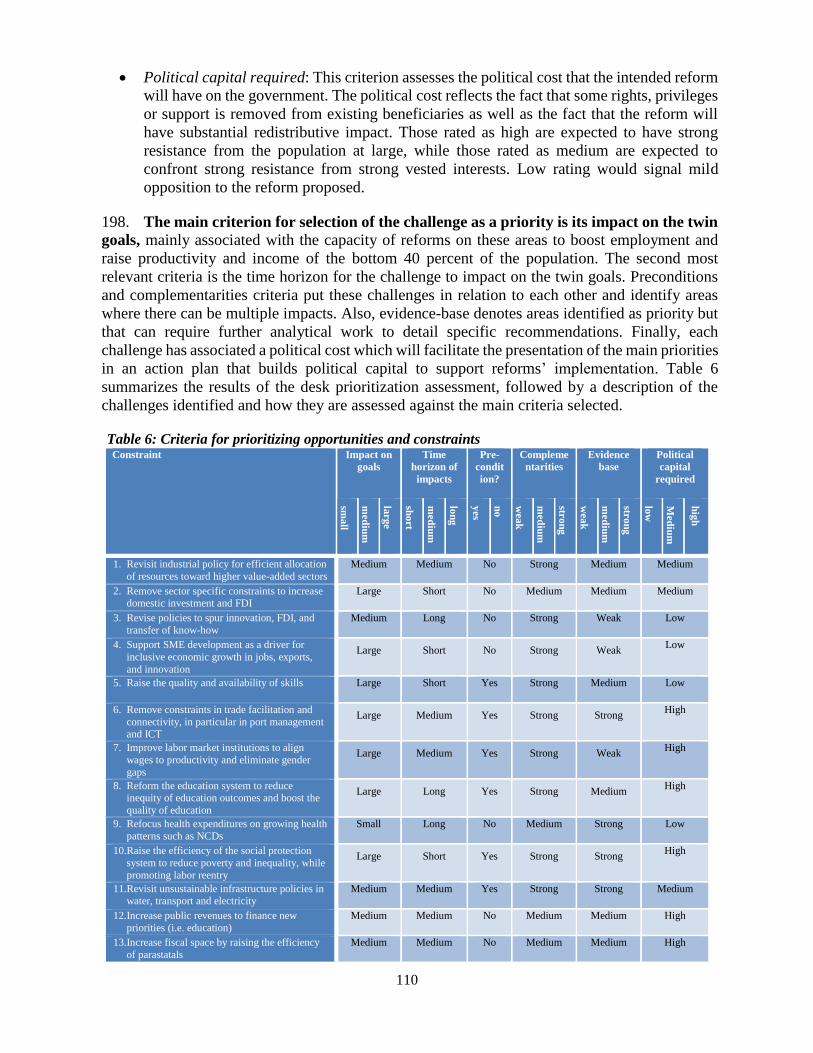
110
Political capital required: This criterion assesses the political cost that the intended reform
will have on the government. The political cost reflects the fact that some rights, privileges
or support is removed from existing beneficiaries as well as the fact that the reform will
have substantial redistributive impact. Those rated as high are expected to have strong
resistance from the population at large, while those rated as medium are expected to
confront strong resistance from strong vested interests. Low rating would signal mild
opposition to the reform proposed.
198. The main criterion for selection of the challenge as a priority is its impact on the twin
goals, mainly associated with the capacity of reforms on these areas to boost employment and
raise productivity and income of the bottom 40 percent of the population. The second most
relevant criteria is the time horizon for the challenge to impact on the twin goals. Preconditions
and complementarities criteria put these challenges in relation to each other and identify areas
where there can be multiple impacts. Also, evidence-base denotes areas identified as priority but
that can require further analytical work to detail specific recommendations. Finally, each
challenge has associated a political cost which will facilitate the presentation of the main priorities
in an action plan that builds political capital to support reforms’ implementation. Table 6
summarizes the results of the desk prioritization assessment, followed by a description of the
challenges identified and how they are assessed against the main criteria selected.
Table 6: Criteria for prioritizing opportunities and constraints Constraint Impact on
goals Time
horizon of
impacts
Pre-
condit
ion?
Compleme
ntarities Evidence
base Political
capital
required sm
all
med
ium
large
sho
rt
med
ium
lon
g
yes
no
wea
k
med
ium
stro
ng
wea
k
med
ium
stro
ng
low
Med
ium
hig
h
hig
h
1. Revisit industrial policy for efficient allocation
of resources toward higher value-added sectors
Medium Medium No Strong Medium Medium
2. Remove sector specific constraints to increase domestic investment and FDI
Large Short No Medium Medium Medium
3. Revise policies to spur innovation, FDI, and
transfer of know-how
Medium Long No Strong Weak Low
4. Support SME development as a driver for
inclusive economic growth in jobs, exports,
and innovation
Large Short No Strong Weak Low
5. Raise the quality and availability of skills Large Short Yes Strong Medium Low
6. Remove constraints in trade facilitation and
connectivity, in particular in port management and ICT
Large Medium Yes Strong Strong High
7. Improve labor market institutions to align
wages to productivity and eliminate gender
gaps
Large Medium Yes Strong Weak High
8. Reform the education system to reduce inequity of education outcomes and boost the
quality of education
Large Long Yes Strong Medium High
9. Refocus health expenditures on growing health
patterns such as NCDs
Small Long No Medium Strong Low
10. Raise the efficiency of the social protection
system to reduce poverty and inequality, while
promoting labor reentry
Large Short Yes Strong Strong High
11. Revisit unsustainable infrastructure policies in water, transport and electricity
Medium Medium Yes Strong Strong Medium
12. Increase public revenues to finance new
priorities (i.e. education)
Medium Medium No Medium Medium High
13. Increase fiscal space by raising the efficiency
of parastatals
Medium Medium No Medium Medium High

111
Constraint Impact on
goals
Time
horizon of
impacts
Pre-
condit
ion?
Compleme
ntarities
Evidence
base
Political
capital
required
small
med
ium
large
sho
rt
med
ium
lon
g
yes
no
wea
k
med
ium
stro
ng
wea
k
med
ium
stro
ng
low
Med
ium
hig
h
hig
h
14. Reexamine health and pension policies to cope
with growing costs due to the aging population
Large Long No Strong Strong High
15. Ingrain evidence-based and M&E policies to raise public sector efficiency
Medium Long No Strong Strong Low
16. Revise public investment and PPP policies to
improve public investment
Medium Long No Medium Medium Low
17. Develop a regional approach to protect natural
resources such as fisheries stock, in line with
future industry development including the ocean economy and tourism
Medium Medium No Medium Weak Low
18. Strengthen policies, institutions and
implementation mechanisms to increase
resilience against natural hazards and climate
change
Medium Medium No Strong Medium Low
1. Revisit industrial policy for efficient allocation of resources toward higher value-added
sectors: Cross subsidies and protection measures still support sectors facing strong
competition such as textiles, in part to maintain jobs. Yet, this objective is not always fully
met and hinders the development of services sectors that often end up subsidizing less
efficient sectors. Removing these constraints would serve to reallocate resources and create
employment in growing services sectors to compensate for job losses in declining sectors.
This would have impact in the medium term, accelerating economic growth, inclusiveness
and impacting favorably the sustainability of the economic model. However, government
is expected to confront strong resistance from those that benefit most from the current
industrial policy. (Paragraphs 82-84).
2. Remove sector specific constraints to increase domestic investment and FDI: Sector
constraints hold back the potential to accelerate investment, attract FDI, and create
employment. The constraints range from fragmentation in the agriculture sector, to an
unclear legal framework for expanding aquaculture, to limited regional cooperation for the
support of tourism. Lifting many of these sector constraints could immediately create a
large number of jobs, providing opportunities for the population at large and the most
vulnerable and poor specifically. This would favorably affect growth and inclusiveness.
Overall, political cost of these reforms would upset some entrenched groups that benefit of
the status quo but it is unlikely that they will be rejected by the population at large.
(Paragraphs 105-127, Box 8).
3. Revise policies to spur innovation, FDI, and transfer of know-how: Inadequate intellectual
property policies, institutions for R&D, and university and enterprise collaboration hamper
the capacity of the economy to absorb new technology and increase the know-how content
of FDI. Revamped policies would support economic diversification and promote human
capital development. As this requires substantial institutional changes the impact of these
reforms would likely only be felt in the long run. Therefore, this may not have direct impact
on the most vulnerable in the short term but it would have spillovers on employment
creation through acceleration of economic growth. However, to achieve more granularity
on the reforms to be implemented would require additional analytical work. Overall, no
major opposition is expected to the implementation of reforms in this area as it would have
limited redistributive impact. (Paragraphs 85-89, Box 6).
112
4. Support SME development as a driver for inclusive economic growth in jobs, exports, and
innovation: SMEs represent the majority of businesses in Mauritius but fail to create
enough employment or generate enough profits or exports. Part of their challenge may be
limited access to finance, as well as inadequate government support in some areas, such as
accessing and sustaining exports. Removing these constraints would have immediate
impact on employment creation of the most vulnerable, reinforcing inclusive economic
growth based on a more sustainable and resilient economic model. Yet, a clear
identification of these constraints would require finalization of a new firm census to ensure
that targeted support to SMEs responds to adequately identified needs. It is expected that
there will be limited political and institutional opposition to measures in support of SMEs
as in general the population favors them and the redistributive impact is relatively minor.
(Paragraphs 102-104).
5. Raise the quality and availability of skills: Inadequate skills are holding back the potential
of the economy to diversify and increase competitiveness. This also limits the inclusiveness
of growth, as a large part of the population cannot acquire these skills through education
or training. Supporting the improvement of skills would therefore likely have an immediate
impact in accelerating inclusive economic growth and reinforcing resilience of the
economy. Furthermore, improved skills would be a prerequisite for many related reforms
to succeed as the population would be able to take advantage of opportunities unlocked in
a more innovative knowledge economy. This reform is expected to face limited opposition
by the population at large, and is favored also by the limited stakeholders that could oppose
it. (Paragraphs 90-91).
6. Remove constraints in trade facilitation and connectivity, in particular in port management
and ICT: Expanded capacity in airport, port and telecom infrastructure is undermined by
policies that constrain operational efficiency. Further air liberalization could enhance
competition, reduce prices, and support growth in some sectors such as tourism, which are
intensive in low and semi-skilled labor. Improved port performance would further support
the role of Port Louis as a regional transshipment hub, raising the country’s
competitiveness and opening investment and employment opportunities for an industrial
hub around port/ocean activities. Similarly, increased competition in the use of broadband
could reduce costs and support the expansion of the ICT sector, which would create
substantial semi-skilled and highly skilled jobs, if skills in this area are reinforced. Overall,
this would serve to create a large number of jobs in the medium term while building
economic resilience. It is expected that political cost of some of these reforms will be high
due to opposition by very vocal and powerfully entrenched groups. (Paragraphs 92-100).
7. Improve labor market institutions to align wages to productivity and eliminate gender
gaps: Labor market institutions are raising certain sector wages above labor productivity,
undermining competitiveness and the potential for employment creation. Also, these
institutions generate severe gender discrimination that hampers the inclusiveness of
economic growth. Revising labor market institutions would serve to restore
competitiveness and create employment in the medium term, also a precondition for other
reforms to succeed and for the economy to become more resilient. Yet, additional analytical
work and dialogue will be required to ensure that the revised labor market institutions
reflect international good practices and Mauritius’ social model. Given the substantial
power shift that this may entail and the impact on the population at large, government
would likely face strong and vocal resistance. (Paragraphs 159-166).
8. Reform the education system to reduce inequity of education outcomes and boost the
quality of education: The quality of education is not on par with the country’s aspirations
and outcomes are very unequal, with a large part of the population failing to acquire the
113
minimum education requirements to be fully productive. As a result, human capital is too
low, undermining competitiveness and economic diversification and ingraining
intergenerational inequality and poverty. Improving the equity and quality of the education
system is a prerequisite for the country to inclusively develop further. Reforms should start
immediately as expected results will take a relatively long time to materialize as new
cohorts move along the improved educational system. Political cost to reforms in this area
can be large, associated with vocal and strong stakeholders as well as a large part of the
population that benefits from the positive (although unequal) outcomes of the current
education system. (Paragraphs 141-149, Box 9).
9. Refocus health expenditures on growing health patterns such as NCDs: The health system
is burdened by high rates of non-communicable diseases that, combined with aging
population, will put intense pressure on the system. Private spending is already very high
and the public system will need to realign funding to address emerging diseases, raise
efficiency, and ensure adequate complementarity with private spending to ensure that the
most vulnerable are adequately cared for. This is expected to have relatively limited impact
on the most vulnerable in the short term as the public health system covers the entire
population, but the situation will require careful monitoring and incremental reform to
ensure that the growing health patterns do not undermine health outcomes of the most
vulnerable in the future. Overall, this reform is expected to require limited political capital
as it will have relatively small redistributive effects. (Paragraphs 130-134).
10. Raise the efficiency of the social protection system to reduce poverty and inequality, while
promoting labor reentry: Fragmentation in the social protection system undermines its
efficiency and its capacity to relieve entrenched poverty in Mauritius. Furthermore,
uncoordinated and untargeted programs do not always adequately cover the most
vulnerable. A comprehensive review of the social protection system would have a large
immediate impact on three aspects. It would improve inclusiveness and tackle poverty by
better targeting social assistance, accelerate economic growth by promoting labor
reintegration that would compensate for a declining labor force, while avoiding aid
dependency and reinforcing the resilience of the economic model. This is expected to have
high political cost as it would entail a redistribution of benefits, which are currently broadly
distributed across the population, to make them more targeted. (Paragraphs 152-158).
11. Revisit unsustainable infrastructure policies in water, transport and electricity: Current
infrastructure policies are unsustainable and unable to address growing bottlenecks. In the
water sector, inadequate sector and SOE governance, financing, and policies will make it
difficult to deliver reliable water services. The electricity sector will require improvements
in its planning capacity to accelerate growth of installed capacity. In the transport sector, a
clear strategy to control demand, improve public transportation, and maintain assets is also
needed. Most of the population has access to basic services and therefore improving these
policies would not have an immediate impact on poverty. Yet, it would be a prerequisite
for removing bottlenecks to further economic growth in the medium term, ensuring a
sustainable provision of infrastructure services. These reforms are expected to have a
political cost associated with tariff increases (i.e. in water) and pricing mechanisms to
manage transport or energy demand. (Paragraphs 176-194).
12. Increase public revenues to finance new priorities such as education: Mauritius’ priorities
in terms of human capital and infrastructure will require a combination of efficiency gains,
sustained policy reforms, and additional resources. With grants and trade taxes
diminishing, there is scope to maintain a business friendly tax system that is further
diversified, environmentally friendly, and aligns social contributions with benefits. This
will have a moderate direct impact on the most vulnerable and poor but will open avenues
114
to align public resources to areas that most benefit them in the medium term. While impact
on economic growth would likely not be large it would substantially support more inclusive
and sustainable public spending. It is expected that this will have large political cost as the
population at large would unlikely see favorably any tax increase. (Paragraphs 168-170,
P. 209-210).
13. Increase fiscal space by raising the efficiency of parastatals: Parastatals absorb too many
resources and often operate at subpar efficiency because of inadequate governance.
Government intervention in the economy needs to be streamlined and the efficiency of
SOEs substantially improved. While this would not have direct impact on the most
vulnerable in the short term, it would allow targeting resources into emerging priorities that
benefit the neediest. It would also serve to accelerate economic growth as SOEs become
more efficient. This would likely have a large political cost for entrenched stakeholders
given the extensive patronage system associated with existing parastatals. (Paragraphs
211-215).
14. Re-examine health and pension policies to cope with growing costs due to the aging
population: The aging population and growing health costs will present serious challenges
to the sustainability of current pension policies in the long term. Absent reforms, the burden
of the basic retirement pension will grow while the contributory scheme will reduce
benefits. A revision of these policies should start sooner rather than later to facilitate a
smooth adjustment. It is not expected that these reforms will have an immediate impact on
the most vulnerable or poor but would protect critical benefits in the long term while
encouraging private savings required to sustain economic development. These reforms
would likely entail high political costs as they would curtail current and/or foreseen
benefits for the population at large. (Paragraphs 204-208, Box 13).
15. Ingrain evidence-based M&E policies to raise public sector efficiency: Policymaking is
often too focused on the short-term and substantial new programs and policies are
announced every year. However, in a context of limited evidence to formulate policies and
evaluate them, policy makers cannot assess whether they achieve their objectives or
corrections are needed. As a result, wastage remains in the budget, which undermines
public sector efficiency and opportunities to fund new priorities. The impact of improving
evidence-based M&E policies would likely be long term as it would require substantial and
incremental institutional changes that would need time to produce results. Yet, once
operational it would ensure more disciplined, sustainable, and focused public expenditure
that would better align resources to the needs of the poor and vulnerable. This reform is
unlikely to have any major political cost as it does not remove existing benefits or have
redistribution impact. (Paragraphs 224-227, Box 16).
16. Revise public investment and PPP policies to improve public investment: Removing
infrastructure bottlenecks will not only help overcome supply-side constraints but also
accelerate economic growth and employment creation in the short term. Institutions should
be reinforced to raise the efficiency of the public investment, including a more strategic
selection of projects and a better-quality implementation process. Given these large needs,
the framework for public private partnerships should be revamped to attract funding and
raise operational efficiency. These institutional reforms would likely require some time to
raise public sector efficiency and given the relative long time required to prepare some of
the required large infrastructure, it would likely have full impact in the long term. Reforms
in this area would likely not have major political cost as they does not remove existing
benefits or have redistribution impact. (Paragraph 223, Box 15).
17. Develop a regional approach to protect natural resources such as fisheries stock, in line
with future industry development including the ocean economy and tourism: Emerging

115
opportunities such as the ocean economy may drive economic diversification and
employment creation for the population at large. Yet, despite a large Exclusive Economic
Zone, regional collaboration remains key in order to protect natural resources and exploit
economies of scale for the region. This would also serve to contribute to the sustainability
of natural resources in Mauritius and at regional level. This reform is unlikely to have any
major political cost as it does not remove existing benefits or have redistribution impact.
(Paragraphs 173-175, Box 11).
18. Strengthen policies, institutions and implementation mechanisms to increase resilience
against natural hazards and climate change: Mauritius is extremely vulnerable to natural
hazards, and this will increase as a result of climate change. The potential impact in terms
of sustaining economic growth is very high and the country needs to develop a proper mix
of capacities, shared between sectors, institutions and the civil society, for risk
identification, risk reduction (prevention, planning, and design), preparedness (early
warning systems), risk financing and rapid recovery. The timeline is uncertain but the
overall impact undeniable, therefore continuous work is required to ensure the country is
well prepared when affected by natural hazards. This might not have direct implications
for the most vulnerable and poor in the short term but would certainly serve to better protect
the poor (often the most exposed and vulnerable to natural hazards) in the medium term.
This reform is unlikely to have any major political cost as it does not remove existing
benefits or have redistribution impact. (Paragraphs 169-172, Box 10).
199. To complement and enrich the desk assessment, consultations were held with key
stakeholders, including internal consultations among the country team, and presentations in
Mauritius to government, private sector, civil society, and development partners. The
presentations served to outline the main analysis and the logic behind the identification of
challenges and priorities. Overall, the consultations underlined broad support for the analysis and
priorities identified and reinforced the prioritization process proposed. However, it was suggested
that more emphasis should be placed on the need to improve government effectiveness in an
incremental and sustained way as well as the need to improve public-private dialogue, which has
served so well the country in the past. It was also requested that the prioritization not only serve
to identify areas where impact on shared prosperity is larger but also propose a timeline that could
help the government to articulate its reform process.
5.2. Prioritization: final results
200. Mauritius needs a new growth model that is knowledge-intensive and supported by
strengthened skills. The right inputs for this transformation include adequate skills, improved
infrastructure and increased investment and know-how. These need to be combined with a
conducive environment that provides adequate incentives in terms of labor market institutions,
innovation policies, sustainable infrastructure, and public services. The main question that the
country faces at this time is: What should come first? Based on the above prioritization process,
the SCD aims to balance the relevance of these interventions with a timeline that provides an
inclusive and politically feasible path to reach high-income status.
201. There are substantial political economy constraints to moving forward with the
required reforms. In Mauritius, a strong political system built on years of coalition governments
resists major changes from within. Two major risks exist from the political economy point of
view. The first risk is to fail to recognize that past policies will not propel the country to a new
stage of development. Furthermore, delaying the reforms will put additional pressure on
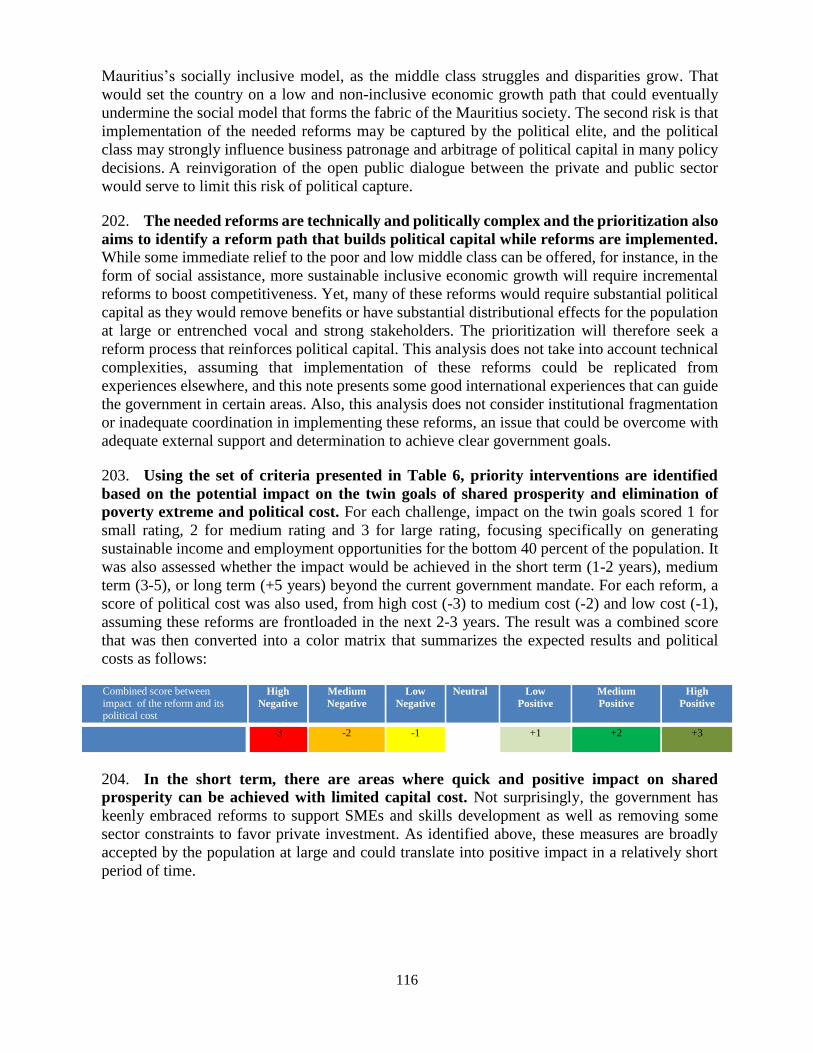
116
Mauritius’s socially inclusive model, as the middle class struggles and disparities grow. That
would set the country on a low and non-inclusive economic growth path that could eventually
undermine the social model that forms the fabric of the Mauritius society. The second risk is that
implementation of the needed reforms may be captured by the political elite, and the political
class may strongly influence business patronage and arbitrage of political capital in many policy
decisions. A reinvigoration of the open public dialogue between the private and public sector
would serve to limit this risk of political capture.
202. The needed reforms are technically and politically complex and the prioritization also
aims to identify a reform path that builds political capital while reforms are implemented.
While some immediate relief to the poor and low middle class can be offered, for instance, in the
form of social assistance, more sustainable inclusive economic growth will require incremental
reforms to boost competitiveness. Yet, many of these reforms would require substantial political
capital as they would remove benefits or have substantial distributional effects for the population
at large or entrenched vocal and strong stakeholders. The prioritization will therefore seek a
reform process that reinforces political capital. This analysis does not take into account technical
complexities, assuming that implementation of these reforms could be replicated from
experiences elsewhere, and this note presents some good international experiences that can guide
the government in certain areas. Also, this analysis does not consider institutional fragmentation
or inadequate coordination in implementing these reforms, an issue that could be overcome with
adequate external support and determination to achieve clear government goals.
203. Using the set of criteria presented in Table 6, priority interventions are identified
based on the potential impact on the twin goals of shared prosperity and elimination of
poverty extreme and political cost. For each challenge, impact on the twin goals scored 1 for
small rating, 2 for medium rating and 3 for large rating, focusing specifically on generating
sustainable income and employment opportunities for the bottom 40 percent of the population. It
was also assessed whether the impact would be achieved in the short term (1-2 years), medium
term (3-5), or long term (+5 years) beyond the current government mandate. For each reform, a
score of political cost was also used, from high cost (-3) to medium cost (-2) and low cost (-1),
assuming these reforms are frontloaded in the next 2-3 years. The result was a combined score
that was then converted into a color matrix that summarizes the expected results and political
costs as follows:
Combined score between
impact of the reform and its political cost
High
Negative
Medium
Negative
Low
Negative
Neutral Low
Positive
Medium
Positive
High
Positive
-3 -2 -1 +1 +2 +3
204. In the short term, there are areas where quick and positive impact on shared
prosperity can be achieved with limited capital cost. Not surprisingly, the government has
keenly embraced reforms to support SMEs and skills development as well as removing some
sector constraints to favor private investment. As identified above, these measures are broadly
accepted by the population at large and could translate into positive impact in a relatively short
period of time.
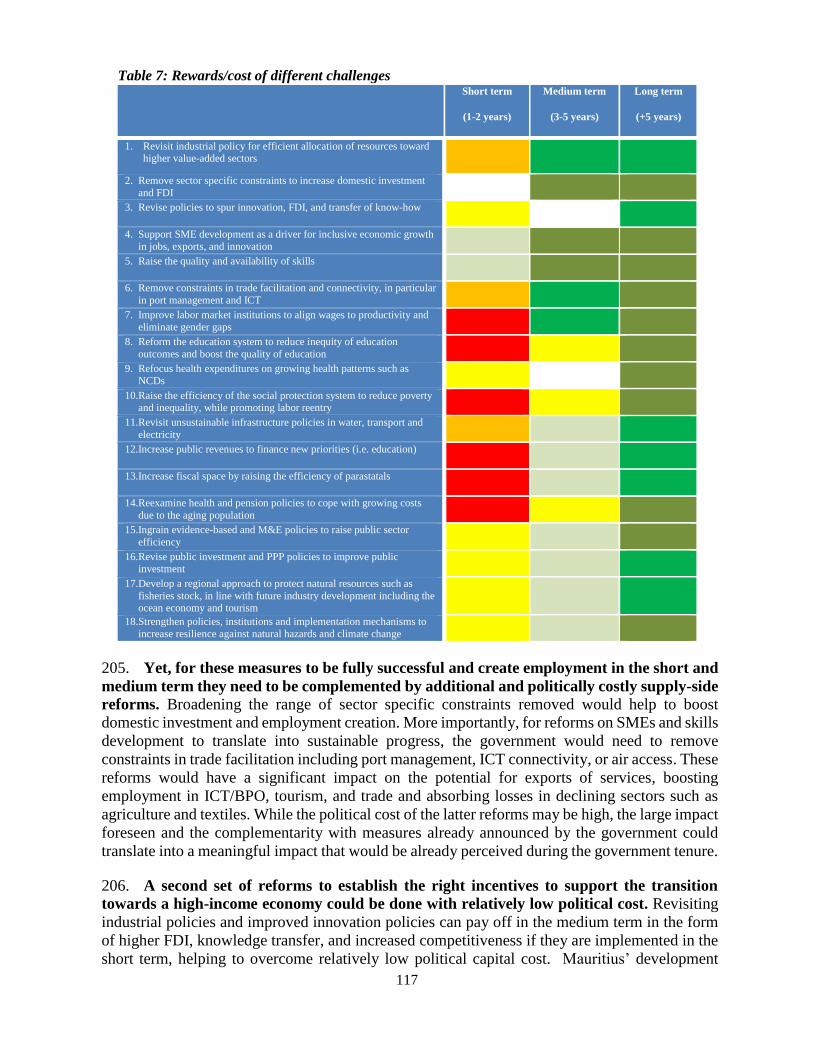
117
Table 7: Rewards/cost of different challenges Short term
(1-2 years)
Medium term
(3-5 years)
Long term
(+5 years)
1. Revisit industrial policy for efficient allocation of resources toward higher value-added sectors
2. Remove sector specific constraints to increase domestic investment
and FDI
3. Revise policies to spur innovation, FDI, and transfer of know-how
4. Support SME development as a driver for inclusive economic growth in jobs, exports, and innovation
5. Raise the quality and availability of skills
6. Remove constraints in trade facilitation and connectivity, in particular
in port management and ICT
7. Improve labor market institutions to align wages to productivity and eliminate gender gaps
8. Reform the education system to reduce inequity of education
outcomes and boost the quality of education
9. Refocus health expenditures on growing health patterns such as
NCDs
10. Raise the efficiency of the social protection system to reduce poverty and inequality, while promoting labor reentry
11. Revisit unsustainable infrastructure policies in water, transport and
electricity
12. Increase public revenues to finance new priorities (i.e. education)
13. Increase fiscal space by raising the efficiency of parastatals
14. Reexamine health and pension policies to cope with growing costs
due to the aging population
15. Ingrain evidence-based and M&E policies to raise public sector
efficiency
16. Revise public investment and PPP policies to improve public investment
17. Develop a regional approach to protect natural resources such as
fisheries stock, in line with future industry development including the ocean economy and tourism
18. Strengthen policies, institutions and implementation mechanisms to
increase resilience against natural hazards and climate change
205. Yet, for these measures to be fully successful and create employment in the short and
medium term they need to be complemented by additional and politically costly supply-side
reforms. Broadening the range of sector specific constraints removed would help to boost
domestic investment and employment creation. More importantly, for reforms on SMEs and skills
development to translate into sustainable progress, the government would need to remove
constraints in trade facilitation including port management, ICT connectivity, or air access. These
reforms would have a significant impact on the potential for exports of services, boosting
employment in ICT/BPO, tourism, and trade and absorbing losses in declining sectors such as
agriculture and textiles. While the political cost of the latter reforms may be high, the large impact
foreseen and the complementarity with measures already announced by the government could
translate into a meaningful impact that would be already perceived during the government tenure.
206. A second set of reforms to establish the right incentives to support the transition
towards a high-income economy could be done with relatively low political cost. Revisiting
industrial policies and improved innovation policies can pay off in the medium term in the form
of higher FDI, knowledge transfer, and increased competitiveness if they are implemented in the
short term, helping to overcome relatively low political capital cost. Mauritius’ development

118
aspirations will be difficult to achieve and sustain without sustainable policies for transport,
electricity, water, and wastewater management. This calls for a concerted effort that tackles
overall governance in those sectors, including policies to manage demand, improve governance
in utility companies, administer sustainable tariffs, and increase investment to sustain the quality
of services for the entire population. Early implementation of these reforms would help to reap
their benefits during the government tenure. While reforming labor market institutions may be
costly, it would have a large positive impact if combined with the above reforms, helping to set
up a more competitive economy.
207. Incremental progress can work towards building a comprehensive Disaster Risk
Management and Climate Adaptation Framework to mitigate the impact of future disasters
at low political cost. Mauritius remains extremely exposed to natural hazards this will only
increase over time as climate change continues. In the immediate term the legislative framework
should be further strengthened to create the enabling environment to mainstream risk reduction
into sector development, further improvement of the early warning systems, contingency plans,
impact assessment methodologies and disaster risk financing strategies. Adequately integrating
the sustainable policies of Maurice Ile durable will be important to building the resilience of the
country. Opportunities to exploit natural resources, from the ocean economy to the tourism
industry, call for more concerted regional cooperation to ensure that these resources are
sustainably preserved. Limited opposition to these reforms and the positive impact that they can
have in the medium term calls for immediate implementation.
208. Delivering on a broad reform program requires the public sector to take a leading
role, which can be done in an incremental way. In order to improve public service delivery in
education and health, raise the efficiency of public investment, and create a level playing field for
private sector investment, the government must adopt a modern public sector approach based on
continuous evaluation and strengthened accountability. Moving forward, further progress will
require tackling some more politically costly reforms. Fiscal space should be created by
increasing public expenditures, eliminating waste, and shifting focus away from non-priority
areas such as SOEs so that public services are aligned toward the emerging needs of the country
in terms of building human capital and infrastructure. Furthermore, pension and health policies
will need to be revisited to cope with growing costs related to the aging population. The earlier
these policies are implemented the smoother the impact can be shared among the population,
easing resistance to change.
209. Despite high political cost, reforming the social protection system would alleviate
poverty, provide safety nets to reduce vulnerabilities, and support active labor market
policies, such as training and employment services. With a low base of extreme poverty and
substantial amounts already allocated to social protection, reform and modernization of
Mauritius’s social protection system offers the possibility of virtually eliminating extreme poverty
in the medium term. It also may address many other inclusion challenges such as those found in
the education and labor markets. Furthermore, with growing inequality inherent to the on-going
development process, an improved and well-targeted social protection system can effectively
support those falling behind and ease their reintegration into the labor market.
210. Improving education to raise employment productivity is key to making Mauritius a
successful high-income economy. Although these efforts have a high political cost, they will
likely pay off in the long term. Raising the quality of education and better aligning skills with
labor market needs will help Mauritians, especially young Mauritians, to reap the benefits of
119
economic growth in the form of expanded employment opportunities and increased income. Not
only may additional public resources be needed to improve the education system but policy
reforms such as implementation of nine years schooling would also serve to achieve more
equitable education results so that the population at large contributes to and benefits from growing
opportunities. A new education system that raises quality and equity would not only help to push
the country to a new development path but also to break the substantial intergenerational vicious
poverty cycle that undermines opportunities of much of the bottom 40 percent of the population.
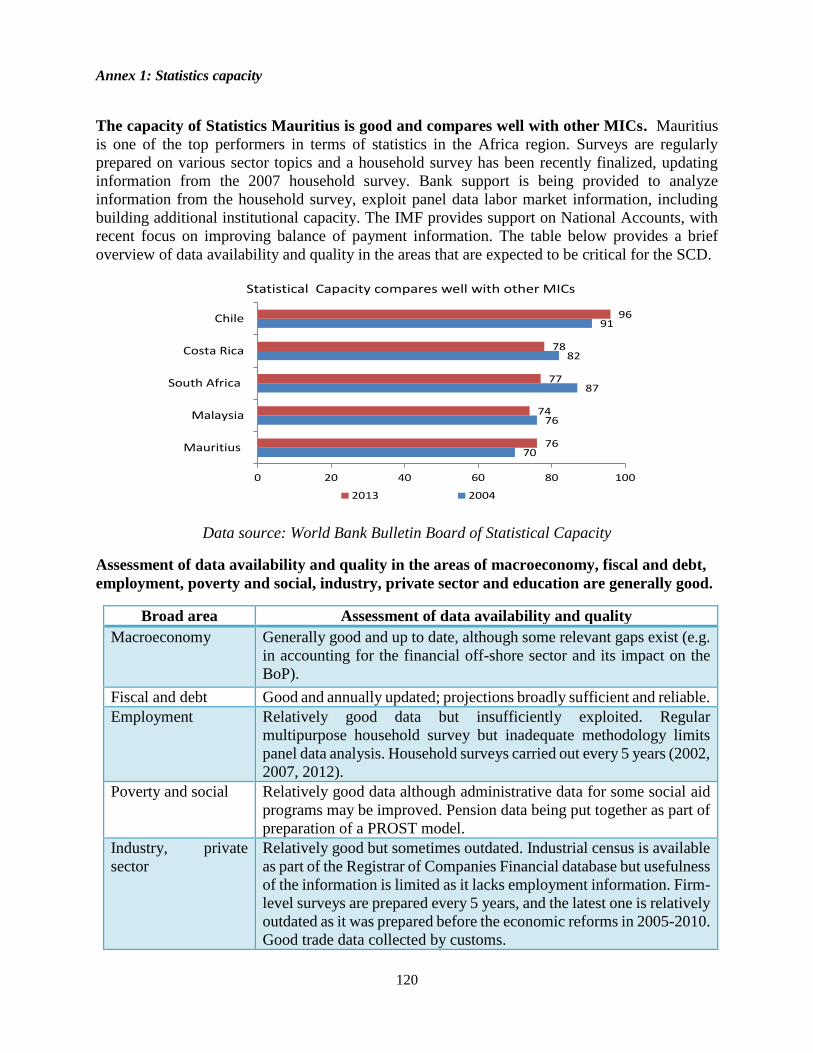
120
Annex 1: Statistics capacity
The capacity of Statistics Mauritius is good and compares well with other MICs. Mauritius
is one of the top performers in terms of statistics in the Africa region. Surveys are regularly
prepared on various sector topics and a household survey has been recently finalized, updating
information from the 2007 household survey. Bank support is being provided to analyze
information from the household survey, exploit panel data labor market information, including
building additional institutional capacity. The IMF provides support on National Accounts, with
recent focus on improving balance of payment information. The table below provides a brief
overview of data availability and quality in the areas that are expected to be critical for the SCD.
Data source: World Bank Bulletin Board of Statistical Capacity
Assessment of data availability and quality in the areas of macroeconomy, fiscal and debt,
employment, poverty and social, industry, private sector and education are generally good.
Broad area Assessment of data availability and quality
Macroeconomy Generally good and up to date, although some relevant gaps exist (e.g.
in accounting for the financial off-shore sector and its impact on the
BoP).
Fiscal and debt Good and annually updated; projections broadly sufficient and reliable.
Employment Relatively good data but insufficiently exploited. Regular
multipurpose household survey but inadequate methodology limits
panel data analysis. Household surveys carried out every 5 years (2002,
2007, 2012).
Poverty and social Relatively good data although administrative data for some social aid
programs may be improved. Pension data being put together as part of
preparation of a PROST model.
Industry, private
sector
Relatively good but sometimes outdated. Industrial census is available
as part of the Registrar of Companies Financial database but usefulness
of the information is limited as it lacks employment information. Firm-
level surveys are prepared every 5 years, and the latest one is relatively
outdated as it was prepared before the economic reforms in 2005-2010.
Good trade data collected by customs.
70
76
87
82
91
76
74
77
78
96
0 20 40 60 80 100
Mauritius
Malaysia
South Africa
Costa Rica
Chile
Statistical Capacity compares well with other MICs
2013 2004
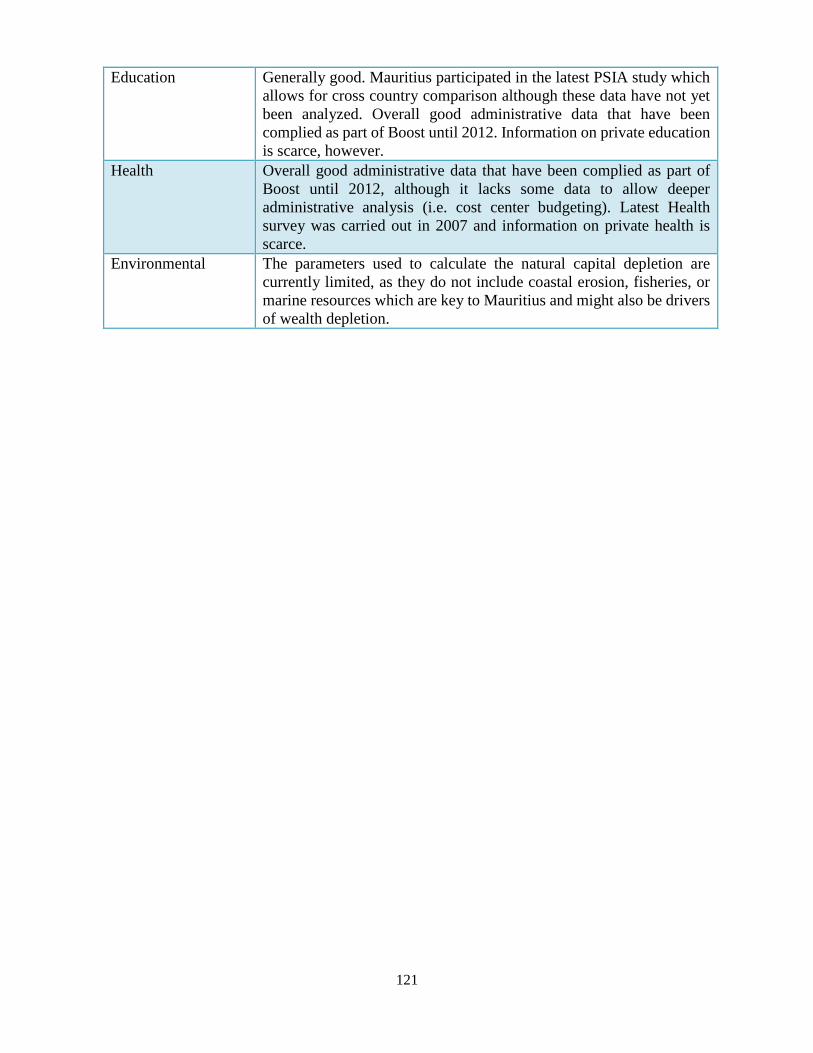
121
Education Generally good. Mauritius participated in the latest PSIA study which
allows for cross country comparison although these data have not yet
been analyzed. Overall good administrative data that have been
complied as part of Boost until 2012. Information on private education
is scarce, however.
Health Overall good administrative data that have been complied as part of
Boost until 2012, although it lacks some data to allow deeper
administrative analysis (i.e. cost center budgeting). Latest Health
survey was carried out in 2007 and information on private health is
scarce.
Environmental The parameters used to calculate the natural capital depletion are
currently limited, as they do not include coastal erosion, fisheries, or
marine resources which are key to Mauritius and might also be drivers
of wealth depletion.

122
Annex 2: Recent analytical work
Recent World Bank analytical works are listed below:
Report / document (year)
“Mauritius Inclusiveness of Growth and Shared Prosperity” (P146743) (2014)
Building Analytical Capacity to raise Public Sector Efficiency (P128135) (2013)
Indian Ocean Islands Tourism Review: Mauritius dealing with challenges in the tourism sector in
Mauritius (2013)
Mauritius: Civil Service Reform Policy Note (P125280) (2012)
Social Protection Review and Strategy (2010)
PROST model - analysis of pension reforms (2014)
SOEs governance - Public Sector Performance DPL (2013)
SOEs fiscal risks (2014)
Transport sector – MIP and RAMS projects (2013)
Public sector performance - Monitoring and Evaluation (2014)
Public sector performance, IMF –WB reviews of the introduction of the Performance Base Budgeting
(2010)
ICT sector - Mauritius Competitiveness DPO (2014)
Tertiary education sector - Mauritius Competitiveness DPO (2014)
Improve regulation and raise value added in the financial sector - Mauritius Competitiveness DPO.
Improvement business and trade environment - Public Sector Performance DPL (2013)
Benchmarking electricity public company, - analysis of the financing of the electricity sector (2013)
Diagnosis and options for private sector participation in the water public company (2012)
Petroleum sector -RAS (2014)
Development of the ocean economy concept (2013)
Develop the Procurement Act and related regulations (2013)
Mauritius Human Opportunity Index (2012)
SPEA/Atkins and Luxconsult (2014) Designing an Asset Management Strategy for the Road
Development Authority, funded by the PPIAF;
Antonaropoulos & Associates, together with G. Karavokyris & Partners, Future Water, and Desai and
Associates (2014) Land Drainage and Watershed Management Study;
Sweroad (2012) Road Safety Management Capacity Review, a study funded by the Global Road Safety
Facility (GRSF);
Luxconsult and PD Naidoo & Assocs. (2011) Feasibility Study, Detailed Design and Preparation of
Bidding Documents for Baie du Tombeau Sewerage Project;
Transport Research Laboratory (2011) Implementation of a Road Management System
NIRAS and Mega Designs (2011) Masterplan for the Development of Water Resources in Mauritius
Frischmann Prabhu (India) PVT. LTD and Dagon Eng. (2011) Feasibility Study for an East-West
Connector
Arup Sigma Ltd and Architects Studio Ltd (2011) Feasibility Study for an Underpass at Place D’Ames
Castelia (2011) Renewable Energy Plan
Ecorys (2011) Feasibility Study for new runway at Sir Gaetan Duval Airport, Rodrigues

123
Various analytical works carried out by the Government of Mauritius and by development
partners are listed below:
Organization Report / document (in blue those accessible on –line)
Nathan associates Inc for
Commonwealth Sec.
Draft Africa Trade and Investment Strategy for Mauritius
Nathan associates Inc for
Commonwealth Sec.
Draft Mauritius International Financial Services
Government of Mauritius Outline for the Blue print economy
The National Energy
Commission
Report of the National Energy Commission: Making the right choice for a
sustainable energy future: The emergence of a “green Economy” - 2013
UNDP Policy and Governance Assessment for Marine and Coastal
Resources for the Republic of Mauritius - 2011
ILO Skills for Green Jobs in Mauritius – 2011
Green jobs in Mauritius. Experiences from a Small Island Developing
State – 2012
IMF Article IV reports:
Mauritius: The Drivers of Growth—Can the Past be Extended?
Inclusive Growth and the Incidence of Fiscal Policy in Mauritius — Much
Progress, But More Could be Done
Reforming the Tax System to Promote Environmental Objectives: An
Application to Mauritius
UNHABITAT Mauritius - National Urban Profile -2012
UNDESA/UNDP National Synthesis Report Rio+20 - 2012
UNDP/MOESD Disaster Risk Reduction Strategic Framework and Action Plan -2012
UNDP/MOESD National Climate Change Adaptation Policy Framework: Policy, Strategy,
Action Plan, Investment Plan, and Methodology - 2012
UNHABITAT / Ministry of
Housing and Lands
Rapid assessment of social housing programs effected in Mauritius since
the 1960’s - 2012
UNEP TNA Report IV: Projects Idea Report - Adaptation (Water, Agriculture,
Coastal Zone) - 2013
UNEP TNA Report III Technology Action Plan – Adaptation Water, Agriculture
and Coastal Zone) - 2013
UNDP/MOFED The Programme-based budgeting reform in Mauritius. Preconditions,
achievements and challenges ahead - 2013
UNDP Trade Mainstreaming - 2013
UNDP National Marine Ecosystem Diagnostic Analysis
(MEDA) Mauritius - 2013
WHO Situation Analysis on the social inequities to Health (Social determinants
of Health) with focus to NCDs - 2013
UNESCO UNESCO Country Diagnostic Report -2013
NAS/ UNAIDS Stigma Index Consultation – 2013
UNFPA ICPD and Beyond 2014 - 2013
UNDP/MOESD Environmental Impact Assessment in the Republic of Mauritius:
Recommendations for Mainstreaming Climate change into the EIA process
– 2013
UNDP/MOESD Integrating climate Change into Coastal Planning and Management in the
Republic of Mauritius: Recommendations for Mainstreaming Climate
Change into the current ICZM framework - 2013

124
UNDP/MEPU Industrial Energy Audit Reports (10) - 2013
UNDP/UNEP/MoH National Sound Management of Chemicals Situation Report - 2013
UNDP The SRM and the Social Aid Reform - 2013
GEF/SGP/RRA Northern Marine Reserves Rodrigues- Management Plan 2012-1016 –
2013
UNRCO Youth Leadership Workbook - 2013
UNDP/UNFPA/UNWomen Rodrigues Gender Policy 2013-2017 - 2013
UNDP/UNFPA/UNWomen Costed Action Plan to fight against Gender Based Violence (GBV) in
Rodrigues - 2013
UNDP UNDP Gender Briefing Kit - 2013
UNDP/MFA MDG Report 2013 - 2013
FAO FAO Bioenergy and Food Security (BEFS) Country Brief Mauritius - 2013
FAO Reorganization and Strengthening the Governance Framework of
Agricultural Services of Ministry of Agro-Industry and Food Security,
Republic of Mauritius – 2014
UNDP/ UNEP/
SAICM/GoM
National Priorities for the Sound Management of Chemicals: Phased Plan
of Action, Economic Analysis and Mainstreaming Road Map - 2014
UNDP/ UNEP/
SAICM/GoM
National Chemicals Profile of the Republic of Mauritius - 2014
125
Annex 3: Knowledge gaps
Knowledge gaps have been identified in natural wealth accounting, in adapting in international
good practices to local realities, in SMEs constraints and access to finance, in statistic and
economic valuation, and viable aquaculture models. For ease of reading, the knowledge gaps are
summarized below:
(i) Natural wealth accounting. While Mauritius has shown a strong commitment to developing
natural wealth accounts, considerable work is still needed to fully incorporate all forms of
wealth. So far the parameters used to calculate natural capital depletion are limited, as they do
not include coastal erosion, fisheries, or marine resources, which are key to Mauritius and
might also be drivers of wealth depletion.
(ii) Mauritius needs to assess the factors that inhibit the implementation of international
good practices to local realities as well as bottlenecks to wrap up with reforms. While the
government is aware of many international good practices and many of them have been
formally implemented in Mauritius (i.e. PBB, PIM, procurement), results are not always fully
realized. This calls for a better understanding of the factors that may hinder the implementation
of these practices in Mauritius. It is also important to identify the main bottlenecks to accelerate
the reforms and improve service delivery. This is important not only for the on-going reforms
but also for the upcoming areas where improvement will be required should the country want
to reach high income status, including improved regulation, more accountable civil service,
better citizens oversight on service delivery, among others.
(iii)SMEs constraints and access to finance. While there are broad discussions in Mauritius
about the challenges that SME face, particularly in terms of access to finance, there have been
no comprehensive surveys since 2009 to understand the nature of these challenges. As a new
census takes place in 2015, this will be an opportunity to assess SMEs’ challenges and the
impact that on-going government measures have on supporting them in key areas such as
support to export, access to finance and transfer of knowledge, among others.
(iv) Statistics and economic valuation. Statistical and economic data collection remains limited,
is not achievable for entire value chains, and suffers from data inconsistency among the various
sources. Key statistical and analytical methodologies should be defined and implemented to
support fisheries, aquaculture management and development planning. Sector regional
dimension and economy of scales potential call for a regional approach and the development
of a national fisheries information system and dashboard to be integrated into regional ones.
(v) Viable aquaculture models. There is a need to identify key constraints, comparative
advantages and sound socio-economic and environmental aquaculture models to support sector
development.

126
Annex 4: Map of the Republic of Mauritius