Systematic Comparison of Trial Exclusion Criteria for ...
17
Original Article Systematic Comparison of Trial Exclusion Criteria for Pupillometry Data Analysis in Individuals With Single-Sided Deafness and Normal Hearing Emily A. Burg 1 , Tanvi Thakkar 1 , Taylor Fields 1 , Sara M. Misurelli 1,2 , Stefanie E. Kuchinsky 3 , Joseph Roche 2 , Daniel J. Lee 4 , and Ruth Y. Litovsky 1,2 Abstract The measurement of pupil dilation has become a common way to assess listening effort. Pupillometry data are subject to artifacts, requiring highly contaminated data to be discarded from analysis. It is unknown how trial exclusion criteria impact experimental results. The present study examined the effect of a common exclusion criterion, percentage of blinks, on speech intelligibility and pupil dilation measures in 9 participants with single-sided deafness (SSD) and 20 participants with normal hearing. Participants listened to and repeated sentences in quiet or with speech maskers. Pupillometry trials were processed using three levels of blink exclusion criteria: 15%, 30%, and 45%. These percentages reflect a threshold for missing data points in a trial, where trials that exceed the threshold are excluded from analysis. Results indicated that pupil dilation was significantly greater and intelligibility was significantly lower in the masker compared with the quiet condition for both groups. Across-group comparisons revealed that speech intelligibility in the SSD group decreased significantly more than the normal hearing group from quiet to masker conditions, but the change in pupil dilation was similar for both groups. There was no effect of blink criteria on speech intelligibility or pupil dilation results for either group. However, the total percentage of blinks in the masker condition was significantly greater than in the quiet condition for the SSD group, which is consistent with previous studies that have found a relationship between blinking and task difficulty. This association should be carefully considered in future experiments using pupillometry to gauge listening effort. Keywords single-sided deafness, listening effort, pupil dilation, cochlear implant Received 8 July 2020; Revised 25 March 2021; accepted 2 April 2021 Introduction Effective, everyday communication is a complex skill requiring a myriad of peripheral and central auditory processes. Therefore, a single performance measure, such as a speech intelligibility score, fails to capture all aspects of listening. For example, speech intelligibility does not capture the amount of effort a listener expends. Listening effort is defined as the deliberate allocation of attention-related cognitive resources to perform difficult listening tasks (Pichora-Fuller et al., 2016). A participant’s engagement or motivation to perform the task is also thought to contribute to the amount of effort they expend (Winn et al., 2018). As such, individuals with the same intelligibility score may exert different 1 Waisman Center, University of Wisconsin-Madison, Madison, Wisconsin, United States 2 Department of Surgery, Division of Otolaryngology – Head and Neck Surgery, School of Medicine & Public Health, University of Wisconsin- Madison, Madison, Wisconsin, United States 3 Audiology and Speech Pathology Center, Walter Reed National Military Medical Center, Bethesda, Maryland, United States 4 Massachusetts Eye and Ear Infirmary, Harvard Medical School, Boston, Massachusetts, United States Corresponding Author: Ruth Y. Litovsky, Waisman Center, University of Wisconsin-Madison, 1500 Highland Ave, Madison, WI 53705, United States. Email: [email protected] Trends in Hearing Volume 25: 1–17 ! The Author(s) 2021 Article reuse guidelines: sagepub.com/journals-permissions DOI: 10.1177/23312165211013256 journals.sagepub.com/home/tia Creative Commons Non Commercial CC BY-NC: This article is distributed under the terms of the Creative Commons Attribution- NonCommercial 4.0 License (https://creativecommons.org/licenses/by-nc/4.0/) which permits non-commercial use, reproduction and distribution of the work without further permission provided the original work is attributed as specified on the SAGE and Open Access pages (https://us.sagepub.com/en- us/nam/open-access-at-sage).
Transcript of Systematic Comparison of Trial Exclusion Criteria for ...

Original Article
Systematic Comparison of TrialExclusion Criteria for PupillometryData Analysis in Individuals WithSingle-Sided Deafness and Normal Hearing
Emily A. Burg1, Tanvi Thakkar1, Taylor Fields1, Sara M. Misurelli1,2,Stefanie E. Kuchinsky3, Joseph Roche2, Daniel J. Lee4, andRuth Y. Litovsky1,2
Abstract
The measurement of pupil dilation has become a common way to assess listening effort. Pupillometry data are subject to
artifacts, requiring highly contaminated data to be discarded from analysis. It is unknown how trial exclusion criteria impact
experimental results. The present study examined the effect of a common exclusion criterion, percentage of blinks, on
speech intelligibility and pupil dilation measures in 9 participants with single-sided deafness (SSD) and 20 participants with
normal hearing. Participants listened to and repeated sentences in quiet or with speech maskers. Pupillometry trials were
processed using three levels of blink exclusion criteria: 15%, 30%, and 45%. These percentages reflect a threshold for missing
data points in a trial, where trials that exceed the threshold are excluded from analysis. Results indicated that pupil dilation
was significantly greater and intelligibility was significantly lower in the masker compared with the quiet condition for both
groups. Across-group comparisons revealed that speech intelligibility in the SSD group decreased significantly more than the
normal hearing group from quiet to masker conditions, but the change in pupil dilation was similar for both groups. There
was no effect of blink criteria on speech intelligibility or pupil dilation results for either group. However, the total percentage
of blinks in the masker condition was significantly greater than in the quiet condition for the SSD group, which is consistent
with previous studies that have found a relationship between blinking and task difficulty. This association should be carefully
considered in future experiments using pupillometry to gauge listening effort.
Keywords
single-sided deafness, listening effort, pupil dilation, cochlear implant
Received 8 July 2020; Revised 25 March 2021; accepted 2 April 2021
Introduction
Effective, everyday communication is a complex skill
requiring a myriad of peripheral and central auditory
processes. Therefore, a single performance measure,
such as a speech intelligibility score, fails to capture all
aspects of listening. For example, speech intelligibility
does not capture the amount of effort a listener expends.
Listening effort is defined as the deliberate allocation
of attention-related cognitive resources to perform
difficult listening tasks (Pichora-Fuller et al., 2016). A
participant’s engagement or motivation to perform the
task is also thought to contribute to the amount of effort
they expend (Winn et al., 2018). As such, individuals
with the same intelligibility score may exert different
1Waisman Center, University of Wisconsin-Madison, Madison, Wisconsin,
United States2Department of Surgery, Division of Otolaryngology – Head and Neck
Surgery, School of Medicine & Public Health, University of Wisconsin-
Madison, Madison, Wisconsin, United States3Audiology and Speech Pathology Center, Walter Reed National Military
Medical Center, Bethesda, Maryland, United States4Massachusetts Eye and Ear Infirmary, Harvard Medical School, Boston,
Massachusetts, United States
Corresponding Author:
Ruth Y. Litovsky, Waisman Center, University of Wisconsin-Madison, 1500
Highland Ave, Madison, WI 53705, United States.
Email: [email protected]
Trends in Hearing
Volume 25: 1–17
! The Author(s) 2021
Article reuse guidelines:
sagepub.com/journals-permissions
DOI: 10.1177/23312165211013256
journals.sagepub.com/home/tia
Creative Commons Non Commercial CC BY-NC: This article is distributed under the terms of the Creative Commons Attribution-
NonCommercial 4.0 License (https://creativecommons.org/licenses/by-nc/4.0/) which permits non-commercial use, reproduction and distribution
of the work without further permission provided the original work is attributed as specified on the SAGE and Open Access pages (https://us.sagepub.com/en-
us/nam/open-access-at-sage).

amounts of effort due to individual factors, such as hear-ing or cognitive abilities (Ohlenforst et al., 2017; Zekveldet al., 2011). In fact, individuals with hearing loss gen-erally report being more fatigued after an hour of listen-ing and find noisy listening situations to be morecognitively taxing compared with persons with normalhearing (NH; Edwards, 2007; Zekveld et al., 2010). Thedocumented differences in listening effort betweenhearing-impaired and NH individuals are of interestbecause elevated effort is associated with stress andfatigue and can also affect social interactions, thus neg-atively impacting quality of life (Alhanbali et al., 2019;Hughes et al., 2018; Stephens & H�etu, 1991).
Numerous methods have been used to quantify listen-ing effort, including subjective, behavioral, and physio-logical measures (McGarrigle et al., 2014). Themeasurement of pupil dilation, or pupillometry, is aparticularly appropriate technique for tracking changesin the time course of listening effort. Task-evoked changesin pupil dilation are tightly coupled to the activity of nor-adrenergic neurons in the locus coeruleus (Aston-Jones &Cohen, 2005) and are therefore thought to be atime-sensitive index of attention and cognitive effort.The ability to capture changes in cognitive effort in realtime is important because processing load is dynamic andmay fluctuate throughout the duration of a stimulus(Winn et al., 2018). Furthermore, unlike other physiolog-ical measures that are subject to electrical and magneticartifacts (e.g., functional magnetic resonance imaging,electroencephalography), pupillometry is compatiblewith amplification devices (e.g., hearing aids) andimplantable devices (e.g., cochlear implants; Friesen &Picton, 2010; Gilley et al., 2006; Wagner et al., 2019). Inaddition, pupillometry is relatively fast and inexpensive,making it a practical research technique and giving it thepotential to be a valuable clinical tool (Winn et al., 2018).
While the utility of measuring pupil dilation to assesslistening effort has been documented (Zekveld et al.,2018), uniform methods for collecting, analyzing, andinterpreting pupillometry data are still being established(see Winn et al., 2018). Pupil dilation is a slow physio-logical response that can be contaminated by biologicalartifacts, such as blinking, gaze drifting, and participantmovement, ultimately introducing noise into the data.Therefore, there is a need for data to be processed orcleaned before they are further analyzed. This processhas not been well established across research groups,but reports suggest that data cleansing can includelow-pass filtering, analysis and normalization of thebaseline pupil measure, identification and rejection ofcorrupted trials, and de-blinking (Winn et al., 2018). Inthe present study, we focus on “de-blinking,” whichrefers to the interpolation of data points within a pupiltrack where the participant has blinked or where thepupil has been momentarily lost by the eyetracker. Of
the three types of eye blinks that have been identified
(spontaneous, reflexive, and voluntary), spontaneous
blinks are likely the most prominent during pupillometrytasks because these are necessary for visual clarity
and keeping the eye hydrated and occur in an extremely
symmetrical and coordinated manner (Cruz et al., 2011).Spontaneous blinks have been associated with numerous
cognitive factors, including attention, information
processing, speech production, and task difficulty
(Stern et al., 1984; Tanaka & Yamaoka, 1993).However, the relationship between task difficulty and
spontaneous blinks is unclear, with some studies report-
ing increased blink rate during more difficult tasks (e.g.,
Recarte et al., 2019; Wood & Hassett, 1983) and othersreporting blink inhibition (e.g., Holland & Tarlow, 1972,
1975; Zheng et al., 2012). These contradictory findings
can be at least partially explained by the nature of the
task, with reports of blink inhibition occurring more fre-quently in tasks involving a visual component compared
with those that do not (Recarte et al., 2019; Stern et al.,
1984). Recarte et al. (2019) investigated blink rate, pupildilation, and subjective rating as a function of mental
workload in young adults during three cognitive tasks:
listening to speech, producing speech, and performing a
mental arithmetic task. They found that each task eli-cited an increase in blink rate compared with the control
condition. When participants were instructed to com-
plete these tasks along with a visual search task, they
still observed an increase in blink rate compared withthe control condition, but the magnitude of increase
was smaller than when there was no visual search task,
thus demonstrating the complex relationship between
blink rate and task modality. Of particular interest tothe current study is their finding that the speech produc-
tion and mental arithmetic tasks, which elicited the high-
est blink rates, also resulted in the largest pupil dilationsand the highest subjective ratings of difficulty (Recarte
et al., 2019). This suggests that blink rate and task dif-
ficulty are positively correlated for nonvisual tasks.Some work has suggested that trials with more than
30% missing data should be discarded from analysis, as
these trials may no longer contain meaningful informa-
tion (Winn et al., 2018). However, other studies have
used a more conservative criterion of 15% (e.g.,Koelewijn et al., 2012; Zekveld & Kramer, 2014;
Zekveld et al., 2011). To our knowledge, no work has
clarified how a criterion is established, nor has there
been a systematic investigation of its potential conse-quences. Due to the documented relationship between
blink rate and cognitive load, it is important to ensure
(a) that valid data are not being unnecessarily discardedand (b) that a chosen blink criterion does not skew
results by disproportionately flagging difficult trials
due to a higher proportion of spontaneous blinks.
2 Trends in Hearing
Further, while several studies have investigated listen-ing effort in individuals with bilateral hearing loss, therehas been little focus on individuals with single-sideddeafness (SSD), who have one ear with near-normalhearing and one with severe-to-profound sensorineuralhearing loss. This is a timely population to study, as anumber of these individuals are now pursuing cochlearimplantation in an attempt to improve spatial hearingabilities and reduce debilitating effects of tinnitus.Outcomes thus far have been promising, with severalstudies reporting partial or full tinnitus suppression(Arndt et al., 2011; Buechner et al., 2010; Litovskyet al., 2019; Mertens et al., 2016; Tavora-Vieira et al.,2013), improved speech perception in noise (Bernsteinet al., 2016; Gartrell et al., 2014), better sound localiza-tion abilities (Arndt et al., 2011; Gartrell et al., 2014;Litovsky et al., 2019; Vermeire & Van De Heyning,2009; Zeitler et al., 2015), and improved quality of lifeafter cochlear implantation (Arndt et al., 2011; Dillonet al., 2018; Firszt et al., 2012; H€ark€onen et al., 2015;Tavora-Vieira et al., 2019; Vermeire & Van De Heyning,2009). However, there is a lack of knowledge regardinghow much cognitive load individuals with SSD exert incomplex listening environments. This topic has clinicalrelevance in the context of determining whether cochlearimplantation can facilitate reduced listening effort inaddition to the aforementioned benefits for individualswith SSD.
The present study examined speech intelligibility andlistening effort in individuals with SSD and with NH.Experimental methods differed slightly between SSDand NH listeners and will be presented as two separateexperiments. The first aim of this study examined theeffect of blink exclusion criteria on speech intelligibility,pupil dilation, and the number of trials included foranalysis in each condition. This investigation is impera-tive due to the observed relationship between blinkingand task difficulty and will help establish empiricallyvalidated methods for the analysis of pupillometrydata. The second aim compared performance and
listening effort between SSD and NH listeners to betterunderstand the implications of listening with one ear incomplex auditory environments as well as the possibili-ties for improvement following cochlear implantation.
Experiment 1: Listening Effort and Speech
Intelligibility in Participants With SSD
Methods
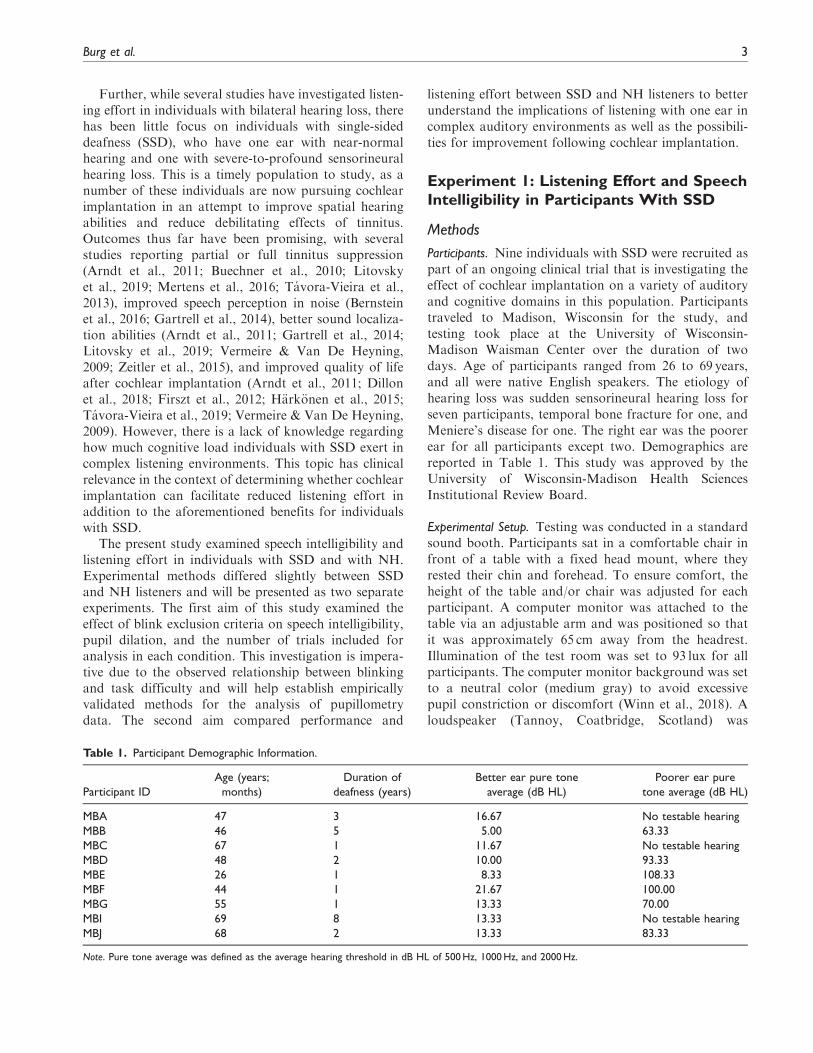
Participants. Nine individuals with SSD were recruited aspart of an ongoing clinical trial that is investigating theeffect of cochlear implantation on a variety of auditoryand cognitive domains in this population. Participantstraveled to Madison, Wisconsin for the study, andtesting took place at the University of Wisconsin-Madison Waisman Center over the duration of twodays. Age of participants ranged from 26 to 69 years,and all were native English speakers. The etiology ofhearing loss was sudden sensorineural hearing loss forseven participants, temporal bone fracture for one, andMeniere’s disease for one. The right ear was the poorerear for all participants except two. Demographics arereported in Table 1. This study was approved by theUniversity of Wisconsin-Madison Health SciencesInstitutional Review Board.
Experimental Setup. Testing was conducted in a standardsound booth. Participants sat in a comfortable chair infront of a table with a fixed head mount, where theyrested their chin and forehead. To ensure comfort, theheight of the table and/or chair was adjusted for eachparticipant. A computer monitor was attached to thetable via an adjustable arm and was positioned so thatit was approximately 65 cm away from the headrest.Illumination of the test room was set to 93 lux for allparticipants. The computer monitor background was setto a neutral color (medium gray) to avoid excessivepupil constriction or discomfort (Winn et al., 2018). Aloudspeaker (Tannoy, Coatbridge, Scotland) was
Table 1. Participant Demographic Information.
Participant ID
Age (years;
months)
Duration of
deafness (years)
Better ear pure tone
average (dB HL)
Poorer ear pure
tone average (dB HL)
MBA 47 3 16.67 No testable hearing
MBB 46 5 5.00 63.33
MBC 67 1 11.67 No testable hearing
MBD 48 2 10.00 93.33
MBE 26 1 8.33 108.33
MBF 44 1 21.67 100.00
MBG 55 1 13.33 70.00
MBI 69 8 13.33 No testable hearing
MBJ 68 2 13.33 83.33
Note. Pure tone average was defined as the average hearing threshold in dB HL of 500Hz, 1000Hz, and 2000Hz.
Burg et al. 3

positioned at 0� azimuth at a height of 130 cm. Pupil size
was measured in pixels using the “Area” setting on an
eyetracker (Eyelink 1000 Plus). Pupil area was sampled
at a rate of 1000Hz using a proprietary algorithm devel-
oped by Eyelink manufacturers. The eyetracker camera
was fixed to the table via a desktop mount 8 cm in front
of the computer monitor.
Stimuli. Target stimuli were drawn from the Harvard
Institute of Electrical and Electronics Engineers sentence
corpus (IEEE, 1969) and were recorded by a male
talker. Masker stimuli (two-talker babble) consisted of
AzBio sentences (Spahr et al., 2012) recorded by two
different male talkers. Prior to testing, all stimuli were
equalized to 85 dB sound pressure level (SPL)-A and
stored as .wav files. During testing, stimuli were scaled
to 65 dB SPL-A and played to the loudspeaker through a
USB high-speed audio interface (RME Fireface,
Haimhausen, Germany). Target sentences ranged from
4,000 to 6,000ms in duration. Masker sentences were
concatenated into a long sequence, and the starting
sample of the maskers was randomly selected for each
trial. Maskers began 250ms prior to the onset of the
target sentence and ended 250ms after the offset of the
target. A computer with customized software written in
MATLAB (The MathWorks, Natick, MA) was used to
deliver stimuli and collect data.
Procedure. Participants were tested in two conditions: (a)
quiet, where the target was presented from 0� azimuth
and (b) with speech maskers, where the target and
maskers were both presented from 0� azimuth at a
signal-to-noise ratio (SNR) of 0 dB. Prior to beginning
the experiment, participants completed a familiarization
procedure in which they heard six sentences in quiet,
followed by 5 to 10 sentences with maskers. Stimuli for
practice trials were randomly selected and then excluded
from the test corpus to avoid any sentence repetitions.During testing participants were instructed to fixate
their gaze on a small cross in the center of the computer
screen and attend to target sentences presented in quiet
or in the presence of maskers. At the beginning of each
trial the cross color turned white to indicate that the trial
was about to begin, and then a 1,000-ms baseline mea-
surement in quiet was completed prior to the onset of the
stimuli for all conditions. After stimulus offset, there was
a 2,000-ms silent period to allow participants to think
and prepare to respond. Participants were asked to
repeat the target sentence after the 2,000-ms silent
period. To prompt the verbal report of what was
perceived, the cross on the screen turned green and the
participant heard two beeps (Figure 1). Each sentence
contained five key words, and an experimenter scored
how many words the participant correctly repeated.
The experimenter waited 10 to 15 s between trials to
allow the pupil to return to baseline before beginning
the next trial. Participants were encouraged to guess
for sentences that they did not entirely hear. Frequent
breaks were given throughout testing to avoid fatigue.For both the quiet and masker conditions, stimuli
were blocked into runs consisting of 15 sentences.
Each participant was tested on at least two runs per
condition. If time allowed, a third run was tested for
the quiet condition. Research has shown that pupil
Figure 1. Example of a Pupil Track. Baseline pupil dilation was measured 1,000ms prior to stimulus onset, the stimulus was thenpresented, there was a 2,000-ms silent period, participants heard two beeps to prompt a verbal response (dashed line), and then listenersrepeated what they perceived.
4 Trends in Hearing

tracks in easier conditions (e.g., speech perception inquiet) often contain more distortions and have morevariability than tracks recorded in more difficult condi-tions (e.g., with maskers at a low SNR), which reliablyelicit large changes in pupil dilation (Winn et al., 2018).If a condition only requires minimal cognitive resources,the pupil response may be small or may not rise aboverandom pupillary oscillations that typically occur.Therefore, a higher number of trials are required totease apart task-evoked changes in pupil size fromnoise or other sources of variability (e.g., movement,gaze drifting, etc.). Testing a higher number of trials inthe quiet condition was intended to maximize the possi-bility that small responses would be distinguishable fromnoise and that an adequate amount of data would beavailable for analysis after discarding contaminatedtracks. Due to time constraints, two out of nine partic-ipants (MBI, MBJ) completed only two quiet runs,rather than three. The order of conditions was random-ized for each participant, and for each run, target stimuliwere randomly selected from the corpus withoutrepetition.
Data Analysis. This study examined the effect of process-ing pupillometry data with three different blink criteria:no more than 15%, 30%, or 45% of pupil track samplesmissing from the trial. As previously mentioned,task-evoked pupil dilation is susceptible to biologic arti-facts, such as blinking, gaze drifting, and poor baselinemeasures, even when controlling for factors such aslighting and external distractions. While blinking is theprincipal cause of lost samples in a track, gaze driftingand equipment error can also contribute to the amountof missing data. At present, it is not possible to disen-tangle these artifact sources. Therefore, the term blinkwill be used to refer to all missing samples, regardless ofthe cause. For a given blink criterion, all tracks withgreater than the specified amount of missing data werediscarded from analysis. When calculating the percent-age of missing samples in a track, only samples from theonset of the baseline to the end of the silent period wereconsidered (Figure 1). The response period was notincluded in the analysis because this part of the pupiltrack is influenced by the motor response and is there-fore not purely related to task difficulty (Privitera et al.,2010; Winn et al., 2015). Consistent with methods forexcluding contaminated trials from analysis, asdescribed by Winn et al. (2018), tracks with vastly irreg-ular baseline measurements, excessive distortions duringthe stimulus or silent period, or disproportionately largegrowth that is not typical of task-evoked changes inpupil dilation were also discarded. Further, tracks thatcontained a large section of missing data in a region ofinterest (e.g., during the wait period from which maxi-mum pupil dilation is extracted) were also discarded,
even if the percentage of missing data was below the
specified blink criterion, as the interpolation could flat-
ten the peak of the pupil response. In total, 1.6% of
quiet trials and 0.7% of masker trials were discarded
due to these types of contamination.In addition to discarding contaminated trials and
processing the data using the three different blink crite-
ria, the data for each condition were “de-blinked” (i.e.,
linearly interpolated between gaps of missing data) and
low-pass filtered with a 10-ms time window using the
“smooth” function in MATLAB. Methods for detecting
blinks were in accordance with those described by
Zekveld et al. (2010), where pupil dilations that fell
below three standard deviations (SDs) from the mean
were tagged as missing samples. The segments of missingdata were linearly interpolated 80ms before the blink
and 160ms following the blink to account for disturban-
ces in pupil size caused by the eyelid opening and closing
(Zekveld et al., 2010). Tracks were then baseline
corrected by subtracting the baseline value (calculated
by averaging the pupil response measured 1,000ms
before stimulus onset; Figure 1) and then dividing by
the baseline value to obtain the proportion of pupil
change from baseline.1 Finally, tracks were time-
aligned to stimulus offset and averaged together by con-
dition for each participant.Both maximum pupil dilation (i.e., maximum propor-
tional change from baseline) and percentage of correctly
repeated words were calculated for all included trials.
The maximum pupil dilation was calculated during the
2,000ms after the stimulus offset and before the response
prompt, classified as the “silent period” (Figure 1). This
period is considered to be a window where listeners pro-
cess and plan for their response (Zekveld et al., 2010).
While the latency for peak pupil dilation can vary across
participants, this window has commonly been shown to
elicit the greatest amount of pupil dilation throughout
the trial for sentence-recognition tasks such as the one
used here (Winn et al., 2015, 2018).
Statistical Analysis. An alpha of .05 was used for all tests to
determine whether results were significantly different
from chance. Shapiro–Wilk normality tests were used
to determine whether speech intelligibility and pupil dila-
tion data were normally distributed. To reduce ceiling
effects, the speech intelligibility data were transformed
into rationalized arcsine units (RAUs) prior to analysis
(Studebaker, 1985). RAUs are analogous to percent
correct scores in that higher values correspond to
better performance. Separate approaches were used for
normally distributed and non-normally distributed data
to examine differences across conditions for each blink
criterion. Either a matched-pairs t test was used or a
paired Wilcoxon signed-rank test was used, respectively.
Burg et al. 5

In addition to investigating the effect of blink criteriaon speech intelligibility and pupil dilation across condi-tions, we also examined potential bias toward discardinga higher number of difficult trials due to blinks. In otherwords, we examined the difference in the number of trialsdiscarded per condition due to the percentage of blinksexceeding the specified criterion. The goal of this analysiswas to understand whether more trials were beingdiscarded due to blinks in the masker condition comparedwith the quiet condition because of the proposed relation-ship between blinking and task difficulty. A Pearson’schi-square test of independence was used to determinewhether the number of trials included for analysis underthe least stringent (45%) and most stringent (15%) crite-ria was related to the difficulty of the condition (quiet vs.masker). Finally, to further examine a potential relation-ship between condition difficulty and spontaneous blinksin our task, a matched-pairs t test was used to assesswhether the percentage of blinks in the masker conditionwas significantly different from the quiet condition underthe most lenient blink criterion (45%).
Results
Effect of Listening Condition on Speech Intelligibility and Pupil
Dilation. Figure 2 plots individual and average speechintelligibility in the quiet and masker conditions foreach blink criterion. We expected participants to per-form better in the quiet condition compared with themasker condition. In line with our prediction, all partic-ipants exhibited near-ceiling performance levels in the
quiet condition (e.g., scores under the 45% criterionranged from approximately 98% to 100% correct). In
contrast, with the same blink criterion, the masker con-dition yielded intelligibility scores between 24% and
64% correct across participants, demonstrating thelarge variability in performance that exists within
this population (Figure 2, right panel). One-tailedmatched-pairs t tests confirmed that speech intelligibility
in the quiet condition was significantly higher than in themasker condition for all blink criteria (15%: t(8)¼ 10.75,p< .001; 30%: t(8)¼ 16.76, p< .001; 45%: t(8)¼ 16.96,
p< .001). This finding indicates that, regardless of theblink criterion used to reject trials, speech intelligibility
was more difficult in the 0 dB SNR masker conditionthan in the quiet condition.
Figure 3 shows individual and average maximumpupil dilation measured during the post-stimulus silent
period for each participant in the quiet and maskerconditions for the three blink criteria. We expected the
masker condition to be more difficult and therefore elicita larger maximum pupil dilation compared with the
quiet condition. One-tailed Wilcoxon signed-rank testsfound significant differences in pupil dilation across lis-tening conditions for all blink criteria, with the masker
condition resulting in larger maximum pupil dilationthan the quiet condition (15% criterion: z¼ –2.67,
p¼ .002; 30% criterion: z¼ –2.67, p¼ .002; 45% criteri-on: z¼ –2.67, p¼ .002). This result suggests that listeners
exerted more effort, or task engagement, in the 0 dBSNR masker condition than in quiet.
Figure 2. Speech Intelligibility Scores for the SSD Group Measured as Percent of Correctly Repeated Words in the Quiet Condition andthe 0 dB SNR Speech Masker Condition Using 15%, 30%, and 45% Blink Criteria. Data were transformed to RAUs for analysis. Blackdiamonds indicate means for each blink criterion, and small white circles represent individual participants. Group medians (MD) arerepresented in the box plot by the solid black line and denoted below each plot. Points have been horizontally jittered for visibility.Asterisks indicate the significance level of pairwise comparison results (* for p< .05, ** for p< .01, and *** for p< .001).RAU¼ rationalized arcsine unit; SNR¼ signal-to-noise ratio.
6 Trends in Hearing

Influence of Blink Criterion on Number of Trials Analyzed.
Table 2 contains the proportion of trials included foranalysis under each blink criterion in the quiet andmasker conditions. The least stringent blink criterion(45%) resulted in less than 10% of trials being discardedfor both the quiet and masker conditions, while themost stringent (15%) resulted in approximately 22% oftrials being discarded for the quiet condition and 27%for the masker condition. It should be noted that thedata violated the assumption of independence, as thesame participants were tested in the quiet and maskerconditions. A Pearson’s chi-squared test determined thatthere was no significant relationship between blink cri-terion and listening condition for the number of trialsanalyzed, v2(1)¼ 2.02, p¼ .169. This indicates that thenumber of included trials decreased similarly for bothlistening conditions as blink criterion stringencyincreased.
Relationship Between Percentage of Blinks and Condition. Thecurrent literature supports excluding pupil tracksthat have greater than 15% to 30% blinks or missing
samples (Winn et al., 2018; Zekveld & Kramer, 2014;Zekveld et al., 2011). However, because maximumpupil dilation was very similar for the three blinkcriteria and the significant difference between listeningconditions was present under all criteria, we opted to useonly the 45% criterion for this analysis because itallowed for the highest proportion of trials to beincluded (see Table 2). Figure 4 illustrates the averagepercentage of blinks for each participant in the quietversus masker condition. Previously observed relation-ships between task difficulty and blink rate led us topredict that the masker condition would elicit a higherblink rate and, consequently, a greater percentage ofblinks than the quiet condition. We found that thiswas the case for all but two participants (MBD,MBG; Figure 4). A two-tailed matched-pairs t testrevealed that the percentage of blinks was significantlyhigher in the masker condition compared with the quietcondition, t(8)¼ –2.73, p¼ .026. This indicates that therewas a direct relationship between percentage of blinksand task difficulty for the SSD listeners tested in thisstudy.
Figure 3. Maximum Pupil Dilation for the SSD Group Plotted as Proportion Change From Baseline Using 15%, 30%, and 45% Blink Criteria.Maximum dilation is calculated in the poststimulus silent period of the task (2,000ms window between stimulus offset and response prompt).Black diamonds indicate means for each blink criterion, and small black circles represent individual participants. Group medians (MD) arerepresented in the box plot by the solid black line and denoted below each plot. Points have been horizontally jittered for visibility. Asterisksindicate the significance level of pairwise comparison results (* for p< .05, ** for p< .01, and *** for p< .001).SNR¼ signal-to-noise ratio.
Table 2. Proportion of Trials Analyzed Under Each Blink Criterion in Quiet and Speech Masker Conditions for the SSD Group.
Blink criterion
Condition 15% Blink criterion 30% Blink criterion 45% Blink criterion
Quiet 0.78 0.90 0.94
0 dB SNR speech masker 0.73 0.89 0.93
Note. SNR¼ signal-to-noise ratio.
Burg et al. 7

Experiment 2: Listening Effort and Speech
Intelligibility in Participants With NH
Rationale
Experiment 1 examined whether a chosen blink criterionwould systematically influence the results of a speechintelligibility and pupillometry task in individuals withSSD. In line with our expectations, intelligibilityscores in the quiet condition were significantly better(Figure 2), and maximum pupil dilation was significantlysmaller (Figure 3) than in the masker condition. Thissuggests that the masker condition was more difficultand demanded more effort, or engagement, than thequiet condition. Importantly, these results were unaffect-ed by the level of blink criterion used to process the data.However, we did find that participants with SSD exhib-ited a significantly higher percentage of blinks in thespeech masker condition compared with the quiet con-dition. Due to the fact that Experiment 1 examined asmall sample size drawn from a unique listening popu-lation, we sought to perform a parallel analysis on alarger, more generalizable population, namely NH lis-teners. The data set from NH listeners had originallybeen collected as part of a larger, separate study thatsought to examine spatial unmasking and listeningeffort. Several of the conditions tested were identical tothose analyzed in Experiment 1, and the data were
collected using similar procedures and methods. One
noteworthy difference between the methods in the two
studies is that participants in the NH experiment were
asked to refrain from blinking during the presentation of
the stimulus in each trial. Therefore, we investigated the
effect of blink criterion on the results of a younger group
of NH listeners who were given explicit instructions not
to blink. The data were also compared with the SSD
data to enhance our understanding of the implications
of unilateral listening in complex acoustic environments.
Methods
All methods and procedures were identical to those used
in Experiment 1 unless otherwise specified.
Participants. Twenty participants were recruited from the
community; all passed a hearing screening (20 dB HL at
octave frequencies from 250 to 8000Hz). Testing took
place at the University of Wisconsin-Madison Waisman
Center over the duration of two sessions that were
scheduled at least one week apart. The age of partici-
pants ranged from 18 to 45 years (mean� SD¼ 21.90�6.17), and all were native English speakers. This study
was approved by the University of Wisconsin-Madison
Health Sciences Institutional Review Board.
Figure 4. Comparison Plot Showing the Percentage of Blinks for Each SSD Participant for the 0 dB SNR Speech Masker Condition as aFunction of the Quiet Condition. The dashed line denotes a line of equivalence. Values below this line indicate that the percentage ofblinks in the quiet condition was greater than in the speech masker condition. Points above this line indicate that the percentage of blinksin the speech masker condition was greater than in the quiet condition. SNR¼ signal-to-noise ratio.
8 Trends in Hearing

Stimuli. Target stimuli were drawn from the HarvardInstitute of Electrical and Electronics Engineers sentencecorpus (IEEE, 1969). After the start of the SSD study,our lab re-recorded many of our speech materials inorder to create a database with a large inventory ofhigh-quality stimuli. Therefore, the target sentences forthe NH study were recorded by a different male talkerthan stimuli used for Experiment 1. Masker stimuli (two-talker babble) consisted of AzBio sentences (Spahr et al.,2012) spoken by the same male talkers as in Experiment1. A computer with customized software written inMATLAB (The MathWorks, Natick, MA) was used todeliver stimuli and collect data.
Procedure. Participants were tested in three conditions:(a) quiet, where the target was presented from 0�
azimuth at 65 dB SPL-A, (b) with speech maskers,where the target and maskers were both presentedfrom 0� azimuth at an SNR of 0 dB, and (c) withspeech maskers, where the target and maskers wereboth presented from 0� azimuth at an SNR of –12 dB.The first two conditions were identical to those tested inExperiment 1. The third condition with a harder SNRwas included to analyze a wider range of performance inNH listeners. Prior to beginning the experiment on eachday of testing, participants completed a familiarizationprocedure in which they heard a minimum of 12 senten-ces with maskers. Stimuli for practice trials were ran-domly selected and then excluded from the test corpusto avoid any sentence repetitions.
For both the quiet and masker conditions, stimuliwere blocked into runs consisting of eight sentences.Each participant completed four runs per listeningcondition. The order of conditions was randomized foreach participant, and for each run, target stimuli wererandomly selected from the corpus without replacement.Maximum pupil dilation and percentage of correctlyrepeated words were analyzed for each condition.
Data Analysis. Akin to Experiment 1, the objective of thisstudy was to examine the effect of processing pupillometrydata with three different blink criteria: no more than 15%,30%, or 45% of trial samples missing from the track. Intotal, 5.2% of quiet trials, 3.9% of 0 SNR masker trials,and 0.5% of –12 SNRmasker trials were discarded due tothe types of contamination explained in the “Data analy-sis” section of Experiment 1. Bothmaximumpupil dilation(proportion change from baseline) and percentage of cor-rectly repeated words (transformed to RAUs) were calcu-lated for all included trials by means of the sameMATLAB analysis code used in Experiment 1.
Statistical Analysis. An alpha of .05 was used for all tests todetermine whether results were significantly differentfrom chance. For speech intelligibility, pupil dilation,and percentage of blinks data, Shapiro–Wilk normalitytests determined that one or more of the conditions werenot normally distributed. Consequently, Friedman’sanalysis of variance (ANOVA) tests were used to exam-ine these measures across conditions for each blink
Figure 5. Speech Intelligibility Scores for the NH Group Measured as Percent of Correctly Repeated Words in the Quiet Condition andthe Speech Masker Conditions Using 15%, 30%, and 45% Blink Criteria. Data were transformed to RAUs for analysis. Black diamondsindicate means for each blink criterion, and small white circles represent individual participants. Group medians (MD) are represented inthe box plot by the solid black line and denoted below each plot. Points have been horizontally jittered for visibility. Asterisks indicate thesignificance level of pairwise comparison results (* for p< .05, ** for p< .01, and *** for p< .001).RAU¼ rationalized arcsine unit; SNR¼ signal-to-noise ratio.
Burg et al. 9

criterion. Post hoc pairwise comparisons were completed
using one-tailed Wilcoxon signed-rank tests with
Bonferroni corrections for multiple comparisons. To
investigate a potential bias toward discarding a higher
number of difficult trials due to blinking, a Pearson’s
chi-squared test of independence was used to determine
whether the number of trials included for analysis under
the least stringent (45%) and most stringent (15%) cri-
teria was related to the condition (quiet vs. 0 SNR
speech masker vs. –12 SNR speech masker). Finally,
two-tailed independent-samples t tests for normally
distributed data or two-tailed Mann–Whitney U tests
for non-normally distributed data were used to compare
speech intelligibility, pupil dilation, and percentage of
blinks across the SSD and NH groups.
Results
Effect of Listening Condition on Speech Intelligibility and Pupil
Dilation. Figure 5 plots individual and average speech
intelligibility in the quiet and masker conditions for
each blink criterion. We expected performance to bebest in the quiet condition and worst in the –12 SNRmasker condition, with the 0 SNR masker conditionfalling in between. All participants exhibited near-ceiling-level performance in the quiet condition(median score under the 45% criterion¼ 116.50%;Figure 5, right panel). Performance was also high inthe 0 dB SNR speech masker condition, with themedian score under the 45% criterion equaling95.32%. In contrast, the –12 dB SNR speech maskercondition elicited much lower scores, with the medianequaling 37.32% (Figure 5, right panel). Friedman’sANOVAs indicated that speech intelligibility differedsignificantly across listening conditions for all blink cri-teria (45% criterion: v2(2)¼ 40.00, p< .001; 30% criteri-on: v2(2)¼ 40.00, p< .001; 15% criterion: v2(2)¼ 40.00,p< .001). Post hoc pairwise comparisons revealed thatspeech intelligibility in the quiet condition was signifi-cantly higher than the 0 SNR (45% criterion: z¼ –3.92,p< .001; 30% criterion: z¼ –3.92, p< .001; 15% criteri-on: z¼ –3.92, p< .001) and –12 SNR masker conditions
Figure 6. Maximum Pupil Dilation for the NH Group Plotted as Proportion Change From Baseline Using 15%, 30%, and 45% BlinkCriteria. Maximum dilation is calculated in the poststimulus silent period of the task (2,000ms window between stimulus offset andresponse prompt). Black diamonds indicate means for each blink criterion, and small black circles represent individual participants. Groupmedians (MD) are represented in the box plot by the solid black line and denoted below each plot. Points have been horizontally jitteredfor visibility. Asterisks indicate the significance level of pairwise comparison results (* for p< .05, ** for p< .01, and *** for p< .001).SNR¼ signal-to-noise ratio.
Table 3. Proportion of Trials Analyzed Under Each Blink Criterion in Quiet and Speech Masker Conditions for the NH Group.
Blink criterion
Condition 15% Blink criterion 30% Blink criterion 45% Blink criterion
Quiet 0.89 0.99 0.99
0 dB SNR speech masker 0.88 0.99 0.99
–12 dB SNR speech masker 0.89 0.99 1.00
Note. SNR¼ signal-to-noise ratio.
10 Trends in Hearing

(45% criterion: z¼ –3.92, p< .001; 30% criterion: z¼ –
3.92, p< .001; 15% criterion: z¼ –3.92, p< .001) and
that speech intelligibility in the 0 SNR masker condition
was significantly higher than the –12 SNR masker con-
dition (45% criterion: z¼ –3.92, p< .001; 30% criterion:
z¼ –3.92, p< .001; 15% criterion: z¼ –3.92, p< .001).
This indicates that speech intelligibility decreased as
the masker level was increased. Blink criteria did not
affect this result.Figure 6 shows maximum pupil dilation measured
during the post-stimulus silent period for each partici-
pant in the quiet and masker conditions as well as the
average for the three blink criteria. We expected pupil
dilation to be smallest in the quiet condition and highest
in the –12 SNR masker condition, with the 0 SNR
masker condition falling in between. Friedman’s
ANOVAs indicated that maximum pupil dilation dif-
fered significantly across conditions for all blink criteria
(45% criterion: v2(2)¼ 31.60, p< .001; 30% criterion:
v2(2)¼ 31.60, p< .001; 15% criterion: v2(2)¼ 27.90,
p< .001). Post hoc pairwise comparisons revealed that
maximum pupil dilation in the quiet condition was sig-
nificantly smaller than the 0 SNR (45% criterion: z¼ –
3.02, p¼ .002; 30% criterion: z¼ –2.99, p¼ .003; 15%
criterion: z¼ –3.17, p¼ .001) and –12 SNR masker con-
ditions (45% criterion: z¼ –3.92, p< .001; 30% criteri-
on: z¼ –3.92, p< .001; 15% criterion: z¼ –3.92,
p< .001) and that pupil dilation in the 0 SNR masker
condition was significantly smaller than the –12 SNR
masker condition (45%: z¼ –3.92, p< .001; 30%: z¼ –
3.92, p< .001; 15%: z¼ –3.36, p< .001). This indicates
that effort or engagement increased with increasing dif-
ficulty of the listening condition. This finding was pre-
sent across all blink criteria.
Influence of Blink Criterion on Number of Trials Analyzed.
Table 3 contains the proportion of trials included for
analysis under each blink criterion in the quiet and
speech masker conditions. The least stringent blink
criterion (45%) resulted in less than 1% of trials being
discarded for the quiet and both masker conditions,
while the most stringent blink criterion (15%) resulted
in approximately 11% of trials being discarded for all
three conditions. A Pearson’s chi-squared test deter-
mined that there was no significant relationship between
blink criterion and listening condition for the number of
trials analyzed, v2(2)¼ 0.34, p¼ .849. Consistent with
the SSD group results, this indicates that the change
in number of trials analyzed across blink criteria was
similar between the quiet and masker conditions for
the NH listeners.
Relationship Between Percentage of Blinks and Listening
Condition. A Friedman’s ANOVA determined that the
total percentage of blinks under the 45% blink criterion
did not significantly differ by listening condition, v2(2)¼0.70, p¼ .773, unlike results in Experiment 1.
Comparison of SSD and NH Data: Quiet and 0 SNR Speech
Masker Conditions. Blink criteria did not influence the
results of either experiment, therefore between-group
comparisons were conducted using the most lenient
Figure 7. Comparison of SSD and NH groups. A: The difference in speech intelligibility scores (transformed to RAUs) betweenconditions for the SSD and NH groups under the 45% blink criterion. B: The difference in maximum pupil dilation between conditions forthe SSD and NH groups under the 45% blink criterion. The differences were calculated as the 0 SNR masker condition minus the quietcondition. Black diamonds indicate means for each group, and small white circles represent individual participants. Group medians (MDs)are represented in the box plots by the solid black line and denoted below each plot. Points have been horizontally jittered for visibility.Asterisks indicate the significance level of the across-group comparison (* for p< .05, ** for p< .01, and *** for p< .001).RAU¼ rationalized arcsine unit; SNR¼ signal-to-noise ratio; NH¼ normal hearing; SSD¼ single-sided deafness.
Burg et al. 11

blink criterion (45%). Because SSD participants were
not tested in the –12 SNR condition, between-group
comparisons included only the quiet and 0 SNRmasker conditions. While speech intelligibility was sim-
ilar across groups in the quiet condition (SSD mean
¼ 112.37%� 2.12, NH mean¼ 115.31%� 4.90), perfor-mance diverged in the speech masker condition, with the
SSD group averaging 49.20%� 11.42 and the NH group
averaging 95.92%� 5.85. To evaluate the effect of noise
on speech intelligibility and listening effort in NH andSSD listeners, the differences between the quiet and 0
SNR speech masker condition were compared across
groups for both measures (Figure 7). We predicted the
SSD group to be more negatively impacted by the noisemaskers than the NH group due to their inability to
access binaural benefits and consequently to also show
a larger increase in pupil dilation across conditions com-
pared with the NH group. On average, the NH group’sintelligibility decreased by 19.39% when speech maskers
were added, while the SSD group’s intelligibility
decreased by an average of 63.17% (Figure 7A). Atwo-tailed independent-samples t test confirmed that
the SSD group’s intelligibility decreased significantly
more than the NH group’s from the quiet to speech
masker condition (t(27)¼ –13.16, p< .001). This indicatesthat the SSD group’s speech intelligibility performance was
much more negatively impacted by the addition of speech
maskers compared with the NH group. The changes in
maximum pupil dilation (Figure 7B) from the quiet tospeech masker condition, on the other hand, were not sig-
nificantly different between the SSD and NH group
(Mann–Whitney U test: z(n1¼ 9, n2¼ 20)¼ 1.74,
p¼ .085). However, it should be noted that, in themasker versus quiet conditions, the SSD group exhibited
a larger increase in pupil dilation than the NH group (SSD
median difference¼ 0.17; NH median difference¼ 0.08).Finally, the percentages of blinks in the quiet and 0
SNR masker conditions were compared across groups.
We expected to see differences across groups due to the
discrepancy in blink instruction for each experiment(SSD participants were given no instruction regarding
blinking; NH participants were instructed to avoid
blinking during each trial). The SSD group median per-
centages were 7.16% in the quiet condition and 8.52% inthe masker condition, while the NH group medians were
4.65% blinks in the quiet condition and 4.72% in the
masker condition, demonstrating that the percentage of
blinks for NH group was less than for the SSD group.Percentage of blinks was compared across groups for
each condition separately. Two-tailed Mann–Whitney
U tests found the difference in percentage of blinksacross groups to be nonsignificant for either condition
(Quiet: z(n1¼ 9, n2¼ 20)¼ –1.27, p¼ .216; 0 SNR speech
masker: z(n1¼ 9, n2¼ 20)¼ –1.89, p¼ .062).
Discussion
Pupillometry has become an increasingly popularmethod for capturing changes in mental effort overtime and is especially well suited for populations withassistive devices made of ferrous material that areincompatible with other objective methods such as func-tional magnetic resonance imaging and electroencepha-lography (Friesen & Picton, 2010; Gilley et al., 2006;Wagner et al., 2019). However, many methods for clean-ing and analyzing pupillary data have yet to be empiri-cally investigated. The first aim of this study was toinvestigate the effect of a common exclusion criterion,percentage of blinks, on speech intelligibility and maxi-mum pupil dilation in individuals with SSD and withNH. Participants were tested in quiet and with speechmaskers. We chose to examine this particular trial exclu-sion criterion because blinking has been related to taskdifficulty and is a major determinant for excluding pupiltracks from analysis in the pupillometry literature. Thesecond aim was to compare performance and listeningeffort between the SSD group and NH group. Due to theseverity of hearing loss in one ear, individuals with SSDhave restricted access to spatial cues, often reportingfatigue and effortful listening (Alhanbali et al., 2017;Dillon et al., 2018; Grantham et al., 2012; Litovskyet al., 2019; Tavora-Vieira et al., 2019). Examining lis-tening effort in this population enhances our under-standing of the compensatory mechanisms thatindividuals with hearing loss employ to successfullyfunction in everyday, complex listening situations.
For both the SSD and NH group, we found signifi-cant differences in speech intelligibility and maximumpupil dilation in the quiet condition compared to con-ditions with a speech masker. In line with our expect-ations, intelligibility in the quiet condition wassignificantly bettern line with our expectations, intelligi-bility in the quiet condition was significantly better(Figures 2 and 5) and maximum pupil dilation was sig-nificantly smaller (Figures 3 and 6) compared with the 0SNR masker condition. This suggests that masker con-ditions were more difficult and demanded more effort orengagement than the quiet condition for both groups.For the NH group, this trend was maintained for the–12 SNR masker condition, in which listeners demon-strated significantly poorer speech intelligibility scoresand greater pupil dilation compared with the 0 SNRmasker condition. These findings did not change basedon the level of blink criterion used to process the data.
We examined the total percentage of blinks in boththe quiet and speech masker conditions to investigate apotential relationship between spontaneous blinking andtask difficulty in our study. We found that the maskercondition elicited a significantly higher percentage ofblinks compared with the quiet condition for the SSD
12 Trends in Hearing

listeners (Figure 4). This observation is consistent withprevious studies that have demonstrated a significantpositive relationship between blink rate and task diffi-culty (e.g., Recarte et al., 2019). The present study alsoexamined the proportion of trials analyzed under threeblink criteria and found that the quiet and maskerconditions were similar under the 45% criterion (93%and 94% included for analysis, respectively) and beganto diverge under the more stringent 15% criterion (78%and 73% included for analysis, respectively; Table 2).This trend did not reach significance, but when consid-ered in tandem with the significant relationship betweenblink percentage and condition, it may suggest that astringent criterion such as 15% could result in a higherproportion of trials being discarded from analysis indifficult conditions. This effect also has the potentialto manifest within a condition, with a stringent blinkcriterion resulting in the exclusion of trials that weremore difficult (and had higher pupil dilation), therebyunderestimating pupil dilation for the condition andconsequently, listening effort or engagement. This didnot appear to be the case for our study because pupildilation for a given condition appeared to be similaracross all blink criteria (Figure 3). In contrast, we didnot observe similar trends regarding percentage of blinksin each condition or proportion of trials analyzed undereach criterion for the NH data. A Freidman’s ANOVArevealed that the total percentage of blinks did not differbetween conditions, nor was there a difference in pro-portion of trials kept between conditions under any ofthe blink criteria. However, these results must be inter-preted with caution because of the explicit instructionsgiven to NH listeners to refrain from blinking duringeach trial.
To examine differences between the SSD and NHgroups, we compared changes in performance from thequiet to 0 SNR masker condition across groups. Due tothe well-established benefits that result from access tobinaural hearing in noisy environments (e.g., Hawleyet al., 2004; Litovsky et al., 2009; Moore, 2003) weexpected SSD listeners to be more negatively impactedby the addition of a speech masker than the NH listen-ers. Our findings confirmed this expectation, with bothgroups scoring similarly in the quiet condition, but theNH listeners scoring an average of 47% better than theSSD listeners in the speech masker condition (Figure 7).This effect has been shown in previous studies as well.Rothpletz et al. (2012) compared speech receptionthresholds of individuals with NH to those with unilat-eral hearing loss in both a monaural headphonecondition and in a colocated free-field condition usingthe Coordinate Response Measure corpus for both thetarget and masker stimuli. Their results revealed no dif-ference in performance between the groups on themonaural headphone task. However, when tested in
the colocated free-field condition, individuals with uni-lateral hearing loss performed significantly worse thanthose with NH, with a difference of about 4.5 dBbetween thresholds for each group. The results shownby the Rothpletz et al. (2012) study as well as the currentstudy were obtained in colocated target and masker con-ditions, which lack interaural differences that could beused to separate the two auditory streams. However, inthis situation, listeners with two ears do have access to abinaural advantage known as binaural redundancy, orthe benefit that listeners receive by having duplicatecopies of a signal in the two ears. Binaural redundancyhas been shown to result in improved speech intelligibil-ity in noise and increased perceptual loudness (Hawleyet al., 2004; Litovsky et al., 2009). Individuals with SSDmay be at a disadvantage because they are unable toaccess these benefits.
In addition to speech intelligibility, we also examinedchanges in pupil dilation from the quiet to the speechmasker condition across groups. Compared with NHlisteners, SSD listeners demonstrated a greater decreasein performance from the quiet condition to the speechmasker condition. Thus, we expected SSD listenersto exhibit a greater change in pupil dilation betweenconditions than the NH listeners. While our resultswere consistent with the expected trend, the differencebetween groups was not significant (p¼ .085). Onepossible explanation is the large age discrepancy betweenlisteners in the SSD and NH groups (SSD mean�SD¼ 52.22� 14.12; NH mean�SD¼ 21.90� 6.17).Previous studies have found interactions betweenaging, hearing loss, and pupillary responses. Krameret al. (2016) reported that the difference in pupil dilationbetween quiet and SRT50% conditions was smaller forhearing-impaired listeners than NH listeners. Hearing-impaired listeners had similar pupil dilation to NHlisteners in the quiet condition, but significantly smallerpupil dilation in the SRT50% condition, despite the factthat they rated the SRT50% condition as more effortfulthan the NH listeners. Comparable results were alsoreported by Zekveld et al. (2011). Effects similar tothese may have contributed to the lack of significantdifference in pupil dilation change between the twogroups in our study. Zekveld et al. (2011) found thatmiddle-aged listeners demonstrated relatively smallpeak pupil dilations at difficult SNRs and relativelylong pupil responses, compared with younger listeners.They proposed that middle-aged listeners do not encodeand process speech as deeply as younger individuals (i.e.,there is less memory and semantic encoding) and that“aging is associated with increased speech processingtime” (Zekveld et al., 2011, p. 507). These concepts aresupported by numerous studies that have demonstratedage-related decline in cognitive functions, includingworking memory (e.g., Gordon-Salant & Fitzgibbons,
Burg et al. 13

1997; for review, see Salthouse, 2010), and compensatorymechanisms to overcome these deficits, including anupregulation of “nontraditional language-related”brain regions and prolonged activation during languageprocessing (Wingfield & Grossman, 2006, p. 2837). Inaddition, Piquado et al. (2010) proposed a potentialage-related change in pupil reactivity, where the pupilbecomes less responsive as individuals get older. Basedon these explanations, had we tested a NH group thatwas more similar in age to the SSD group, it is possiblewe may have seen a larger effect of group on the changein pupil dilation from quiet to speech masker conditions.Another explanation may be the large variability of theNH group compared to the SSD group, which is likelydue to the aforementioned effects of aging and hearingloss on the pupil response. The group contained onestrong outlier with a value that was greater than 2.5times the interquartile range. To ensure that the outlierwas not affecting the results of the statistical test, theoutlier was removed and replaced by a value that wasthe mean plus two SDs (mean¼ 0.08, SD¼ 0.09; Field,2013, p. 153); however, this transformation did notchange the test statistic.
Implications for Pupillometry Data Analysis
Blink criterion stringency did not affect speech intelligi-bility or pupil dilation results for the SSD or NH group.However, we found a significant difference in the totalpercentage of blinks in the quiet versus speech maskerconditions for the SSD group, but not for the NH group.In the present study, we were not able to deduce whetherthis was due to the lack of blink instruction given to theSSD group, participant demographics (e.g., age andhearing ability) of the SSD group, or a combination ofthe two. In addition, our findings are limited by oursmall sample size. The discrepancy in results and differ-ence in instructions across groups makes it difficult toconclude what should be done regarding blink exclusioncriteria. Based on the findings of the SSD group analy-sis, a conservative recommendation may be to use amore lenient blink criterion (e.g., 30% to 45%) to pro-mote data retention and avoid inadvertently skewingresults, which may conceal important informationabout task difficulty. However, this recommendationmay not hold for studies using a different trial structureor shorter stimuli than those presented in this study. Inaddition, it is imperative that an experimenter visuallyinspect individual pupil tracks, especially when using amore lenient blink criterion. Tracks that contain a largesection of missing data in an important section of thepupil track (e.g., during the wait period from which max-imum pupil dilation is extracted) should be discarded, asthe interpolation may flatten the peak of the pupilresponse. Furthermore, while we cannot say for certain
whether the higher percentage of blinks for SSD listenerscompared with NH listeners was entirely due to the dif-ference in blink instruction, experimenters should givecareful thought to the instructions they give, as askingparticipants to refrain from blinking can improve dataquality but may also impose an additional attention-demanding task on participants (Berman et al., 2012).Further research is needed to better understand theserelationships, but the present study demonstrates thatblink criterion stringency deserves careful considerationin future experiments using pupillometry to gauge listen-ing effort.
Limitations
It is promising that the results of our experiment werenot affected by the level of blink criteria used to analyzethe data; however, these conclusions are limited by oursmall sample sizes and differing instructions betweenExperiment 1 and Experiment 2. Other analytical tech-niques that make use of curve fitting (e.g., growth curveanalysis, generalized additive [mixed] models) could beeven more robust to different criterion levels, as they donot depend on the integrity of a single data point.Further, in the present study, only a small portion ofthe entire pupil track was analyzed to determine maxi-mum pupil dilation (i.e., silent period). Due to thechanging task demands throughout the course of thetrial (e.g., listening, processing, and responding), partic-ipants’ blink rate likely varies systematically within atrial. It is conceivable that other portions of the trialmay have been more affected by spontaneous blinksrelated to task difficulty. Therefore, these results areonly generalizable to experiments with trial structuresand analysis windows similar to those used in thisstudy. Finally, it is also possible that results from sucha unique population may not be generalizable to indi-viduals with other types and/or degrees of hearing loss,or to individuals with devices such as hearing aids orcochlear implants, as all of these factors contribute topatient performance and processing demands.
Summary
In conclusion, the present study revealed that speechintelligibility was better and maximum pupil dilationwas smaller in quiet listening conditions comparedwith noisy conditions in individuals with SSD and withNH. A systematic analysis of blink exclusion criteriashowed that varying criterion stringency did not alterthe effects observed across quiet and speech masker con-ditions for speech intelligibility or maximum pupil dila-tion for either group. Nevertheless, we did find asignificantly higher percentage of blinks in the maskercondition relative to the quiet condition in the SSD
14 Trends in Hearing
group, suggesting that blink criterion stringency should
be carefully considered in studies using pupillometry to
measure listening effort.
Authors’ Note
Portions of this work were presented at the 2019 Conference on
Implantable Auditory Prostheses, Lake Tahoe, CA, July 2019.
The authors would like to thank Shelly P. Godar and Ellen
Snodgrass for help with recruitment and data collection, and
members of the Binaural Hearing and Speech Lab for assis-
tance with data collection.
The identification of specific products or scientific instrumen-
tation is considered an integral part of the scientific endeavor
and does not constitute endorsement or implied endorsement
on the part of the author, DoD, or any component agency. The
views expressed in this article are those of the author and do
not reflect the official policy of the Department of Army/Navy/
Air Force, Department of Defense, or U.S. Government.ClinicalTrials.gov: https://clinicaltrials.gov/show/NCT02532972
Declaration of Conflicting Interests
The authors declared no potential conflicts of interest with respect
to the research, authorship, and/or publication of this article.
Funding
The authors disclosed receipt of the following financial support
for the research, authorship, and/or publication of this article:
This research was supported by NIH-NIDCD Grant No.
R01DC003083 (to R. Y. L.), NIH-NICHD Grant No.
U54HD090256 (to Waisman Center), and by funds provided
by the University of Wisconsin-Madison Department of
Surgery to J. R.
ORCID iD
Ruth Y. Litovsky https://orcid.org/0000-0002-6221-937X
Note
1. In addition to divisive baseline correction, data were also
analyzed using subtractive baseline correction (corrected
pupil dilation¼ pupil dilation – baseline value). The base-
line correction method did not change our results.
References
Alhanbali, S., Dawes, P., Lloyd, S., & Munro, K. J. (2017).
Self-reported listening-related effort and fatigue in hearing-
impaired adults. Ear and Hearing, 38(1), e39–e48. https://
doi.org/10.1097/AUD.0000000000000361Alhanbali, S., Dawes, P., Millman, R. E., & Munro, K. J.
(2019). Measures of listening effort are multidimensional.
Ear and Hearing, 40(5), 1084–1097. https://doi.org/10.
1097/AUD.0000000000000697Arndt, S., Aschendorff, A., Laszig, R., Beck, R., Schild, C.,
Kroeger, S., Ihorst, G., & Wesarg, T. (2011). Comparison
of pseudobinaural hearing to real binaural hearing
rehabilitation after cochlear implantation in patients with
unilateral deafness and tinnitus. Otology and Neurotology,
32(1), 39–47. https://doi.org/10.1097/MAO.
0b013e3181fcf271Aston-Jones, G., & Cohen, J. D. (2005). An integrative theory
of locus coeruleus-norepinephrine function: Adaptive gain
and optimal performance. Annual Review of Neuroscience,
28, 403–450. https://doi.org/10.1146/annurev.neuro.28.
061604.135709Berman, B. D., Horovitz, S. G., Morel, B., & Hallett, M.
(2012). Neural correlates of blink suppression and the build-
up of a natural bodily urge. NeuroImage, 59(2), 1441–1450.
https://doi.org/10.1016/j.neuroimage.2011.08.050Bernstein, J. G.W., Goupell,M. J., Schuchman, G. I., Rivera, A.
L., & Brungart, D. S. (2016). Having two ears facilitates the
perceptual separation of concurrent talkers for bilateral and
single-sided deaf cochlear implantees. Ear and Hearing, 37(3),
289–302. https://doi.org/10.1097/AUD.0000000000000284Buechner, A., Brendel, M., Lesinski-Schiedat, A., Wenzel, G.,
Frohne-Buechner, C., Jaeger, B., & Lenarz, T. (2010).
Cochlear implantation in unilateral deaf subjects associated
with ipsilateral tinnitus. Otology and Neurotology, 31(9),
1381–1385. https://doi.org/10.1097/MAO.0b013e3181e3d353Cruz, A. A. V., Garcia, D. M., Pinto, C. T., & Cechetti, S. P.
(2011). Spontaneous eyeblink activity. Ocular Surface, 9,
29–41. https://doi.org/10.1016/S1542-0124(11)70007-6Dillon, M. T., Buss, E., Rooth, M. A., King, E. R., Deres, E. J.,
Buchman, C. A., Pillsbury, H. C., & Brown, K. D. (2018).
Effect of Cochlear implantation on quality of life in adults
with unilateral hearing loss. Audiology and Neurotology,
22(4–5), 259–271. https://doi.org/10.1159/000484079Edwards, B. (2007). The future of hearing aid technology.
Trends in Amplification, 11(1), 31–45. https://doi.org/10.
1177/1084713806298004Field, A. (2013). Exploring assumptions. In Discovering statis-
tics using IBM SPSS statistics. (3rd ed., p. 153). Sage.
Firszt, J. B., Holden, L. K., Reeder, R. M., Waltzman, S. B., &
Arndt, S. (2012). Auditory abilities after cochlear implanta-
tion in adults with unilateral deafness: a pilot study.
Otology & Neurotology : Official Publication of the
American Otological Society, American Neurotology
Society [and] European Academy of Otology and
Neurotology, 33(8), 1339–1346. https://doi.org/10.1097/
MAO.0b013e318268d52dFriesen, L. M., & Picton, T. W. (2010). A method for removing
cochlear implant artifact. Hearing Research, 259(1–2),
95–106. https://doi.org/10.1016/j.heares.2009.10.012Gartrell, B. C., Jones, H. G., Kan, A., Buhr-Lawler, M.,
Gubbels, S. P., & Litovsky, R. Y. (2014). Investigating
long-term effects of cochlear implantation in single-sided
deafness: A best practice model for longitudinal assessment
of spatial hearing abilities and tinnitus handicap. Otology
and Neurotology, 35(9), 1525–1532. https://doi.org/10.1097/
MAO.0000000000000437Gilley, P. M., Sharma, A., Dorman, M., Finley, C. C., Panch,
A. S., & Martin, K. (2006). Minimization of cochlear
implant stimulus artifact in cortical auditory evoked poten-
tials. Clinical Neurophysiology, 117(8), 1772–1782. https://
doi.org/10.1016/j.clinph.2006.04.018
Burg et al. 15

Gordon-Salant, S., & Fitzgibbons, P. J. (1997). Selected cog-
nitive factors and speech recognition performance. Journal
of Speech, Language, and Hearing Research, 40(2), 423–431.
https://doi.org/10.1044/jslhr.4002.423Grantham, D. W., Ashmead, D. H., Haynes, D. S., Hornsby,
B. W. Y., Labadie, R. F., & Ricketts, T. A. (2012).
Horizontal plane localization in single-sided deaf adults
fitted with a bone-anchored hearing aid (Baha). Ear and
Hearing, 33(5), 595–603. https://doi.org/10.1097/AUD.
0b013e3182503e5eH€ark€onen, K., Kivek€as, I., Rautiainen, M., Kotti, V., Sivonen,
V., & Vasama, J. P. (2015). Single-sided deafness: The effect
of Cochlear implantation on quality of life, quality of hear-
ing, and working performance. Orl, 77(6), 339–345. https://
doi.org/10.1159/000439176Hawley, M. L., Litovsky, R. Y., & Culling, J. F. (2004). The
benefit of binaural hearing in a cocktail party: Effect of
location and type of interferer. The Journal of the
Acoustical Society of America, 115(2), 833–843. https://
doi.org/10.1121/1.1639908Holland, M. K., & Tarlow, G. (1972). Blinking and mental
load. Psychological Reports, 31(1), 119–127. https://doi.
org/10.2466/pr0.1972.31.1.119Holland, M. K., & Tarlow, G. (1975). Blinking and thinking.
Perceptual and Motor Skills, 41(2), 503–506. https://doi.org/
10.2466/pms.1975.41.2.403Hughes, S. E., Hutchings, H. A., Rapport, F. L., McMahon, C.
M., & Boisvert, I. (2018). Social connectedness and perceived
listening effort in adult cochlear implant users: A grounded
theory to establish content validity for a new patient-
reported outcome measure. Ear and Hearing, 39(5),
922–934. https://doi.org/10.1097/AUD.0000000000000553IEEE Recommended Practice for Speech Quality
Measurements. (1969). IEEE Transactions on Audio and
Electroacoustics, 17(3), 225–246. https://doi.org/10.1109/
TAU.1969.1162058Koelewijn, T., Zekveld, A. A., Festen, J. M., & Kramer, S. E.
(2012). Pupil dilation uncovers extra listening effort in the
presence of a single-talker masker. Ear and Hearing, 33(2),
291–300. https://doi.org/10.1097/AUD.0b013e3182310019Kramer, S. E., Teunissen, C. E., & Zekveld, A. A. (2016).
Cortisol, chromogranin A, and pupillary responses evoked
by speech recognition tasks in normally hearing and hard-
of-hearing listeners: A pilot study. Ear and Hearing, 37,
126S–135S. https://doi.org/10.1097/AUD.0000000000000311Litovsky, R. Y., Moua, K., Godar, S., Kan, A., Misurelli, S.
M., & Lee, D. J. (2019). Restoration of spatial hearing in
adult cochlear implant users with single-sided deafness.
Hearing Research, 372, 69–79. https://doi.org/10.1016/j.
heares.2018.04.004Litovsky, R. Y., Parkinson, A., & Arcaroli, J. (2009). Spatial
hearing and speech intelligibility in bilateral cochlear
implant users. Ear and Hearing, 30(4), 419–431. https://
doi.org/10.1097/AUD.0b013e3181a165beMcGarrigle, R., Munro, K. J., Dawes, P., Stewart, A. J.,
Moore, D. R., Barry, J. G., & Amitay, S. (2014).
Listening effort and fatigue: What exactly are we measur-
ing? A British Society of Audiology Cognition in Hearing
Special Interest Group “white paper.” International Journal
of Audiology, 53, 433–445. https://doi.org/10.3109/
14992027.2014.890296Mertens, G., De Bodt, M., & Van de Heyning, P. (2016).
Cochlear implantation as a long-term treatment for ipsilat-
eral incapacitating tinnitus in subjects with unilateral hear-
ing loss up to 10 years. Hearing Research, 331, 1–6. https://
doi.org/10.1016/j.heares.2015.09.016Moore, B. C. J. (2003). An introduction to the psychology of
hearing. Boston Academic Press. https://doi.org/10.1016/j.
tins.2007.05.005Ohlenforst, B., Zekveld, A. A., Lunner, T., Wendt, D., Naylor,
G., Wang, Y., Versfeld, N. J., & Kramer, S. E. (2017).
Impact of stimulus-related factors and hearing impairment
on listening effort as indicated by pupil dilation. Hearing
Research, 351, 68–79. https://doi.org/10.1016/j.heares.2017.
05.012Pichora-Fuller, M. K., Kramer, S. E., Eckert, M. A., Edwards,
B., Hornsby, B. W. Y., Humes, L. E., Lemke, U., Lunner,
T., Matthen, M., Mackersie, C. L., Naylor, G., Phillips, N.,
Richter, M., Rudner, M., Sommers, M. S., Tremblay, K. L.,
& Wingfield, A. (2016). Hearing impairment and cognitive
energy: The framework for understanding effortful listening
(FUEL). Ear and Hearing, 37, 5S–27S. https://doi.org/10.
1097/AUD.0000000000000312Piquado, T., Isaacowitz, D., & Wingfield, A. (2010).
Pupillometry as a measure of cognitive effort in younger
and older adults. Psychophysiology, 47(3), 560–569.
https://doi.org/10.1111/j.1469-8986.2009.00947.xPrivitera, C. M., Renninger, L. W., Carney, T., Klein, S., &
Aguilar, M. (2010). Pupil dilation during visual target detec-
tion. Journal of Vision, 10(10). https://doi.org/10.1167/10.10.3Recarte, M. �A., P�erez, E., Conchillo, �A., & Nunes, L. M.
(2019). Mental workload and visual impairment:
Differences between pupil, blink, and subjective rating.
The Spanish Journal of Psychology Copyright, 11(2),
374–385. https://doi.org/10.1017/S1138741600004406Rothpletz, A. M., Wightman, F. L., & Kistler, D. J. (2012).
Informational masking and spatial hearing in listeners with
and without unilateral hearing loss. Journal of Speech,
Language, and Hearing Research, 55(2), 511–531. https://
doi.org/10.1044/1092-4388(2011/10-0205)Salthouse, T. A. (2010). Selective review of cognitive aging.
Journal of the International Neuropsychological Society, 16,
754–760. https://doi.org/10.1017/S1355617710000706Spahr, A. J., Dorman, M. F., Litvak, L. M., Van Wie, S.,
Gifford, R. H., Loizou, P. C., Loiselle, L. M., Oakes, T.,
& Cook, S. (2012). Development and validation of the azbio
sentence lists. Ear and Hearing, 33(1), 112–117. https://doi.
org/10.1097/AUD.0b013e31822c2549Stephens, D., & H�etu, R. (1991). Impairment, disability and
handicap in audiology: Towards a consensus. International
Journal of Audiology, 30, 185–200. https://doi.org/10.3109/
00206099109072885Stern, J. A., Walrath, L. C., & Goldstein, R. (1984). The
endogenous eyeblink. Psychophysiology, 21(1), 22–33.
https://doi.org/10.1111/j.1469-8986.1984.tb02312.x
Studebaker, G. A. (1985). A “rationalized” arcsine transform.
Journal of Speech and Hearing Research, 28(3), 455–462.
https://doi.org/10.1044/jshr.2803.455
16 Trends in Hearing
Tanaka, Y., & Yamaoka, K. (1993). Blink activity and task
difficulty. Perceptual and Motor Skills, 77(1), 55–66. https://
doi.org/10.2466/pms.1993.77.1.55Tavora-Vieira, D., Marino, R., Krishnaswamy, J.,
Kuthbutheen, J., & Rajan, G. P. (2013). Cochlear implan-
tation for unilateral deafness with and without tinnitus: A
case series. Laryngoscope, 123(5), 1251–1255. https://doi.
org/10.1002/lary.23764Tavora-Vieira, D., Rajan, G. P., Van De Heyning, P., &
Mertens, G. (2019). Evaluating the Long-Term Hearing
Outcomes of Cochlear Implant Users with Single-Sided
Deafness. Otology and Neurotology, 40(6), E575–E580.
https://doi.org/10.1097/MAO.0000000000002235Vermeire, K., & Van De Heyning, P. (2009). Binaural hearing
after cochlear implantation in subjects with unilateral sen-
sorineural deafness and tinnitus. Audiology and
Neurotology, 14(3), 163–171. https://doi.org/10.1159/
000171478Wagner, A. E., Nagels, L., Toffanin, P., Opie, J. M., &
Baskent, D. (2019). Individual variations in effort:
Assessing pupillometry for the hearing impaired. Trends in
Hearing, 23. https://doi.org/10.1177/2331216519845596Wingfield, A., & Grossman, M. (2006). Language and the
aging brain: Patterns of neural compensation revealed by
functional brain imaging. Journal of Neurophysiology, 96,
2830–2839. https://doi.org/10.1152/jn.00628.2006Winn, M. B., Edwards, J. R., & Litovsky, R. Y. (2015). The
impact of auditory spectral resolution on listening effort
revealed by pupil dilation. Ear and Hearing, 36(4), e153-
65. https://doi.org/10.1097/AUD.0000000000000145Winn, M. B., Wendt, D., Koelewijn, T., & Kuchinsky, S. E.
(2018). Best practices and advice for using pupillometry to
measure listening effort: An introduction for those who
want to get started. Trends in Hearing, 22. https://doi.org/10.1177/2331216518800869
Wood, J. G., & Hassett, J. (1983). Eyeblinking during problemsolving: The effect of problem difficulty and internally vsexternally directed attention. Psychophysiology, 20(1),18–20. https://doi.org/10.1111/j.1469-8986.1983.tb00893.x
Zeitler, D. M., Dorman, M. F., Natale, S. J., Loiselle, L., Yost,W. A., & Gifford, R. H. (2015). Sound source localizationand speech understanding in complex listening environ-ments by single-sided deaf listeners after cochlear implanta-tion. Otology and Neurotology, 36(9), 1467–1471. https://doi.org/10.1097/MAO.0000000000000841
Zekveld, A. A., Koelewijn, T., & Kramer, S. E. (2018). ThePupil Dilation Response to Auditory Stimuli: Current Stateof Knowledge. Trends in Hearing, 22. https://doi.org/10.1177/2331216518777174
Zekveld, A. A., & Kramer, S. E. (2014). Cognitive processingload across a wide range of listening conditions: Insightsfrom pupillometry. Psychophysiology, 51(3), 277–284.https://doi.org/10.1111/psyp.12151
Zekveld, A. A., Kramer, S. E., & Festen, J. M. (2010). Pupilresponse as an indication of effortful listening: The influ-
ence of sentence intelligibility. Ear and Hearing, 31(4),480–490. https://doi.org/10.1097/AUD.0b013e3181d4f251
Zekveld, A. A., Kramer, S. E., & Festen, J. M. (2011).Cognitive load during speech perception in noise: The influ-ence of age, hearing loss, and cognition on the pupilresponse. Ear and Hearing, 32, 498–510. https://doi.org/10.1097/AUD.0b013e31820512bb
Zheng, B., Jiang, X., Tien, G., Meneghetti, A., Panton, O. N.M., & Atkins, M. S. (2012). Workload assessment of sur-geons: Correlation between NASA TLX and blinks.Surgical Endoscopy, 26(10), 2746–2750. https://doi.org/10.1007/s00464-012-2268-6
Burg et al. 17