Systematic Approach to Evaluate Potential Park and Ride ...
123
University of Texas at El Paso DigitalCommons@UTEP Open Access eses & Dissertations 2012-01-01 Systematic Approach to Evaluate Potential Park and Ride Facilities Lorenzo Emanuel Cornejo University of Texas at El Paso, [email protected] Follow this and additional works at: hps://digitalcommons.utep.edu/open_etd Part of the Civil Engineering Commons , and the Transportation Commons is is brought to you for free and open access by DigitalCommons@UTEP. It has been accepted for inclusion in Open Access eses & Dissertations by an authorized administrator of DigitalCommons@UTEP. For more information, please contact [email protected]. Recommended Citation Cornejo, Lorenzo Emanuel, "Systematic Approach to Evaluate Potential Park and Ride Facilities" (2012). Open Access eses & Dissertations. 2064. hps://digitalcommons.utep.edu/open_etd/2064
Transcript of Systematic Approach to Evaluate Potential Park and Ride ...
University of Texas at El PasoDigitalCommons@UTEP
Open Access Theses & Dissertations
2012-01-01
Systematic Approach to Evaluate Potential Park andRide FacilitiesLorenzo Emanuel CornejoUniversity of Texas at El Paso, [email protected]
Follow this and additional works at: https://digitalcommons.utep.edu/open_etdPart of the Civil Engineering Commons, and the Transportation Commons
This is brought to you for free and open access by DigitalCommons@UTEP. It has been accepted for inclusion in Open Access Theses & Dissertationsby an authorized administrator of DigitalCommons@UTEP. For more information, please contact [email protected].
Recommended CitationCornejo, Lorenzo Emanuel, "Systematic Approach to Evaluate Potential Park and Ride Facilities" (2012). Open Access Theses &Dissertations. 2064.https://digitalcommons.utep.edu/open_etd/2064

SYSTEMATIC APPROACH TO EVALUATE POTENTIAL
PARK AND RIDE FACILITIES
LORENZO EMANUEL CORNEJO HEREDIA
Department of Civil Engineering
APPROVED:
Ruey Long Cheu, Ph.D., Chair
Salvador Hernández , Ph.D.
Luis David Galicia, Ph.D.
Benjamin C. Flores, Ph.D. Dean of the Graduate School
Copyright ©
by
Lorenzo Emanuel Cornejo Heredia
2012

Dedication
To My Beloved Family
To My Father, Mother and Sister
SYSTEMATIC APPROACH TO EVALUATE POTENTIAL
PARK AND RIDE FACILITIES
by
LORENZO EMANUEL CORNEJO HEREDIA, Bachelor of Science
THESIS
Presented to the Faculty of the Graduate School of
The University of Texas at El Paso
in Partial Fulfillment
of the Requirements
for the Degree of
MASTER OF SCIENCE
Department of Civil Engineering
THE UNIVERSITY OF TEXAS AT EL PASO
December 2012
v
Acknowledgements
I would like to take this opportunity to thank all the persons who have contributed in the
different aspects of this thesis. I would like to acknowledge the invaluable insights and guidance of the
El Paso Metropolitan Planning Organization Deputy Executive Director Mr. Michael Medina and
Regional Transportation Planner Ms. Sonia Perez, whose effort, cooperation and collaboration were
vital for this research. Funding for this research was provided by the El Paso Metropolitan Planning
Organization.
I would like to acknowledge the contribution of my family, fellow students, friends, and
educators with whom I worked during my Master degree.
I would also like to thank my advisors, Associate Professor Ruey Long Cheu, Assistant Professor
Salvador Hernández and Assistant Research Scientist Luis David Galicia for whom I greatly respect.
Thank you for your diligence and vision throughout this journey. Your encouragement and guidance
have made this thesis much more far-reaching than it could have been.
Thanks to Mr. Eduardo Villa, independent consultant, as well as staff of the Sun Metro Planning
Department Mr. Everett Esparza and Ms. Claudia Garcia and the University of Texas at El Paso Facility
Services staff Mr. Robert Contreras, who provided meaningful guidance in the conduct of the study and
insightful reviews of key project documents.
Thanks to Associate Professor Shane Walker and Professor John Walton for their enthusiasm
and getting me to think far beyond the immediate problem and to the objective of my study.
I will also like to state my respect and appreciation for Professor Soheil Nazarian and Assistant
Professor Carlos M. Chang-Albitres for the high quality of their performance and the professional way
in which they work.
Many people at the BIG Lab have been invaluable to this research and my education. Special
thanks are in place for Juan, Mariana, Marcela, Jiří, Alicia, Isaac, David, Mouyid, Yubian, Edgar,
Markéta, Lynda, Edwin and many others that have helped and contributed to this thesis, by sharing and
providing new ideas always patiently. Working with this group was an experience that I will carry along
throughout my career.
vi
I will also like to thank all the staff members of the Department of Civil Engineering for their
help and for taking care of all the administrative aspects of this research.
It is also a great pleasure to acknowledge the co-operation and understanding of all my family
members who have provided me with support and encouragement throughout my studies.
vii
Abstract
Park and Ride (P&R) facilities promote transit ridership by providing an attractive option to car
drivers. They enable potential users to drive to their locations where they can park their cars and take
transit services to complete their destinations.
Although the concept of P&R has been implemented in many cities in the United States and
integrated with different transportation modes such as mass rapid transit (MRT), light rail transit (LRT),
high occupancy vehicle (HOV), Bus Rapid Transit (BRT), among others, no systematic approach has
been developed to assess the feasibility of a potential P&R facility. This thesis proposes a systematic
methodology, which consists of the following tasks, to evaluate potential P&R facilities.
1. Site Selection and Location Analysis
2. Bus System Reliability
3. Site Parking Supply Analysis
4. Development of a Park and Ride Choice Model
5. Park and Ride Ridership Estimation
6. Cost Estimation and Economic Impacts Analysis
7. Develop Recommendations
These tasks were carried out during a case study of a site in the City of El Paso at the intersection
of Joe Battle Boulevard and Montwood Drive. Applying the methodology to the proposed P&R site, this
research has estimated P&R riderships of 46 users in 2010 and 87 users in 2035. Based on these
riderships, the estimated revenues to the bus operators would be $2208.00/month and $4146.00/month
respectively (2012 US dollars). Shops owners surrounding the P&R facility should experience an
increase in revenue of $462.06/day and $874.48/day (2012 US dollars) during these two analysis years
(2010 and 2035). The estimated cost of infrastructure improvement is approximately $51,000.
viii
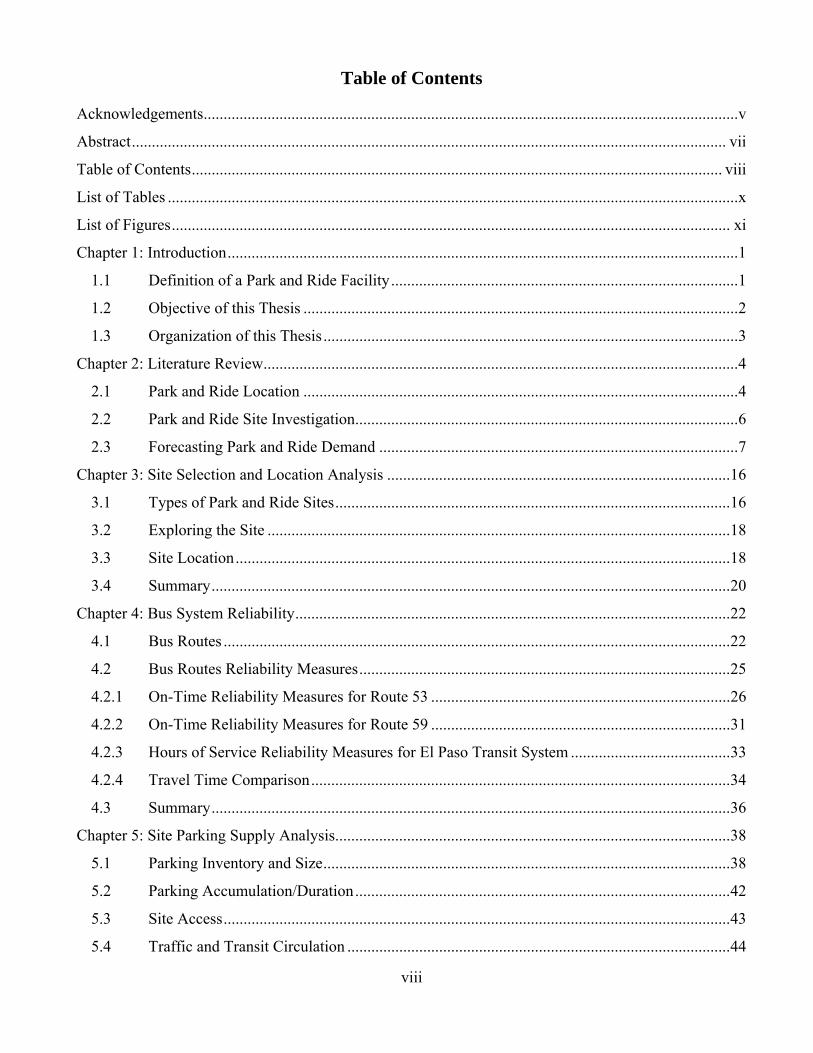
Table of Contents
Acknowledgements ...................................................................................................................................... v
Abstract ..................................................................................................................................................... vii
Table of Contents ..................................................................................................................................... viii
List of Tables ............................................................................................................................................... x
List of Figures ............................................................................................................................................ xi
Chapter 1: Introduction ................................................................................................................................ 1
1.1 Definition of a Park and Ride Facility ....................................................................................... 1
1.2 Objective of this Thesis ............................................................................................................. 2
1.3 Organization of this Thesis ........................................................................................................ 3
Chapter 2: Literature Review ....................................................................................................................... 4
2.1 Park and Ride Location ............................................................................................................. 4
2.2 Park and Ride Site Investigation ................................................................................................ 6
2.3 Forecasting Park and Ride Demand .......................................................................................... 7
Chapter 3: Site Selection and Location Analysis ...................................................................................... 16
3.1 Types of Park and Ride Sites ................................................................................................... 16
3.2 Exploring the Site .................................................................................................................... 18
3.3 Site Location ............................................................................................................................ 18
3.4 Summary .................................................................................................................................. 20
Chapter 4: Bus System Reliability ............................................................................................................. 22
4.1 Bus Routes ............................................................................................................................... 22
4.2 Bus Routes Reliability Measures ............................................................................................. 25
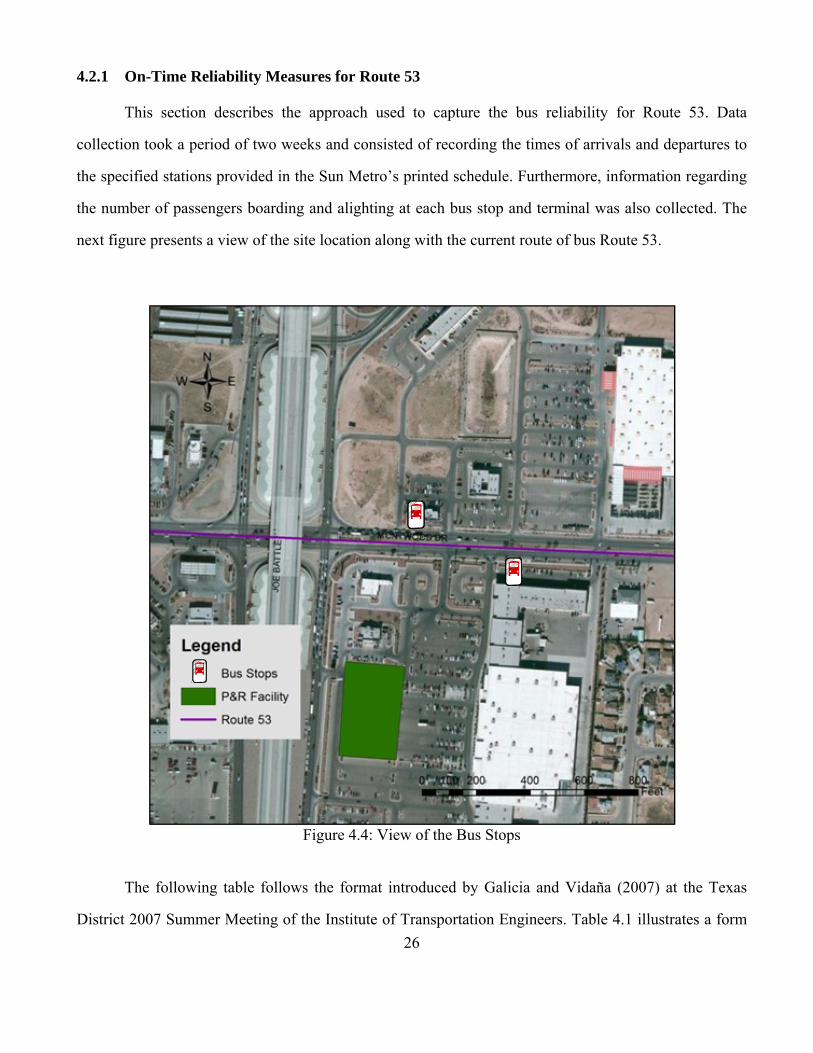
4.2.1 On-Time Reliability Measures for Route 53 ........................................................................... 26
4.2.2 On-Time Reliability Measures for Route 59 ........................................................................... 31
4.2.3 Hours of Service Reliability Measures for El Paso Transit System ........................................ 33
4.2.4 Travel Time Comparison ......................................................................................................... 34
4.3 Summary .................................................................................................................................. 36
Chapter 5: Site Parking Supply Analysis ................................................................................................... 38
5.1 Parking Inventory and Size ...................................................................................................... 38
5.2 Parking Accumulation/Duration .............................................................................................. 42
5.3 Site Access ............................................................................................................................... 43
5.4 Traffic and Transit Circulation ................................................................................................ 44
ix
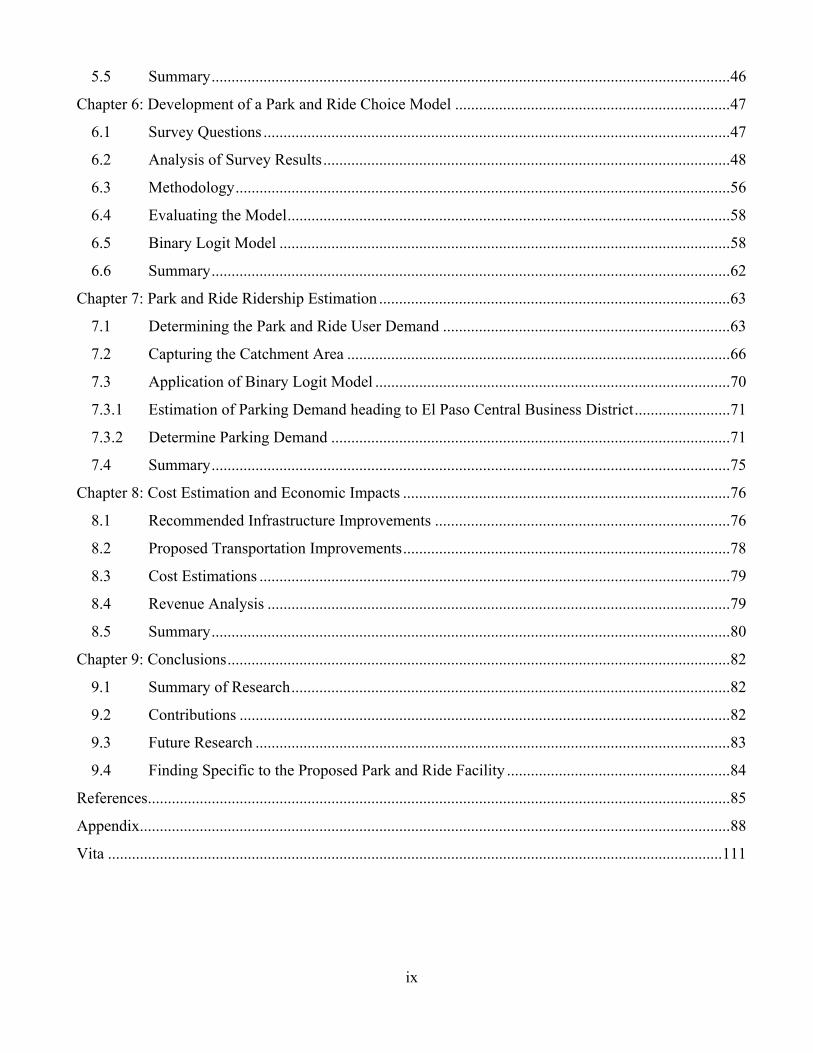
5.5 Summary .................................................................................................................................. 46
Chapter 6: Development of a Park and Ride Choice Model ..................................................................... 47
6.1 Survey Questions ..................................................................................................................... 47
6.2 Analysis of Survey Results ...................................................................................................... 48
6.3 Methodology ............................................................................................................................ 56
6.4 Evaluating the Model ............................................................................................................... 58
6.5 Binary Logit Model ................................................................................................................. 58
6.6 Summary .................................................................................................................................. 62
Chapter 7: Park and Ride Ridership Estimation ........................................................................................ 63
7.1 Determining the Park and Ride User Demand ........................................................................ 63
7.2 Capturing the Catchment Area ................................................................................................ 66
7.3 Application of Binary Logit Model ......................................................................................... 70
7.3.1 Estimation of Parking Demand heading to El Paso Central Business District ........................ 71
7.3.2 Determine Parking Demand .................................................................................................... 71
7.4 Summary .................................................................................................................................. 75
Chapter 8: Cost Estimation and Economic Impacts .................................................................................. 76
8.1 Recommended Infrastructure Improvements .......................................................................... 76
8.2 Proposed Transportation Improvements .................................................................................. 78
8.3 Cost Estimations ...................................................................................................................... 79
8.4 Revenue Analysis .................................................................................................................... 79
8.5 Summary .................................................................................................................................. 80
Chapter 9: Conclusions .............................................................................................................................. 82
9.1 Summary of Research .............................................................................................................. 82
9.2 Contributions ........................................................................................................................... 82
9.3 Future Research ....................................................................................................................... 83
9.4 Finding Specific to the Proposed Park and Ride Facility ........................................................ 84
References .................................................................................................................................................. 85
Appendix .................................................................................................................................................... 88
Vita .......................................................................................................................................................... 111
x
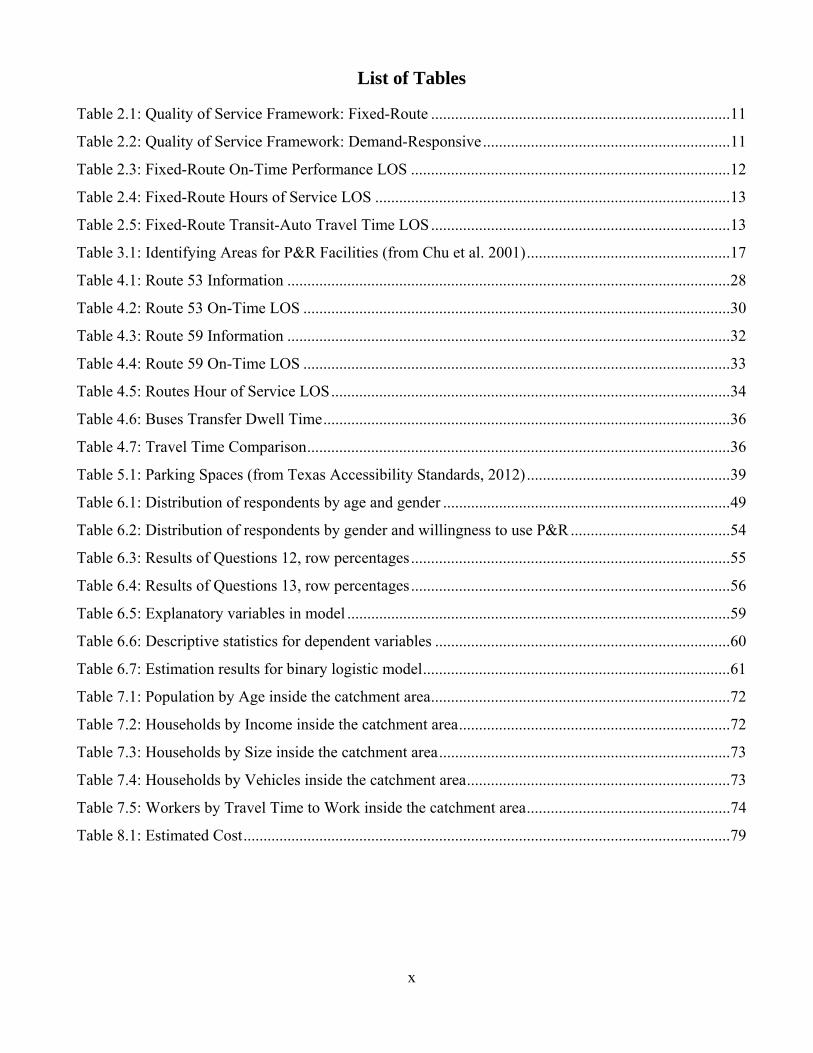
List of Tables
Table 2.1: Quality of Service Framework: Fixed-Route ........................................................................... 11
Table 2.2: Quality of Service Framework: Demand-Responsive .............................................................. 11
Table 2.3: Fixed-Route On-Time Performance LOS ................................................................................ 12
Table 2.4: Fixed-Route Hours of Service LOS ......................................................................................... 13
Table 2.5: Fixed-Route Transit-Auto Travel Time LOS ........................................................................... 13
Table 3.1: Identifying Areas for P&R Facilities (from Chu et al. 2001) ................................................... 17
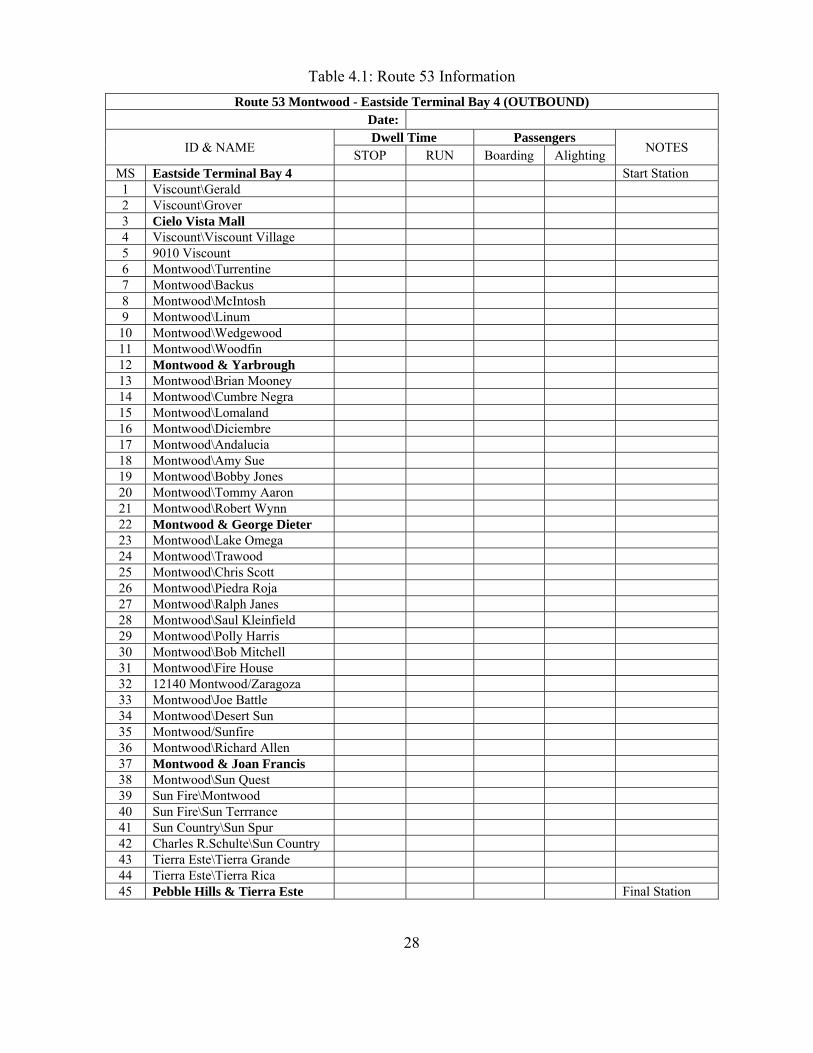
Table 4.1: Route 53 Information ............................................................................................................... 28
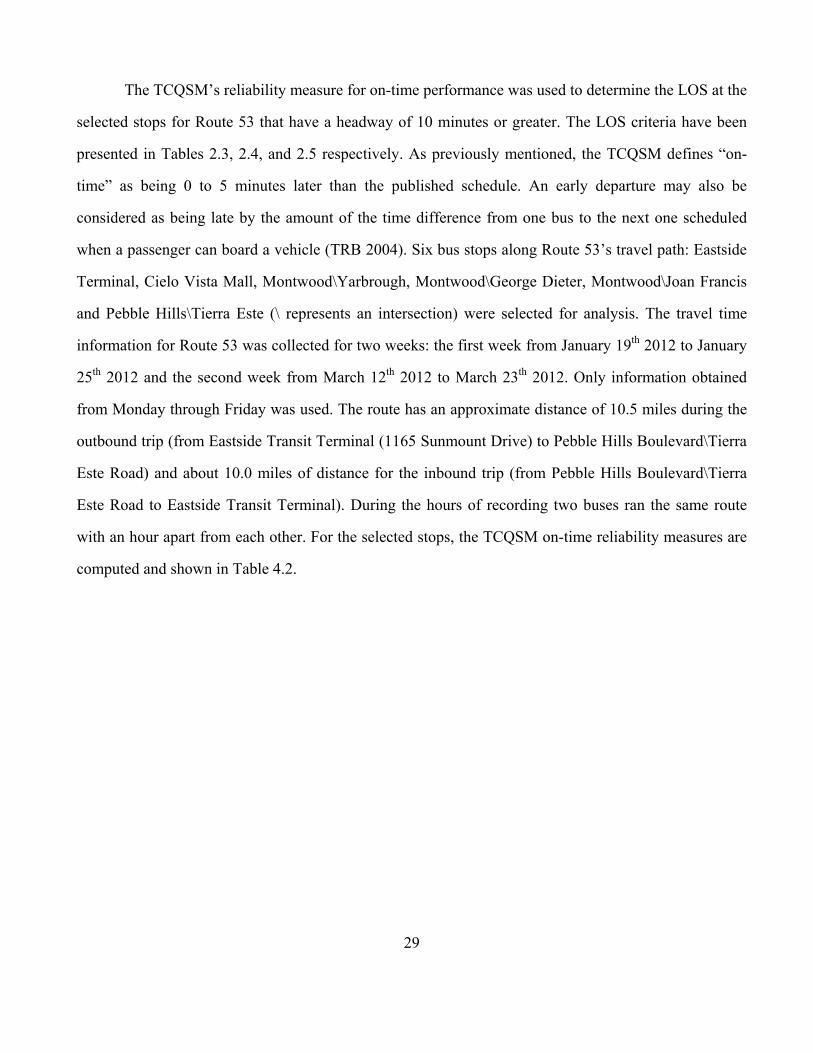
Table 4.2: Route 53 On-Time LOS ........................................................................................................... 30
Table 4.3: Route 59 Information ............................................................................................................... 32
Table 4.4: Route 59 On-Time LOS ........................................................................................................... 33
Table 4.5: Routes Hour of Service LOS .................................................................................................... 34
Table 4.6: Buses Transfer Dwell Time ...................................................................................................... 36
Table 4.7: Travel Time Comparison .......................................................................................................... 36
Table 5.1: Parking Spaces (from Texas Accessibility Standards, 2012) ................................................... 39
Table 6.1: Distribution of respondents by age and gender ........................................................................ 49
Table 6.2: Distribution of respondents by gender and willingness to use P&R ........................................ 54
Table 6.3: Results of Questions 12, row percentages ................................................................................ 55
Table 6.4: Results of Questions 13, row percentages ................................................................................ 56
Table 6.5: Explanatory variables in model ................................................................................................ 59
Table 6.6: Descriptive statistics for dependent variables .......................................................................... 60
Table 6.7: Estimation results for binary logistic model ............................................................................. 61
Table 7.1: Population by Age inside the catchment area ........................................................................... 72
Table 7.2: Households by Income inside the catchment area .................................................................... 72
Table 7.3: Households by Size inside the catchment area ......................................................................... 73
Table 7.4: Households by Vehicles inside the catchment area .................................................................. 73
Table 7.5: Workers by Travel Time to Work inside the catchment area ................................................... 74
Table 8.1: Estimated Cost .......................................................................................................................... 79
xi
List of Figures
Figure 3.1: Aerial Picture of the City of El Paso ....................................................................................... 19
Figure 3.2: Closer View of the Site’s Location ......................................................................................... 20
Figure 4.1: View of the Buses Routes ....................................................................................................... 23
Figure 4.2: Map and Schedule of Bus Route 53 (source: http://home.elpasotexas.gov/sunmetro) ........... 24
Figure 4.3: Map and Schedule of Bus Route 59 (source: http://home.elpasotexas.gov/sunmetro) ........... 25
Figure 4.4: View of the Bus Stops ............................................................................................................. 26
Figure 5.1: View of Potential P&R Lot ..................................................................................................... 38
Figure 5.2: View of the projected P&R parking lot ................................................................................... 40
Figure 5.4: Number of vehicles parked at any given time (from 6:00 a.m. to 8:00 p.m.) ......................... 43
Figure 5.5: One Entry Lane/One Exit Lane (from Roadway Design Manual, 2010) ................................ 44
Figure 5.6: Traffic Volumes at Joe Battle Boulevard & Montwood Drive (a.m. peak hours) .................. 45
Figure 5.7: Traffic Volumes at Joe Battle Boulevard & Montwood Drive (p.m. peak hours) .................. 46
Figure 6.1: Age distribution of the respondents in El Paso, April 2012 (histogram) ................................ 49
Figure 6.2: Distribution of annual household income among respondents ............................................... 50
Figure 6.3: Distribution of level of education among respondents ........................................................... 51
Figure 6.4: Distribution of household size among respondents ................................................................ 52
Figure 6.5: Distribution of vehicles owned among respondents ............................................................... 52
Figure 6.6: Distribution of mode of transportation among respondents .................................................... 53
Figure 6.7: Distribution of Willingness to use a P&R facility in El Paso, April 2012 .............................. 54
Figure 7.1: Estimated Market Catchment Area – Seattle Study (from Spillar, 1997) ............................... 64
Figure 7.2: Estimated Market Catchment Area – Texas Study (from Spillar, 1997) ................................ 65
Figure 7.3: Schematic shape of P&R (from Holguín-Veras et al. 2002a) ................................................. 66
Figure 7.4: Estimated Market Catchment Area ......................................................................................... 67
Figure 7.5: Alternative Service Area Concept Texas Study (from Spillar 1997) ...................................... 68
Figure 7.6: Estimated Market Catchment Area by TAZ ........................................................................... 70
Figure 8.1: Location of Proposed Transportation Improvements .............................................................. 77
1
Chapter 1: Introduction
In recent years, concerns related to the sustainability of transportation operations and rising
urban congestion have translated into an increased interest in the use of Park and Ride (P&R) facilities
as a way to provide suburban commuters an attractive transit alternative (Holguín-Veras et al. 2012a).
P&R facilities promote the use of mixed mode transportation. In the context for the City of El Paso,
Texas, this mixed mode refers to the transfer from a car to a bus. That is, in the morning commute, users
drive from their homes and park their cars at designated P&R lots and then transfer to bus or Bus Rapid
Transit (BRT) mode to reach their final destinations. The order of the trips is reversed in the late
afternoon when commuters travel from work places to homes.
1.1 Definition of a Park and Ride Facility
P&R facilities have existed in many different forms (Spillar 1997). Early public investment in
P&R facility sites in most American urban areas began in the early and mid-1970s, in response to
increasing global oil prices and a renewed interest in mass transit. The concept of P&R is defined by the
American Association of State Highway and Transportation Officials (AASHTO) in the Interim
Geometric Design Guide for Transit Facilities on Highways and Streets as “a facility which provides
places where car or carpool users can park their vehicles during the day, and using a transit or carpool or
vanpool system to reach their travel destinations. These P&R facilities may be served by one or more
transit routes” (AASHTO 2002).
Another definition is given in the appendix of the Geometric Design Guide for Transit Facilities
on Highways and Streets by AASTHO which defines a P&R as a “facility where individuals can park
their private vehicles for the day and access public transportation or rideshare for the major portion of
their trips. Park-and-ride lots are found with Heavy Occupancy Vehicles (HOV) facilities, LRT, heavy
rail, commuter rail systems, and ferry services” (AASHTO 2002). Vuchic (1981) describes P&R as “a
mode of travel by transit when passenger drives to a transit station and parks his/her automobile in the
station’s P&R lot”.
2
Overall, P&R facilities are valuable assets that encourage users to make use of use of transit
systems, which lead to a reduction in urban congestion. Such facilities allow users to park their cars, and
to access bus or any other type of transportation service, therefore taking vehicles off local streets. These
facilities may also contribute to “increasing the mobility options of travelers, increasing person time
spend on the system, decreasing the number of vehicle trips, decreasing the greenhouse gas and air
pollution associated with transportation, and decreasing congestion on transportation facilities” (Caltrans
2010).
The usage of P&R facilities can cover a wide number of objectives. The Transportation Research
Board (TRB) of the National Academies in Chapter 3 of its Transit Cooperative Research Program
(TCRP) Report 95 (Turnbull et al. 2004) provides a list of objectives that may be tailored to be met by a
P&R facility. Some of these include: increasing the availability of alternatives to single drivers, offering
a convenient and safe meeting point for users to support ridesharing, reducing the amount of Vehicles
Miles Travel (VMT), and many others. Since P&R facilities have been implemented in many cities in
the United States (for examples, Washington D.C., San Francisco, Houston, Los Angeles, Seattle, to
name a few) and integrated with many different modes, they have become an integral part of many
transit systems. P&R facilities not only contribute to traffic reduction but may also contribute to the
economy of nearby stores. Wambalaba and Goodwill (2004) presented a research study conducted in the
State of Florida which analyzed the contributions and impacts of Shared Use P&R facilities. The
research concluded that allowing shopping centers in P&R premises benefits shop owners with
increments in sales.
1.2 Objective of this Thesis
At present, no systematic approach has been developed to evaluate the feasibility of a potential
P&R facility. This study seeks to develop a new step-by-step methodology to analyze the attractiveness
of a P&R facility. This will cover the analysis of site location, analysis of transit reliability, analysis
parking supply and usage, estimation of P&R user demand, cost estimation and revenue analysis. The
proposed approach should enable the urban and transportation planners to select the optimal number of
3
facilities to potentially locate, and to choose the best placements of these facilities. A more specific
scientific objective and contribution of this research is to develop a discrete choice model to estimate the
P&R users demand, so that the impacts on transit ridership and economy can be estimated.
Although the methodology is developed for the car-bus or car-BRT mode, it should be applicable
to other mixed modes (e.g., car-LRT, car-MRT) and likewise for other cities.
1.3 Organization of this Thesis
The reminder of the thesis is organized as follows. Chapter 1 gives an introduction on the topic
of P&R and contains the objective of the thesis. In Chapter 2, relevant literature on P&R facilities is
reviewed, with a focus on advantages and disadvantages on different aspects of P&R planning, including
the methodologies. Chapter 3 provides the site selection process; then Chapter 4 continues with an
analysis of the transit service to determine the reliability of its existing service provided to the public
users. Next, Chapter 5 presents an analysis of the parking lot usage at the potential P&R facility. Then in
Chapter 6, a discrete choice model that uses individual’s demographic and socioeconomic backgrounds
to estimate a person’s preference to use a P&R facility is developed. Chapter 7 includes the application
of the model developed in Chapter 6, combined with a Geographical Information System (GIS)
database, to estimate P&R demand. In Chapter 8, the costs of infrastructure improvements to establish a
P&R facility and methods to estimate revenues to the bus company and surrounding shop owners are
estimated. Finally, in Chapter 9, conclusions are organized into guidelines for transportation planners in
evaluating potential P&R facilities in the future.
4
Chapter 2: Literature Review
A comprehensive literature review was conducted in the early stage of this research. The
literature was subsequently updated whenever new information was available. The purpose of the
literature review was to learn from past experiences in other cities, as well as tools or techniques used in
different aspects of P&R planning. Although a comprehensive P&R planning methodology was not
found, the different aspects of the planning components were later integrated in this research. The
review not only covered the published literature (e.g., Transit Cooperative Research Program (TCRP)
reports, National Cooperative Highway Research Program (NCHRP) reports, achieved engineering,
planning and geography journals, and conference proceedings) but also included materials concerning
the P&R planning in European and South American cities. After conducting literature review it was
found that previous studies have focused on the following five areas: P&R location, P&R site
investigation, P&R demand, analysis of the city’s transit system, and application of GIS. All five areas
are reviewed in the different sections of this chapter.
2.1 Park and Ride Location
Selecting the right location for a P&R facility is perhaps one of the most important elements in
assuring a successful P&R lot utilization (Spillar 1997). It is therefore important for engineers and
planners to determine an optimal P&R location (Faghri et al. 2002). Determining the appropriate placing
of such facilities must take into effect the P&R demand projection. Placing a facility close to major
roadways has been proven to relieve traffic congestion. In addition, the site for placing the optimal
location of a P&R facility “should be evaluated for their long-term operational attributes and impacts on
the transit system rather than being automatically accepted as an inexpensive alternative to property
acquisition” (Spillar 1997). The term optimal refers to a site that best describes an ideal location with
respect to a set of potential sites. Before arriving at an optimal location, there might be several
complications. For example, if the existing land planned for the facility has new developments being
constructed, environmental constraints, and nearby locations of fixed transit lines. In the context of the
5
case study for this project the facility location has been provided by the El Paso Metropolitan Planning
Organization (MPO).
A number of researches have helped to define an optimal location for a P&R facility. Spillar
(1997) constructed guidelines for assisting future planners or engineers in the identification of
alternative P&R sites. It recommended a thorough analysis to identify the needs for the community
around the facility with respect to the new facility’s placement. Faghri et al. (2002) proposed a
computerized tool that, from a given set of potential sites, ranks them in order from best to least based
on research and survey findings to determine the optimal location of these sites. Farhan and Murray
(2005) delineated market or catchment areas that were located near the candidate P&R facilities. A
“catchment area” represents the expected geographic area in which most of the users are likely to come
from. It is also important to understand the socioeconomic characteristics of the future P&R users in
order to make good demand estimation. Farhan and Murray (2008) developed a multi-objective spatial
optimization model. This model was designed to find the optimal location of a P&R facility depending
on the demand, accessibility to a major highway and availability of existing facilities. Horner and
Groves (2006) designed a network flow-based framework in order to captured most of the car users
early during their travel trips which proved to be an important aspect for potential P&R users. Rather
than having to drive in the opposite direction of their destination to get to the P&R facility, potential
users like to use a facility which is close to their trip origins and on the way to their final destinations. In
another instances, P&R facilities can be incorporated into commercial centers, which may help to boost
local economic activity and possibly spur development in targeted locations (Faghri et al. 2002).
Determining the best location for placing a P&R facility consists of a two-level process as
proposed in the State Park and Ride Lot Program by the Florida Department of Transportation (Harris
1996):
1. The first level consists of determining some of the potential locations that could be used to place
such facility. Important factors that could influence the placement are: demand, congestion, and
travel time. The location should be able to capture most of the demand (i.e., having enough parking
spaces for the car users, bicycle users, etc.). It should also be place at locations where trips are
6
originated (residential areas) and far from the trips destinations (employment areas). And finally,
where the travel times for users (i.e., from the P&R lot to the destinations) are not so far from their
typical driving time from home to work.
2. After some locations are chosen to potentially serve as P&R facilities, an assessment is made in
order to rank them depending on their attributes. The Florida’s State Park and Ride Lot Program
offers a table that provides a series of criteria that should be taken into consideration. For example,
the corridor located near the facility operates at Level of Service (LOS) E or worse are ideal for P&R
development (Chu et al. 2001).
2.2 Park and Ride Site Investigation
Prior to the design process, a site investigation is recommended in the case of placing a P&R
facility inside the vicinity of an existing parking lot. A useful method for measuring and evaluating the
site’s performance is to conduct a parking study. A parking study consists of various steps that examine
the capacity and use of existing parking facility, location and extent of demand for parking by present
parkers, the adequacy of access and egress (for buses), the influence of such facilities on traffic flow in
the main streets, and the effect and desirability of modifying the parking supply (Homburger et al.
1992). Homburger et al. (1992) provided eight steps to follow to conduct a parking study. Some of the
steps included: delineating the area that will be analyzed, making an inventory of the parking spaces,
proceed with continuous observation, and conducting parking interviews to the users, and etc.
Roess et al. (2004) divided a parking study into three major parts and made suggestions for
collecting additional information: proximity, parking inventory, accumulation and duration. Proximity
covers the facility’s location and the maximum walking distance that the users are willing to walk in
order to reach the bus (or any other transportation mode provided by the P&R facility). Parking
inventory covers the number of parking spaces, their individual locations, time restrictions on use of
parking spaces, and the type of parking facility (i.e., on-street, off-street lot, off-street garage).
Accumulation and duration survey consists of counting the total number of vehicles parked at any given
time; in the same manner recording the length of time that each vehicle remains parked. The interval for
7
collecting such information may range from 10 to 30 minutes. In addition, Roess et al. (2004) mentioned
other parking studies that may be done to gain information concerning parked vehicles and parkers
(parking users). For example, conducting interviews to the parkers may be done to get additional
information such as their trip purpose, trip duration, distance walked, etc. Obtaining information about
parkers will provide a greater insight into how parking conditions affect users.
The American Society of Civil Engineers in their book Transportation Engineering Basics
provides guidelines to follow for conducting a parking study (Murthy and Mohle 1993). Similar to the
study provided by Roess et al. (2004), this book presented four basic steps to follow in a site survey:
parking area characteristics, parking demand and supply, parking control and parking security. Each step
has an explanation of the procedure with a table and material on how to cluster the parking lot
information.
Chapter 10 of the Florida’s State Park and Ride Lot Program guide recommends a process for
evaluating the performance of an existing site. This process consists of four phases and each phase
contains tables to fill and to complete for analyzing an existing site. The first phase consists of collecting
the primary data required to evaluate the performance of individual lots and make an assessment. During
the second phase, the evaluations of the preliminary performance are completed. The third phase
consists of the collection of additional data. The final phase of the evaluation process is concerned with
evaluating the different lot options for each site considered (Harris 1996).
In 2012, the New York State Department of Transportation sponsored a P&R Study to review
existing practices in P&R planning (Holguín-Veras et al. 2012a). This report provided a series of data
collection and analysis to proceed in order to conduct a parking study, including parking inventory,
parking accumulation, parking duration, license plate-origin information and parking interviews.
2.3 Forecasting Park and Ride Demand
Reliable demand forecasting is often the first step in assuring well-used facilities (Spillar 1997).
Previous P&R facility research often assumed that the total travel demand was given and fixed
exogenously (Li et al. 2007). Forecasting the demand of potential P&R users should consider future
8
expansions of the city, and major events that generate traffic such as sports games or concerts, which
will affect the facility’s performance. In fact, travel demands are subjected to traffic condition of road
and parking facilities as well as their user fees (Li et al. 2007). Searching for an available parking space
at the P&R facilities takes time, and this contributes to traffic congestion. Therefore, forecasting the
demand and ensuring an available parking space for every P&R users is necessary. Researchers have
found that having an available empty parking space in a P&R facility is crucial in the parkers’ decision
to use such facilities. Many of the potential new users base their decisions on whether to use the facility
on the availability of parking spaces and the amount of time it takes to find one empty (Li et al. 2007).
There are a variety of different methods for calculating demand, depending on the type of facility and
scale of analysis.
Li et al. (2007) proposed a model that provided a useful tool for investigating the complex P&R
behavior in a multimodal transportation network, and to determine if a car user will use the P&R
facility. The proposed model considered three major aspects: the commuters’ choices on travel mode
(using a car, walk to a metro or the P&R mode), the commuters’ travel paths or routes as well as their
transfer points (i.e., a P&R facility), and finally their parking choice behavior. Spillar (1997) in his
research mentioned two approaches that could be done to develop a P&R demand forecasting. The first
approach was to estimate the individual’s P&R demand based on regional modeling approaches. The
second approach was to develop a site-specific forecasting tool, designed to that specific metropolitan
region.
In the context of this thesis there are two major concerns that need to be taken into account when
calculating the demand for a P&R facility. They are explained in the next sentences followed by an
explanation of four steps that need to be conducted to estimate the site size (number of parking stalls).
The first issue to consider can be explained as the demand that the P&R facility could attract (Holguín-
Veras et al. 2012a). Researchers have most frequently used the catchment area. The catchment area can
be defined as the geographic region within which P&R users are expected to come from. In the past,
researchers have considered using cones, parabolas, ellipses, and even pears shapes to determine
catchment areas.

9
After the catchment area has been drawn, the second consideration is defined by the
attractiveness of the site to the potential users. This means that, in order for the P&R facility to be
considered by potential users as an alternative method to reach their destinations, the generalized costs
of using the bus service (e.g., transit fare and other expenses related to the transit service) compared to
the car trips (e.g., out-of-pocket cost, fuel cost, etc.) must be lower. Holguín-Veras et al. (2012b)
proposed offering a transit service that is significantly faster than the car alternative; and/or a transit
service with out of pocket expenses that are significantly lower than the ones for car-only.
In order to determine the size requirements for a P&R facility, there are a number of different
techniques that could be followed. The following steps were introduced by Harris (1996).
1. Calculate the number of potential vehicles or users (i.e., car, motorcycle, bicycle, carpool, etc.) that
would use the facility. This analysis could be done through surveys and observations.
2. Convert the number of potential vehicles or users into an actual number of cars that would park at
the facility.
3. Make adjustments for changes in demand that may be caused by weather changes, daily changes,
entertainment events, constructions near the facility, and economic factors.
4. Compute the number of vehicles that would park at the facility but do not ride the bus.
2.4 Reliability Analysis of Transit System
Reliability is an important factor for a public transportation system that offers a dependable
service to attract new users. Not having a reliable transit service may lead to anxiety or discomfort for
the passengers, delays, and lead to a decrease in ridership. In order to maintain a competitive service for
people who drive their own car to make a shift from their personal transportation system to bus, the bus
service must have a good reliability (Liu and Sinha 2007).
Reliability is a measure of the quality of service of public transportation systems with factors
including waiting time and service frequency. There have been studies to determine the reliability of a
transit system. Lin et al. (2008) developed a quality control framework for bus schedule adherence
performance by using an Automatic Vehicle Location (AVL) system. The data were then processed by a
Data Envelopment Analysis (DEA) tool which gave a reliability score. The score depended on whether
10
the buses follow the schedule and maintain regular headways. Liu and Sinha (2007) developed a
dynamic microscopic simulation model that incorporated the bus operation hours and passenger arrival
and boarding times with the purpose of capturing their effects on bus reliability. The intention was to
have a model that would enable analysts to understand what are the causes and occurrence of unreliable
service. The model also allowed analysts to study the impacts of different scenarios such as increase in
congestion, rise in passenger demand, and reduction in boarding time on the reliability of a route.
Other researchers have done work on cases where bus routes have higher frequencies. Milkovits
(2008) expanded a simulation model of a bus route that had high frequency in order to study the causes
of unreliability and strategies that could be followed to alleviate the problem. The model was solved by
using a sensitivity analysis that examined some factors that influenced the bus reliability such as: the
departure time of the buses at the terminals and the passengers demand. The model results showed that if
the proposed strategies were followed, it could significantly improve the bus service reliability and
minimize the number of buses that experienced almost no ridership of passengers.
In 2004, TCRP released the second edition of TCQSM (TRB 2004). The following list contains
some of the reliability measures described in the TCQSM at the transit stop level.
Pedestrian access: covers the amount of separation between pedestrians and traffic, and other related
factors.
P&R access: measured by the lot occupancy (number of parking spaces occupied, divided by the
total numbers of spaces in the lot).
Passenger loading: measures the ability a passenger can board the first vehicle that arrives (not
affected by overcrowding).
Access for persons with disabilities: if the terminal bus stops and buses comply with the ADA
regulations.
The manual also provides tools for measuring a bus system performance (TRB 2004). The
TCQSM provides two different evaluations for transit services. The first framework is entitled fixed-
route service, while the second is demand-responsive service. The fixed-route and demand-responsive
methods are then divided into two main categories: availability, and comfort and convenience (TRB
11
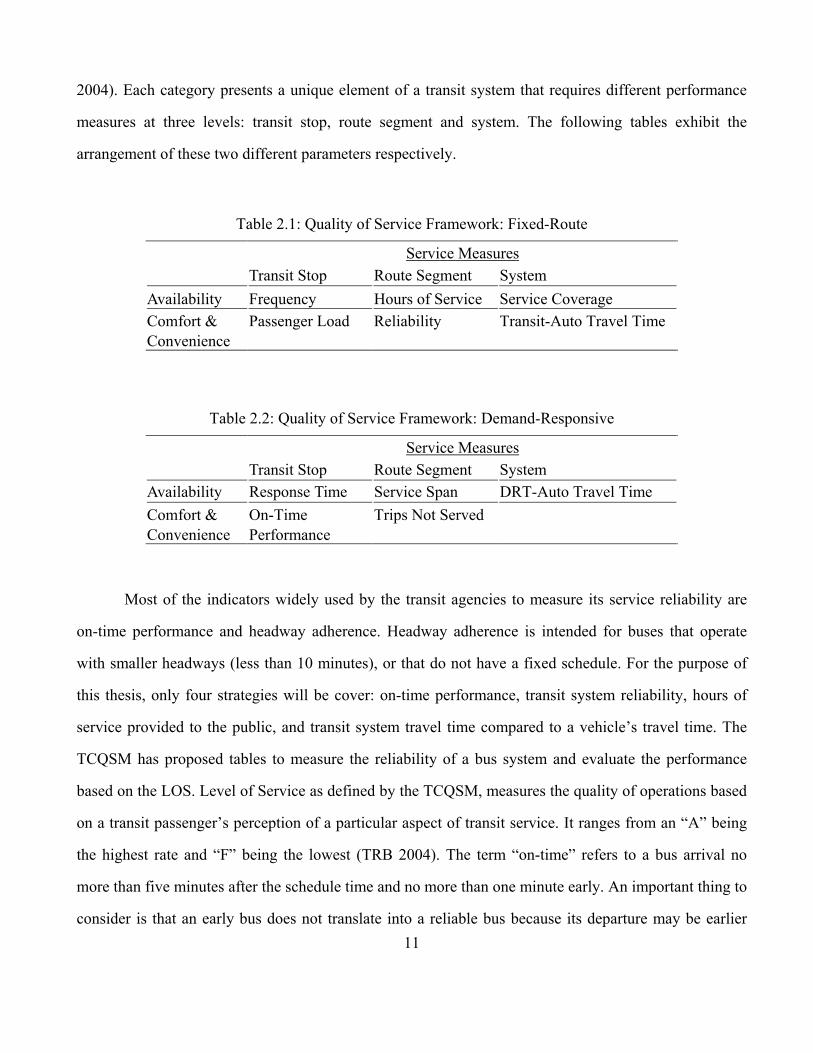
2004). Each category presents a unique element of a transit system that requires different performance
measures at three levels: transit stop, route segment and system. The following tables exhibit the
arrangement of these two different parameters respectively.
Table 2.1: Quality of Service Framework: Fixed-Route
Service Measures
Transit Stop Route Segment System
Availability Frequency Hours of Service Service Coverage
Comfort & Convenience
Passenger Load Reliability Transit-Auto Travel Time
Table 2.2: Quality of Service Framework: Demand-Responsive
Service Measures Transit Stop Route Segment System
Availability Response Time Service Span DRT-Auto Travel Time
Comfort & Convenience
On-Time Performance
Trips Not Served
Most of the indicators widely used by the transit agencies to measure its service reliability are
on-time performance and headway adherence. Headway adherence is intended for buses that operate
with smaller headways (less than 10 minutes), or that do not have a fixed schedule. For the purpose of
this thesis, only four strategies will be cover: on-time performance, transit system reliability, hours of
service provided to the public, and transit system travel time compared to a vehicle’s travel time. The
TCQSM has proposed tables to measure the reliability of a bus system and evaluate the performance
based on the LOS. Level of Service as defined by the TCQSM, measures the quality of operations based
on a transit passenger’s perception of a particular aspect of transit service. It ranges from an “A” being
the highest rate and “F” being the lowest (TRB 2004). The term “on-time” refers to a bus arrival no
more than five minutes after the schedule time and no more than one minute early. An important thing to
consider is that an early bus does not translate into a reliable bus because its departure may be earlier
12
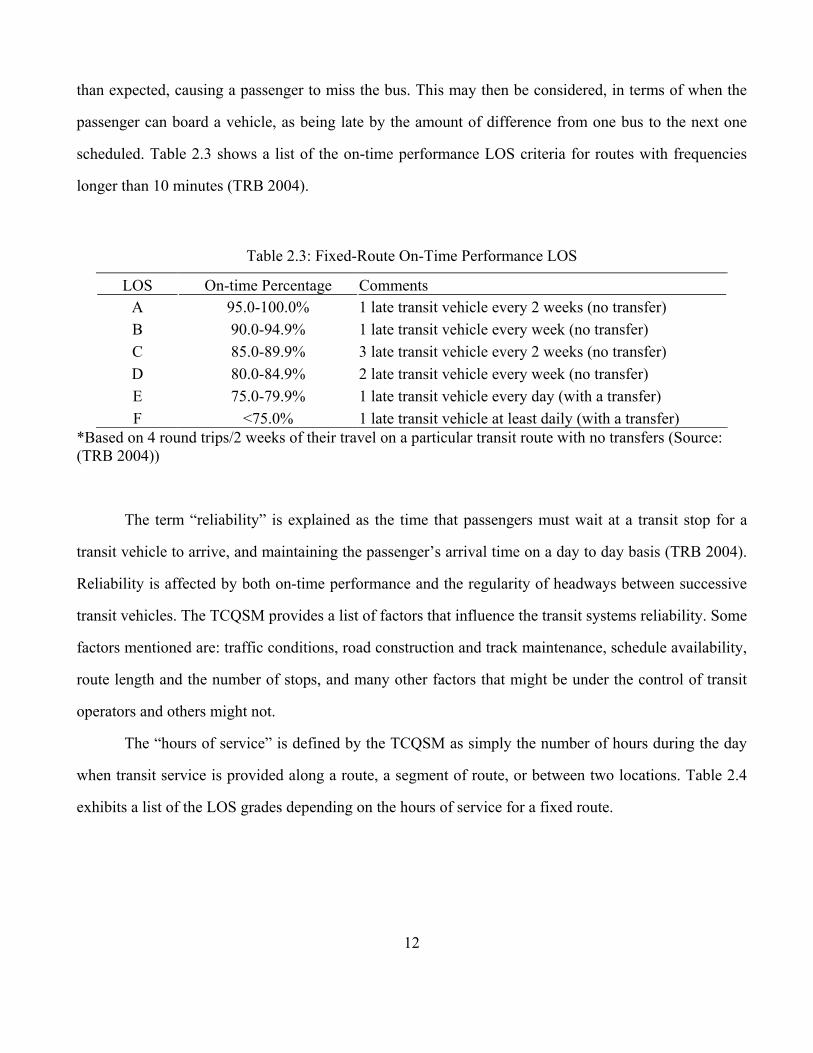
than expected, causing a passenger to miss the bus. This may then be considered, in terms of when the
passenger can board a vehicle, as being late by the amount of difference from one bus to the next one
scheduled. Table 2.3 shows a list of the on-time performance LOS criteria for routes with frequencies
longer than 10 minutes (TRB 2004).
Table 2.3: Fixed-Route On-Time Performance LOS
LOS On-time Percentage Comments A 95.0-100.0% 1 late transit vehicle every 2 weeks (no transfer)
B 90.0-94.9% 1 late transit vehicle every week (no transfer)
C 85.0-89.9% 3 late transit vehicle every 2 weeks (no transfer)
D 80.0-84.9% 2 late transit vehicle every week (no transfer)
E 75.0-79.9% 1 late transit vehicle every day (with a transfer)
F <75.0% 1 late transit vehicle at least daily (with a transfer) *Based on 4 round trips/2 weeks of their travel on a particular transit route with no transfers (Source: (TRB 2004))
The term “reliability” is explained as the time that passengers must wait at a transit stop for a
transit vehicle to arrive, and maintaining the passenger’s arrival time on a day to day basis (TRB 2004).
Reliability is affected by both on-time performance and the regularity of headways between successive
transit vehicles. The TCQSM provides a list of factors that influence the transit systems reliability. Some
factors mentioned are: traffic conditions, road construction and track maintenance, schedule availability,
route length and the number of stops, and many other factors that might be under the control of transit
operators and others might not.
The “hours of service” is defined by the TCQSM as simply the number of hours during the day
when transit service is provided along a route, a segment of route, or between two locations. Table 2.4
exhibits a list of the LOS grades depending on the hours of service for a fixed route.
13
Table 2.4: Fixed-Route Hours of Service LOS
LOS Hours of Service Comments A 19-24 Night or “owl” service provided
B 17-18 Late evening service provided
C 14-16 Early evening service provided
D 12-13 Daytime service provided
E 4-11 Peak hour service only or limited midday service
F 0-3 Very limited or no service *Based on 4 round trips/2 weeks of their travel on a particular transit route with no transfers (Source: (TRB 2004))
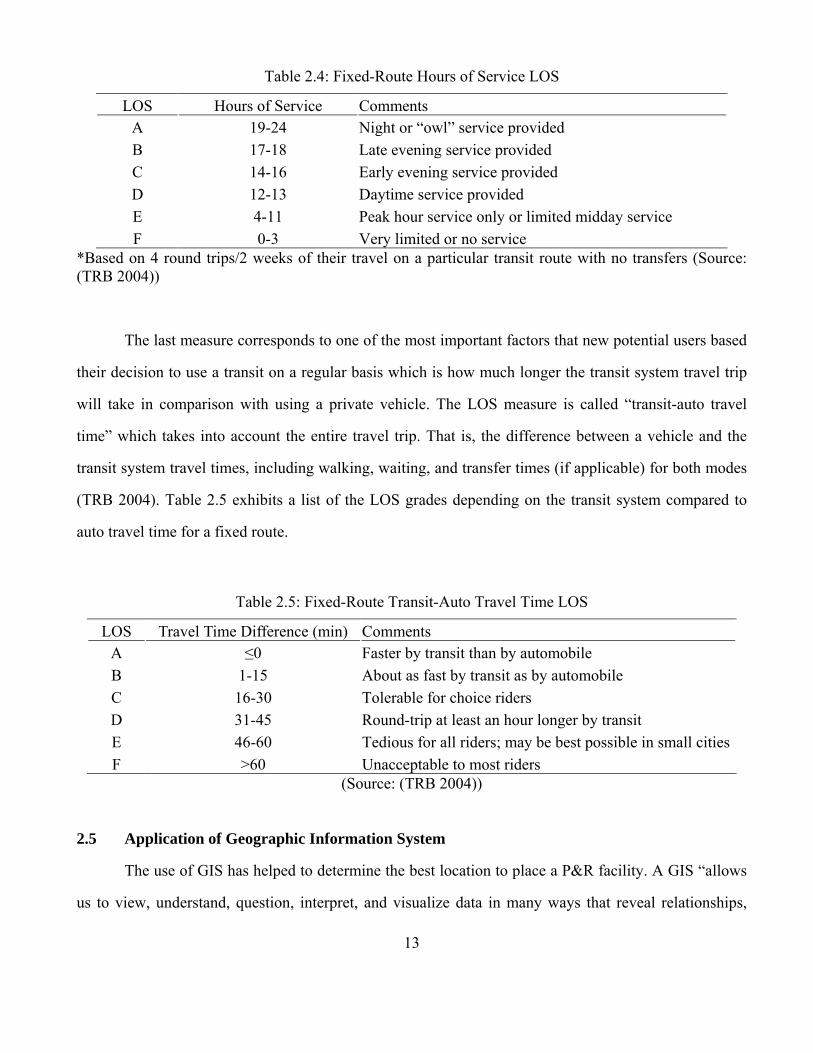
The last measure corresponds to one of the most important factors that new potential users based
their decision to use a transit on a regular basis which is how much longer the transit system travel trip
will take in comparison with using a private vehicle. The LOS measure is called “transit-auto travel
time” which takes into account the entire travel trip. That is, the difference between a vehicle and the
transit system travel times, including walking, waiting, and transfer times (if applicable) for both modes
(TRB 2004). Table 2.5 exhibits a list of the LOS grades depending on the transit system compared to
auto travel time for a fixed route.
Table 2.5: Fixed-Route Transit-Auto Travel Time LOS
LOS Travel Time Difference (min) Comments A ≤0 Faster by transit than by automobile
B 1-15 About as fast by transit as by automobile
C 16-30 Tolerable for choice riders
D 31-45 Round-trip at least an hour longer by transit
E 46-60 Tedious for all riders; may be best possible in small cities
F >60 Unacceptable to most riders (Source: (TRB 2004))
2.5 Application of Geographic Information System
The use of GIS has helped to determine the best location to place a P&R facility. A GIS “allows
us to view, understand, question, interpret, and visualize data in many ways that reveal relationships,
14
patterns, and trends in the form of maps, globes, reports, and charts” (ESRI 2012). Farhan and Murray
(2005) utilized GIS to delineate the potential market areas for P&R facilities which considered two main
factors: accessibility and user travel direction. In addition, their paper provided a detailed description
and formal specification of the market area delineation approaches, and showed how such approach is
useful for GIS implementation. Faghri et al. (2002) developed a tool that helped to determine the
optimal location for P&R facilities with the use of GIS software. Some researchers have also used GIS
as a tool for visual representation. Farhan and Murray (2008) applied a multi-objective spatial
optimization model, and the results were exported to ArcView GIS for analysis, visualization and
performing data manipulation. Others have used GIS as an effective method for evaluating and
analyzing the running of scheduled bus services to determine their reliability. Bullock et al. (2005)
collected the travel times from a set of buses by placing a Global Positioning System (GPS) device
inside each bus. The objective in their research was to identify any problems and improve the service
levels. The GIS software was used to process and analyze GPS data collected on buses operating on a
specific route. The results proved that GPS devices incorporated in buses could be a cost-effective
method for evaluating the service reliability. Not necessarily all the buses have to be equipped with such
a device. The buses that have a GPS device could be rotated in order to capture all the different routes in
that city.
2.6 Summary
This chapter has summarized relevant literature that was found to be useful for this P&R
research. The literature indicates that location analysis and demand forecasting are necessary steps.
Particularly, much of the literature targets to only one specific task among the seven tasks proposed in
this thesis. This thesis aims to fill the gap and develop a systematic approach that will encompass
different aspects of P&R facility planning.
In the following chapter (Chapter 3), the site’s placement and location will first be analyzed. The
reliability analysis of the affected transit routes in El Paso that will connect the P&R facility to the CBD
will be conducted by measuring the quality of the service (i.e., LOS) by means of the methodology
reviewed in section 2.4, Another important aspect of P&R planning is to investigate the existing usage
15
of the parking lot that has been proposed to host the P&R users. This will be covered in Chapter 6.
Subsequently, methodologies to collect survey data and develop the discrete choice mode will be
demonstrated in Chapter 6. Chapter 7 deals with how to apply the discrete choice model, combined with
GIS data surrounding the site to calculate the projected P&R demand. With the projected P&R demand,
the increase in revenue to the transit company and shop owners can then be estimated. This is illustrated
in Chapter 8, along with the cost of infrastructure improvement.
16
Chapter 3: Site Selection and Location Analysis
The process of selecting sites for future development of a P&R facility can be explained as an
orderly procedure. This chapter describes the criteria for placing as well as evaluating P&R facilities.
Decisions behind the placement of parking facilities for P&R users are to ensure a continuous path for
the users from the street to a parking space and to the transit system with a minimum set of obstacles. A
site in the City of El Paso was selected in consultation with El Paso MPO and other stakeholders to
develop the systematic approach for the evaluation of the potential P&R facility.
3.1 Types of Park and Ride Sites
The first step in site selection is to identify the area in which the facility will be placed. The State
Park and Ride Lot Program by the Florida Department of Transportation (Harris 1996) contains a total
of 12 chapters. Chapter 3, updated in 2011, which is entitled Site Selection provides a list of five
different lot types. Table 3.1 presents the criteria and standards for identifying areas for P&R facilities
(Chu et al. 2001). It goes into more detailed information for each of the lot types. This thesis will not
cover every aspect for each lot type, but only for the lot type that are commonly found in El Paso, TX.
17
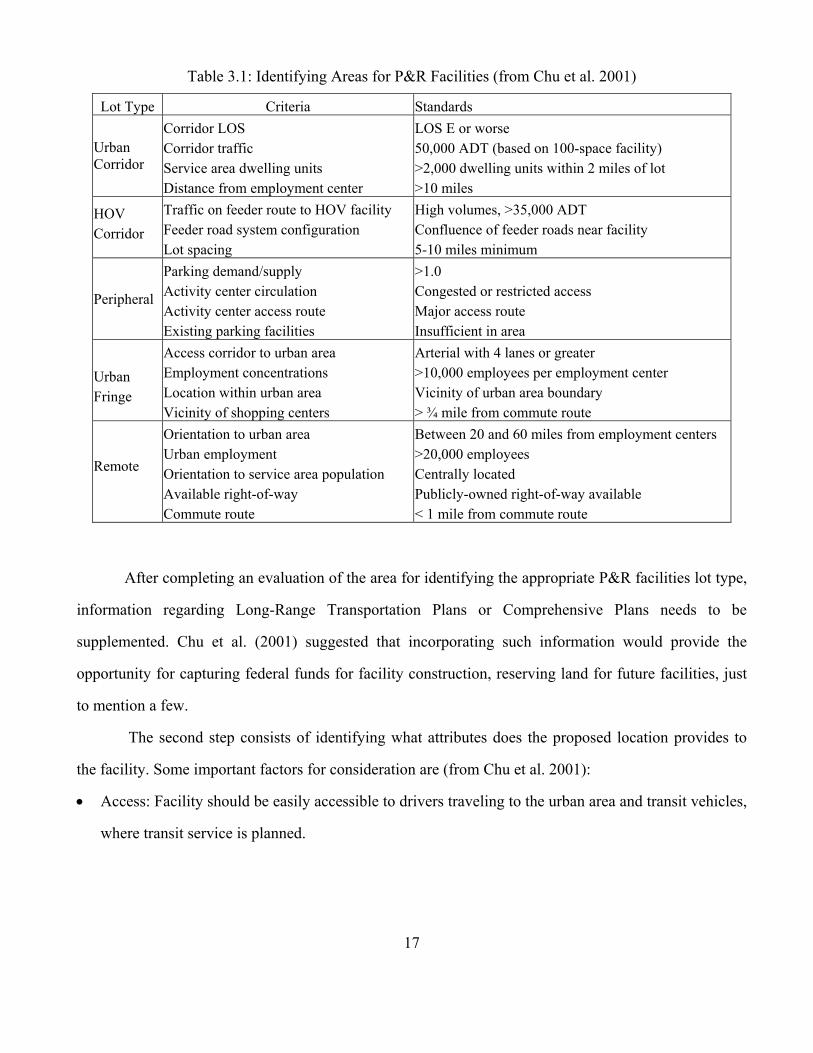
Table 3.1: Identifying Areas for P&R Facilities (from Chu et al. 2001)
Lot Type Criteria Standards
Urban Corridor
Corridor LOS Corridor traffic Service area dwelling units Distance from employment center
LOS E or worse 50,000 ADT (based on 100-space facility) >2,000 dwelling units within 2 miles of lot >10 miles
HOV Corridor
Traffic on feeder route to HOV facility Feeder road system configuration Lot spacing
High volumes, >35,000 ADT Confluence of feeder roads near facility 5-10 miles minimum
Peripheral
Parking demand/supply Activity center circulation Activity center access route Existing parking facilities
>1.0 Congested or restricted access Major access route Insufficient in area
Urban Fringe
Access corridor to urban area Employment concentrations Location within urban area Vicinity of shopping centers
Arterial with 4 lanes or greater >10,000 employees per employment center Vicinity of urban area boundary > ¾ mile from commute route
Remote
Orientation to urban area Urban employment Orientation to service area population Available right-of-way Commute route
Between 20 and 60 miles from employment centers >20,000 employees Centrally located Publicly-owned right-of-way available < 1 mile from commute route
After completing an evaluation of the area for identifying the appropriate P&R facilities lot type,
information regarding Long-Range Transportation Plans or Comprehensive Plans needs to be
supplemented. Chu et al. (2001) suggested that incorporating such information would provide the
opportunity for capturing federal funds for facility construction, reserving land for future facilities, just
to mention a few.
The second step consists of identifying what attributes does the proposed location provides to
the facility. Some important factors for consideration are (from Chu et al. 2001):
Access: Facility should be easily accessible to drivers traveling to the urban area and transit vehicles,
where transit service is planned.
18
Site size: Facility sizing should be based on preliminary estimate of demand and the capability for
future expansions. Lot placement should not divert transit users more than ½ to ¾ miles out of their
travel path.
Transit service: Facility must offer frequent, quick and reliable service in both the inbound and
outbound directions.
Transit circulation: Facility should minimize congestion on nearby roadways, particularly if located
in residential districts.
In the same manner, Holguín-Veras et al. (2012a) divided the sites attributes into four broad
areas: demand considerations, transit connectivity and design, community integration, and economic
viability. Each category presented was classified according to the impact that each factor might have on
the selection process.
3.2 Exploring the Site
Covering the first step in the site selection process, the site of interest for El Paso MPO falls into
the category of an urban corridor. It is located along a major corridor (Montwood Drive) within an urban
area. The first two criteria in Table 3.1 for lot type specifically for urban corridor are to assist in
identifying if the corridor is likely to support a P&R facility; the last two criteria are to help identifying
the locations that are best suited for implementing a P&R facility. Another important aspect to review is
the site location, if it is conveniently located near the trips origins (residential areas) and further from
trip destinations (employment centers). Essentially, the site proposed is located near an urban area and
approximately 20 miles away from the CBD of El Paso.
To encompass the second step in the site selection process, a parking study was performed. The
parking study covers the corridor’s LOS and the corridor’s traffic which will be further explained in
Chapter 5.
3.3 Site Location
The planned site chosen for the study is located at the southeast of the intersection between Joe
Battle Boulevard and Montwood Drive, in El Paso, Texas as showed in Figure 3.1 (an aerial picture

19
taken from Bings using ArcMap). Pin located to the right hand side (P&R Site Location) presents an
approximate location of the site’s major intersection and pin located to the left hand side (CBD) shows
an approximation of the city’s CBD. A closer view of the site’s location showed in Figure 3.2 provides a
better picture of the nearby residential areas. A mall consisting of several stores is located on the
southeast of the intersection. Some of the mall stores include: Super Target, Ross, Marshalls, Office
Depot, Pet Smart, and others. Located north of the intersection are a Home Depot store and a few
restaurants.
This intersection of Joe Battle Boulevard and Montwood Drive is heavily used by residents who
live on the east side of Joe Battle Boulevard. It is a major connection that allows traffic movement that
runs from eastside of El Paso toward the CBD during the morning commute period. In 2010, an average
of 266,556 vehicles used Montwood Drive and 74,000 used Joe Battle Boulevard each day (Hinojosa
2011). These numbers exceed the Average Daily Traffic (ADT) criteria listed in Table 3.1. Chapter 5
covers in more detailed the site’s intersections major corridor LOS and their appropriate ADT.
Figure 3.1: Aerial Picture of the City of El Paso
P&R Facility
Site Location
CBD
20
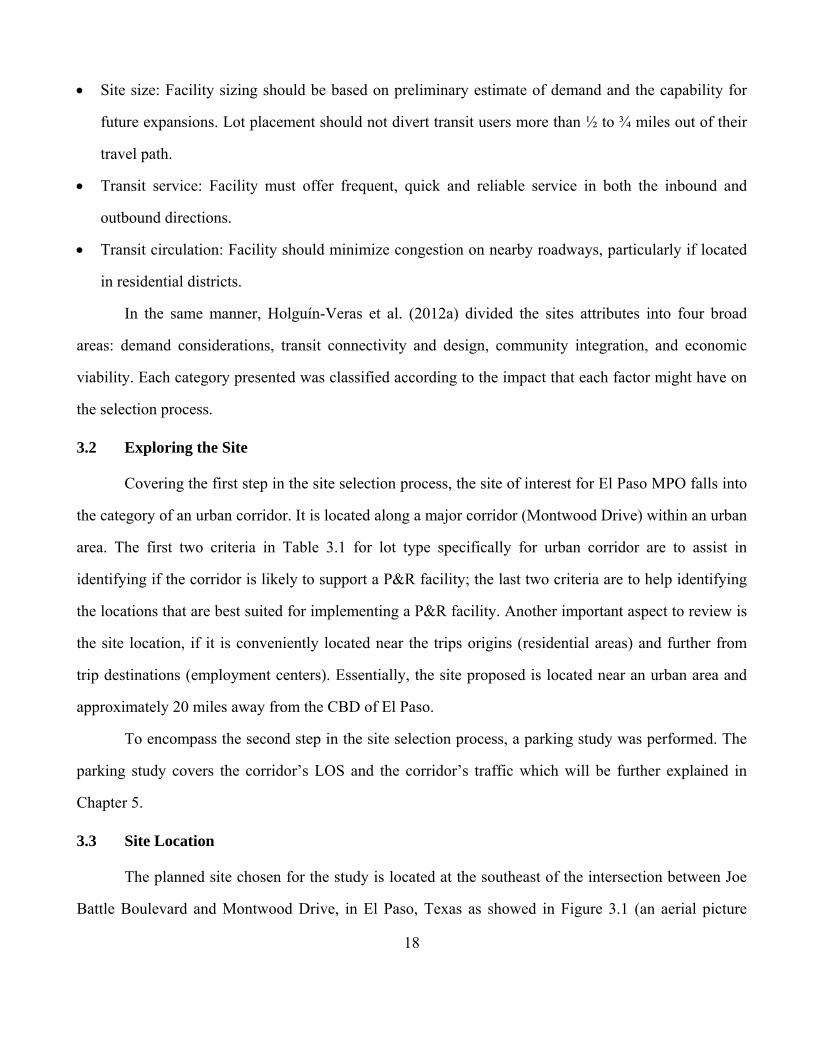
3.4 Summary
An orderly procedure needs to be conducted when choosing the right site selection, ranking the
potential sites which may be in the contention for development are useful methods. Assigning different
weighting scores to represent the relative importance of each factor including the location and site
considerations are then evaluated for each of the potential lots that are under consideration. These
criteria can be logically assigned to higher weights to reflect the importance and determine the optimal
location (Chu et al. 2001).
Figure 3.2: Closer View of the Site’s Location
P&R Facility
Site Location
21
Another possible site location which could meet the requirements and criteria for sustaining a
P&R facility was suggested by other stake holders. This location is situated near the intersection of
North Zaragoza Road and Joe Battle Boulevard. The site consists of a parking lot area inside a mall
named “El Mercado”. This site provides a safe and ease access for Sun Metro’s buses to make a stop and
collect future users. However the site preferred by El Paso MPO provides a wide variety of retailed
stores and fast food services to attract new potential users.
22
Chapter 4: Bus System Reliability
Reliability of transit service is an important factor that makes public transportation attractive to
users. An unreliable transit system may lead passengers into anxiety or discomfort, cause delays and
arrival time uncertainty, and could lead to a reduction in ridership (Liu and Sinha 2007). In order to keep
a competitive service for travelers to make a mode shift from their personal transportation into taking a
bus, the bus service has to be reliable and dependable. This chapter assesses the service reliability of the
existing Sun Metro bus routes that serve the potential P&R users at the study site and make suggestions
in order to make the system more reliable. For this study the bus reliability was measured for two
different bus routes for a period of two weeks to verify whether if the system follows their fixed
schedules printed on Sun Metro’s newspaper during the morning peak period.
4.1 Bus Routes
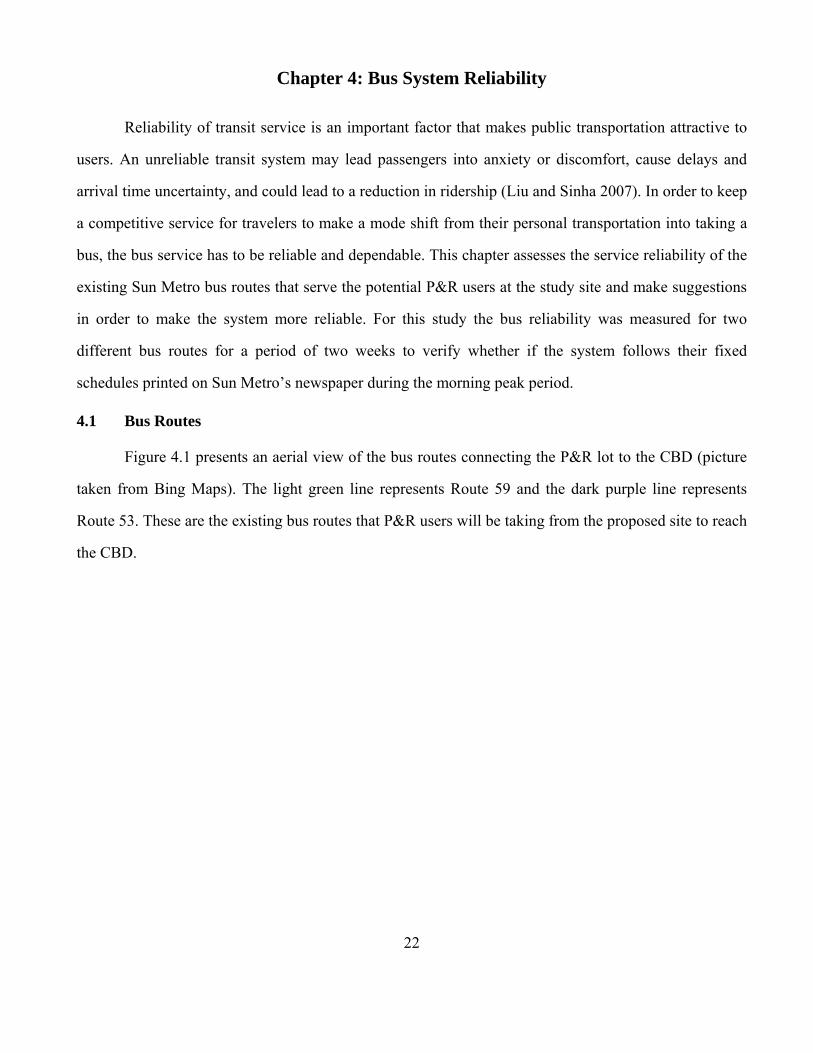
Figure 4.1 presents an aerial view of the bus routes connecting the P&R lot to the CBD (picture
taken from Bing Maps). The light green line represents Route 59 and the dark purple line represents
Route 53. These are the existing bus routes that P&R users will be taking from the proposed site to reach
the CBD.
23
Figure 4.1: View of the Buses Routes
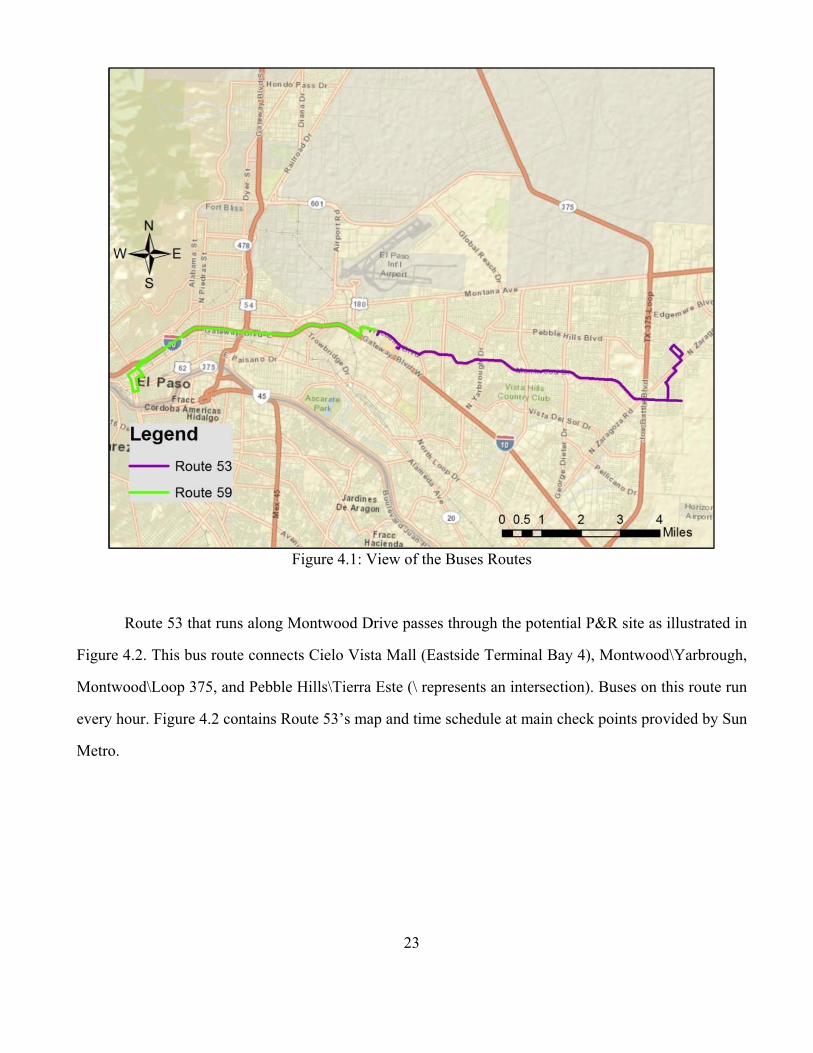
Route 53 that runs along Montwood Drive passes through the potential P&R site as illustrated in
Figure 4.2. This bus route connects Cielo Vista Mall (Eastside Terminal Bay 4), Montwood\Yarbrough,
Montwood\Loop 375, and Pebble Hills\Tierra Este (\ represents an intersection). Buses on this route run
every hour. Figure 4.2 contains Route 53’s map and time schedule at main check points provided by Sun
Metro.
24
Figure 4.2: Map and Schedule of Bus Route 53 (source: http://home.elpasotexas.gov/sunmetro)
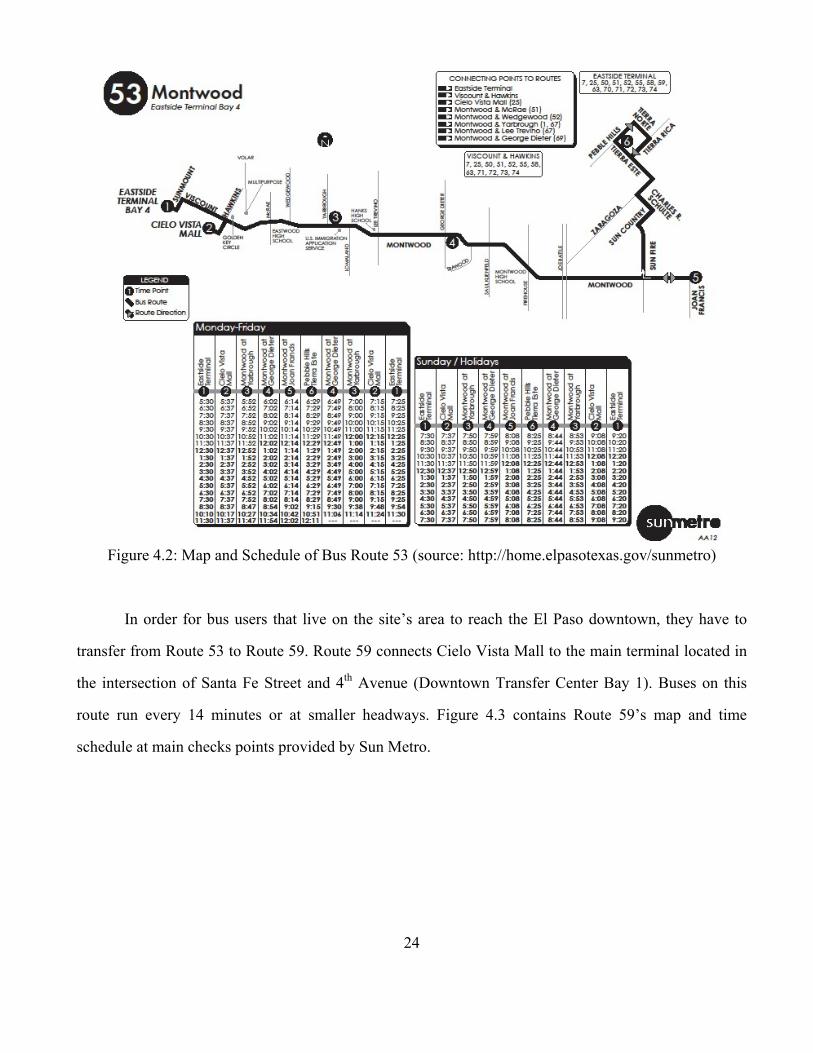
In order for bus users that live on the site’s area to reach the El Paso downtown, they have to
transfer from Route 53 to Route 59. Route 59 connects Cielo Vista Mall to the main terminal located in
the intersection of Santa Fe Street and 4th Avenue (Downtown Transfer Center Bay 1). Buses on this
route run every 14 minutes or at smaller headways. Figure 4.3 contains Route 59’s map and time
schedule at main checks points provided by Sun Metro.
25
Figure 4.3: Map and Schedule of Bus Route 59 (source: http://home.elpasotexas.gov/sunmetro)
4.2 Bus Routes Reliability Measures
Reliability is a measure of the quality of service of public transportation with factors including
waiting time and service frequency. The objective of measuring bus service reliability is to gather data
and make suggestions in order to make the bus service more consistent and dependable, that will
potentially attract P&R users. For this study, bus reliability was measured for two different buses routes
(Routes 53 and 59) for a period of two weeks in the morning peak hour to verify if the buses follow their
fixed schedules or on-time performance in the TCQSM. Sun Metro provided with a list of all the bus
stops that both of the routes make during a round trip.
26
4.2.1 On-Time Reliability Measures for Route 53
This section describes the approach used to capture the bus reliability for Route 53. Data
collection took a period of two weeks and consisted of recording the times of arrivals and departures to
the specified stations provided in the Sun Metro’s printed schedule. Furthermore, information regarding
the number of passengers boarding and alighting at each bus stop and terminal was also collected. The
next figure presents a view of the site location along with the current route of bus Route 53.
Figure 4.4: View of the Bus Stops
The following table follows the format introduced by Galicia and Vidaña (2007) at the Texas
District 2007 Summer Meeting of the Institute of Transportation Engineers. Table 4.1 illustrates a form
27
that was filled by a surveyor (with the permission of Sun Metro) that rode the bus and recorded the trip
information at each bus stop for Route 53.
The table may be explained as follows: The ID & Name column represents the intersection near
a specified bus stop. For example, the bus starts its trip at one of the main terminals. Bus stop number 1
is located near the intersection of Viscount Boulevard and Gerald Drive. The bus stops in bold represent
those bus stops that have time points (printed times on public schedule) when the bus passes through.
The Dwell Time consists of two columns: STOP and RUN. The STOP column records the actual time
that the bus arrives at that specific location in the format of hour:minute:second. The RUN column
records the actual time that the bus leaves that location after making a complete stop in the format of
hour:minute:second. The Passengers consists of two columns. The actual numbers of passengers
boarding or exiting (alighting) the buses at each stop are recorded in the Boarding and Alighting
columns respectively. The last column NOTES was intentionally placed in order to record unusual
events. This table only pertains to one traveling direction of a route. A similar table was also used for the
return trip of the bus route.
28
Table 4.1: Route 53 Information
Route 53 Montwood - Eastside Terminal Bay 4 (OUTBOUND) Date:
ID & NAME Dwell Time Passengers
NOTES STOP RUN Boarding Alighting
MS Eastside Terminal Bay 4 Start Station 1 Viscount\Gerald 2 Viscount\Grover 3 Cielo Vista Mall 4 Viscount\Viscount Village 5 9010 Viscount 6 Montwood\Turrentine 7 Montwood\Backus 8 Montwood\McIntosh 9 Montwood\Linum
10 Montwood\Wedgewood 11 Montwood\Woodfin 12 Montwood & Yarbrough 13 Montwood\Brian Mooney 14 Montwood\Cumbre Negra 15 Montwood\Lomaland 16 Montwood\Diciembre 17 Montwood\Andalucia 18 Montwood\Amy Sue 19 Montwood\Bobby Jones 20 Montwood\Tommy Aaron 21 Montwood\Robert Wynn 22 Montwood & George Dieter 23 Montwood\Lake Omega 24 Montwood\Trawood 25 Montwood\Chris Scott 26 Montwood\Piedra Roja 27 Montwood\Ralph Janes 28 Montwood\Saul Kleinfield 29 Montwood\Polly Harris 30 Montwood\Bob Mitchell 31 Montwood\Fire House 32 12140 Montwood/Zaragoza 33 Montwood\Joe Battle 34 Montwood\Desert Sun 35 Montwood/Sunfire 36 Montwood\Richard Allen 37 Montwood & Joan Francis 38 Montwood\Sun Quest 39 Sun Fire\Montwood 40 Sun Fire\Sun Terrrance 41 Sun Country\Sun Spur 42 Charles R.Schulte\Sun Country 43 Tierra Este\Tierra Grande 44 Tierra Este\Tierra Rica 45 Pebble Hills & Tierra Este Final Station
29
The TCQSM’s reliability measure for on-time performance was used to determine the LOS at the
selected stops for Route 53 that have a headway of 10 minutes or greater. The LOS criteria have been
presented in Tables 2.3, 2.4, and 2.5 respectively. As previously mentioned, the TCQSM defines “on-
time” as being 0 to 5 minutes later than the published schedule. An early departure may also be
considered as being late by the amount of the time difference from one bus to the next one scheduled
when a passenger can board a vehicle (TRB 2004). Six bus stops along Route 53’s travel path: Eastside
Terminal, Cielo Vista Mall, Montwood\Yarbrough, Montwood\George Dieter, Montwood\Joan Francis
and Pebble Hills\Tierra Este (\ represents an intersection) were selected for analysis. The travel time
information for Route 53 was collected for two weeks: the first week from January 19th 2012 to January
25th 2012 and the second week from March 12th 2012 to March 23th 2012. Only information obtained
from Monday through Friday was used. The route has an approximate distance of 10.5 miles during the
outbound trip (from Eastside Transit Terminal (1165 Sunmount Drive) to Pebble Hills Boulevard\Tierra
Este Road) and about 10.0 miles of distance for the inbound trip (from Pebble Hills Boulevard\Tierra
Este Road to Eastside Transit Terminal). During the hours of recording two buses ran the same route
with an hour apart from each other. For the selected stops, the TCQSM on-time reliability measures are
computed and shown in Table 4.2.
30
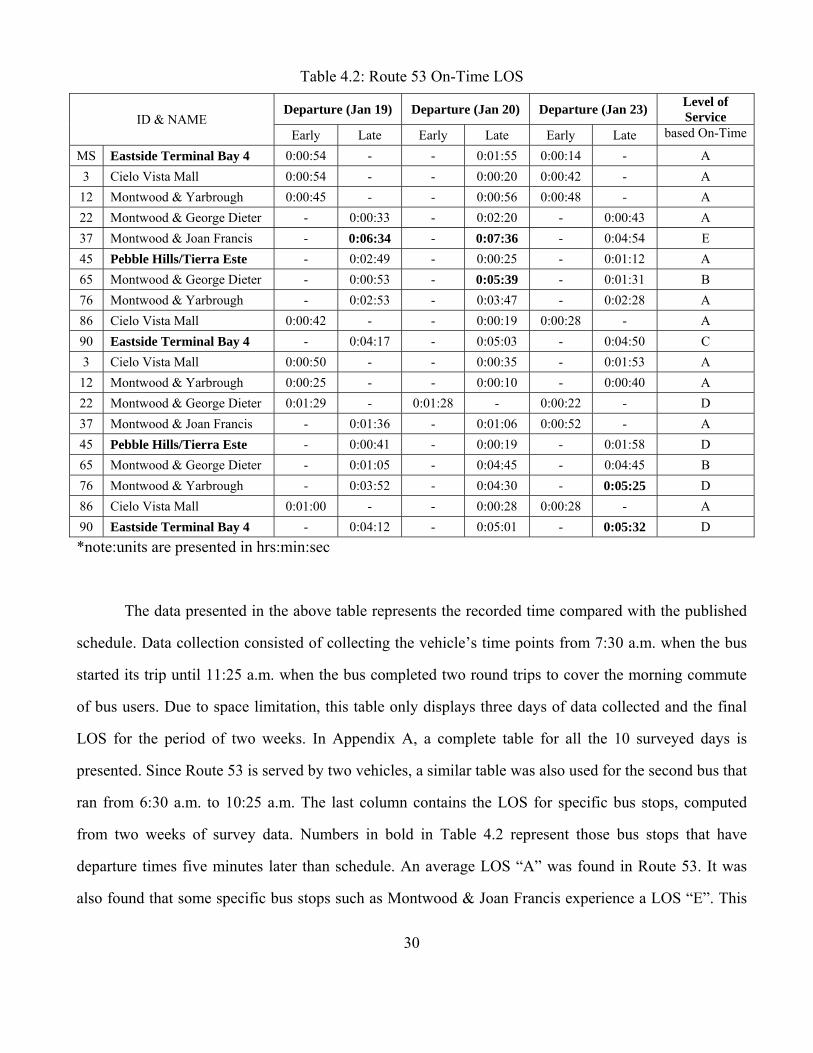
Table 4.2: Route 53 On-Time LOS
ID & NAME Departure (Jan 19) Departure (Jan 20) Departure (Jan 23)
Level of Service
Early Late Early Late Early Late based On-Time
MS Eastside Terminal Bay 4 0:00:54 - - 0:01:55 0:00:14 - A
3 Cielo Vista Mall 0:00:54 - - 0:00:20 0:00:42 - A
12 Montwood & Yarbrough 0:00:45 - - 0:00:56 0:00:48 - A
22 Montwood & George Dieter - 0:00:33 - 0:02:20 - 0:00:43 A
37 Montwood & Joan Francis - 0:06:34 - 0:07:36 - 0:04:54 E
45 Pebble Hills/Tierra Este - 0:02:49 - 0:00:25 - 0:01:12 A
65 Montwood & George Dieter - 0:00:53 - 0:05:39 - 0:01:31 B
76 Montwood & Yarbrough - 0:02:53 - 0:03:47 - 0:02:28 A
86 Cielo Vista Mall 0:00:42 - - 0:00:19 0:00:28 - A
90 Eastside Terminal Bay 4 - 0:04:17 - 0:05:03 - 0:04:50 C
3 Cielo Vista Mall 0:00:50 - - 0:00:35 - 0:01:53 A
12 Montwood & Yarbrough 0:00:25 - - 0:00:10 - 0:00:40 A
22 Montwood & George Dieter 0:01:29 - 0:01:28 - 0:00:22 - D
37 Montwood & Joan Francis - 0:01:36 - 0:01:06 0:00:52 - A
45 Pebble Hills/Tierra Este - 0:00:41 - 0:00:19 - 0:01:58 D
65 Montwood & George Dieter - 0:01:05 - 0:04:45 - 0:04:45 B
76 Montwood & Yarbrough - 0:03:52 - 0:04:30 - 0:05:25 D
86 Cielo Vista Mall 0:01:00 - - 0:00:28 0:00:28 - A
90 Eastside Terminal Bay 4 - 0:04:12 - 0:05:01 - 0:05:32 D
*note:units are presented in hrs:min:sec
The data presented in the above table represents the recorded time compared with the published
schedule. Data collection consisted of collecting the vehicle’s time points from 7:30 a.m. when the bus
started its trip until 11:25 a.m. when the bus completed two round trips to cover the morning commute
of bus users. Due to space limitation, this table only displays three days of data collected and the final
LOS for the period of two weeks. In Appendix A, a complete table for all the 10 surveyed days is
presented. Since Route 53 is served by two vehicles, a similar table was also used for the second bus that
ran from 6:30 a.m. to 10:25 a.m. The last column contains the LOS for specific bus stops, computed
from two weeks of survey data. Numbers in bold in Table 4.2 represent those bus stops that have
departure times five minutes later than schedule. An average LOS “A” was found in Route 53. It was
also found that some specific bus stops such as Montwood & Joan Francis experience a LOS “E”. This
31
change in performance from having a LOS “A” to a LOS “E” is not a consequence of the bus drivers’
unfamiliarity with driving the bus route. The variation in the bus performance only affected a portion of
the route that passed through three high schools and a middle school. The buses slowed down in the
school zones. The printed times published in the bus schedule did not reflect the actual times that that
the bus passed through those bus stops at that particular time of the day. Adjustments need to be made
only for those bus stops, an increase of five minutes to those specific bus stops is recommended.
4.2.2 On-Time Reliability Measures for Route 59
This section describes the approach used to capture the bus reliability for Route 59. Data
collection took a period of two weeks and consisted of recording the times of arrivals and departures at
only the main terminals: East Terminal (Bay 4) and Downtown Transfer Center (Bay 1). Additionally,
the numbers of passengers boarding and alighting at each terminal were also recorded.
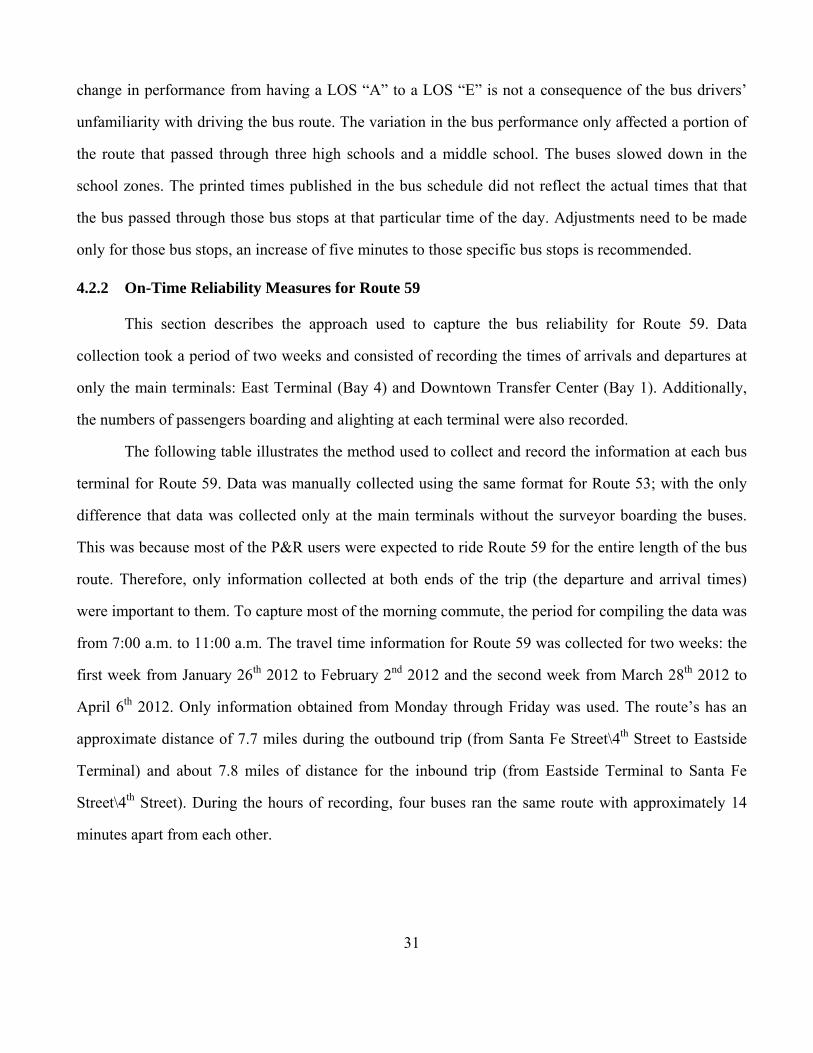
The following table illustrates the method used to collect and record the information at each bus
terminal for Route 59. Data was manually collected using the same format for Route 53; with the only
difference that data was collected only at the main terminals without the surveyor boarding the buses.
This was because most of the P&R users were expected to ride Route 59 for the entire length of the bus
route. Therefore, only information collected at both ends of the trip (the departure and arrival times)
were important to them. To capture most of the morning commute, the period for compiling the data was
from 7:00 a.m. to 11:00 a.m. The travel time information for Route 59 was collected for two weeks: the
first week from January 26th 2012 to February 2nd 2012 and the second week from March 28th 2012 to
April 6th 2012. Only information obtained from Monday through Friday was used. The route’s has an
approximate distance of 7.7 miles during the outbound trip (from Santa Fe Street\4th Street to Eastside
Terminal) and about 7.8 miles of distance for the inbound trip (from Eastside Terminal to Santa Fe
Street\4th Street). During the hours of recording, four buses ran the same route with approximately 14
minutes apart from each other.
32
Table 4.3: Route 59 Information
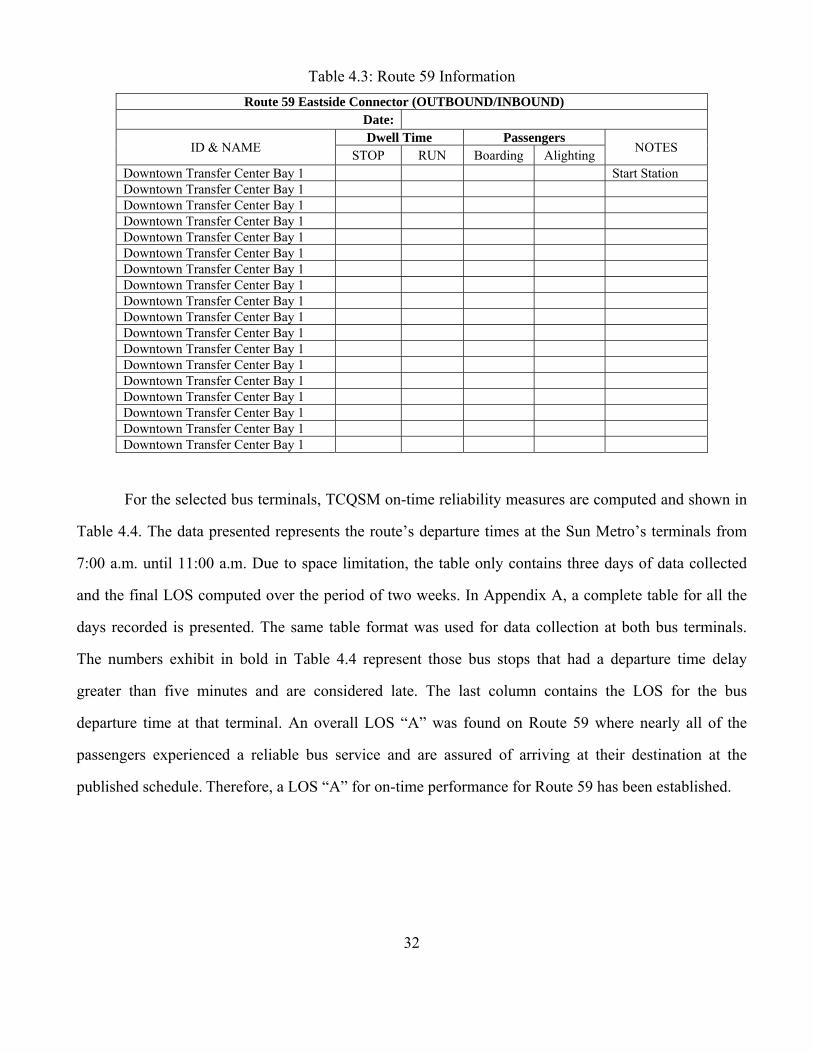
For the selected bus terminals, TCQSM on-time reliability measures are computed and shown in
Table 4.4. The data presented represents the route’s departure times at the Sun Metro’s terminals from
7:00 a.m. until 11:00 a.m. Due to space limitation, the table only contains three days of data collected
and the final LOS computed over the period of two weeks. In Appendix A, a complete table for all the
days recorded is presented. The same table format was used for data collection at both bus terminals.
The numbers exhibit in bold in Table 4.4 represent those bus stops that had a departure time delay
greater than five minutes and are considered late. The last column contains the LOS for the bus
departure time at that terminal. An overall LOS “A” was found on Route 59 where nearly all of the
passengers experienced a reliable bus service and are assured of arriving at their destination at the
published schedule. Therefore, a LOS “A” for on-time performance for Route 59 has been established.
Route 59 Eastside Connector (OUTBOUND/INBOUND) Date:
ID & NAME Dwell Time Passengers
NOTES STOP RUN Boarding Alighting
Downtown Transfer Center Bay 1 Start Station Downtown Transfer Center Bay 1 Downtown Transfer Center Bay 1 Downtown Transfer Center Bay 1 Downtown Transfer Center Bay 1 Downtown Transfer Center Bay 1 Downtown Transfer Center Bay 1 Downtown Transfer Center Bay 1 Downtown Transfer Center Bay 1 Downtown Transfer Center Bay 1 Downtown Transfer Center Bay 1 Downtown Transfer Center Bay 1 Downtown Transfer Center Bay 1 Downtown Transfer Center Bay 1 Downtown Transfer Center Bay 1 Downtown Transfer Center Bay 1 Downtown Transfer Center Bay 1 Downtown Transfer Center Bay 1
33
Table 4.4: Route 59 On-Time LOS
NAME Departure (Jan 26) Departure (Jan 27) Departure (Jan 30) Level of Service
Early Late Early Late Early Late 2 weeks
Eastside Terminal - 0:00:40 - 0:00:18 - 0:00:46 A
Eastside Terminal 0:00:47 - 0:01:50 - - 0:00:05 A
Eastside Terminal - 0:04:10 0:00:06 - 0:02:00 - A
Eastside Terminal - 0:09:15 - 0:00:13 - 0:00:09 A
Eastside Terminal - 0:00:13 - 0:01:48 0:00:02 - A
Eastside Terminal 0:01:46 - 0:00:12 - 0:00:01 - A
Eastside Terminal 0:00:07 - 0:00:56 - 0:00:47 - A
Eastside Terminal - 0:00:04 - 0:00:10 - 0:00:14 A
Eastside Terminal - 0:00:13 - 0:00:15 - 0:01:20 A
Eastside Terminal 0:00:45 - 0:00:50 - 0:00:06 - A
Eastside Terminal 0:09:45 - 0:01:58 - 0:00:03 - C
Eastside Terminal - 0:00:20 0:01:21 - - 0:00:15 A
Eastside Terminal - 0:00:20 - 0:01:17 - 0:00:45 A
Eastside Terminal 0:00:40 - 0:01:00 - 0:00:09 - A
Eastside Terminal - 0:02:50 0:00:08 - 0:00:40 - A
Eastside Terminal - 0:00:13 - 0:00:20 0:00:01 - A
Eastside Terminal - 0:00:15 - 0:00:14 - 0:00:18 A
Eastside Terminal 0:00:02 - - 0:00:09 - 0:01:09 A
4.2.3 Hours of Service Reliability Measures for El Paso Transit System
Hours of service plays an important role in determining the availability of transit service to
potential users (TRB 2004). The TCQSM reliability measure for hours of service was used to determine
the LOS at the transit service provided along the routes and service given at the main terminals that the
buses passes through. The LOS criteria for hours of service are presented Table 2.4. As mentioned in
section 2.3 of Chapter 2, “hours of service” is simply the number of hours during the day when transit
service is provided along a route, a segment of route, or between two locations. Hours of service is only
counted when service is offered essentially at hourly headway or shorter (TRB 2004).
To calculate the hours of service, when service is offered at least hourly without interruption, the
departure time of the last run is subtracted by the departure time of the first run and add one hour. The
value is then rounded down to the exact hour (TRB 2004). For the selected bus routes, TCQSM hours of
service measures were computed and shown in Table 4.5.

34
Table 4.5: Routes Hour of Service LOS
Terminals Routes First Run Last Run Subtraction Hours of Service Level of Service
Time (hrs) Time (hrs) Time (hrs) Time (hrs) based Hours of Service
Eastside Terminal 53 5:30 AM 11:30 PM 18 19 A
59 5:38 AM 8:43 PM 15 16 C Downtown
Transfer Center 59 5:10 AM 8:15 PM 15 16 C
At the Eastside Terminal a LOS “A” was found for Route 53 where passengers receive bus
service for most of the day and a LOS “C” for Route 59 where passengers receive bus service into the
early evening. The LOS “C” for hours of service for Route 59 is not a major concern as P&R users have
until 8:15 p.m. to catch the last bus from the Downtown Transfer Center.
4.2.4 Travel Time Comparison
As mentioned earlier, factors such as waiting time at terminals and how long the travel trip will
take in comparison with the automobile are important for potential transit users, hence to potential P&R
users as well. If the transit system offers a longer trip to users than by automobile, it might then be seen
as a less attractive transportation mode (TRB 2004). Many transportation systems emphasize that this
longer trip time while having to wait at terminals to board a transit system or during the trip, the users
can read, relax by not having to worry about driving during the peak hours, navigate the internet (if Wi-
Fi is enabled by the transit system), or perform other activities, etc.
Therefore, in an effort to perceive what is the difference in travel time by using a car and a transit
system one has to determine the total trip times of the user using both modes. The travel time includes
“the travel time from one’s origin to a transit stop, waiting time for a transit vehicle, travel time on-
board a vehicle, travel time from a transit stop to one’s destination, and any time required for transfers
between routes during the trip” (TRB 2004). Many factors can affect and influence the user’s total travel
time. Factors such as: the route and stop spacing (affecting the distance required to walk to transit), the
service frequency (affecting wait time), traffic congestion, signal timing, just to mention a few.
To measure the actual total trip time that potential P&R users will experience by using the P&R
mode, the following method was conducted:
35
1. The time it takes for P&R users to reach the facility and park their vehicles an origin (assumed to be
3 minutes).
2. The time it takes to wait for the bus to reach the P&R facility (assumed to be a 5 minutes).
3. The actual time when Route 53 passes through the P&R facility. This will include, in the future, the
addition time for buses to detour into the P&R lot and the dwell time at the P&R lot.
4. The time it takes for Route 53 (from the P&R bus stop) to reach Eastside Terminal.
5. The waiting time experience by the users during the transfer from Route 53 to Route 59.
6. Furthermore, the time it takes for Route 59 (from Eastside Terminal) to reach Downtown Transfer
Center.
7. The walking time distance from the bus terminal to their offices (assumed to be 5 minutes).
A study was performed to compare the P&R user’s total travel time with that of an automobile
by using the TCQSM’s reliability measures presented in Table 2.5. Different scenarios were set up to
represent cases when the P&R users may miss a transfer due to overcrowding or buses running late.
Table 4.6 exhibits the dwell time which was obtained by recording the time required for transfers
between Route 53 and Route 59 during the a trip. To collect the dwell time, two different methods were
used. The first method consisted of obtaining the dwell time by subtracting the time differences of both
routes printed on the bus schedules and the second method by subtracting the actual time that was
measure during data collection.
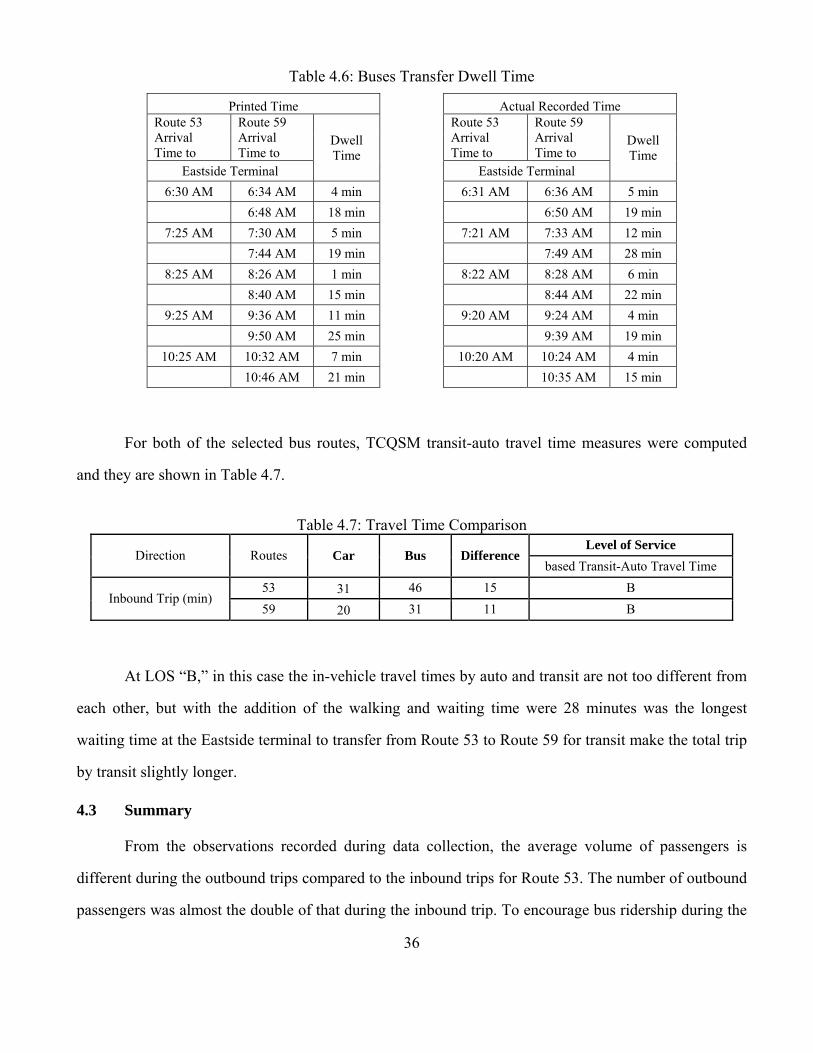
36
Table 4.6: Buses Transfer Dwell Time
Printed Time Actual Recorded Time Route 53 Arrival Time to
Route 59 Arrival Time to
Dwell Time
Route 53 Arrival Time to
Route 59 Arrival Time to
Dwell Time
Eastside Terminal Eastside Terminal
6:30 AM 6:34 AM 4 min 6:31 AM 6:36 AM 5 min
6:48 AM 18 min 6:50 AM 19 min
7:25 AM 7:30 AM 5 min 7:21 AM 7:33 AM 12 min
7:44 AM 19 min 7:49 AM 28 min
8:25 AM 8:26 AM 1 min 8:22 AM 8:28 AM 6 min
8:40 AM 15 min 8:44 AM 22 min
9:25 AM 9:36 AM 11 min 9:20 AM 9:24 AM 4 min
9:50 AM 25 min 9:39 AM 19 min
10:25 AM 10:32 AM 7 min 10:20 AM 10:24 AM 4 min
10:46 AM 21 min 10:35 AM 15 min
For both of the selected bus routes, TCQSM transit-auto travel time measures were computed
and they are shown in Table 4.7.
Table 4.7: Travel Time Comparison
Direction Routes Car Bus Difference Level of Service
based Transit-Auto Travel Time
Inbound Trip (min) 53 31 46 15 B
59 20 31 11 B
At LOS “B,” in this case the in-vehicle travel times by auto and transit are not too different from
each other, but with the addition of the walking and waiting time were 28 minutes was the longest
waiting time at the Eastside terminal to transfer from Route 53 to Route 59 for transit make the total trip
by transit slightly longer.
4.3 Summary
From the observations recorded during data collection, the average volume of passengers is
different during the outbound trips compared to the inbound trips for Route 53. The number of outbound
passengers was almost the double of that during the inbound trip. To encourage bus ridership during the
37
inbound trip, two alternatives were recommended: an increase in the bus frequency (during both the
morning and afternoon peak commute periods), and longer distances between bus stops during the trip,
might have a positive impact for ridership (between Joe Battle Boulevard and the CBD area).
Presently, Route 53 runs at time intervals of an hour apart from each other. To improve the
transit service and attract new users for the projected P&R facility an increase in bus frequency is
suggested. From section 4.2.1, during data collection it was observed that a total of 60 bus users were
the maximum passenger count during the outbound part of the trip at 8:30 a.m. Hence, during the
inbound trip, a total of 30 bus users were the most. Assuming the same bus ridership during the hours of
service, with the addition of P&R users, the number of available seats inside the bus may not be
adequate. Each Sun Metro bus is equipped with approximately 64 seats. Therefore, to ensure all bus
users have seats while riding the buses, Sun Metro may need to increase the frequency of service during
the morning commuting period. Using two more buses to serve Route 53 is suggested with buses
running 30 minutes apart from each other.
Another possible way to improve service reliability for P&R users is to provide a direct route
(express service) from the P&R site location to the El Paso CDB. This would offer potential P&R users
a faster travel time, making P&R more competitive compared to using private car.

38
Chapter 5: Site Parking Supply Analysis
A useful method for measuring and evaluating a potential P&R site’s performance is to conduct
a parking study to assure successful community integration and efficient facility operations. The parking
study consists of a series of steps that examine the capacity and use of existing parking facility, the
adequacy of access and egress, the influence of such facilities on traffic flow in and around the location,
and the effect and desirability of modifying the parking supply (Homburger et al. 1992). A parking study
was performed at the proposed P&R facility site to demonstrate the steps taken in the analysis. The
chapter covers several parts: parking inventory, parking accumulation and parking duration, adequacy of
access, and finally traffic and transit circulation.
5.1 Parking Inventory and Size
The portion of the parking lot highlighted by a green rectangle in Figure 5.1 contains a total of
168 parking spaces for potential P&R use. This area selected is a distance away from the stores so that
the P&R operations will not affect the regular store customers.
Figure 5.1: View of Potential P&R Lot
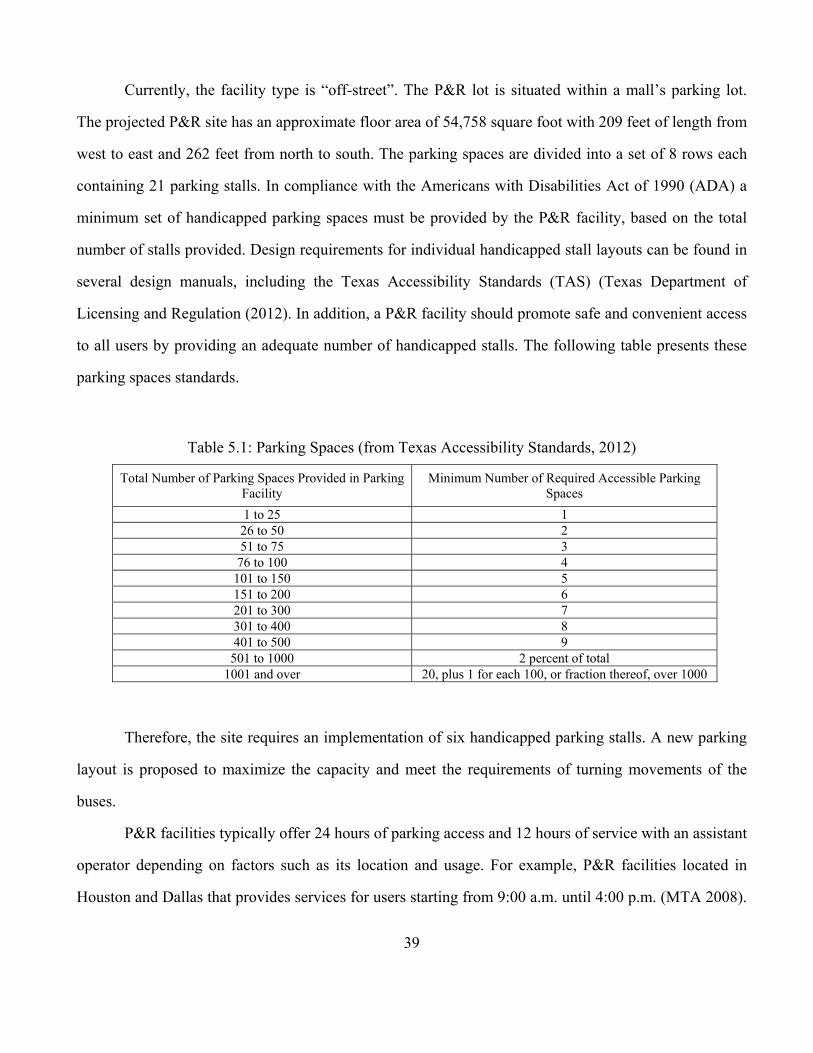
39
Currently, the facility type is “off-street”. The P&R lot is situated within a mall’s parking lot.
The projected P&R site has an approximate floor area of 54,758 square foot with 209 feet of length from
west to east and 262 feet from north to south. The parking spaces are divided into a set of 8 rows each
containing 21 parking stalls. In compliance with the Americans with Disabilities Act of 1990 (ADA) a
minimum set of handicapped parking spaces must be provided by the P&R facility, based on the total
number of stalls provided. Design requirements for individual handicapped stall layouts can be found in
several design manuals, including the Texas Accessibility Standards (TAS) (Texas Department of
Licensing and Regulation (2012). In addition, a P&R facility should promote safe and convenient access
to all users by providing an adequate number of handicapped stalls. The following table presents these
parking spaces standards.
Table 5.1: Parking Spaces (from Texas Accessibility Standards, 2012)
Total Number of Parking Spaces Provided in Parking Facility
Minimum Number of Required Accessible Parking Spaces
1 to 25 1 26 to 50 2 51 to 75 3
76 to 100 4 101 to 150 5 151 to 200 6 201 to 300 7 301 to 400 8 401 to 500 9 501 to 1000 2 percent of total
1001 and over 20, plus 1 for each 100, or fraction thereof, over 1000
Therefore, the site requires an implementation of six handicapped parking stalls. A new parking
layout is proposed to maximize the capacity and meet the requirements of turning movements of the
buses.
P&R facilities typically offer 24 hours of parking access and 12 hours of service with an assistant
operator depending on factors such as its location and usage. For example, P&R facilities located in
Houston and Dallas that provides services for users starting from 9:00 a.m. until 4:00 p.m. (MTA 2008).
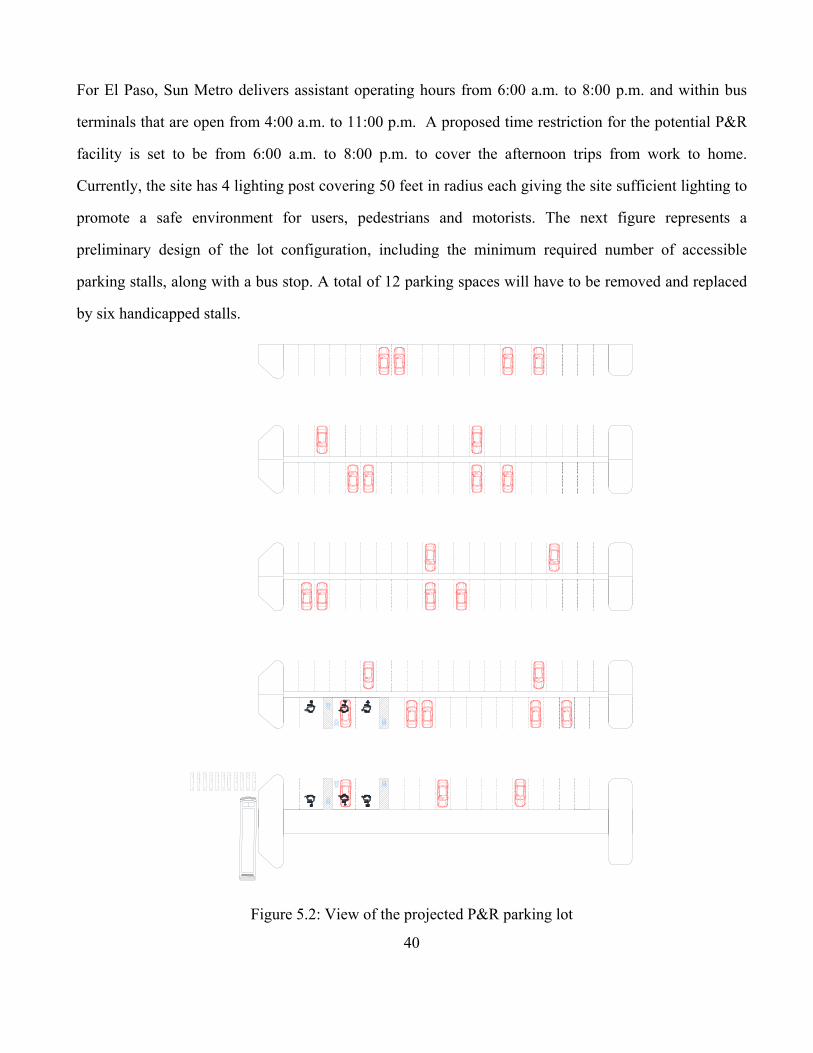
40
For El Paso, Sun Metro delivers assistant operating hours from 6:00 a.m. to 8:00 p.m. and within bus
terminals that are open from 4:00 a.m. to 11:00 p.m. A proposed time restriction for the potential P&R
facility is set to be from 6:00 a.m. to 8:00 p.m. to cover the afternoon trips from work to home.
Currently, the site has 4 lighting post covering 50 feet in radius each giving the site sufficient lighting to
promote a safe environment for users, pedestrians and motorists. The next figure represents a
preliminary design of the lot configuration, including the minimum required number of accessible
parking stalls, along with a bus stop. A total of 12 parking spaces will have to be removed and replaced
by six handicapped stalls.
Figure 5.2: View of the projected P&R parking lot
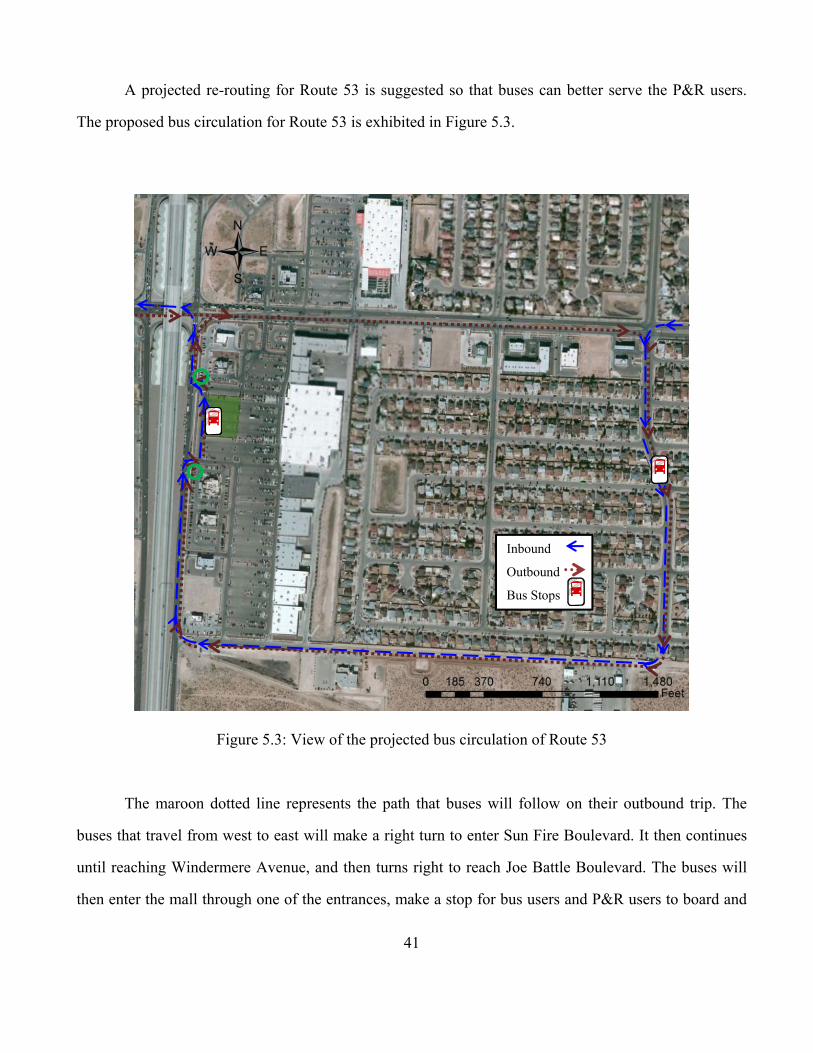
41
A projected re-routing for Route 53 is suggested so that buses can better serve the P&R users.
The proposed bus circulation for Route 53 is exhibited in Figure 5.3.
Figure 5.3: View of the projected bus circulation of Route 53
The maroon dotted line represents the path that buses will follow on their outbound trip. The
buses that travel from west to east will make a right turn to enter Sun Fire Boulevard. It then continues
until reaching Windermere Avenue, and then turns right to reach Joe Battle Boulevard. The buses will
then enter the mall through one of the entrances, make a stop for bus users and P&R users to board and
Inbound
Outbound
Bus Stops
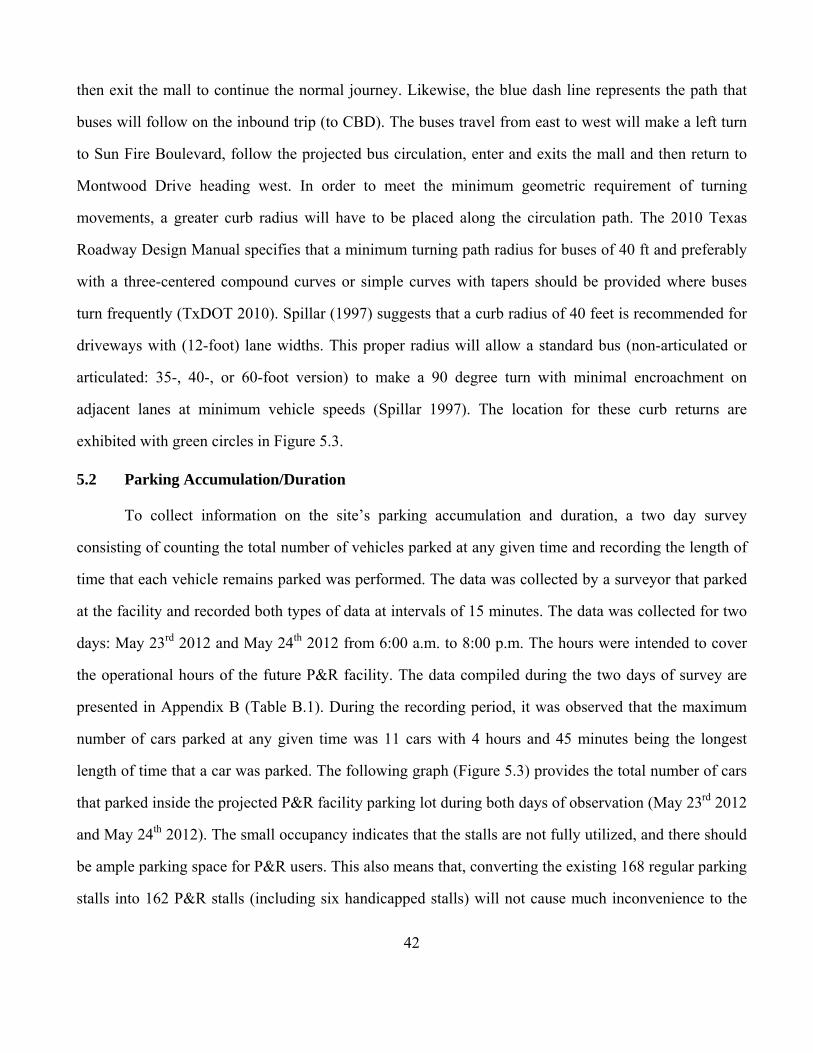
42
then exit the mall to continue the normal journey. Likewise, the blue dash line represents the path that
buses will follow on the inbound trip (to CBD). The buses travel from east to west will make a left turn
to Sun Fire Boulevard, follow the projected bus circulation, enter and exits the mall and then return to
Montwood Drive heading west. In order to meet the minimum geometric requirement of turning
movements, a greater curb radius will have to be placed along the circulation path. The 2010 Texas
Roadway Design Manual specifies that a minimum turning path radius for buses of 40 ft and preferably
with a three-centered compound curves or simple curves with tapers should be provided where buses
turn frequently (TxDOT 2010). Spillar (1997) suggests that a curb radius of 40 feet is recommended for
driveways with (12-foot) lane widths. This proper radius will allow a standard bus (non-articulated or
articulated: 35-, 40-, or 60-foot version) to make a 90 degree turn with minimal encroachment on
adjacent lanes at minimum vehicle speeds (Spillar 1997). The location for these curb returns are
exhibited with green circles in Figure 5.3.
5.2 Parking Accumulation/Duration
To collect information on the site’s parking accumulation and duration, a two day survey
consisting of counting the total number of vehicles parked at any given time and recording the length of
time that each vehicle remains parked was performed. The data was collected by a surveyor that parked
at the facility and recorded both types of data at intervals of 15 minutes. The data was collected for two
days: May 23rd 2012 and May 24th 2012 from 6:00 a.m. to 8:00 p.m. The hours were intended to cover
the operational hours of the future P&R facility. The data compiled during the two days of survey are
presented in Appendix B (Table B.1). During the recording period, it was observed that the maximum
number of cars parked at any given time was 11 cars with 4 hours and 45 minutes being the longest
length of time that a car was parked. The following graph (Figure 5.3) provides the total number of cars
that parked inside the projected P&R facility parking lot during both days of observation (May 23rd 2012
and May 24th 2012). The small occupancy indicates that the stalls are not fully utilized, and there should
be ample parking space for P&R users. This also means that, converting the existing 168 regular parking
stalls into 162 P&R stalls (including six handicapped stalls) will not cause much inconvenience to the
43
existing parkers. Instead, the P&R stalls may generate additional revenues for the property owners
(through lease) and store owners.
Figure 5.4: Number of vehicles parked at any given time (from 6:00 a.m. to 8:00 p.m.)
5.3 Site Access
An optimal design for a P&R facility should include: having the appropriate lot size for transit
vehicles to maneuver, adequate transit access and egress, an efficient internal circulation system, and
appropriate stall dimensions (Spillar 1997). The existing mall has two entrances and exits located along
Montwood Drive, three along Joe Battle Boulevard and two along Windermere Avenue. All of the
entrances and exits consist of two 12-foot lanes. There are standards for the minimum throat width
(entrance and exit) for geometrics designs to driveways. The Texas Roadway Design Manual’s
Appendix C Section 3 (TxDOT 2010) provides a guideline for two-way commercial driveways: a
0
2
4
6
8
10
126:
00 A
M6:
30 A
M7:
00 A
M7:
30 A
M8:
00 A
M8:
30 A
M9:
00 A
M9:
30 A
M10
:00
AM
10:3
0 A
M11
:00
AM
11:3
0 A
M12
:00
PM
12:3
0 P
M1:
00 P
M1:
30 P
M2:
00 P
M2:
30 P
M3:
00 P
M3:
30 P
M4:
00 P
M4:
30 P
M5:
00 P
M5:
30 P
M6:
00 P
M6:
30 P
M7:
00 P
M7:
30 P
M8:
00 P
M
Nu
mb
er o
f ve
hic
les
par
ked
Time of the Day
5/23/2012
5/24/2012
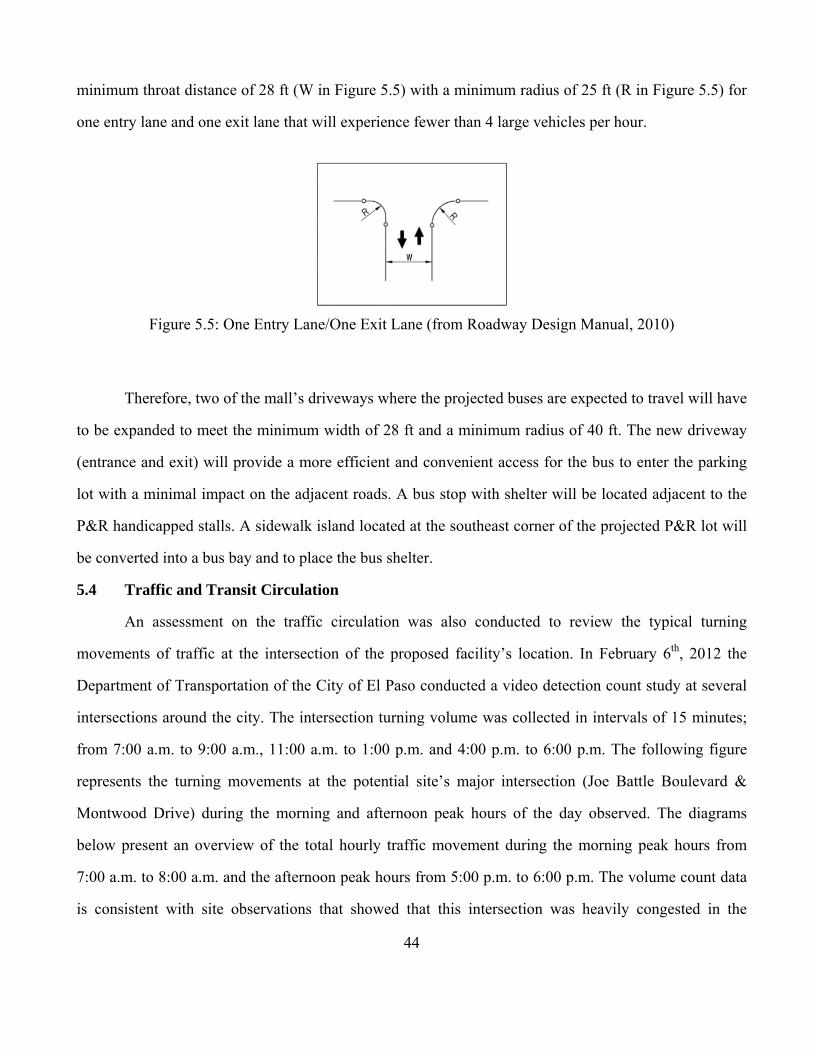
44
minimum throat distance of 28 ft (W in Figure 5.5) with a minimum radius of 25 ft (R in Figure 5.5) for
one entry lane and one exit lane that will experience fewer than 4 large vehicles per hour.
Figure 5.5: One Entry Lane/One Exit Lane (from Roadway Design Manual, 2010)
Therefore, two of the mall’s driveways where the projected buses are expected to travel will have
to be expanded to meet the minimum width of 28 ft and a minimum radius of 40 ft. The new driveway
(entrance and exit) will provide a more efficient and convenient access for the bus to enter the parking
lot with a minimal impact on the adjacent roads. A bus stop with shelter will be located adjacent to the
P&R handicapped stalls. A sidewalk island located at the southeast corner of the projected P&R lot will
be converted into a bus bay and to place the bus shelter.
5.4 Traffic and Transit Circulation
An assessment on the traffic circulation was also conducted to review the typical turning
movements of traffic at the intersection of the proposed facility’s location. In February 6th, 2012 the
Department of Transportation of the City of El Paso conducted a video detection count study at several
intersections around the city. The intersection turning volume was collected in intervals of 15 minutes;
from 7:00 a.m. to 9:00 a.m., 11:00 a.m. to 1:00 p.m. and 4:00 p.m. to 6:00 p.m. The following figure
represents the turning movements at the potential site’s major intersection (Joe Battle Boulevard &
Montwood Drive) during the morning and afternoon peak hours of the day observed. The diagrams
below present an overview of the total hourly traffic movement during the morning peak hours from
7:00 a.m. to 8:00 a.m. and the afternoon peak hours from 5:00 p.m. to 6:00 p.m. The volume count data
is consistent with site observations that showed that this intersection was heavily congested in the
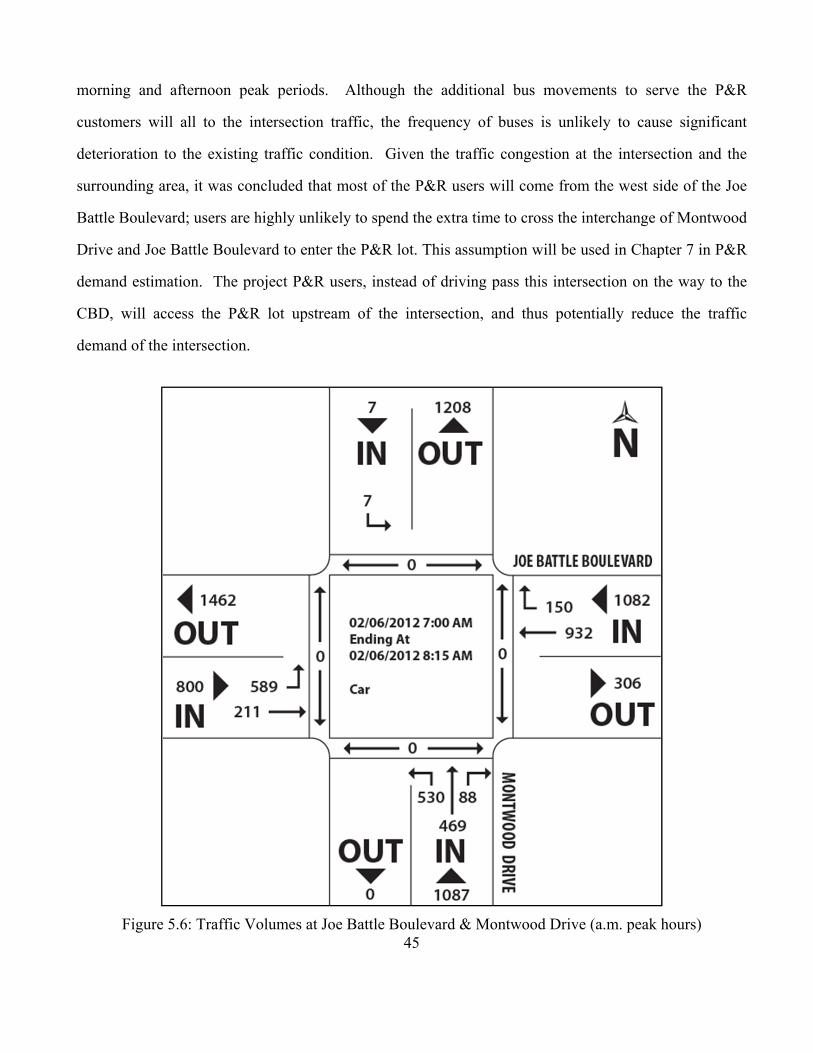
45
morning and afternoon peak periods. Although the additional bus movements to serve the P&R
customers will all to the intersection traffic, the frequency of buses is unlikely to cause significant
deterioration to the existing traffic condition. Given the traffic congestion at the intersection and the
surrounding area, it was concluded that most of the P&R users will come from the west side of the Joe
Battle Boulevard; users are highly unlikely to spend the extra time to cross the interchange of Montwood
Drive and Joe Battle Boulevard to enter the P&R lot. This assumption will be used in Chapter 7 in P&R
demand estimation. The project P&R users, instead of driving pass this intersection on the way to the
CBD, will access the P&R lot upstream of the intersection, and thus potentially reduce the traffic
demand of the intersection.
Figure 5.6: Traffic Volumes at Joe Battle Boulevard & Montwood Drive (a.m. peak hours)
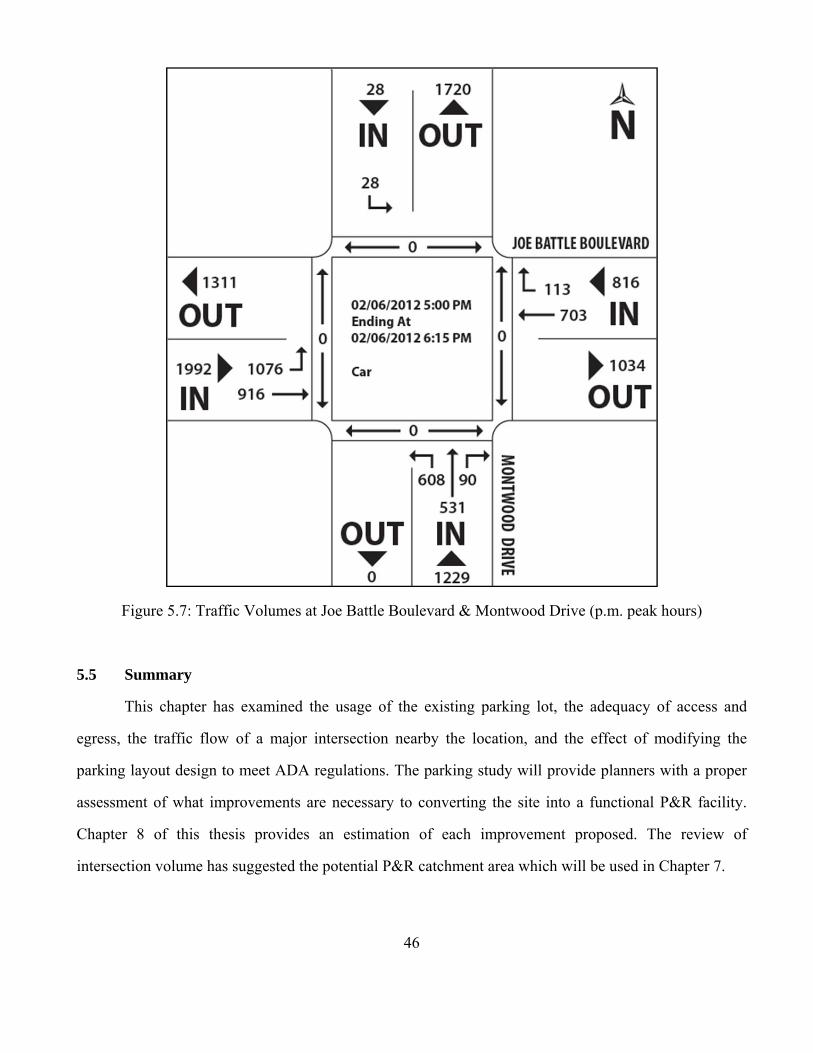
46
Figure 5.7: Traffic Volumes at Joe Battle Boulevard & Montwood Drive (p.m. peak hours)
5.5 Summary
This chapter has examined the usage of the existing parking lot, the adequacy of access and
egress, the traffic flow of a major intersection nearby the location, and the effect of modifying the
parking layout design to meet ADA regulations. The parking study will provide planners with a proper
assessment of what improvements are necessary to converting the site into a functional P&R facility.
Chapter 8 of this thesis provides an estimation of each improvement proposed. The review of
intersection volume has suggested the potential P&R catchment area which will be used in Chapter 7.

47
Chapter 6: Development of a Park and Ride Choice Model
In an effort to evaluate the willingness of car users from El Paso to make use of P&R facilities, a
questionnaire survey was conducted. In essence, this research is targeted at potential P&R users as well
as non-users (i.e., car users that are not ready to switch from their cars into taking a transit system). A
survey instrument consisting of different sets of questions was designed for the unique characteristics of
each group of respondents. The data gathered from the survey was used to develop a discrete choice
model which is described in the later part of this chapter.
6.1 Survey Questions
Since the survey respondents were not expected to have an understanding of what is a P&R, it
was therefore essential that the surveyors, prior to conducting the survey explained the concept of P&R
to the participants. Furthermore, given the demographic characteristics of the city’s population, the
surveyors conducted some of the interviews in Spanish. The survey questions were available in both
English and Spanish, as shown in Appendices C and D, respectively. The survey questions and their
forms were drafted and tested with several respondents before being revised to their final versions. To
keep the surveys to within 5 minutes (including the time to explain the concept of P&R), the
questionnaires were limited to 15 questions.
The first set of questions entitled “Section A: About Yourself” consisted of seven questions
related to the respondent’s demographic profile: gender, age group, household income, level of
education, number of people in the household, number of vehicles in the household, and his/her
residential zip code. The following part, “Section B”, composed of three questions related to the
respondent’s daily commute: typical driving distance to work, typical driving time to work, and their
most frequent mode of transportation. The next portion of the survey, “Section C”, gauged the
respondents’ willingness to use a P&R facility. If the respondent answered “no,” he/she would then
proceed to question 13. If the respondent was interested in using P&R, the survey continued by asking
more specific questions as to why they would be willing to use P&R. The last section, “Section D”,
48
contained only two questions related to the respondent’s frequency of using a public transit system, if
applicable.
6.2 Analysis of Survey Results
Questionnaire surveys were conducted at the following dates, February 16th, 20th, 22nd, 23rd, 27th,
2012, by a team of four surveyors at the following locations in El Paso:
Sun Metro’s Downtown Transfer Terminal (a bus terminal),
Sun Metro’s Eastside Terminal (a bus terminal),
The University of Texas at El Paso (UTEP) campus.
Each day, surveyors were assigned to specific locations during the respective morning peak
hours. To recruit a participant, the surveyor approached a potential respondent, explained the project
background and the concept of P&R, and then asked for his/her consent to participate. If the participant
was willing to take part in the survey, the surveyor then asked the questions and wrote down his/her
answers. At the end of every day, the surveyors brought the completed forms back to the laboratory and
entered the data into a web-based survey tool (www.surveymonkey.com). In this way, the data collected
by all the surveyors were deposited into a central database for analysis.
The research team received a total of 447 responses from the surveys (both English and Spanish
combined).
Section A of the survey contained questions that asked about the respondent’s demographic
profile. Question 1 asked the respondent’s for the age group that best described him/her. The age
distributions of male and female participants are plotted in Figure 6.1. The histogram is based on the age
group information provided by the 447 respondents. As expected, the majority of participants are from
the younger age groups (younger than 24, and 25 to 34 years of age).
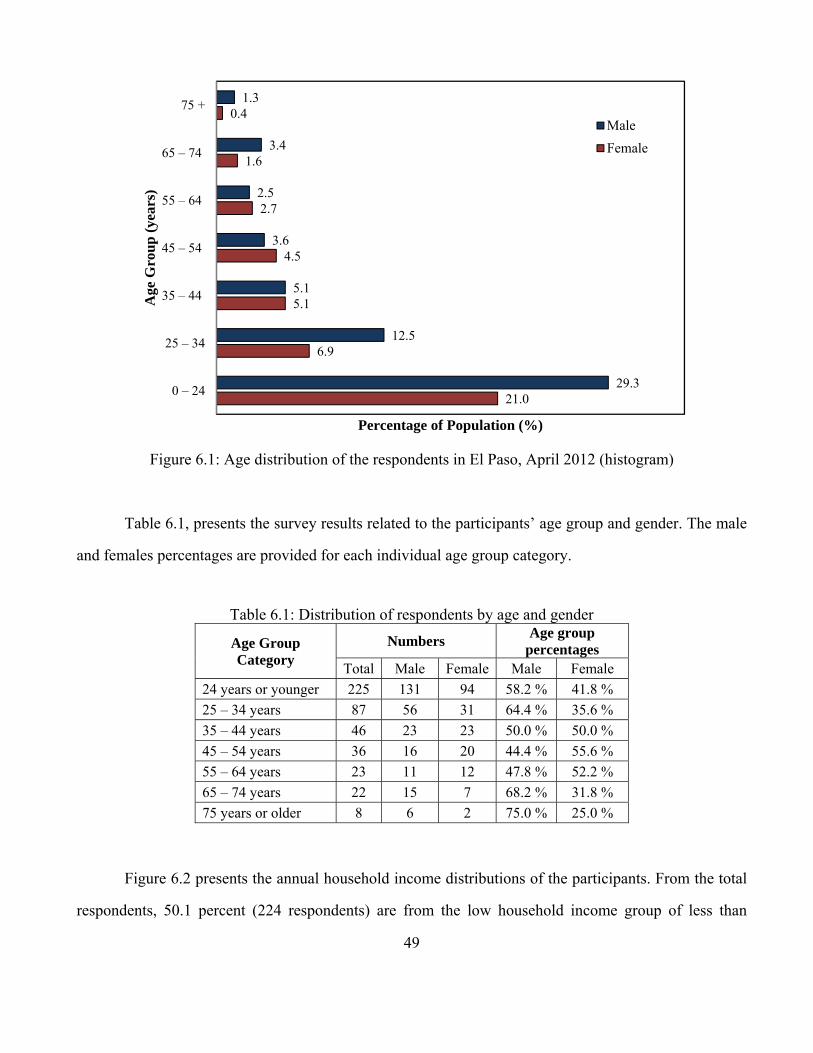
49
Figure 6.1: Age distribution of the respondents in El Paso, April 2012 (histogram)
Table 6.1, presents the survey results related to the participants’ age group and gender. The male
and females percentages are provided for each individual age group category.
Table 6.1: Distribution of respondents by age and gender
Age Group Category
Numbers Age group
percentages Total Male Female Male Female
24 years or younger 225 131 94 58.2 % 41.8 %
25 – 34 years 87 56 31 64.4 % 35.6 %
35 – 44 years 46 23 23 50.0 % 50.0 %
45 – 54 years 36 16 20 44.4 % 55.6 %
55 – 64 years 23 11 12 47.8 % 52.2 %
65 – 74 years 22 15 7 68.2 % 31.8 %
75 years or older 8 6 2 75.0 % 25.0 %
Figure 6.2 presents the annual household income distributions of the participants. From the total
respondents, 50.1 percent (224 respondents) are from the low household income group of less than
21.0
6.9
5.1
4.5
2.7
1.6
0.4
29.3
12.5
5.1
3.6
2.5
3.4
1.3
0 – 24
25 – 34
35 – 44
45 – 54
55 – 64
65 – 74
75 +
Percentage of Population (%)
Age
Gro
up
(ye
ars)
Male
Female
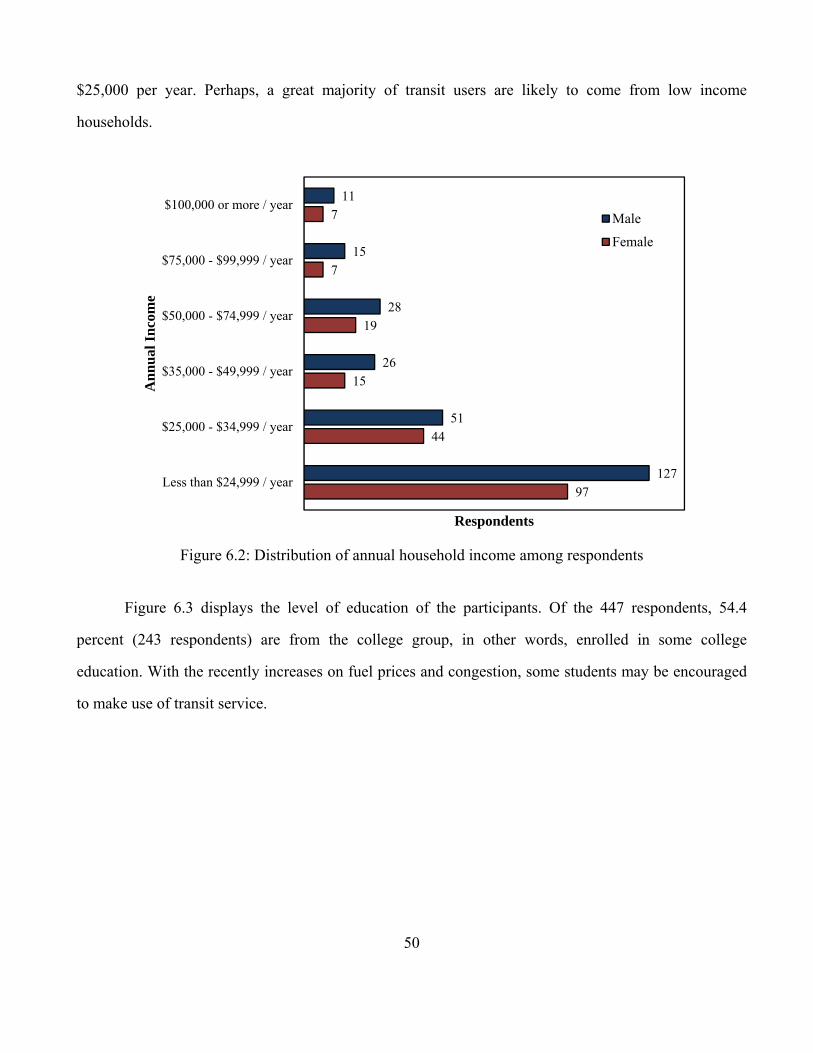
50
$25,000 per year. Perhaps, a great majority of transit users are likely to come from low income
households.
Figure 6.2: Distribution of annual household income among respondents
Figure 6.3 displays the level of education of the participants. Of the 447 respondents, 54.4
percent (243 respondents) are from the college group, in other words, enrolled in some college
education. With the recently increases on fuel prices and congestion, some students may be encouraged
to make use of transit service.
97
44
15
19
7
7
127
51
26
28
15
11
Less than $24,999 / year
$25,000 - $34,999 / year
$35,000 - $49,999 / year
$50,000 - $74,999 / year
$75,000 - $99,999 / year
$100,000 or more / year
Respondents
An
nu
al I
nco
me
Male
Female
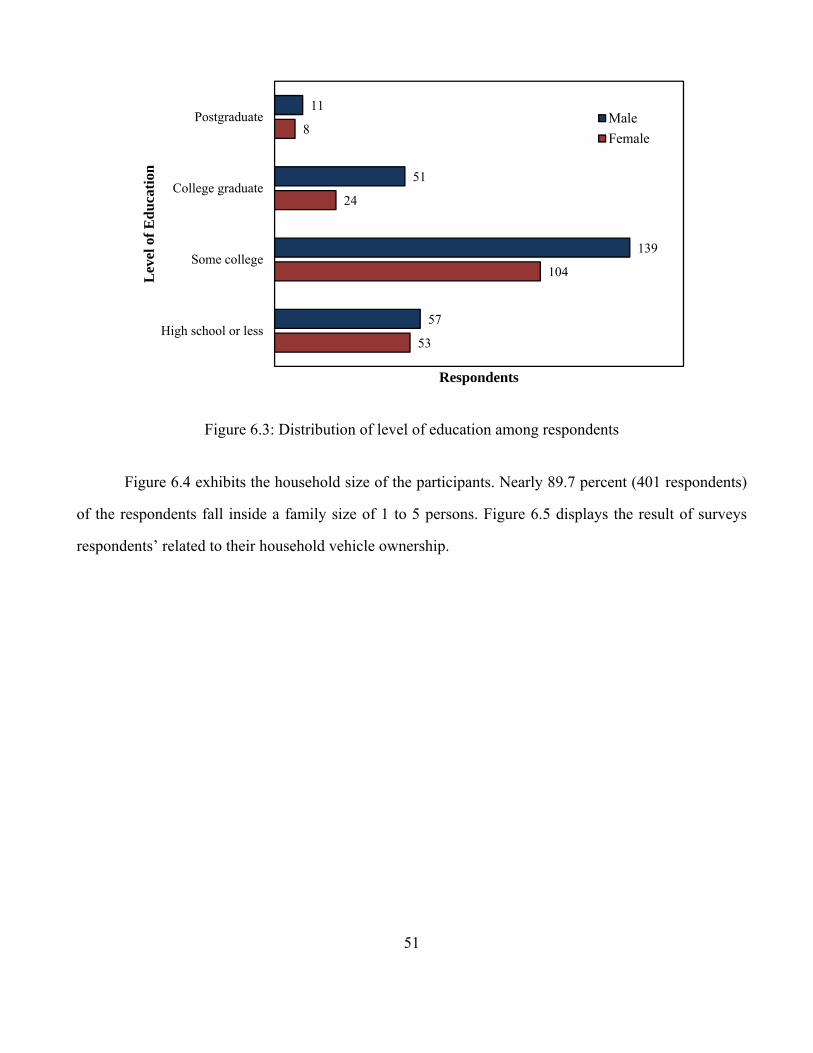
51
Figure 6.3: Distribution of level of education among respondents
Figure 6.4 exhibits the household size of the participants. Nearly 89.7 percent (401 respondents)
of the respondents fall inside a family size of 1 to 5 persons. Figure 6.5 displays the result of surveys
respondents’ related to their household vehicle ownership.
53
104
24
8
57
139
51
11
High school or less
Some college
College graduate
Postgraduate
Respondents
Lev
el o
f E
du
cati
on
Male
Female

52
Figure 6.4: Distribution of household size among respondents
Figure 6.5: Distribution of vehicles owned among respondents
164
21
3
1
237
19
1
1
1-5 persons
6-10 persons
11-15 persons
16-20 persons
Respondents
Hou
seh
old
Siz
e
Male
Female
26
38
59
40
17
9
22
54
79
47
33
23
0
1
2
3
4
5 or more
Respondents
Veh
icle
s O
wn
ed
Male
Female
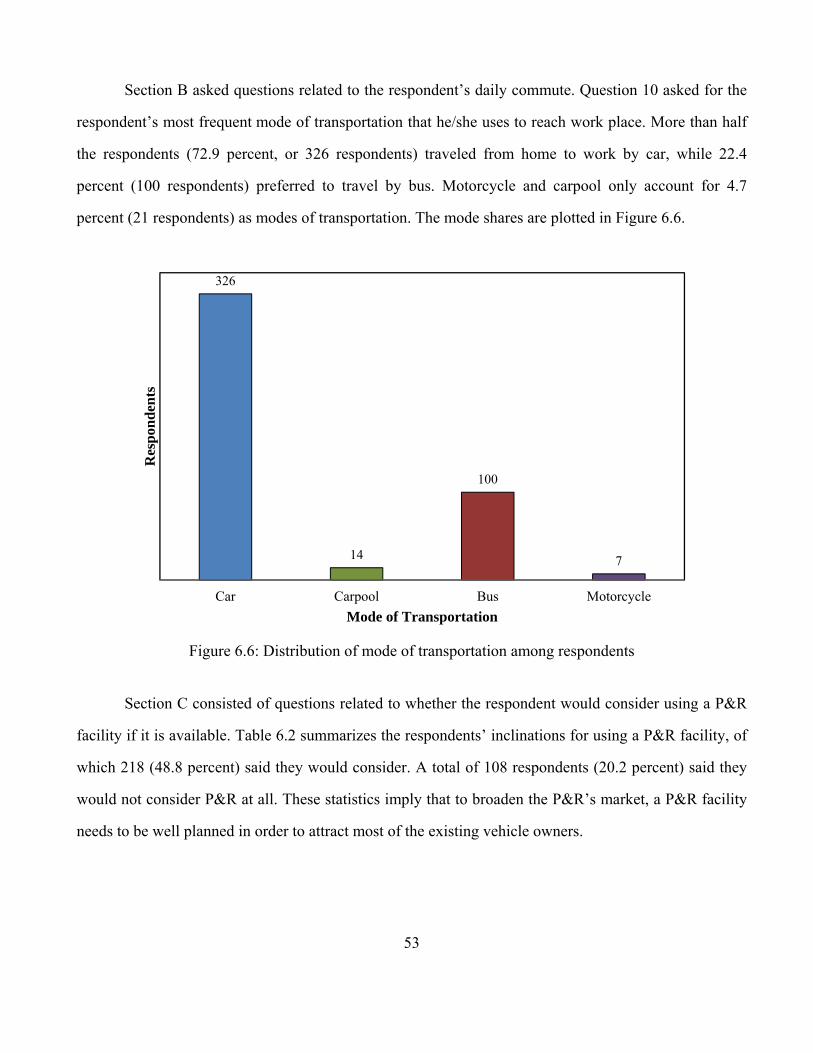
53
Section B asked questions related to the respondent’s daily commute. Question 10 asked for the
respondent’s most frequent mode of transportation that he/she uses to reach work place. More than half
the respondents (72.9 percent, or 326 respondents) traveled from home to work by car, while 22.4
percent (100 respondents) preferred to travel by bus. Motorcycle and carpool only account for 4.7
percent (21 respondents) as modes of transportation. The mode shares are plotted in Figure 6.6.
Figure 6.6: Distribution of mode of transportation among respondents
Section C consisted of questions related to whether the respondent would consider using a P&R
facility if it is available. Table 6.2 summarizes the respondents’ inclinations for using a P&R facility, of
which 218 (48.8 percent) said they would consider. A total of 108 respondents (20.2 percent) said they
would not consider P&R at all. These statistics imply that to broaden the P&R’s market, a P&R facility
needs to be well planned in order to attract most of the existing vehicle owners.
326
14
100
7
Car Carpool Bus Motorcycle
Res
pon
den
ts
Mode of Transportation
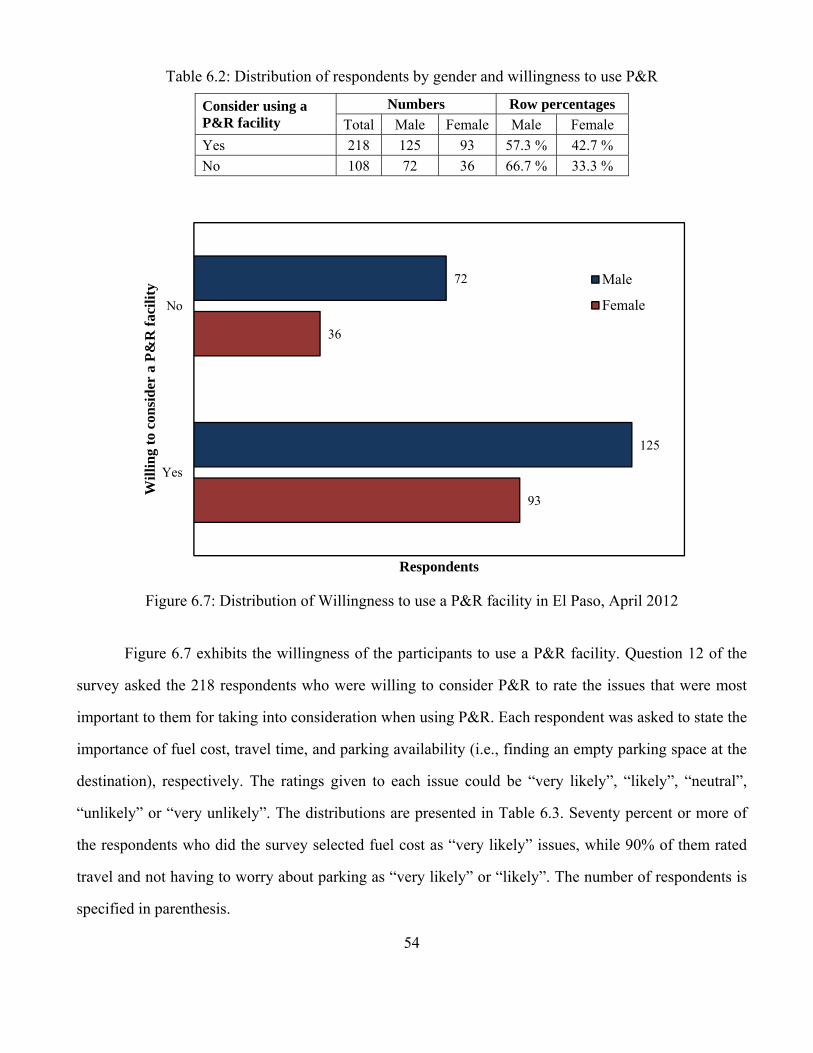
54
Table 6.2: Distribution of respondents by gender and willingness to use P&R
Consider using a P&R facility
Numbers Row percentages
Total Male Female Male Female
Yes 218 125 93 57.3 % 42.7 %
No 108 72 36 66.7 % 33.3 %
Figure 6.7: Distribution of Willingness to use a P&R facility in El Paso, April 2012
Figure 6.7 exhibits the willingness of the participants to use a P&R facility. Question 12 of the
survey asked the 218 respondents who were willing to consider P&R to rate the issues that were most
important to them for taking into consideration when using P&R. Each respondent was asked to state the
importance of fuel cost, travel time, and parking availability (i.e., finding an empty parking space at the
destination), respectively. The ratings given to each issue could be “very likely”, “likely”, “neutral”,
“unlikely” or “very unlikely”. The distributions are presented in Table 6.3. Seventy percent or more of
the respondents who did the survey selected fuel cost as “very likely” issues, while 90% of them rated
travel and not having to worry about parking as “very likely” or “likely”. The number of respondents is
specified in parenthesis.
93
36
125
72
Yes
No
Respondents
Wil
lin
g to
con
sid
er a
P&
R f
acil
ity Male
Female
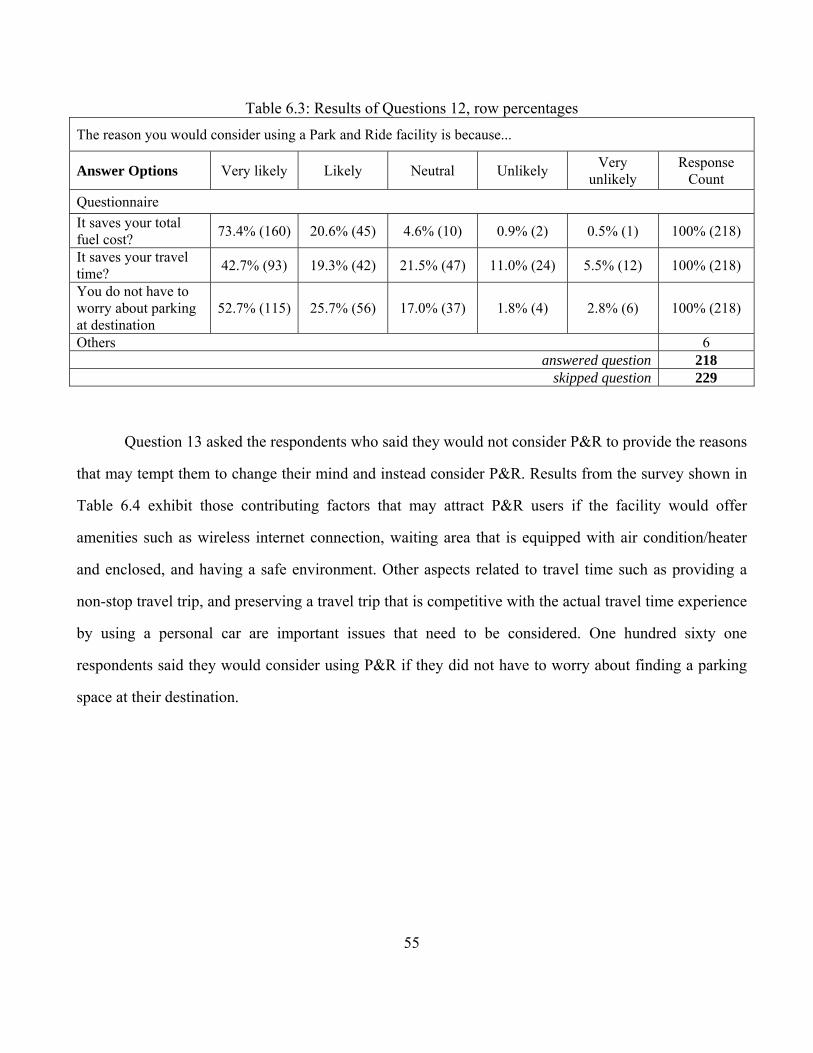
55
Table 6.3: Results of Questions 12, row percentages
The reason you would consider using a Park and Ride facility is because...
Answer Options Very likely Likely Neutral Unlikely Very
unlikely Response
Count
Questionnaire
It saves your total fuel cost?
73.4% (160) 20.6% (45) 4.6% (10) 0.9% (2) 0.5% (1) 100% (218)
It saves your travel time?
42.7% (93) 19.3% (42) 21.5% (47) 11.0% (24) 5.5% (12) 100% (218)
You do not have to worry about parking at destination
52.7% (115) 25.7% (56) 17.0% (37) 1.8% (4) 2.8% (6) 100% (218)
Others 6 answered question 218
skipped question 229
Question 13 asked the respondents who said they would not consider P&R to provide the reasons
that may tempt them to change their mind and instead consider P&R. Results from the survey shown in
Table 6.4 exhibit those contributing factors that may attract P&R users if the facility would offer
amenities such as wireless internet connection, waiting area that is equipped with air condition/heater
and enclosed, and having a safe environment. Other aspects related to travel time such as providing a
non-stop travel trip, and preserving a travel trip that is competitive with the actual travel time experience
by using a personal car are important issues that need to be considered. One hundred sixty one
respondents said they would consider using P&R if they did not have to worry about finding a parking
space at their destination.
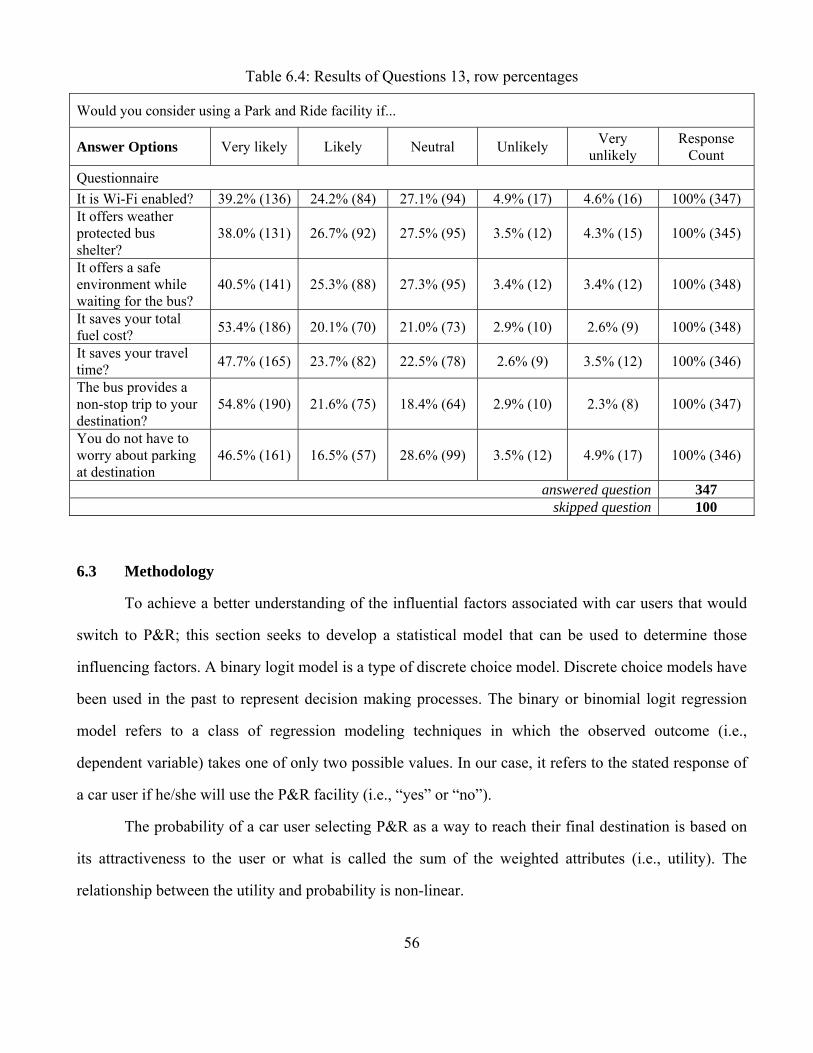
56
Table 6.4: Results of Questions 13, row percentages
Would you consider using a Park and Ride facility if...
Answer Options Very likely Likely Neutral Unlikely Very
unlikely Response
Count
Questionnaire
It is Wi-Fi enabled? 39.2% (136) 24.2% (84) 27.1% (94) 4.9% (17) 4.6% (16) 100% (347) It offers weather protected bus shelter?
38.0% (131) 26.7% (92) 27.5% (95) 3.5% (12) 4.3% (15) 100% (345)
It offers a safe environment while waiting for the bus?
40.5% (141) 25.3% (88) 27.3% (95) 3.4% (12) 3.4% (12) 100% (348)
It saves your total fuel cost?
53.4% (186) 20.1% (70) 21.0% (73) 2.9% (10) 2.6% (9) 100% (348)
It saves your travel time?
47.7% (165) 23.7% (82) 22.5% (78) 2.6% (9) 3.5% (12) 100% (346)
The bus provides a non-stop trip to your destination?
54.8% (190) 21.6% (75) 18.4% (64) 2.9% (10) 2.3% (8) 100% (347)
You do not have to worry about parking at destination
46.5% (161) 16.5% (57) 28.6% (99) 3.5% (12) 4.9% (17) 100% (346)
answered question 347 skipped question 100
6.3 Methodology
To achieve a better understanding of the influential factors associated with car users that would
switch to P&R; this section seeks to develop a statistical model that can be used to determine those
influencing factors. A binary logit model is a type of discrete choice model. Discrete choice models have
been used in the past to represent decision making processes. The binary or binomial logit regression
model refers to a class of regression modeling techniques in which the observed outcome (i.e.,
dependent variable) takes one of only two possible values. In our case, it refers to the stated response of
a car user if he/she will use the P&R facility (i.e., “yes” or “no”).
The probability of a car user selecting P&R as a way to reach their final destination is based on
its attractiveness to the user or what is called the sum of the weighted attributes (i.e., utility). The
relationship between the utility and probability is non-linear.
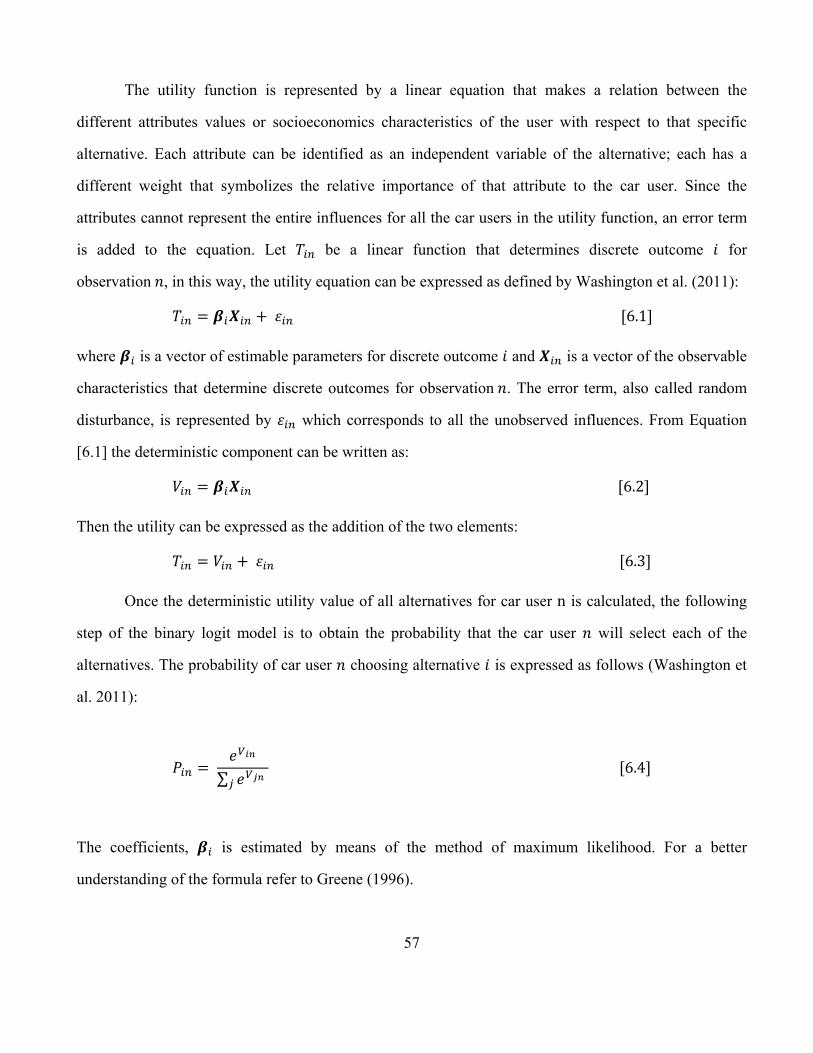
57
The utility function is represented by a linear equation that makes a relation between the
different attributes values or socioeconomics characteristics of the user with respect to that specific
alternative. Each attribute can be identified as an independent variable of the alternative; each has a
different weight that symbolizes the relative importance of that attribute to the car user. Since the
attributes cannot represent the entire influences for all the car users in the utility function, an error term
is added to the equation. Let be a linear function that determines discrete outcome for
observation , in this way, the utility equation can be expressed as defined by Washington et al. (2011):
6.1
where is a vector of estimable parameters for discrete outcome and is a vector of the observable
characteristics that determine discrete outcomes for observation . The error term, also called random
disturbance, is represented by which corresponds to all the unobserved influences. From Equation
[6.1] the deterministic component can be written as:
6.2
Then the utility can be expressed as the addition of the two elements:
6.3
Once the deterministic utility value of all alternatives for car user n is calculated, the following
step of the binary logit model is to obtain the probability that the car user will select each of the
alternatives. The probability of car user choosing alternative is expressed as follows (Washington et
al. 2011):
∑
6.4
The coefficients, is estimated by means of the method of maximum likelihood. For a better
understanding of the formula refer to Greene (1996).
58
6.4 Evaluating the Model
There are several statistics used to evaluate the feasibility of the binary logit model. One of them
is the log-likelihood ratio test, in which the test compares the log-likelihood value of the estimation
with zero parameter values in the restricted model and unrestricted model . The expression is a
statistic which follows a Chi-square distribution (Washington et al. 2011).
2 6.5
Other measurement to evaluate the model is the probabilistic value or the p-value associated with
the test statistics. The p-value is the smallest level of significance that leads to rejection of the null
hypothesis that the coefficients are zero. The larger the test statistic and the smaller is the p-value.
Finally, marginal effect is also used to evaluate each variable’s impact with respect to the
probability. The marginal effects represent the change in the probability of one alternative relative to one
unit increment in a variable. The formula is expressed as follows (Washington et al. 2011):
6.6
where = is the marginal effect of alternative , due to a unit change in , the value of
attribute for alternative .
The results can be interpreted that as the higher marginal effect value, the higher significance or
effect of that variable in changing the probability of the outcome.
6.5 Binary Logit Model
This section describes the estimation of a binary logit model used to predict those influencing
factors that affect the willingness of car users into using a P&R facility. A P&R survey was conducted
and described in Section 6.1 of this Chapter.
For model estimation, the potential explanatory variables obtained from the survey were used to
develop the model. The dependent variable that was considered for the model estimation was obtained
from the survey results for Question 11 was related to the willingness of the users. Each survey variable
is described in Table 6.5. The independent variables that were created for the model estimation are
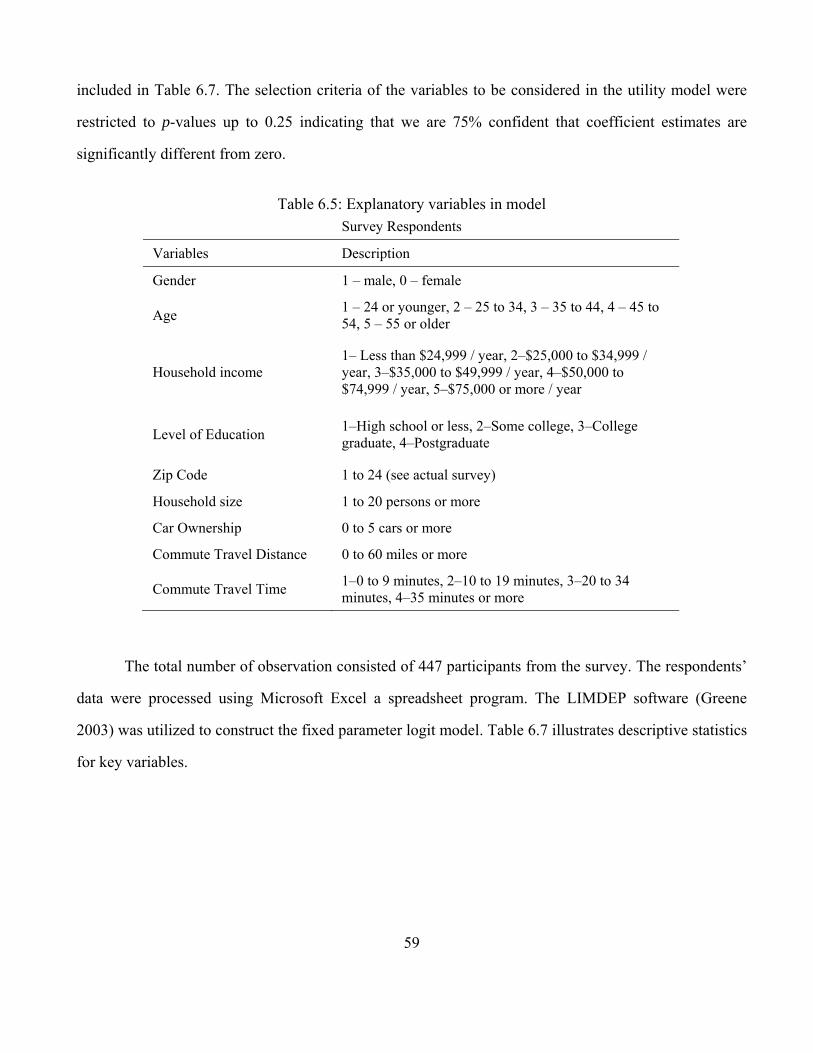
59
included in Table 6.7. The selection criteria of the variables to be considered in the utility model were
restricted to p-values up to 0.25 indicating that we are 75% confident that coefficient estimates are
significantly different from zero.
Table 6.5: Explanatory variables in model
Survey Respondents
Variables Description
Gender 1 – male, 0 – female
Age 1 – 24 or younger, 2 – 25 to 34, 3 – 35 to 44, 4 – 45 to 54, 5 – 55 or older
Household income 1– Less than $24,999 / year, 2–$25,000 to $34,999 / year, 3–$35,000 to $49,999 / year, 4–$50,000 to $74,999 / year, 5–$75,000 or more / year
Level of Education 1–High school or less, 2–Some college, 3–College graduate, 4–Postgraduate
Zip Code 1 to 24 (see actual survey)
Household size 1 to 20 persons or more
Car Ownership 0 to 5 cars or more
Commute Travel Distance 0 to 60 miles or more
Commute Travel Time 1–0 to 9 minutes, 2–10 to 19 minutes, 3–20 to 34 minutes, 4–35 minutes or more
The total number of observation consisted of 447 participants from the survey. The respondents’
data were processed using Microsoft Excel a spreadsheet program. The LIMDEP software (Greene
2003) was utilized to construct the fixed parameter logit model. Table 6.7 illustrates descriptive statistics
for key variables.
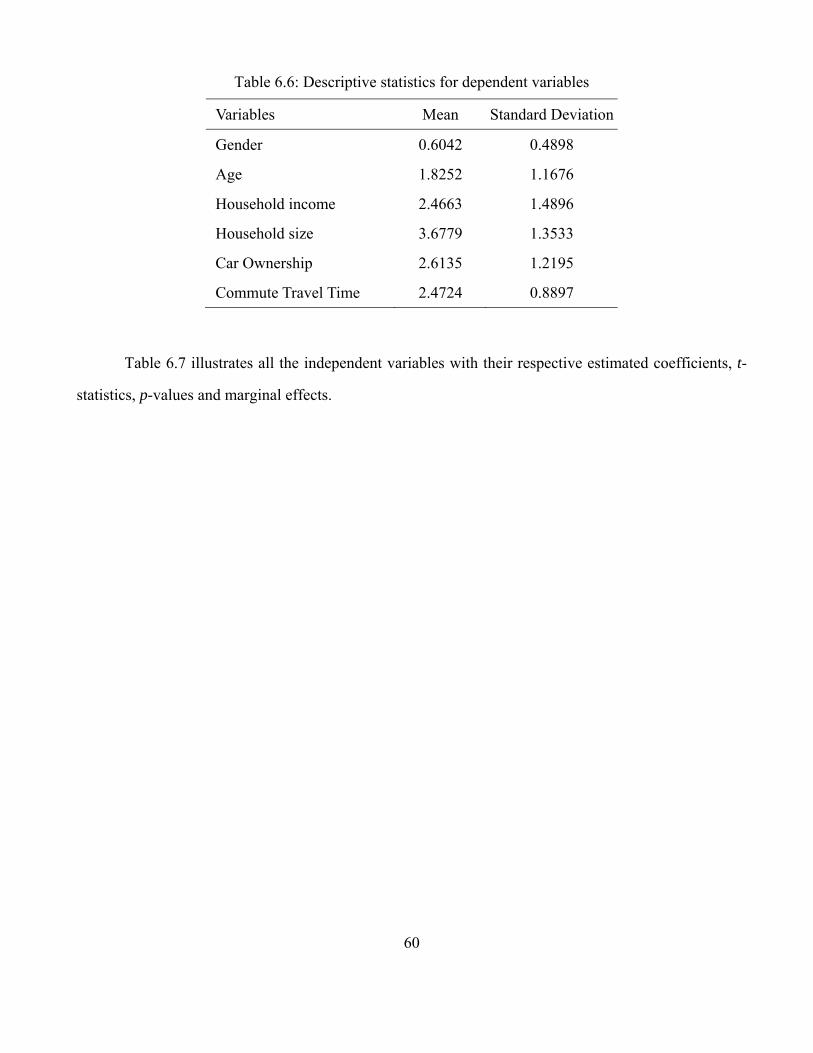
60
Table 6.6: Descriptive statistics for dependent variables
Variables Mean Standard Deviation
Gender 0.6042 0.4898
Age 1.8252 1.1676
Household income 2.4663 1.4896
Household size 3.6779 1.3533
Car Ownership 2.6135 1.2195
Commute Travel Time 2.4724 0.8897
Table 6.7 illustrates all the independent variables with their respective estimated coefficients, t-
statistics, p-values and marginal effects.

61
Table 6.7: Estimation results for binary logistic model
Variables Coefficient t-stat p-value Marginal Effects
Constant 0.8606 1.763 0.0782 0.1886
Age and Household Income (1 if 1 – 24 or younger & less than $24,999 / year, 0 otherwise)
0.5896 2.105 0.0353 0.1231
Household Size (1 if 2 persons, 0 otherwise)
-0.4472 -1.354 0.1759 -0.1024
Car Ownership (0 if 0 cars, 1 if 1 car, …, 5 if 5 cars or more)
-0.2453 -2.356 0.0185 -0.0538
Commute Travel Time (1 if 0 to 9 minutes, 2 if 10 to 19 minutes, 3 if 20 to 34 minutes, 4 if 35 minutes or more)
0.1680 1.212 0.2256 0.0368
Number of variables used 4
Log-likelihood at zero, -207.0385
Log-likelihood at convergence, -200.8678
= –2[ - ] 12.3413
p-value 0.0224
Number of observations 326
The first variable indicates that respondents with an age of 24 years or younger and at the same
time have an annual household income of less than $24,999 are more likely to consider using a P&R
facility to complete their commute trips. This is consistent with the survey’s descriptive statistics that a
great majority of transit users are likely to come from low income households, and households with high
proportions of young riders. The marginal effect indicates that a person with these combine attributes
will increase the probability of selecting P&R facility by 12.31%.
The respondents with a household size of only two persons are less likely to select a P&R facility
as their choice. A possible interpretation is that car users with this household size may have the choice to
use their own personal vehicle to reach their destination, where a P&R facility does not represent an
attractive alternative. The marginal effect specifies that a shift in household from others into two persons
will decrease the probability of choosing P&R facility by 10.24%.
62
Survey respondents that have higher number of vehicles in their households are less likely to
select a P&R facility as their choice. This may indicate that as the number of vehicles in the household
corresponds to its car dependency. The marginal effect shows that an increase in one vehicle in the
household for a will reduce a member’s probability of selecting P&R by5.38%.
A car user is more likely to choose a P&R facility if the travel time to reach the destination
increases. This may suggest that, as their travel time increases (due to traffic congestion) there is more
incentive for a car user to switch to P&R.
6.6 Summary
This chapter has developed a binary logit model to predict if a commuter would use P&R as a
mode of transportation. The results for the model are specifically developed for demand estimations for
P&R facilities within El Paso and its transit service areas. In essence, the individual demand estimation
model reflects the unique demographic, socioeconomics and commuting characteristics of the travelers
in the El Paso area It is still possible to assume that the underlying variables discovered in the previous
section for the El Paso area are reflective of demand for P&R facilities that offered bus service in
general, and are as a result essentially applicable to other regions.
Transportation planners have two options when attempting to transfer the binary logit model to
another location. Spillar (1997) in his planning design guidelines mentions these two options and are
explained as follows:
1. The planner may estimate a new binary logit model, which translates into estimating the coefficients
for each of the variables used in the new utility equation.
2. Validate the El Paso area equation, developing a correction factor that compensates for the
socioeconomic characteristic differences between the region being studied and the El Paso area.

63
Chapter 7: Park and Ride Ridership Estimation
This chapter describes and demonstrates the process to determine the P&R users demand. This
process involves the application of the binary choice model approach covered in Chapter 6, combined
with demographic and socioeconomic analysis using the ArcGIS Business Analyst tool and ArcMap for
data visualization.
As previously mentioned in Chapter 2, the application of GIS has helped to view, understand,
interpret, and visualize data in many ways. GIS has the ability for managing data associated with
features in the geospatial database which allows us to perform evaluations and analysis. Among these
functions and tools related to this research are the geocoding, allocating and query of data from land use.
Geocoding refers to the process of transforming spatial referenced data such as Traffic Analysis Zones
(TAZs), city parcels, major arterials, and etc. into spatial data that can be displayed as features on a map
(i.e., geographic coordinate system). Allocation is the process of assigning entities of objects across the
network. Data query refers to a request to select certain features from a database. One of the most
common software used for GIS processing is ArcGIS which is a complete system for designing and
managing geospatial data through the use of application of geographic knowledge develop by ESRI, Inc.
(ESRI 2012). Some of the tools provided by the software include: ArcMap, ArcGlobe, ArcCatalog,
among others. For the purpose of this research only ArcMap was utilized, which is primarily used to
view, edit, create and analyze data files. Other extensions of the software include Business Analyst.
Business Analyst can create reports to evaluate a site and provide a market perception. Due to the ability
of this extension to obtained information regarding a specific site such as the demographic and
socioeconomic characteristics of the residents, Business Analyst was used in this Chapter.
7.1 Determining the Park and Ride User Demand
After obtaining the binary model, ArcMap was used to capture the catchment area around the
P&R facility. Researchers have considered using cones, parabolas, ellipses, and even pear shapes to
determine the catchment area. Spillar (1997) mentioned different methods used to capture these area.
For example, a study completed in the Seattle metropolitan area evaluated more than 30 large suburban
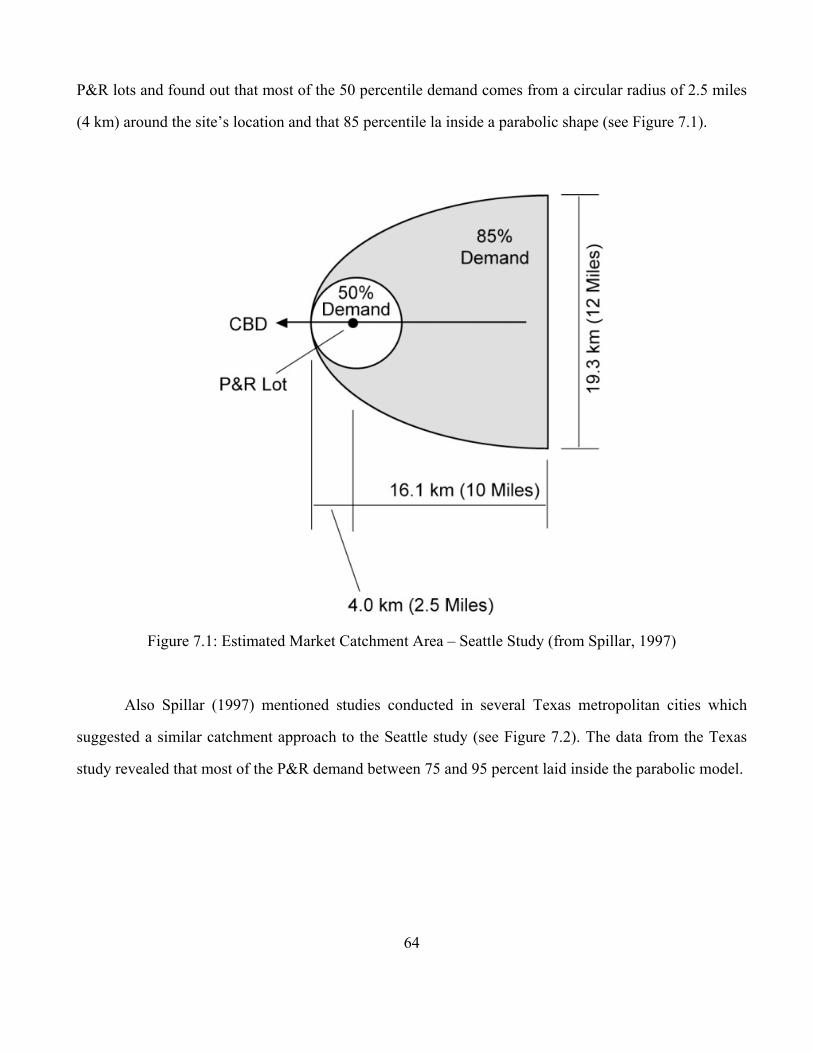
64
P&R lots and found out that most of the 50 percentile demand comes from a circular radius of 2.5 miles
(4 km) around the site’s location and that 85 percentile la inside a parabolic shape (see Figure 7.1).
Figure 7.1: Estimated Market Catchment Area – Seattle Study (from Spillar, 1997)
Also Spillar (1997) mentioned studies conducted in several Texas metropolitan cities which
suggested a similar catchment approach to the Seattle study (see Figure 7.2). The data from the Texas
study revealed that most of the P&R demand between 75 and 95 percent laid inside the parabolic model.
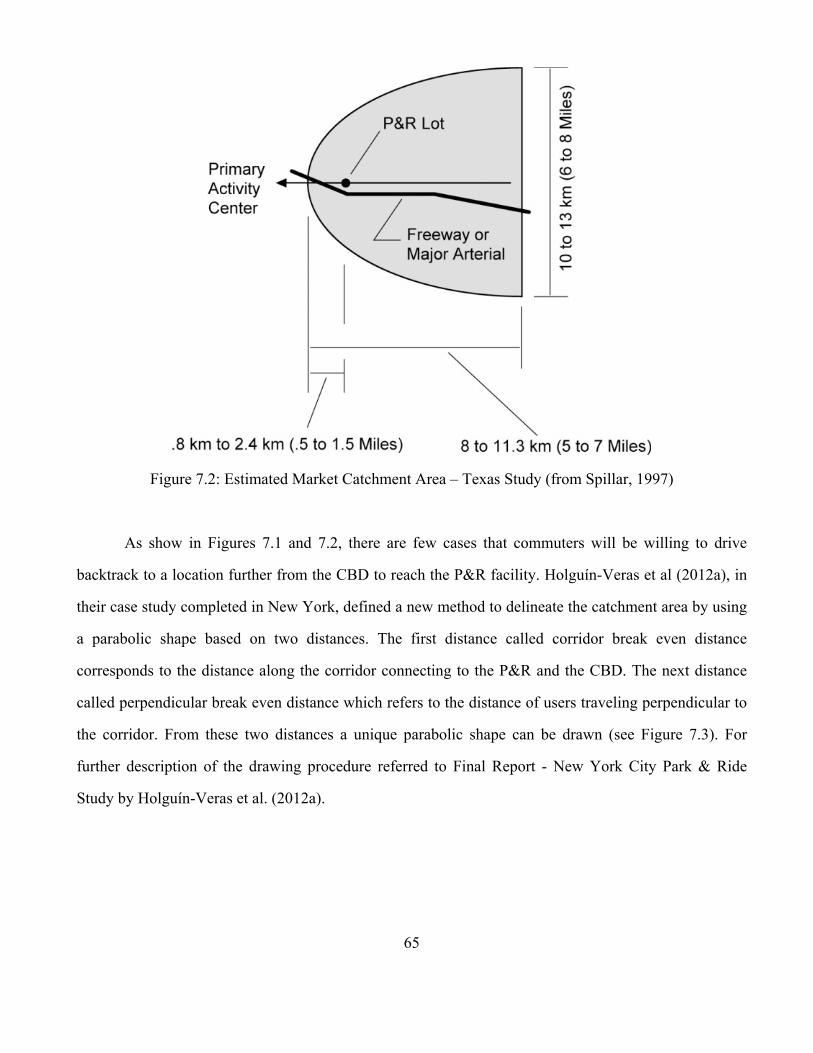
65
Figure 7.2: Estimated Market Catchment Area – Texas Study (from Spillar, 1997)
As show in Figures 7.1 and 7.2, there are few cases that commuters will be willing to drive
backtrack to a location further from the CBD to reach the P&R facility. Holguín-Veras et al (2012a), in
their case study completed in New York, defined a new method to delineate the catchment area by using
a parabolic shape based on two distances. The first distance called corridor break even distance
corresponds to the distance along the corridor connecting to the P&R and the CBD. The next distance
called perpendicular break even distance which refers to the distance of users traveling perpendicular to
the corridor. From these two distances a unique parabolic shape can be drawn (see Figure 7.3). For
further description of the drawing procedure referred to Final Report - New York City Park & Ride
Study by Holguín-Veras et al. (2012a).
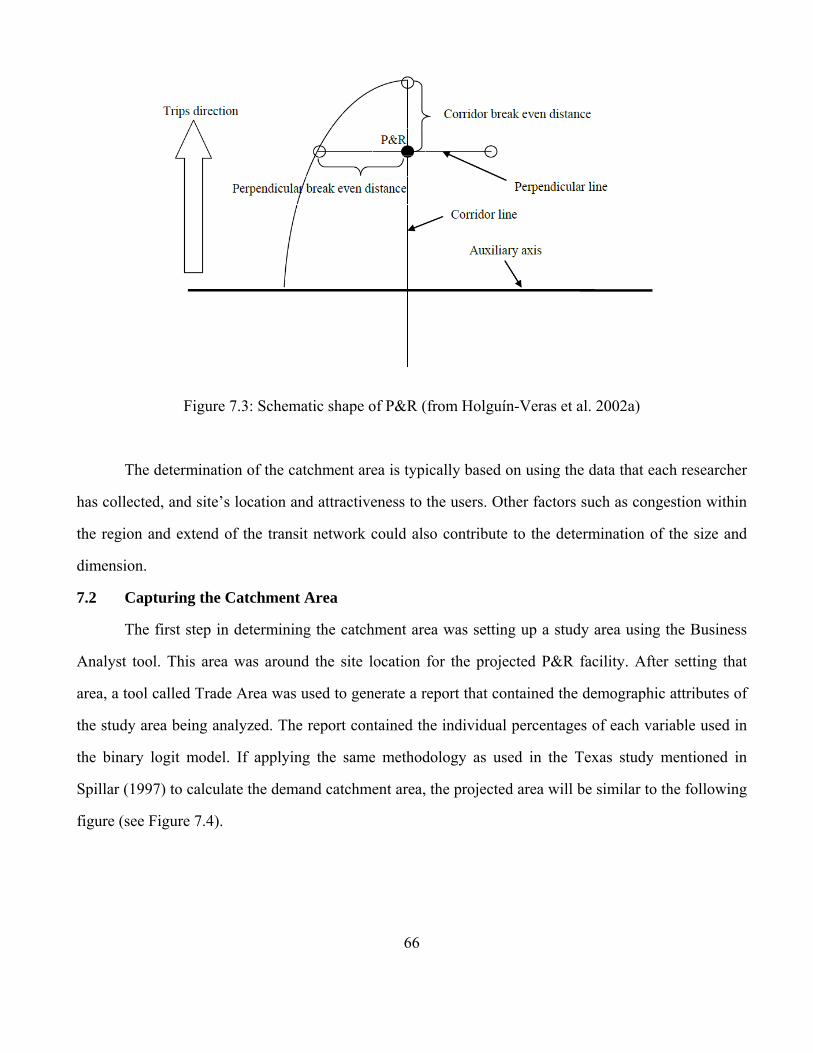
66
Figure 7.3: Schematic shape of P&R (from Holguín-Veras et al. 2002a)
The determination of the catchment area is typically based on using the data that each researcher
has collected, and site’s location and attractiveness to the users. Other factors such as congestion within
the region and extend of the transit network could also contribute to the determination of the size and
dimension.
7.2 Capturing the Catchment Area
The first step in determining the catchment area was setting up a study area using the Business
Analyst tool. This area was around the site location for the projected P&R facility. After setting that
area, a tool called Trade Area was used to generate a report that contained the demographic attributes of
the study area being analyzed. The report contained the individual percentages of each variable used in
the binary logit model. If applying the same methodology as used in the Texas study mentioned in
Spillar (1997) to calculate the demand catchment area, the projected area will be similar to the following
figure (see Figure 7.4).
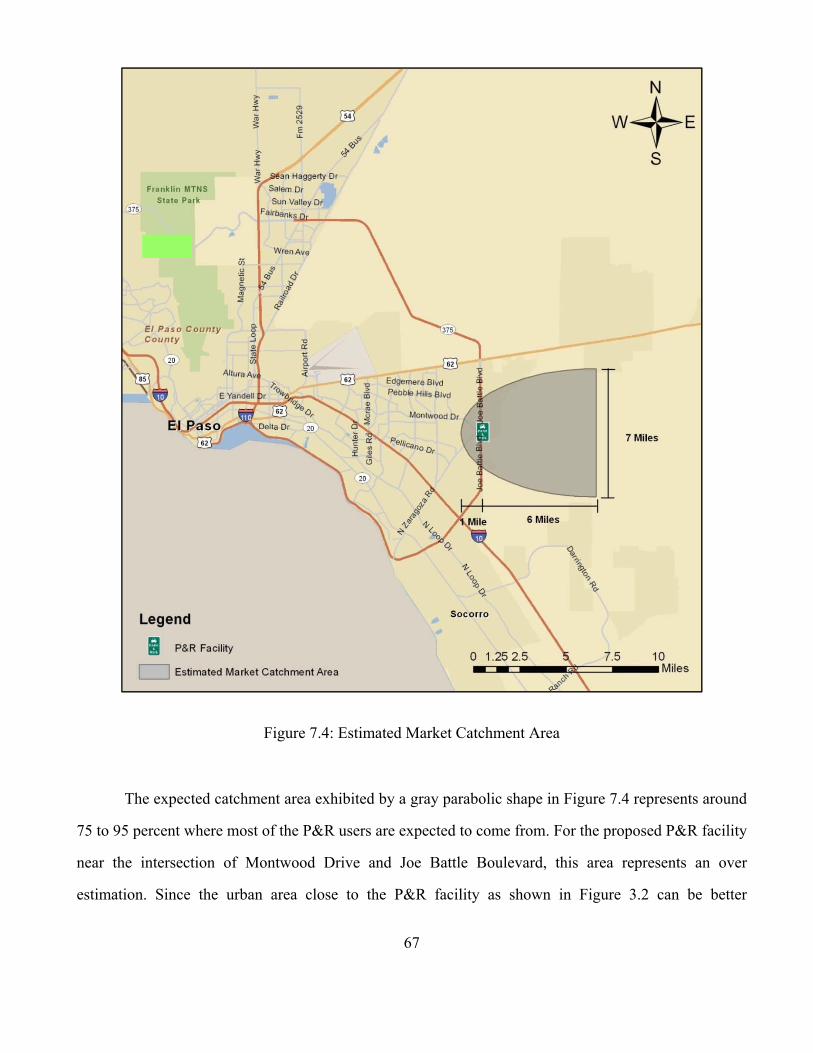
67
Figure 7.4: Estimated Market Catchment Area
The expected catchment area exhibited by a gray parabolic shape in Figure 7.4 represents around
75 to 95 percent where most of the P&R users are expected to come from. For the proposed P&R facility
near the intersection of Montwood Drive and Joe Battle Boulevard, this area represents an over
estimation. Since the urban area close to the P&R facility as shown in Figure 3.2 can be better
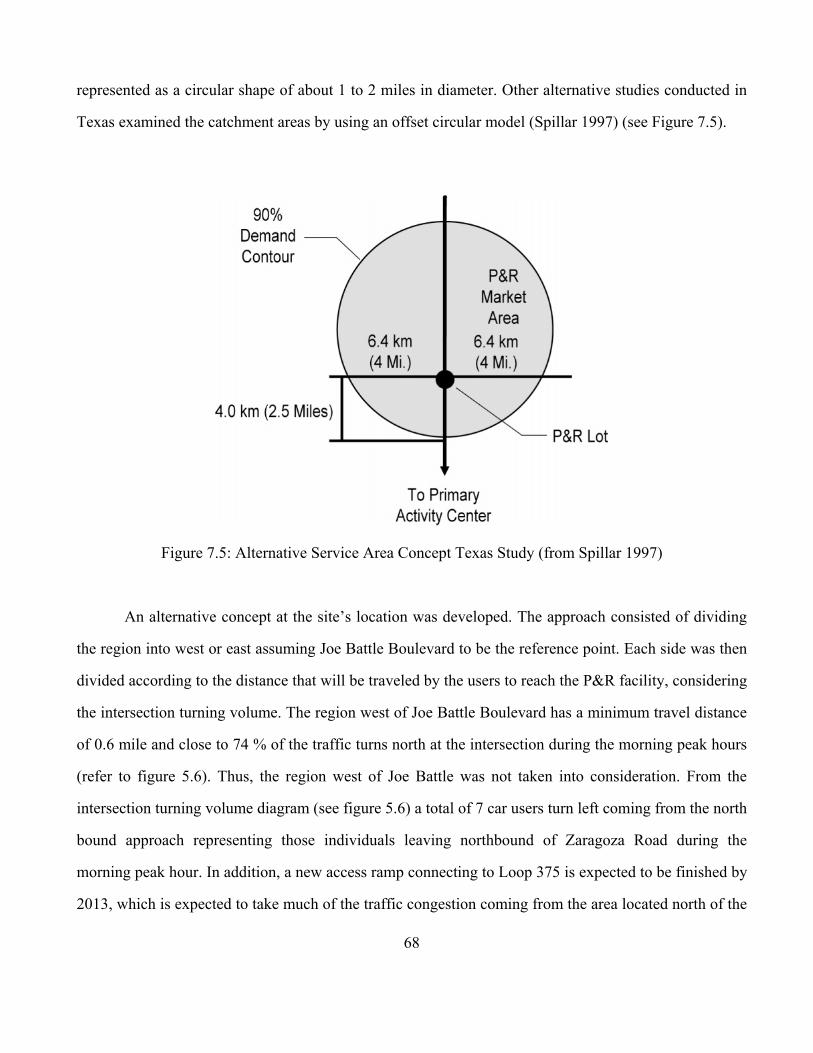
68
represented as a circular shape of about 1 to 2 miles in diameter. Other alternative studies conducted in
Texas examined the catchment areas by using an offset circular model (Spillar 1997) (see Figure 7.5).
Figure 7.5: Alternative Service Area Concept Texas Study (from Spillar 1997)
An alternative concept at the site’s location was developed. The approach consisted of dividing
the region into west or east assuming Joe Battle Boulevard to be the reference point. Each side was then
divided according to the distance that will be traveled by the users to reach the P&R facility, considering
the intersection turning volume. The region west of Joe Battle Boulevard has a minimum travel distance
of 0.6 mile and close to 74 % of the traffic turns north at the intersection during the morning peak hours
(refer to figure 5.6). Thus, the region west of Joe Battle was not taken into consideration. From the
intersection turning volume diagram (see figure 5.6) a total of 7 car users turn left coming from the north
bound approach representing those individuals leaving northbound of Zaragoza Road during the
morning peak hour. In addition, a new access ramp connecting to Loop 375 is expected to be finished by
2013, which is expected to take much of the traffic congestion coming from the area located north of the

69
proposed facility location. Therefore, the area north of Zaragoza Road was not considered for the model
estimation. The rest of the region was then divided into TAZs. A distance of two miles was assumed to
identify the appropriate TAZs. Most of the P&R users are expected to come from residents bounded by
the area indicated in Figure 7.6. The report generated by Business Analyst are presented in Appendix E.
Information such as population size, household size, and household income which represent the
variables used in the binary logit model are then extracted from the catchment area.
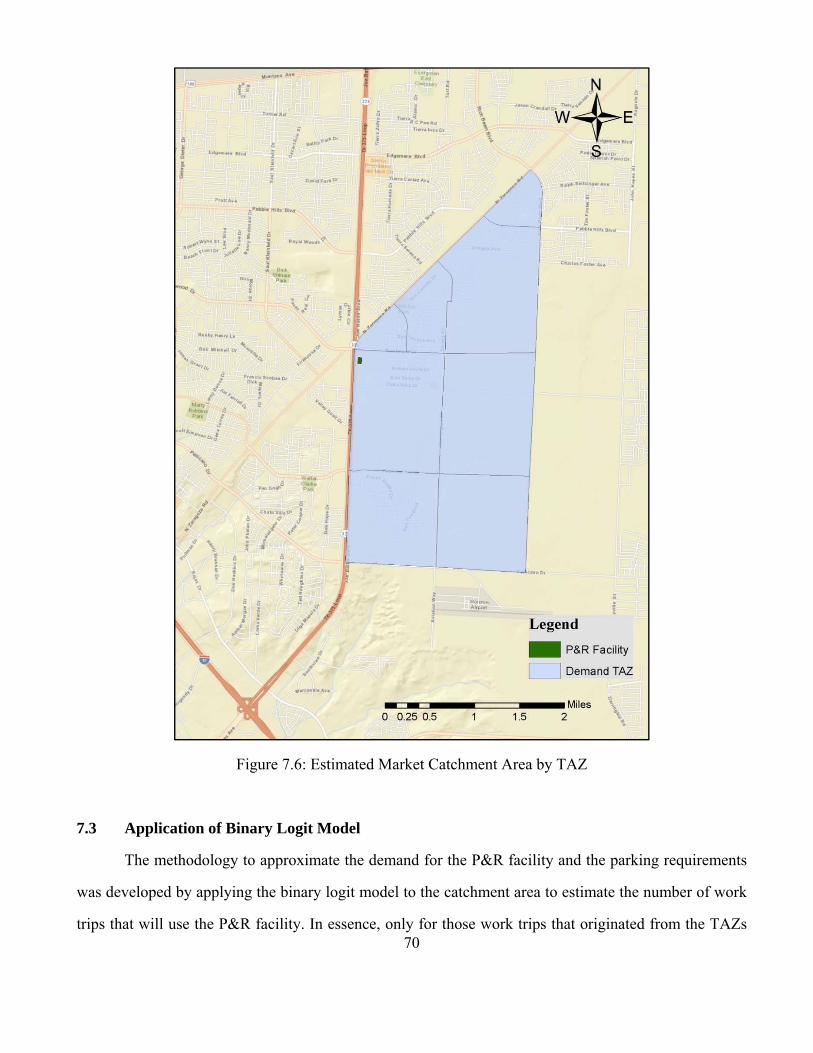
70
Figure 7.6: Estimated Market Catchment Area by TAZ
7.3 Application of Binary Logit Model
The methodology to approximate the demand for the P&R facility and the parking requirements
was developed by applying the binary logit model to the catchment area to estimate the number of work
trips that will use the P&R facility. In essence, only for those work trips that originated from the TAZs
71
indicated by the catchment area and that will reach the TAZ’s located in the El Paso CBD will be
considered as potential P&R trips.
7.3.1 Estimation of Parking Demand heading to El Paso Central Business District
The number of work trips that are originated from the TAZs identified in Figure 7.6 and destined
to the TAZs in the El Paso CBD was extracted from the regional transportation planning model. The El
Paso MPO provided the author with the appropriate trips from the trip origin-destination matrix for the
planning years of 2010 and 2035. In 2010, a total of 69 trips/day originated from the catchment area to
the El Paso CBD. The 2035 trip distribution matrix expects total of 131 trips/day.
7.3.2 Determine Parking Demand
After the number of total work trips has been established, the binary logit model was then
applied to determine the anticipated P&R demand. The variables presented in Table 6.7 represent only
those attributes used in the binary logit model. These attribute values were then extracted from the report
generated by Business Analyst with the appropriate distributions for the years 2000, 2010 and 2015 (see
Appendix E). The distributions for household size, car ownership and commuter travel time in year 2000
were used when information in years 2010 and 2015 was not available.
The market profile report from Business Analyst provided a distribution that symbolizes each
variable used in the binary logit model. The report also provided information such as (i) the total
residential population of 9,148 inside the catchment area, for the year 2010; (ii) the population of 11,138
residents for the year 2015. The following tables exhibit those percentages extracted from the Business
Analyst where the numbers in bold represent those portions needed as inputs into the binary logit model.
Table 7.1 shows the percentage distributions of the population by age in the catchment area in
years 2010 and 2015.
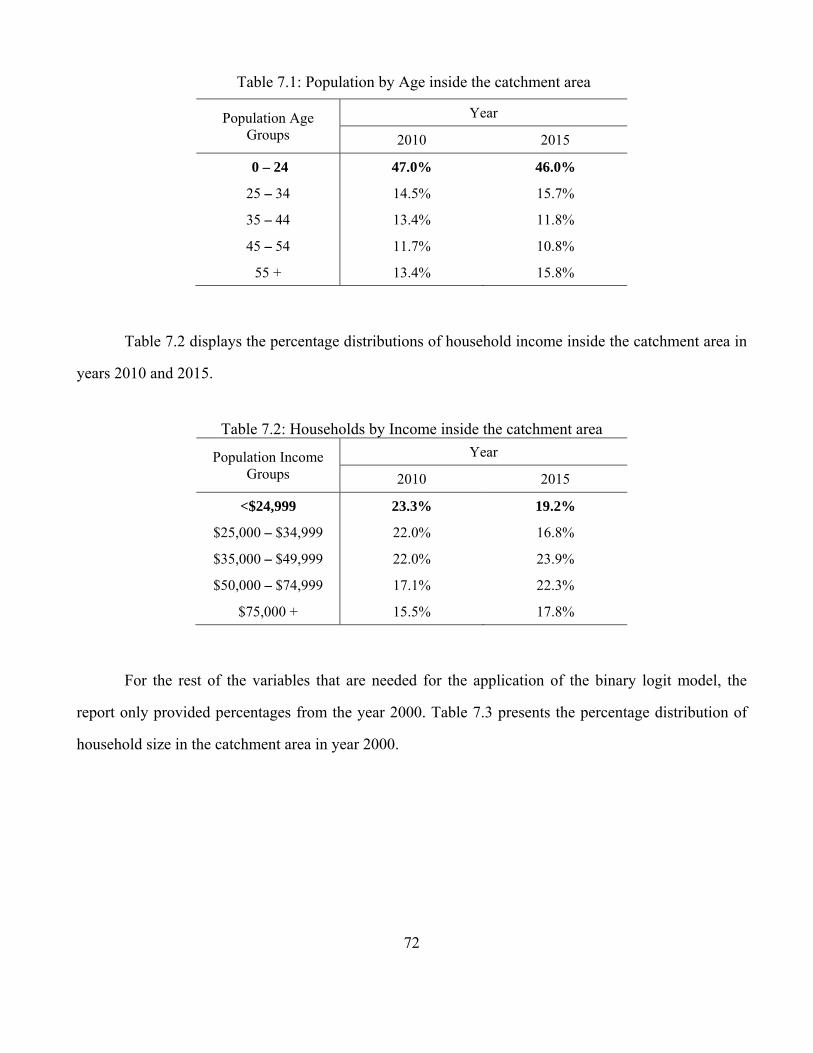
72
Table 7.1: Population by Age inside the catchment area
Population Age Groups
Year
2010 2015
0 – 24 47.0% 46.0%
25 – 34 14.5% 15.7%
35 – 44 13.4% 11.8%
45 – 54 11.7% 10.8%
55 + 13.4% 15.8%
Table 7.2 displays the percentage distributions of household income inside the catchment area in
years 2010 and 2015.
Table 7.2: Households by Income inside the catchment area
Population Income Groups
Year
2010 2015
<$24,999 23.3% 19.2%
$25,000 – $34,999 22.0% 16.8%
$35,000 – $49,999 22.0% 23.9%
$50,000 – $74,999 17.1% 22.3%
$75,000 + 15.5% 17.8%
For the rest of the variables that are needed for the application of the binary logit model, the
report only provided percentages from the year 2000. Table 7.3 presents the percentage distribution of
household size in the catchment area in year 2000.
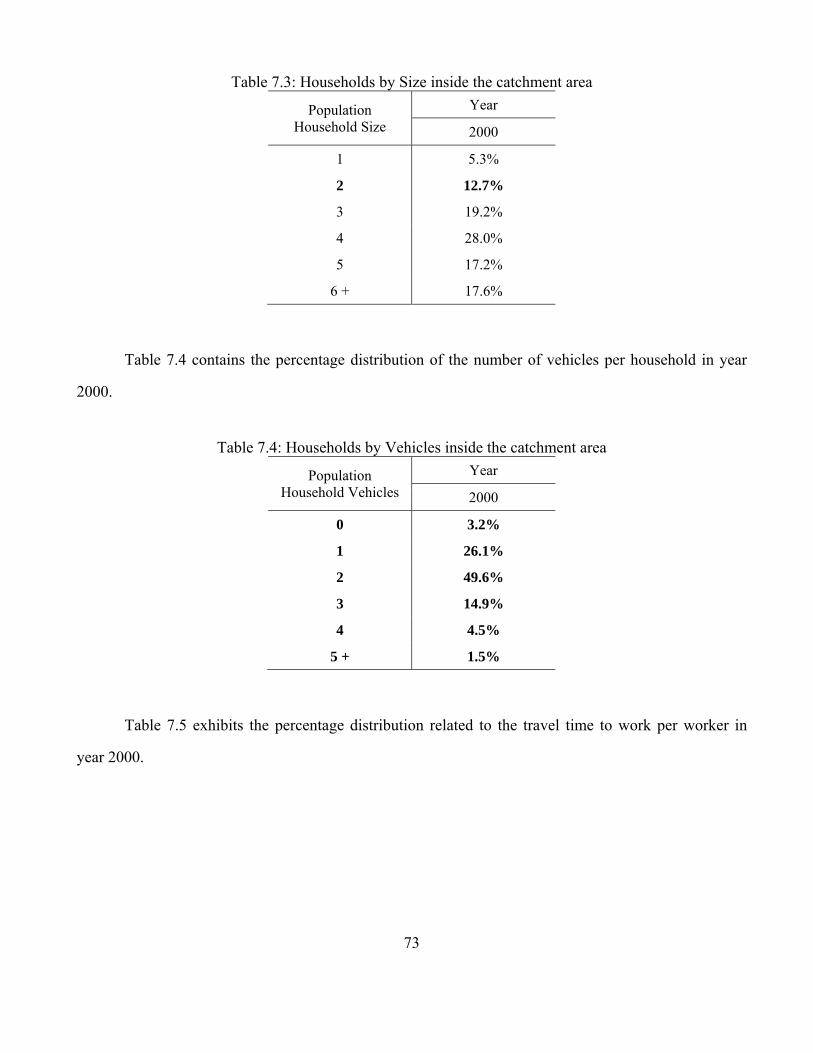
73
Table 7.3: Households by Size inside the catchment area
Population Household Size
Year
2000
1 5.3%
2 12.7%
3 19.2%
4 28.0%
5 17.2%
6 + 17.6%
Table 7.4 contains the percentage distribution of the number of vehicles per household in year
2000.
Table 7.4: Households by Vehicles inside the catchment area
Population Household Vehicles
Year
2000
0 3.2%
1 26.1%
2 49.6%
3 14.9%
4 4.5%
5 + 1.5%
Table 7.5 exhibits the percentage distribution related to the travel time to work per worker in
year 2000.
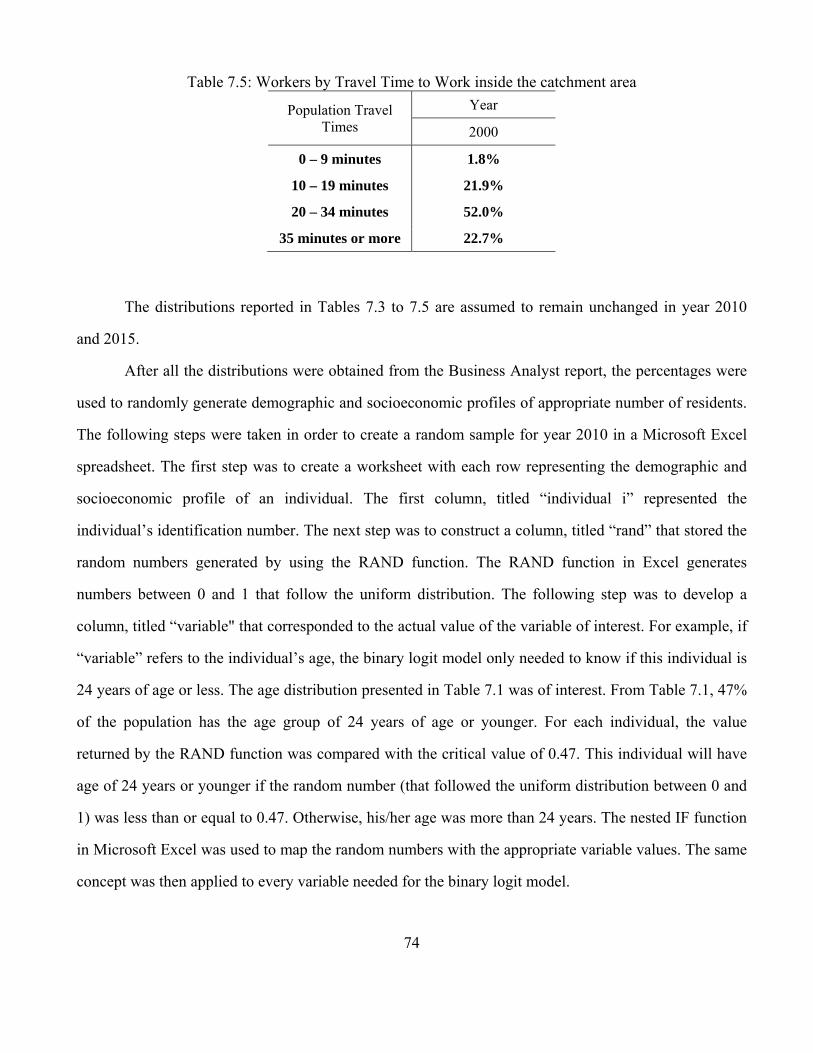
74
Table 7.5: Workers by Travel Time to Work inside the catchment area
Population Travel Times
Year
2000
0 – 9 minutes 1.8%
10 – 19 minutes 21.9%
20 – 34 minutes 52.0%
35 minutes or more 22.7%
The distributions reported in Tables 7.3 to 7.5 are assumed to remain unchanged in year 2010
and 2015.
After all the distributions were obtained from the Business Analyst report, the percentages were
used to randomly generate demographic and socioeconomic profiles of appropriate number of residents.
The following steps were taken in order to create a random sample for year 2010 in a Microsoft Excel
spreadsheet. The first step was to create a worksheet with each row representing the demographic and
socioeconomic profile of an individual. The first column, titled “individual i” represented the
individual’s identification number. The next step was to construct a column, titled “rand” that stored the
random numbers generated by using the RAND function. The RAND function in Excel generates
numbers between 0 and 1 that follow the uniform distribution. The following step was to develop a
column, titled “variable" that corresponded to the actual value of the variable of interest. For example, if
“variable” refers to the individual’s age, the binary logit model only needed to know if this individual is
24 years of age or less. The age distribution presented in Table 7.1 was of interest. From Table 7.1, 47%
of the population has the age group of 24 years of age or younger. For each individual, the value
returned by the RAND function was compared with the critical value of 0.47. This individual will have
age of 24 years or younger if the random number (that followed the uniform distribution between 0 and
1) was less than or equal to 0.47. Otherwise, his/her age was more than 24 years. The nested IF function
in Microsoft Excel was used to map the random numbers with the appropriate variable values. The same
concept was then applied to every variable needed for the binary logit model.
75
After all the necessary input values for the binary logit model had been generated for an
individual, the probability of this individual using the P&R facility was calculated. From the trip
distribution matrix provided by El Paso MPO for the year 2010, a total of 69 trips/day were made from
the catchment area to the CBD. The above demographic, socioeconomic and binary logit model
estimation methodologies were applied to this 69 individuals. The sum of the individual probabilities
gave the total number of potential P&R users/day.
For 2010, the results present a total of 46 potential P&R users (out of 69 work trips). The number
of potential P&R users for the projected year 2035 resulted in 87 parkers (out of 131 work trips).
Comparing to the total number of parking spaces available at the proposed facility (162 parking stalls),
the space set aside will be able to meet the expected demand. It may also be necessary for Sun Metro to
deploy an additional bus to cater for the increase in ridership, or have an express service that runs from
the P&R facility to the CBD. It should be noted that not all the P&R users will use the facility every day
or at the same time. On the other hand, there could be latent demand, for example, P&R users who travel
to other destinations, that is not captured by the binary logit model.
7.4 Summary
This chapter has demonstrated the application of the binary logit model developed in Chapter 6
to estimate the increase in bus ridership due to the introduction of a P&R facility. Due to the specific
region characteristics, streets layouts and future city expansions, a different catchment approach had to
be developed from those conducted by previous researchers to better represent the area that delineated
the potential users’ morning trip origins. The chapter has also demonstrated how the binary logit model
may be applied to estimate the P&R users demand by using demographic and socioeconomic data from
GIS software such as Business Analyst, combined with the travel demand model.
76
Chapter 8: Cost Estimation and Economic Impacts
In this chapter, estimations were performed on the costs of different transportation improvements
proposed at the P&R site, and the associated financial impacts of the P&R facility to the stake holders.
These improvements consist of an additional lane trajectory for the bus to enter the mall and exit, a bus
shelter, and adjusting the entry lanes to accommodate the proper entrance radius. They also include
parking lot marks re-painting, pedestrian crossing signs and any additional signage. The associate
financial impacts include additional revenue for the bus company due to increased ridership and
additional revenue of commercial establishment surrounding the P&R facility.
8.1 Recommended Infrastructure Improvements
The following infrastructure items were recommended in order to improve and integrate the
transportation system to the site (see Figures 8.1):
1. Widening of entrance and exit to meet the minimum standards for width of driveway and bus turning
radius
2. Modifying bus route
3. Placing a bus shelter
4. Installing traffic signs
5. Re-striping of parking lot
a. White parking marks to indicate new parking stall layout
b. Pedestrian crosswalk
c. Six handicapped signs and stalls
6. Constructing handicapped access ramps
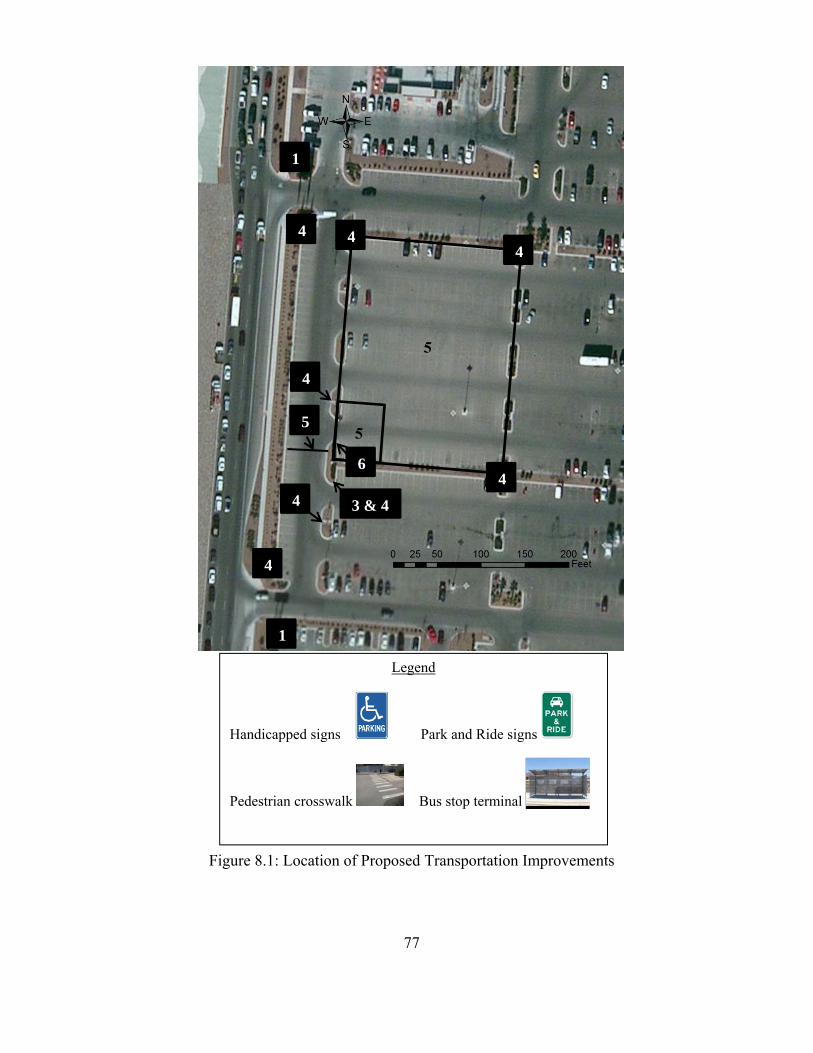
77
Figure 8.1: Location of Proposed Transportation Improvements
1
1
3 & 4
5
4
4
44
4
6
4
4
Legend
Handicapped signs Park and Ride signs
Pedestrian crosswalk Bus stop terminal

78
8.2 Proposed Transportation Improvements
Figure 8.1 illustrates the locations of the different infrastructure modifications. The following
paragraphs explain the proposed changes that will help to improve the buses entering and exiting the
site, for users to park their cars and wait for transfer.
1 - Widening of entrances and exits
The goal is to widen two two-lane mall entrances and exits that are located along the projected
bus trajectory to meet the minimum turning radius of 45 feet. This will provide a more efficient and
convenient access for the buses to enter and exit the mall.
2 – Modifying bus route
The design includes an extension/routing of the Route 53 to enter the mall and serve P&R users
as well as regular bus users. This extra time due to the re-routing will need to be adjusted to the Route
53 bus schedule.
3 – Placing a bus shelter
The scope of this part of the infrastructure improvement is to erect a bus shelter. The installation
of the bus shelter will consist of removing a lamp post. The shelter will come with paved concrete floor.
4 –Installing traffic signs
Ten P&R signs will be placed around the P&R lot to help to control and assist users in finding
the assigned parking spaces. Six handicapped parking signs will be placed in front of the handicapped
parking stalls. One bus stop sign will be placed in front of the bus shelter. Two signs for the pedestrian
crosswalk will be placed near the bus shelter.
5 – Re-stripping of parking lot
Re-stripping includes the re-painting of the markings for the P&R parking stalls to the new
layout, a pedestrian crosswalk in front of the bus shelter, and six handicapped stalls and handicapped
signs.
6 – Constructing handicapped access ramps
Two access ramps will be placed, one at the bus shelter and another near the handicapped van
accessible parking spaces to provide a safe route to the bus shelter.
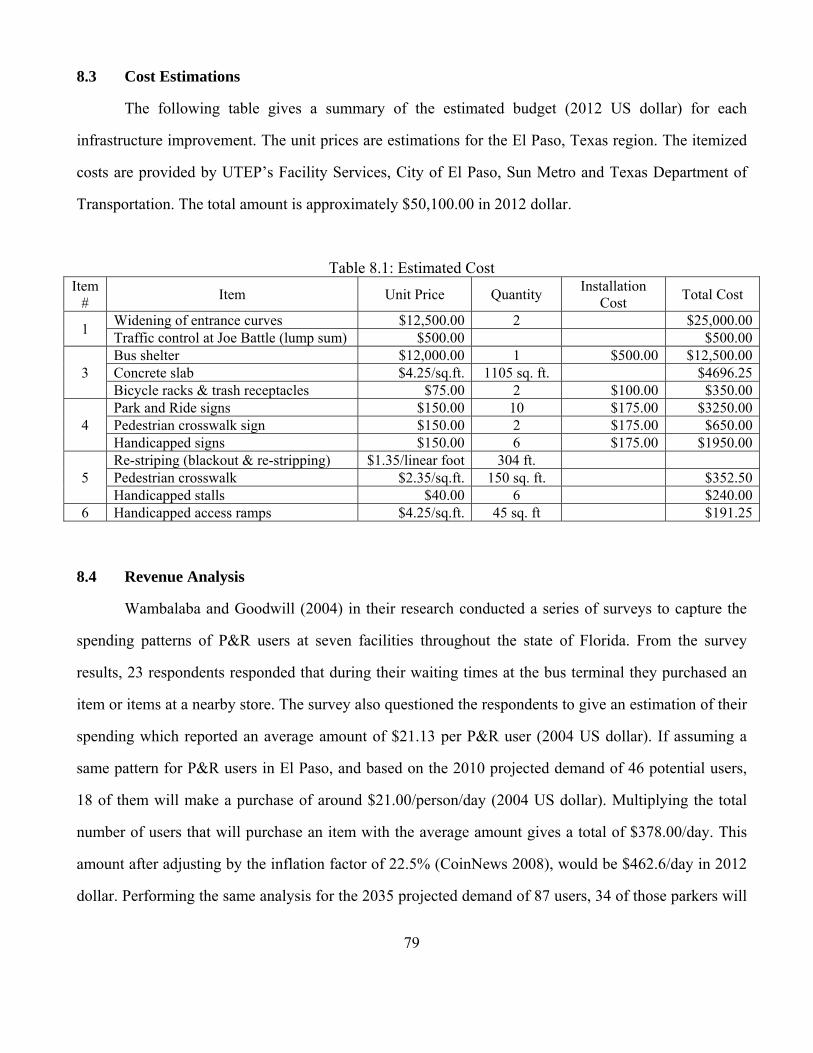
79
8.3 Cost Estimations
The following table gives a summary of the estimated budget (2012 US dollar) for each
infrastructure improvement. The unit prices are estimations for the El Paso, Texas region. The itemized
costs are provided by UTEP’s Facility Services, City of El Paso, Sun Metro and Texas Department of
Transportation. The total amount is approximately $50,100.00 in 2012 dollar.
Table 8.1: Estimated Cost Item
# Item Unit Price Quantity
Installation Cost
Total Cost
1 Widening of entrance curves $12,500.00 2 $25,000.00Traffic control at Joe Battle (lump sum) $500.00 $500.00
3 Bus shelter $12,000.00 1 $500.00 $12,500.00 Concrete slab $4.25/sq.ft. 1105 sq. ft. $4696.25Bicycle racks & trash receptacles $75.00 2 $100.00 $350.00
4 Park and Ride signs $150.00 10 $175.00 $3250.00Pedestrian crosswalk sign $150.00 2 $175.00 $650.00Handicapped signs $150.00 6 $175.00 $1950.00
5 Re-striping (blackout & re-stripping) $1.35/linear foot 304 ft. Pedestrian crosswalk $2.35/sq.ft. 150 sq. ft. $352.50Handicapped stalls $40.00 6 $240.00
6 Handicapped access ramps $4.25/sq.ft. 45 sq. ft $191.25
8.4 Revenue Analysis
Wambalaba and Goodwill (2004) in their research conducted a series of surveys to capture the
spending patterns of P&R users at seven facilities throughout the state of Florida. From the survey
results, 23 respondents responded that during their waiting times at the bus terminal they purchased an
item or items at a nearby store. The survey also questioned the respondents to give an estimation of their
spending which reported an average amount of $21.13 per P&R user (2004 US dollar). If assuming a
same pattern for P&R users in El Paso, and based on the 2010 projected demand of 46 potential users,
18 of them will make a purchase of around $21.00/person/day (2004 US dollar). Multiplying the total
number of users that will purchase an item with the average amount gives a total of $378.00/day. This
amount after adjusting by the inflation factor of 22.5% (CoinNews 2008), would be $462.6/day in 2012
dollar. Performing the same analysis for the 2035 projected demand of 87 users, 34 of those parkers will
80
make a purchase of $21.00/person/day (2004 US dollar). Multiplying the total number of users that will
purchase an item with the average amount gives a total of $714.00/day in 2004 dollars, equivalent to
$874.48/day in 2012 dollar.
Currently, Sun Metro offers monthly passes for unlimited bus trips starting from $30.00 for
students and $48.00 for standard users. Assuming that most of the expected P&R users will pay a
standard monthly fee, for the year 2010, Sun Metro will receive additional fare revenue of
$2,208.00/month in 2012 dollar. Applying the same monthly fare price to the expected demand for the
year 2035, it will generate revenue of $4,146.00/month in 2012 dollar. Another option to calculate the
additional fare revenue is to assume that each P&R users will purchase a standard ticket price of $1.50
per bus trip (2012 US dollar). The City or Sun Metro may want to consider providing incentives to P&R
users by charging a lower fee for a monthly pass.
Arrangements between the property owners and transit agencies can take on many forms. Each
party could take responsibility for such thing as maintenance, cleaning, insurance, installations of
amenities, or providing incentives to bus users (Wambalaba and Goodwill 2004). The City of El Paso
may consider leasing the P&R parking space from the property owners. This will be an added cost but
was not estimated during this research.
8.5 Summary
This chapter has identified the costs of necessary infrastructure improvements to implement the
P&R facility. The total cost of the infrastructure improvements is estimated to be $50,100 in 2012
dollar. The increase in bus ridership may be translated to fare revenues of $2208.00/month in 2010 and
$4146.00/month in 2015 (2012 US dollar). In addition, P&R users are likely to generate revenues of
$462.96/day in 2010 and $874.48/day in 2015 (2012 US dollar) at the surrounding stores. However, the
cost associated with leasing the site from the property owner and the cost of providing (possibly)
additional bus service has not been estimated. The leasing cost depends on the contract between the
responsible agency and the property owner, while the cost of providing additional bus service depends
on the type of vehicle and service (regular or express). Nevertheless, the cost estimates provided in this
81
chapter serves as the starting points for the agency and bus company to work with the property owner to
implement the P&R facility.
82
Chapter 9: Conclusions
This chapter summarizes the research performed, highlights its contributions, and gives
recommendations for future research. Section 9.1 discusses the findings and achieved goals. Section 9.2
presents the contributions of the thesis while the Section 9.3 introduces possible limitations and
proposes future research. Section 9.4 summarizes the important findings pertaining to the case study site
in the City of El Paso.
9.1 Summary of Research
This study presents a systematic methodology that investigates the feasibility of placing a P&R
facility at a location. Different components of the methodology were presented in chapters. Chapter 3
presents a process in order for making an assessment of possible site locations and determine the
contributing factors than will best represent an ideal location. Chapter 4 provides examples for
measuring the reliability of the existing transit service using the TCQSM’s guidelines; such measures
are to provide suggestions for improvements of bus service so that it can be an attractive alternative for
potential P&R users. Then, Chapter 5 provides an assessment of the current usage of the P&R facility
and its translation into a P&R lot. The assessment consists of four parts: examine the capacity and use of
the existing parking facility, the adequacy of access, traffic and transit circulation. A binary logit model
is developed in Chapter 6, with a stated reference survey that seeks to understand the choices made by
the users (bus riders and auto drivers) and the influencing factors behind their choices. The P&R
catchment area is defined in Chapter 7. The binary logit model was applied to the catchment area
surrounding the proposed P&R facility in Chapter 7 to estimate the P&R demand in the current and
future years, using the demographic and socioeconomic characteristics of the trip makers. Finally, the
costs of infrastructure improvements and revenues are estimated in the Chapter 8.
9.2 Contributions
The overall contributions to the existing methodologies for P&R facility evaluation are as
follows:
83
1. This research has updated the planning process of P&R facilities, from the guidelines provided by
different researchers covered in the literature review.
2. This research has tailored the guidelines provided in the Transit Capacity and Quality of Service
Manual to evaluate the reliability of bus routes with the objective of making the bus system more
attractive to potential P&R users.
3. This research has applied a series of assessments and evaluations such as parking inventory, parking
accumulation and parking duration, adequacy of access, traffic and transit circulation that can be
done at a site in order to assure successful community integration.
4. This research has developed a survey instrument and demonstrated the use of the state preference
survey data to develop a binary logit model for the estimation of P&R demand.
5. This research has demonstrated how the developed binary logit model may be applied to estimate the
P&R users demand using GIS-based demographic and socioeconomic data in the ridership
catchment area.
6. This research has identified the itemized the cost needed for P&R implementations, user cost, and
revenues for the government agency, transit operator and businesses surrounding the potential P&R
facility.
9.3 Future Research
The performance of all the steps presented in this research may be considered as reliable and
guidelines to follow by planners. In future, the survey collection process can be expanded to cover a
larger sample size, to include respondents living near the projected facility location as well as collecting
other socioeconomic data that were not covered in this research.
The current P&R facility is presently used as a parking facility for mall users. For the eventually
implementation of P&R service at the proposed site, the City or transit agency would require the
cooperation of the property owners. This thesis has provided a framework for cost-benefit analysis for
the transit agency and business owners, which serves as the starting point for both entities to develop a
84
public-private partnership to promote P&R. A business model for the public-private partnership will
need to be developed.
9.4 Finding Specific to the Proposed Park and Ride Facility
This report presents a case study of a site in the intersection of Joe Battle Boulevard and
Montwood Drive in the City of El Paso that was selected in consultation with El Paso MPO and other
stakeholders to develop the systematic approach for the evaluation of a potential P&R facility. The site
consists of a lot situated within a mall’s parking lot that provides 168 parking spaces for potential users.
In accordance with ADA a minimum set of handicapped parking spaces has to be provided by the P&R
facility, based on the total number of stalls provided. Therefore, the P&R facility is expected to provide
162 parking spaces where six of the parking stalls will be handicapped accessible parking spaces. In
order to reduce the waiting time of bus users and maximize the transit capacity, a projected re-routing
for Route 53 is suggested as well as a bus shelter for bus users and P&R users to board the bus. After
applying the methodology to the proposed P&R site, this research has estimated P&R riderships of 46
passengers in 2010 and 87 passengers in 2035. The estimated cost of infrastructure improvement is
approximately $51,000 (2012 US dollar). Based on the expected numbers of P&R users, the estimated
revenues to the bus operators were estimated to be $2208.00 and $4146.00 respectively (2012 dollars).
Meanwhile, nearby shop store owners surrounding the P&R facility are projected to experience an
increase in revenue of $463.06/day and $874.06/day (2012 US dollar).
This thesis incorporates a fundamental planning guideline for city planners concerning the
placement procedure for a P&R facility to redefine existing methodologies for the El Paso region. The
motivation of implementing P&R facilities is not only represented by determining the potential demand
that the facility will attract, but also it is intended for car users to switch mode which can result in
reducing traffic congestion and ensuring the public welfare.

85
References
AASHTO. (2002). Geometric Design Guide for Transit Facilities on Highways and Streets. Parsons Brinckerhoff, Houston, TX.
Bullock, P., Jiang, Q., and Stopher, P. R. (2005). "Using GPS Technology to Measure On-Time Running of Scheduled Bus Service." Journal of Public Transportation, 8(1), 21-40.
Caltrans. (2010). Park and Ride Program Resource Guide 2010. California Department of Transportation.
Chu, X., Land, L., and Pendyala R. (2001). Update of FDOT State Park & Ride Lot Program Planning Manual. Center for Urban Transportation Research, University of South Florida.
City of El Paso. (2012). Sun Metro. <http://home.elpasotexas.gov/sunmetro/about-history.html> (June 13, 2012).
CoinNews. (2008). US Inflation Calculator. CoinNews Media Group LLC. <http://www.usinflationcalculator.com/> (Oct. 10, 2012).
ESRI. (2012). What is GIS? Environmental Science Researc Institute, Redlands, CA. http://www.esri.com/. <http://www.esri.com/what-is-gis/index.html> (Jan. 2, 2012).
Faghri, A., Lang, A., Hamad, K., and Henck, H. (2002). "Integrated Knowledge-Based Geographic Information System for Determining Optimal Location of Park-and-Ride Facilities." Journal of Urban Planning and Development, 128(1), 18-41.
Farhan, B., and Murray, A. T. (2005). "A GIS-Based Approach for Delineating Market Aread for Park and Ride Facilities." Transactions in GIS, 9(2), 91-108.
Farhan, B., and Murray, A. T. (2008). "Siting Park-and-Ride Facilities using a Multi-Objective Spatialn Optimization Model." Computers & Operations Research, 35(2), 445 – 456.
Galicia, L. D., and Vidaña, O. (2007). "Analysis of Bus Efficiency and Schedule Adherence. Case Study: Sun Metro Route 15." TexITE 2007 Summer Meeting. Amarillo, TX.
Greene, W. H. (1986). Econometric Modeling Guide. Vol. 1. Econometric Software Inc., Plainview, NY.
Greene, W.H. (2003). NLOGIT, Version 3.0. Econometric Software Inc., Plainview, NY.
Harris, F. H. Inc. (1996). State Park and Ride Lot Program. Office of Public Transportation, Florida Department of Transportation.
Hinojosa, A. (2011). "Loop 375: Montwood-Joe Battle construction gets under way Jan. 3." El Paso Times. <http://www.elpasotimes.com/news/ci_19605115> (Jan. 12, 2012).
86
Holguín-Veras, J., Reilly, J., and Aros-Vera, F. (2012a). New York City Park and Ride Study. Final Report, Project C-07-06. Rensselaer Polytechnic Instititute, NY.
Holguín-Veras, J., Reilly, J., Aros-Vera, F., Yushimito, W., and Isa, J. (2012b). Park and Ride Facilities in New York City: Economic Analyses of Alternative Locations. Paper 12-2441, presented at the 91st Annual Meeting of the Transportation Research Board, Washington, D.C.
Homburger, W. S., Kell, J. H., and Perkins, D. D. (1992). Fundamentals of Traffic Engineering. 13th edition. Institute of Transportation Studies, University of California at Berkeley.
Horner, M. W., and Groves, S. (2006). "Network Flow-Based Strategies for Identifying Rail Park-and-Ride Facility Locations." Socio-Economic Planning Sciences, 41(3), 255–268.
Li, Z.-C., Lam, W. H. K., Wong, S. C., Zhu, D.-L., and Huang, H.-J. (2007). "Modeling Park-and-Ride Services in a Multimodal Transport Network with Elastic Demand." Paper presented at the 86th Annual Meeting of the Transportation Research Board.
Lin, J., Wang, M. L., and Barnum, D. T. (2008). A Quality Control Framework for Bus Schedule Reliability. Great Cities Institute, Chicago, IL.
Liu, R., and Sinha, S. (2007). Modelling Urban Bus Service and Passenger Reliability. Paper presented at the 3rd International Symposium on Transportation Network Reliability, July 19-20, 2007, The Netherlands.
MTA. (2008). Metropolitan Transit Authority of Harris County. Houston, TX. <http://www.ridemetro.org/SchedulesMaps/ParkRide.aspx>(July 4, 2012).
Milkovits, M. N. (2008). Simulating Service Reliability of a High Frequency Bus Route Using Automatically Collected Data. Master of Science Thesis, Dept. of Civil & Environmental Engineering, Massachusetts Institute of Technology.
Murthy, A. S. N., and Mohle, R. H. (1993). Transportation Engineering Basics. American Society of Civil Engineers, NY.
Roess, R. P., Prassas, E. S., and McShane, W. R. (2004). Traffic Engineering. 3rd Ed. Pearson Prentice Hall, Upper Saddle River, NJ.
Spillar, R. J. (1997). Park-and-Ride Planning and Design Guidelines. Parsons Brinckerhoff Quade & Douglas, Inc., NY.
Texas Deparment of Licensing and Regulation. (2012). Texas Accessibility Standards (TAS). Texas Deparment of Licensing and Regulation, Austin, TX.
TRB. (2004). Transit Capacity and Quality of Service Manual. 2nd edition, Transportation Research Board, Washington, D.C.
87
Turnbull, K. F., Pratt, R. H., Evans, J. E. IV, and Levinson, H. S. (2004). Traveler Response to Transportation Changes, Chapter 3-Park-and-Ride/Pool. Transit Cooperative Research Program Report 95. Transportation Research Board, Washington, D.C.
TxDOT. (2010). "Chapter 7: Section 7 - Minimum Designs for Trucks and Bus Turns." In Roadway Design Manual, edited by Marek, M. A., Texas Department of Transportation, 232-246.
Vuchic, V. R. (1981). Urban Public Transportation-Systems and Technology. Prentice-Hall, NJ.
Wambalaba, F., and Goodwill, J. (2004). Public Transportation Research Study Evaluation of Shared Use Park & Ride Impact on Properties. National Center for Transportation Research, Universiy of South Forida.
Washington, S. P., Karlaftis, M. G., and Mannering F. L. (2011). Statistical and Econometric Methods for Transportation Data Analysis. 2nd edition. Chapman & Hall/CRC, Boca Raton, FL.
88
Appendices
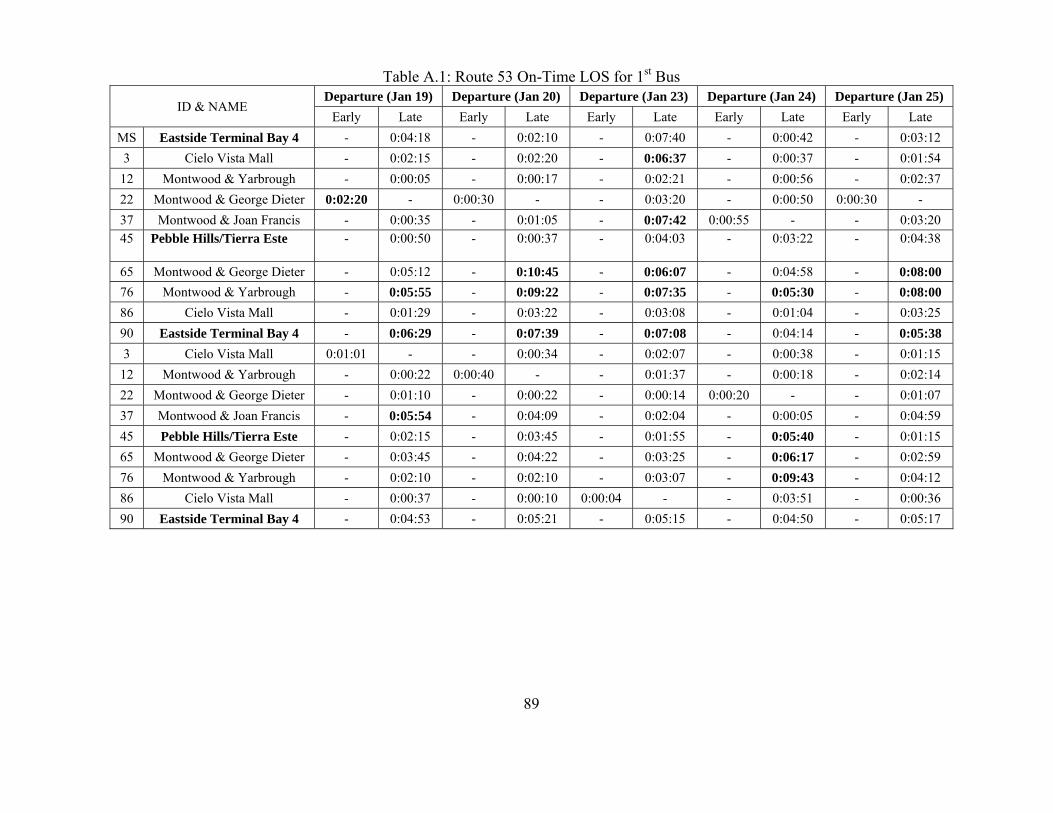
89
Table A.1: Route 53 On-Time LOS for 1st Bus
ID & NAME Departure (Jan 19) Departure (Jan 20) Departure (Jan 23) Departure (Jan 24) Departure (Jan 25)
Early Late Early Late Early Late Early Late Early Late
MS Eastside Terminal Bay 4 - 0:04:18 - 0:02:10 - 0:07:40 - 0:00:42 - 0:03:12
3 Cielo Vista Mall - 0:02:15 - 0:02:20 - 0:06:37 - 0:00:37 - 0:01:54
12 Montwood & Yarbrough - 0:00:05 - 0:00:17 - 0:02:21 - 0:00:56 - 0:02:37
22 Montwood & George Dieter 0:02:20 - 0:00:30 - - 0:03:20 - 0:00:50 0:00:30 -
37 Montwood & Joan Francis - 0:00:35 - 0:01:05 - 0:07:42 0:00:55 - - 0:03:20 45 Pebble Hills/Tierra Este - 0:00:50 - 0:00:37 - 0:04:03 - 0:03:22 - 0:04:38
65 Montwood & George Dieter - 0:05:12 - 0:10:45 - 0:06:07 - 0:04:58 - 0:08:00
76 Montwood & Yarbrough - 0:05:55 - 0:09:22 - 0:07:35 - 0:05:30 - 0:08:00
86 Cielo Vista Mall - 0:01:29 - 0:03:22 - 0:03:08 - 0:01:04 - 0:03:25
90 Eastside Terminal Bay 4 - 0:06:29 - 0:07:39 - 0:07:08 - 0:04:14 - 0:05:38
3 Cielo Vista Mall 0:01:01 - - 0:00:34 - 0:02:07 - 0:00:38 - 0:01:15
12 Montwood & Yarbrough - 0:00:22 0:00:40 - - 0:01:37 - 0:00:18 - 0:02:14
22 Montwood & George Dieter - 0:01:10 - 0:00:22 - 0:00:14 0:00:20 - - 0:01:07
37 Montwood & Joan Francis - 0:05:54 - 0:04:09 - 0:02:04 - 0:00:05 - 0:04:59
45 Pebble Hills/Tierra Este - 0:02:15 - 0:03:45 - 0:01:55 - 0:05:40 - 0:01:15
65 Montwood & George Dieter - 0:03:45 - 0:04:22 - 0:03:25 - 0:06:17 - 0:02:59
76 Montwood & Yarbrough - 0:02:10 - 0:02:10 - 0:03:07 - 0:09:43 - 0:04:12
86 Cielo Vista Mall - 0:00:37 - 0:00:10 0:00:04 - - 0:03:51 - 0:00:36
90 Eastside Terminal Bay 4 - 0:04:53 - 0:05:21 - 0:05:15 - 0:04:50 - 0:05:17

90
Table A.1: Route 53 On-Time LOS for 1st Bus (cont.)
NAME Departure (Mar 12) Departure (Mar 20) Departure (Mar 21) Departure (Mar 22) Departure (Mar 23) Level of Service
Early Late Early Late Early Late Early Late Early Late based On-Time
Eastside Terminal Bay 4 - 0:06:14 - 0:00:34 - 0:00:15 - 0:04:58 - 0:02:10 A
Cielo Vista Mall - 0:00:20 - 0:01:14 - 0:01:53 - 0:01:34 - 0:02:20 A
Montwood & Yarbrough - 0:00:35 - 0:00:04 - 0:00:25 - 0:01:15 - 0:00:17 A
Montwood & George Dieter - 0:01:50 0:01:45 - 0:01:55 - 0:00:55 - 0:00:30 - C
Montwood & Joan Francis - 0:00:45 - 0:12:10 - 0:07:40 - 0:01:32 - 0:01:05 C
Pebble Hills/Tierra Este - 0:02:40 - 0:08:12 - 0:03:12 - 0:03:21 - 0:00:37 A
Montwood & George Dieter - 0:02:40 - 0:11:05 - 0:07:25 - 0:07:06 - 0:10:45 E
Montwood & Yarbrough 0:00:35 - - 0:11:52 - 0:10:01 - 0:05:55 - 0:09:22 F
Cielo Vista Mall - 0:00:14 - 0:05:28 - 0:03:54 - 0:01:28 - 0:03:22 A
Eastside Terminal Bay 4 - 0:12:42 - 0:05:10 - 0:05:10 - 0:08:12 - 0:07:39 E
Cielo Vista Mall - 0:05:59 - 0:00:12 - 0:00:12 - 0:03:40 - 0:00:34 A
Montwood & Yarbrough - 0:01:59 - 0:00:20 - 0:01:34 - 0:03:00 0:00:40 - A
Montwood & George Dieter - 0:00:44 0:01:35 - 0:00:08 - 0:00:01 - - 0:00:22 A
Montwood & Joan Francis - 0:01:54 - 0:08:08 - 0:05:54 - 0:00:28 - 0:04:09 C
Pebble Hills/Tierra Este - 0:05:05 - 0:02:05 - 0:03:37 - 0:01:56 - 0:03:45 A
Montwood & George Dieter - 0:06:30 - 0:02:55 0:00:40 - - 0:01:28 - 0:04:22 B
Montwood & Yarbrough - 0:03:45 - 0:01:22 - 0:01:05 - 0:02:30 - 0:02:10 A
Cielo Vista Mall - 0:00:48 - 0:00:50 - 0:00:32 - 0:00:05 - 0:00:10 A
Eastside Terminal Bay 4 - 0:04:50 - 0:04:15 - 0:06:14 - 0:04:49 - 0:05:21 A
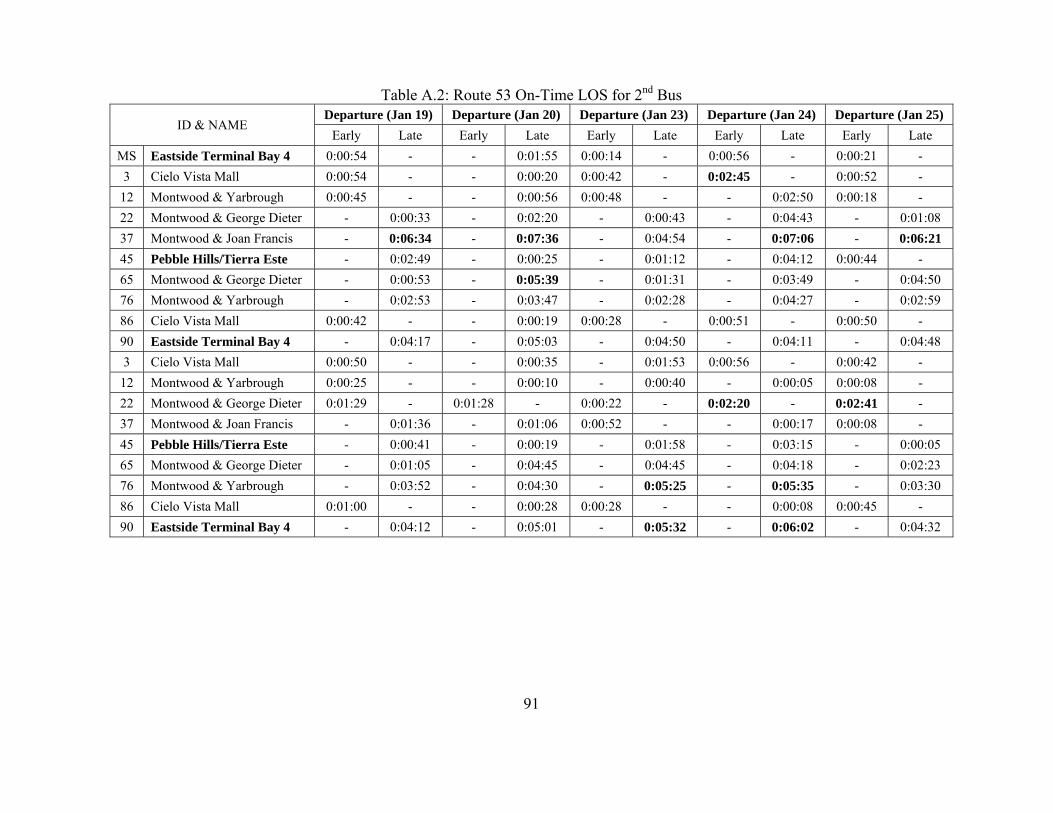
91
Table A.2: Route 53 On-Time LOS for 2nd Bus
ID & NAME Departure (Jan 19) Departure (Jan 20) Departure (Jan 23) Departure (Jan 24) Departure (Jan 25)
Early Late Early Late Early Late Early Late Early Late
MS Eastside Terminal Bay 4 0:00:54 - - 0:01:55 0:00:14 - 0:00:56 - 0:00:21 -
3 Cielo Vista Mall 0:00:54 - - 0:00:20 0:00:42 - 0:02:45 - 0:00:52 -
12 Montwood & Yarbrough 0:00:45 - - 0:00:56 0:00:48 - - 0:02:50 0:00:18 -
22 Montwood & George Dieter - 0:00:33 - 0:02:20 - 0:00:43 - 0:04:43 - 0:01:08
37 Montwood & Joan Francis - 0:06:34 - 0:07:36 - 0:04:54 - 0:07:06 - 0:06:21
45 Pebble Hills/Tierra Este - 0:02:49 - 0:00:25 - 0:01:12 - 0:04:12 0:00:44 -
65 Montwood & George Dieter - 0:00:53 - 0:05:39 - 0:01:31 - 0:03:49 - 0:04:50
76 Montwood & Yarbrough - 0:02:53 - 0:03:47 - 0:02:28 - 0:04:27 - 0:02:59
86 Cielo Vista Mall 0:00:42 - - 0:00:19 0:00:28 - 0:00:51 - 0:00:50 -
90 Eastside Terminal Bay 4 - 0:04:17 - 0:05:03 - 0:04:50 - 0:04:11 - 0:04:48
3 Cielo Vista Mall 0:00:50 - - 0:00:35 - 0:01:53 0:00:56 - 0:00:42 -
12 Montwood & Yarbrough 0:00:25 - - 0:00:10 - 0:00:40 - 0:00:05 0:00:08 -
22 Montwood & George Dieter 0:01:29 - 0:01:28 - 0:00:22 - 0:02:20 - 0:02:41 -
37 Montwood & Joan Francis - 0:01:36 - 0:01:06 0:00:52 - - 0:00:17 0:00:08 -
45 Pebble Hills/Tierra Este - 0:00:41 - 0:00:19 - 0:01:58 - 0:03:15 - 0:00:05
65 Montwood & George Dieter - 0:01:05 - 0:04:45 - 0:04:45 - 0:04:18 - 0:02:23
76 Montwood & Yarbrough - 0:03:52 - 0:04:30 - 0:05:25 - 0:05:35 - 0:03:30
86 Cielo Vista Mall 0:01:00 - - 0:00:28 0:00:28 - - 0:00:08 0:00:45 -
90 Eastside Terminal Bay 4 - 0:04:12 - 0:05:01 - 0:05:32 - 0:06:02 - 0:04:32

92
Table A.2: Route 53 On-Time LOS for 2nd Bus (cont.)
NAME Departure (Mar 12) Departure (Mar 20) Departure (Mar 21) Departure (Mar 22) Departure (Mar 23) Level of Service
Early Late Early Late Early Late Early Late Early Late based On-Time
Eastside Terminal Bay 4 - 0:01:20 - 0:00:30 - 0:00:16 0:00:54 - - 0:01:55 A
Cielo Vista Mall - 0:00:38 - 0:00:41 - 0:00:19 0:00:54 - - 0:00:20 A
Montwood & Yarbrough - 0:01:31 - 0:00:40 - 0:02:40 0:00:45 - - 0:00:56 A
Montwood & George Dieter - 0:00:27 - 0:00:22 - 0:04:11 - 0:00:33 - 0:02:20 A
Montwood & Joan Francis - 0:02:10 - 0:05:55 - 0:07:07 - 0:06:34 - 0:07:36 E
Pebble Hills/Tierra Este - 0:02:15 - 0:03:10 - 0:04:10 - 0:02:49 - 0:00:25 A
Montwood & George Dieter - 0:00:25 - 0:00:22 - 0:03:15 - 0:00:53 - 0:05:39 B
Montwood & Yarbrough - 0:01:40 - 0:01:42 - 0:06:36 - 0:02:53 - 0:03:47 A
Cielo Vista Mall - 0:00:20 - 0:00:20 - 0:00:17 0:00:42 - - 0:00:19 A
Eastside Terminal Bay 4 - 0:06:15 - 0:06:30 - 0:06:23 - 0:04:17 - 0:05:03 C
Cielo Vista Mall - 0:00:42 - 0:00:51 - 0:00:20 0:00:50 - - 0:00:35 A
Montwood & Yarbrough - 0:01:12 - 0:01:20 - 0:00:23 0:00:25 - - 0:00:10 A
Montwood & George Dieter - 0:02:31 - 0:01:58 0:00:29 - 0:01:29 - 0:01:28 - D
Montwood & Joan Francis - 0:02:31 - 0:05:28 - 0:00:45 - 0:01:36 - 0:01:06 A
Pebble Hills/Tierra Este - 0:07:28 - 0:05:32 - 0:03:30 - 0:00:41 - 0:00:19 D
Montwood & George Dieter - 0:05:05 - 0:07:45 - 0:10:40 - 0:01:05 - 0:04:45 B
Montwood & Yarbrough - 0:06:27 - 0:08:23 - 0:09:22 - 0:03:52 - 0:04:30 D
Cielo Vista Mall - 0:01:21 - 0:04:33 - 0:03:32 0:01:00 - - 0:00:28 A
Eastside Terminal Bay 4 0:00:50 - 0:00:30 - 0:00:40 - - 0:04:12 - 0:05:01 D
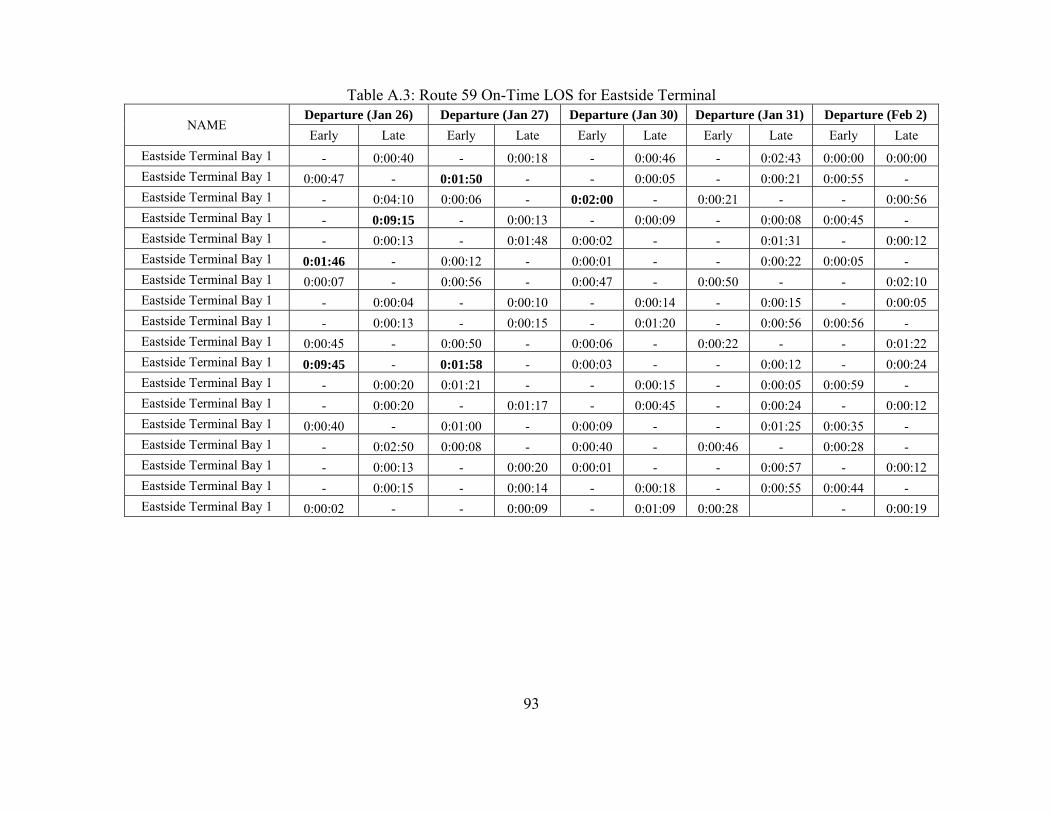
93
Table A.3: Route 59 On-Time LOS for Eastside Terminal
NAME Departure (Jan 26) Departure (Jan 27) Departure (Jan 30) Departure (Jan 31) Departure (Feb 2)
Early Late Early Late Early Late Early Late Early Late
Eastside Terminal Bay 1 - 0:00:40 - 0:00:18 - 0:00:46 - 0:02:43 0:00:00 0:00:00 Eastside Terminal Bay 1 0:00:47 - 0:01:50 - - 0:00:05 - 0:00:21 0:00:55 - Eastside Terminal Bay 1 - 0:04:10 0:00:06 - 0:02:00 - 0:00:21 - - 0:00:56 Eastside Terminal Bay 1 - 0:09:15 - 0:00:13 - 0:00:09 - 0:00:08 0:00:45 - Eastside Terminal Bay 1 - 0:00:13 - 0:01:48 0:00:02 - - 0:01:31 - 0:00:12 Eastside Terminal Bay 1 0:01:46 - 0:00:12 - 0:00:01 - - 0:00:22 0:00:05 - Eastside Terminal Bay 1 0:00:07 - 0:00:56 - 0:00:47 - 0:00:50 - - 0:02:10 Eastside Terminal Bay 1 - 0:00:04 - 0:00:10 - 0:00:14 - 0:00:15 - 0:00:05 Eastside Terminal Bay 1 - 0:00:13 - 0:00:15 - 0:01:20 - 0:00:56 0:00:56 - Eastside Terminal Bay 1 0:00:45 - 0:00:50 - 0:00:06 - 0:00:22 - - 0:01:22 Eastside Terminal Bay 1 0:09:45 - 0:01:58 - 0:00:03 - - 0:00:12 - 0:00:24 Eastside Terminal Bay 1 - 0:00:20 0:01:21 - - 0:00:15 - 0:00:05 0:00:59 - Eastside Terminal Bay 1 - 0:00:20 - 0:01:17 - 0:00:45 - 0:00:24 - 0:00:12 Eastside Terminal Bay 1 0:00:40 - 0:01:00 - 0:00:09 - - 0:01:25 0:00:35 - Eastside Terminal Bay 1 - 0:02:50 0:00:08 - 0:00:40 - 0:00:46 - 0:00:28 - Eastside Terminal Bay 1 - 0:00:13 - 0:00:20 0:00:01 - - 0:00:57 - 0:00:12 Eastside Terminal Bay 1 - 0:00:15 - 0:00:14 - 0:00:18 - 0:00:55 0:00:44 - Eastside Terminal Bay 1 0:00:02 - - 0:00:09 - 0:01:09 0:00:28 - 0:00:19
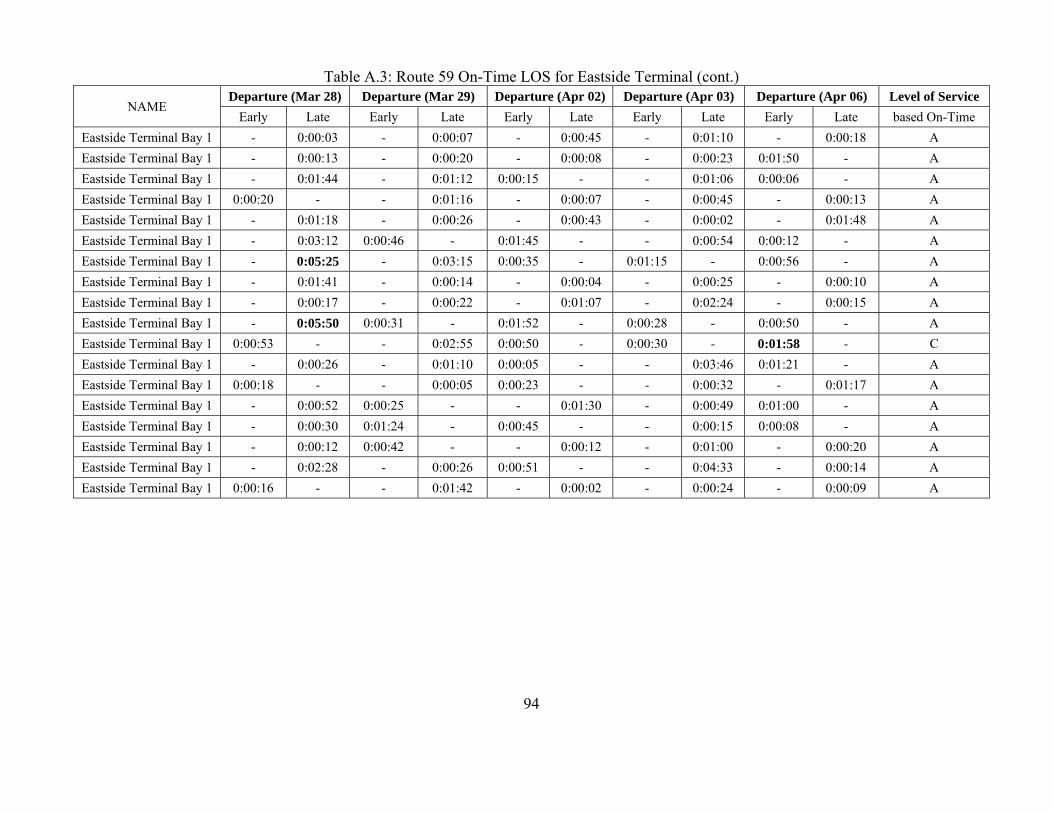
94
Table A.3: Route 59 On-Time LOS for Eastside Terminal (cont.)
NAME Departure (Mar 28) Departure (Mar 29) Departure (Apr 02) Departure (Apr 03) Departure (Apr 06) Level of Service
Early Late Early Late Early Late Early Late Early Late based On-Time
Eastside Terminal Bay 1 - 0:00:03 - 0:00:07 - 0:00:45 - 0:01:10 - 0:00:18 A
Eastside Terminal Bay 1 - 0:00:13 - 0:00:20 - 0:00:08 - 0:00:23 0:01:50 - A
Eastside Terminal Bay 1 - 0:01:44 - 0:01:12 0:00:15 - - 0:01:06 0:00:06 - A
Eastside Terminal Bay 1 0:00:20 - - 0:01:16 - 0:00:07 - 0:00:45 - 0:00:13 A
Eastside Terminal Bay 1 - 0:01:18 - 0:00:26 - 0:00:43 - 0:00:02 - 0:01:48 A
Eastside Terminal Bay 1 - 0:03:12 0:00:46 - 0:01:45 - - 0:00:54 0:00:12 - A
Eastside Terminal Bay 1 - 0:05:25 - 0:03:15 0:00:35 - 0:01:15 - 0:00:56 - A
Eastside Terminal Bay 1 - 0:01:41 - 0:00:14 - 0:00:04 - 0:00:25 - 0:00:10 A
Eastside Terminal Bay 1 - 0:00:17 - 0:00:22 - 0:01:07 - 0:02:24 - 0:00:15 A
Eastside Terminal Bay 1 - 0:05:50 0:00:31 - 0:01:52 - 0:00:28 - 0:00:50 - A
Eastside Terminal Bay 1 0:00:53 - - 0:02:55 0:00:50 - 0:00:30 - 0:01:58 - C
Eastside Terminal Bay 1 - 0:00:26 - 0:01:10 0:00:05 - - 0:03:46 0:01:21 - A
Eastside Terminal Bay 1 0:00:18 - - 0:00:05 0:00:23 - - 0:00:32 - 0:01:17 A
Eastside Terminal Bay 1 - 0:00:52 0:00:25 - - 0:01:30 - 0:00:49 0:01:00 - A
Eastside Terminal Bay 1 - 0:00:30 0:01:24 - 0:00:45 - - 0:00:15 0:00:08 - A
Eastside Terminal Bay 1 - 0:00:12 0:00:42 - - 0:00:12 - 0:01:00 - 0:00:20 A
Eastside Terminal Bay 1 - 0:02:28 - 0:00:26 0:00:51 - - 0:04:33 - 0:00:14 A
Eastside Terminal Bay 1 0:00:16 - - 0:01:42 - 0:00:02 - 0:00:24 - 0:00:09 A
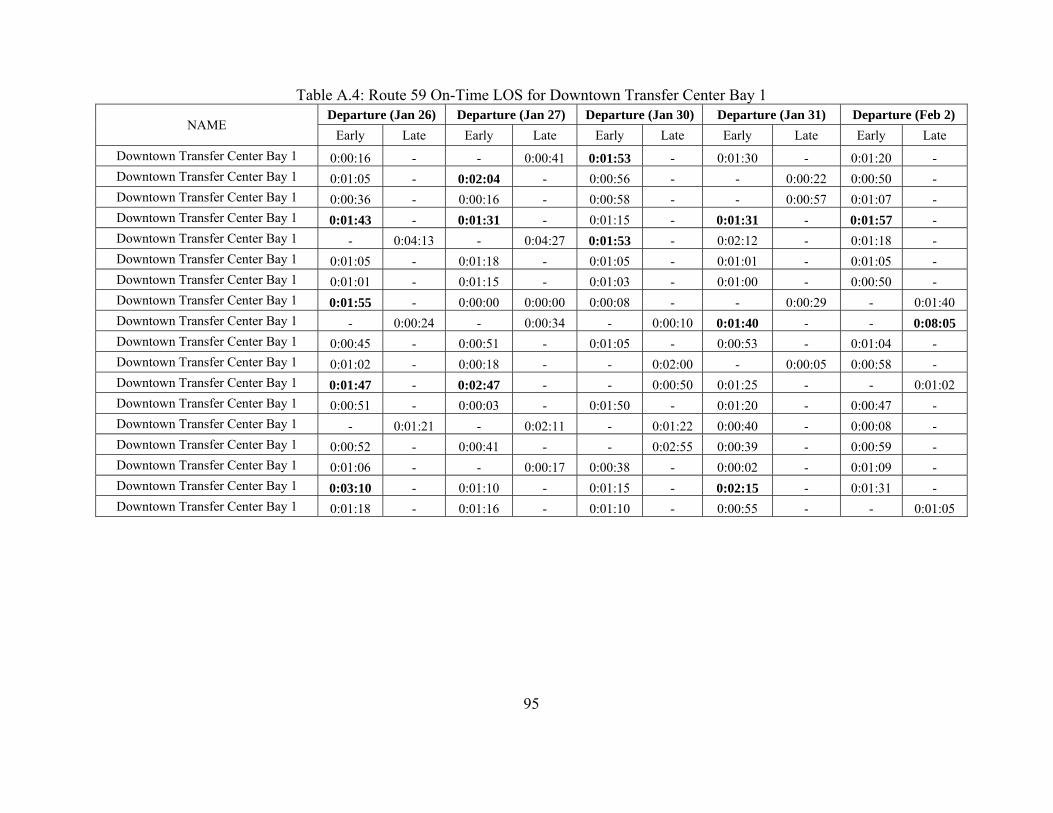
95
Table A.4: Route 59 On-Time LOS for Downtown Transfer Center Bay 1
NAME Departure (Jan 26) Departure (Jan 27) Departure (Jan 30) Departure (Jan 31) Departure (Feb 2)
Early Late Early Late Early Late Early Late Early Late
Downtown Transfer Center Bay 1 0:00:16 - - 0:00:41 0:01:53 - 0:01:30 - 0:01:20 - Downtown Transfer Center Bay 1 0:01:05 - 0:02:04 - 0:00:56 - - 0:00:22 0:00:50 - Downtown Transfer Center Bay 1 0:00:36 - 0:00:16 - 0:00:58 - - 0:00:57 0:01:07 - Downtown Transfer Center Bay 1 0:01:43 - 0:01:31 - 0:01:15 - 0:01:31 - 0:01:57 - Downtown Transfer Center Bay 1 - 0:04:13 - 0:04:27 0:01:53 - 0:02:12 - 0:01:18 - Downtown Transfer Center Bay 1 0:01:05 - 0:01:18 - 0:01:05 - 0:01:01 - 0:01:05 - Downtown Transfer Center Bay 1 0:01:01 - 0:01:15 - 0:01:03 - 0:01:00 - 0:00:50 - Downtown Transfer Center Bay 1 0:01:55 - 0:00:00 0:00:00 0:00:08 - - 0:00:29 - 0:01:40 Downtown Transfer Center Bay 1 - 0:00:24 - 0:00:34 - 0:00:10 0:01:40 - - 0:08:05 Downtown Transfer Center Bay 1 0:00:45 - 0:00:51 - 0:01:05 - 0:00:53 - 0:01:04 - Downtown Transfer Center Bay 1 0:01:02 - 0:00:18 - - 0:02:00 - 0:00:05 0:00:58 - Downtown Transfer Center Bay 1 0:01:47 - 0:02:47 - - 0:00:50 0:01:25 - - 0:01:02 Downtown Transfer Center Bay 1 0:00:51 - 0:00:03 - 0:01:50 - 0:01:20 - 0:00:47 - Downtown Transfer Center Bay 1 - 0:01:21 - 0:02:11 - 0:01:22 0:00:40 - 0:00:08 - Downtown Transfer Center Bay 1 0:00:52 - 0:00:41 - - 0:02:55 0:00:39 - 0:00:59 - Downtown Transfer Center Bay 1 0:01:06 - - 0:00:17 0:00:38 - 0:00:02 - 0:01:09 - Downtown Transfer Center Bay 1 0:03:10 - 0:01:10 - 0:01:15 - 0:02:15 - 0:01:31 - Downtown Transfer Center Bay 1 0:01:18 - 0:01:16 - 0:01:10 - 0:00:55 - - 0:01:05

96
Table A.4: Route 59 On-Time LOS for Downtown Transfer Center Bay 1 (cont.)
NAME Departure (Mar 28) Departure (Mar 29) Departure (Apr 02) Departure (Apr 03) Departure (Apr 06) Level of Service
Early Late Early Late Early Late Early Late Early Late based On-Time
Downtown Transfer Center Bay 1 - 0:00:40 0:00:00 - - 0:00:35 - 0:01:41 - 0:01:41 A
Downtown Transfer Center Bay 1 - 0:00:25 - 0:00:31 - 0:00:28 0:01:04 - 0:01:04 - A
Downtown Transfer Center Bay 1 - 0:00:36 - 0:00:45 0:00:18 - 0:00:06 - - 0:02:44 A
Downtown Transfer Center Bay 1 - 0:01:07 - 0:00:01 - 0:00:47 0:01:31 - 0:01:13 - D
Downtown Transfer Center Bay 1 0:00:40 - - 0:06:50 - 0:00:40 - 0:03:27 - 0:05:27 B
Downtown Transfer Center Bay 1 - 0:00:32 - 0:00:28 0:00:55 - 0:00:18 - 0:00:18 - A
Downtown Transfer Center Bay 1 - 0:00:15 - 0:04:26 0:00:24 - - 0:00:45 0:00:15 - A
Downtown Transfer Center Bay 1 - 0:00:25 0:00:51 - - 0:00:53 - 0:01:00 - 0:01:00 A
Downtown Transfer Center Bay 1 - 0:01:17 - 0:07:32 - 0:01:29 0:01:26 - - 0:00:34 C
Downtown Transfer Center Bay 1 0:00:07 - - 0:01:18 0:01:12 - - 0:02:09 0:00:01 - A
Downtown Transfer Center Bay 1 - 0:01:45 - 0:00:30 0:00:35 - - 0:02:42 0:00:38 - A
Downtown Transfer Center Bay 1 - 0:03:09 - 0:00:34 0:00:44 - 0:01:47 - 0:00:47 - A
Downtown Transfer Center Bay 1 - 0:00:05 - 0:05:12 0:00:18 - - 0:01:57 - 0:02:57 A
Downtown Transfer Center Bay 1 0:00:45 - - 0:01:25 - 0:01:57 - 0:03:11 - 0:00:11 A
Downtown Transfer Center Bay 1 0:01:03 - 0:00:27 - - 0:01:58 0:01:41 - - 0:00:19 A
Downtown Transfer Center Bay 1 - 0:00:07 - 0:01:15 - 0:00:06 - 0:01:17 - 0:01:17 A
Downtown Transfer Center Bay 1 0:00:21 - - 0:03:49 0:00:51 - 0:01:20 - 0:00:10 - D
Downtown Transfer Center Bay 1 0:00:29 - - 0:02:18 - 0:00:02 0:00:16 - 0:01:46 - A
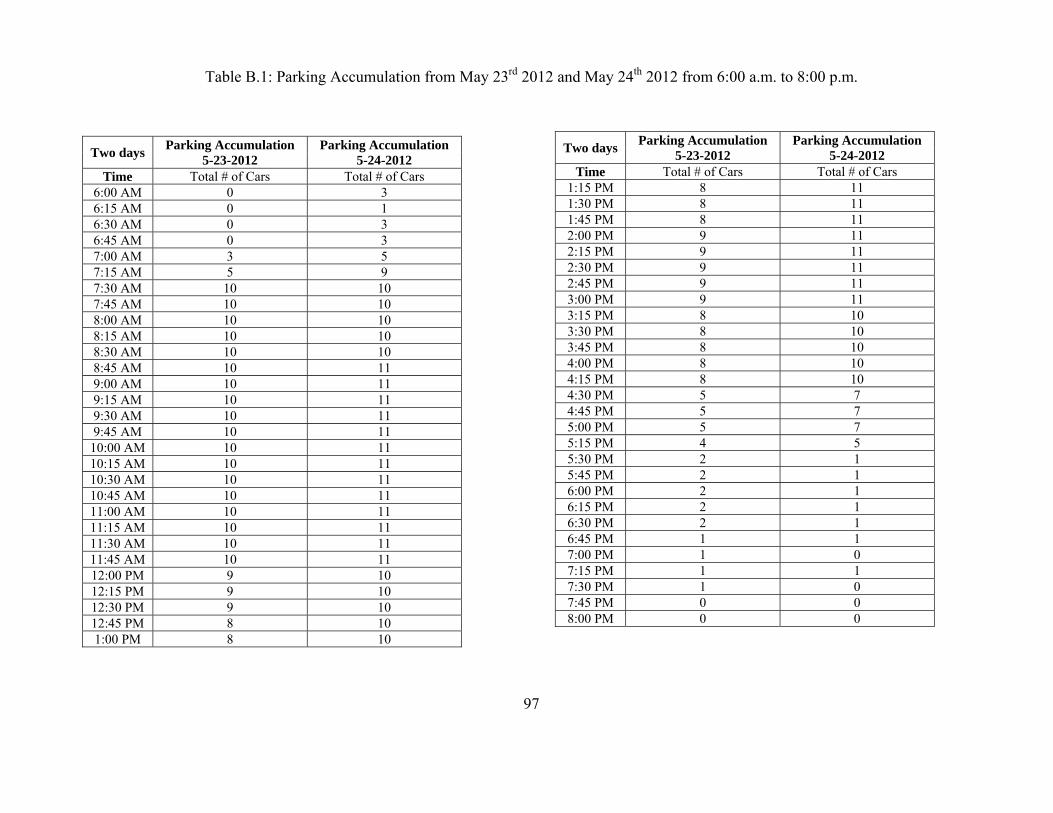
97
Table B.1: Parking Accumulation from May 23rd 2012 and May 24th 2012 from 6:00 a.m. to 8:00 p.m.
Two days Parking Accumulation
5-23-2012 Parking Accumulation
5-24-2012 Time Total # of Cars Total # of Cars
6:00 AM 0 3 6:15 AM 0 1 6:30 AM 0 3 6:45 AM 0 3 7:00 AM 3 5 7:15 AM 5 9 7:30 AM 10 10 7:45 AM 10 10 8:00 AM 10 10 8:15 AM 10 10 8:30 AM 10 10 8:45 AM 10 11 9:00 AM 10 11 9:15 AM 10 11 9:30 AM 10 11 9:45 AM 10 11
10:00 AM 10 11 10:15 AM 10 11 10:30 AM 10 11 10:45 AM 10 11 11:00 AM 10 11 11:15 AM 10 11 11:30 AM 10 11 11:45 AM 10 11 12:00 PM 9 10 12:15 PM 9 10 12:30 PM 9 10 12:45 PM 8 10 1:00 PM 8 10
Two days Parking Accumulation
5-23-2012 Parking Accumulation
5-24-2012 Time Total # of Cars Total # of Cars
1:15 PM 8 11 1:30 PM 8 11 1:45 PM 8 11 2:00 PM 9 11 2:15 PM 9 11 2:30 PM 9 11 2:45 PM 9 11 3:00 PM 9 11 3:15 PM 8 10 3:30 PM 8 10 3:45 PM 8 10 4:00 PM 8 10 4:15 PM 8 10 4:30 PM 5 7 4:45 PM 5 7 5:00 PM 5 7 5:15 PM 4 5 5:30 PM 2 1 5:45 PM 2 1 6:00 PM 2 1 6:15 PM 2 1 6:30 PM 2 1 6:45 PM 1 1 7:00 PM 1 0 7:15 PM 1 1 7:30 PM 1 0 7:45 PM 0 0 8:00 PM 0 0
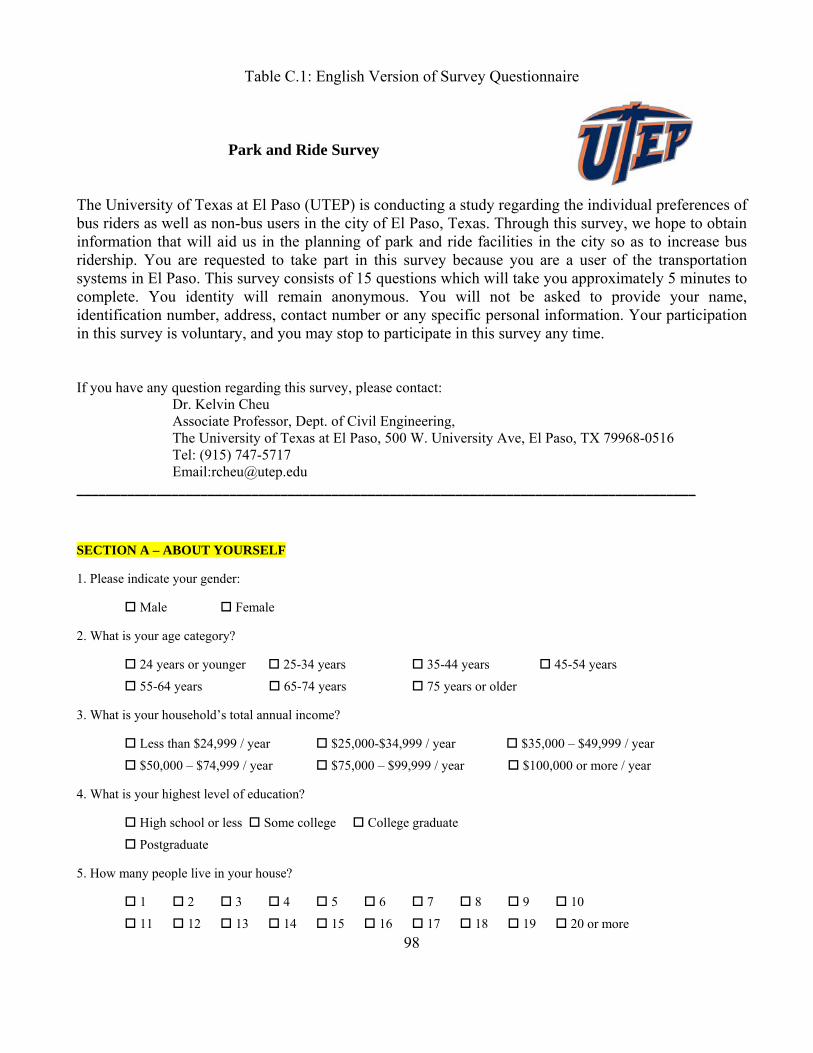
98
Table C.1: English Version of Survey Questionnaire
Park and Ride Survey The University of Texas at El Paso (UTEP) is conducting a study regarding the individual preferences of bus riders as well as non-bus users in the city of El Paso, Texas. Through this survey, we hope to obtain information that will aid us in the planning of park and ride facilities in the city so as to increase bus ridership. You are requested to take part in this survey because you are a user of the transportation systems in El Paso. This survey consists of 15 questions which will take you approximately 5 minutes to complete. You identity will remain anonymous. You will not be asked to provide your name, identification number, address, contact number or any specific personal information. Your participation in this survey is voluntary, and you may stop to participate in this survey any time. If you have any question regarding this survey, please contact:
Dr. Kelvin Cheu Associate Professor, Dept. of Civil Engineering, The University of Texas at El Paso, 500 W. University Ave, El Paso, TX 79968-0516 Tel: (915) 747-5717 Email:[email protected]
_____________________________________________________________________________________
SECTION A – ABOUT YOURSELF
1. Please indicate your gender:
Male Female
2. What is your age category?
24 years or younger 25-34 years 35-44 years 45-54 years
55-64 years 65-74 years 75 years or older
3. What is your household’s total annual income?
Less than $24,999 / year $25,000-$34,999 / year $35,000 – $49,999 / year
$50,000 – $74,999 / year $75,000 – $99,999 / year $100,000 or more / year
4. What is your highest level of education?
High school or less Some college College graduate
Postgraduate
5. How many people live in your house?
1 2 3 4 5 6 7 8 9 10
11 12 13 14 15 16 17 18 19 20 or more
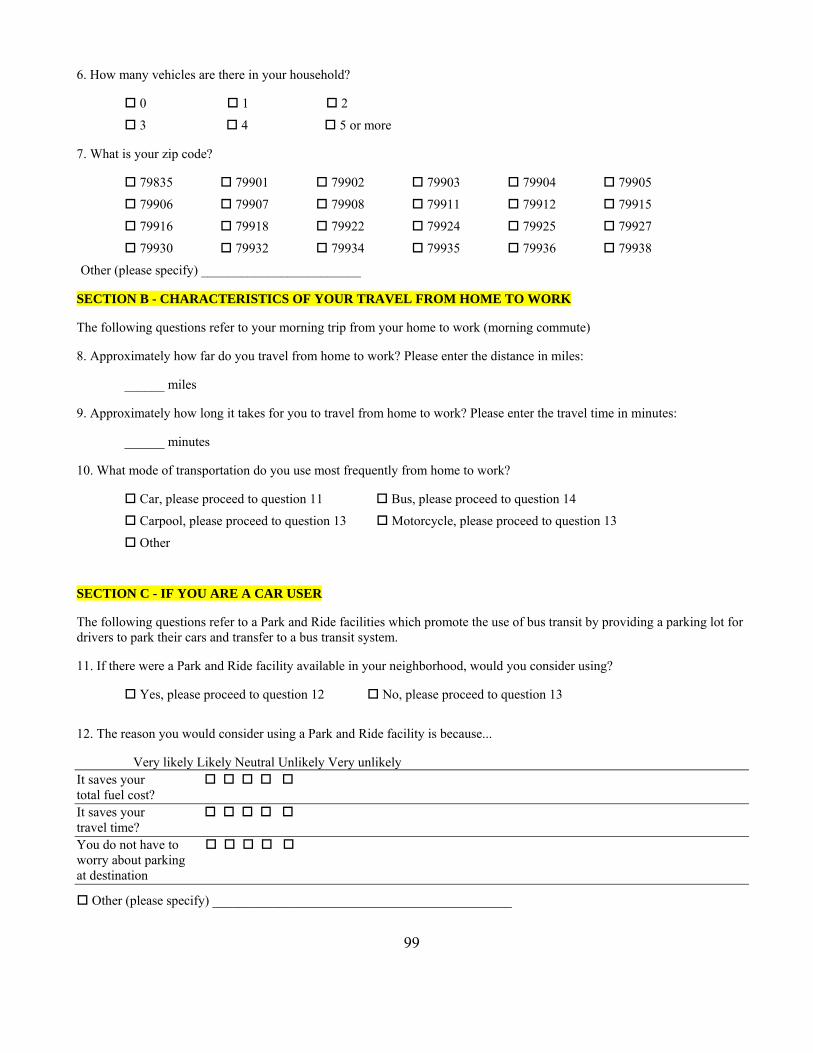
99
6. How many vehicles are there in your household?
0 1 2
3 4 5 or more
7. What is your zip code?
79835 79901 79902 79903 79904 79905
79906 79907 79908 79911 79912 79915
79916 79918 79922 79924 79925 79927
79930 79932 79934 79935 79936 79938
Other (please specify) ________________________
SECTION B - CHARACTERISTICS OF YOUR TRAVEL FROM HOME TO WORK
The following questions refer to your morning trip from your home to work (morning commute)
8. Approximately how far do you travel from home to work? Please enter the distance in miles:
______ miles
9. Approximately how long it takes for you to travel from home to work? Please enter the travel time in minutes:
______ minutes
10. What mode of transportation do you use most frequently from home to work?
Car, please proceed to question 11 Bus, please proceed to question 14
Carpool, please proceed to question 13 Motorcycle, please proceed to question 13
Other
SECTION C - IF YOU ARE A CAR USER
The following questions refer to a Park and Ride facilities which promote the use of bus transit by providing a parking lot for drivers to park their cars and transfer to a bus transit system.
11. If there were a Park and Ride facility available in your neighborhood, would you consider using?
Yes, please proceed to question 12 No, please proceed to question 13
12. The reason you would consider using a Park and Ride facility is because...
Very likely Likely Neutral Unlikely Very unlikely It saves your total fuel cost? It saves your travel time? You do not have to worry about parking at destination
Other (please specify) _____________________________________________
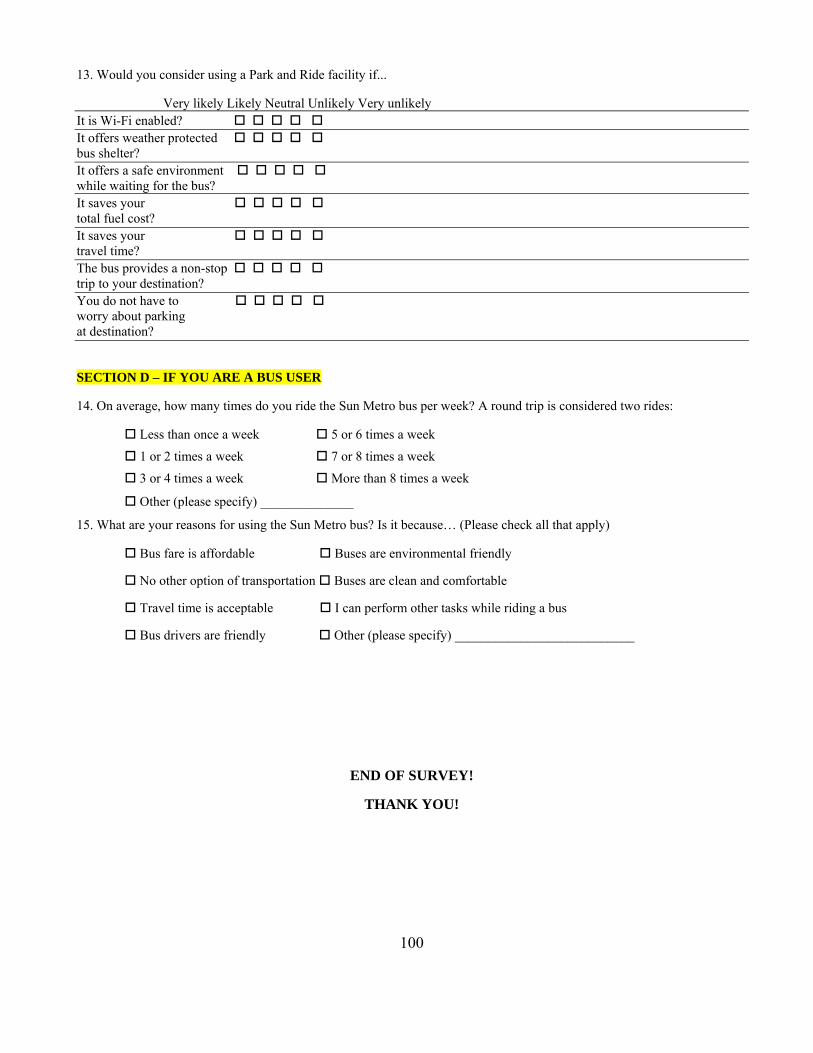
100
13. Would you consider using a Park and Ride facility if...
Very likely Likely Neutral Unlikely Very unlikely It is Wi-Fi enabled? It offers weather protected bus shelter? It offers a safe environment while waiting for the bus? It saves your total fuel cost? It saves your travel time? The bus provides a non-stop trip to your destination? You do not have to worry about parking at destination?
SECTION D – IF YOU ARE A BUS USER
14. On average, how many times do you ride the Sun Metro bus per week? A round trip is considered two rides:
Less than once a week 5 or 6 times a week
1 or 2 times a week 7 or 8 times a week
3 or 4 times a week More than 8 times a week
Other (please specify) ______________
15. What are your reasons for using the Sun Metro bus? Is it because… (Please check all that apply)
Bus fare is affordable Buses are environmental friendly
No other option of transportation Buses are clean and comfortable
Travel time is acceptable I can perform other tasks while riding a bus
Bus drivers are friendly Other (please specify) ___________________________
END OF SURVEY!
THANK YOU!
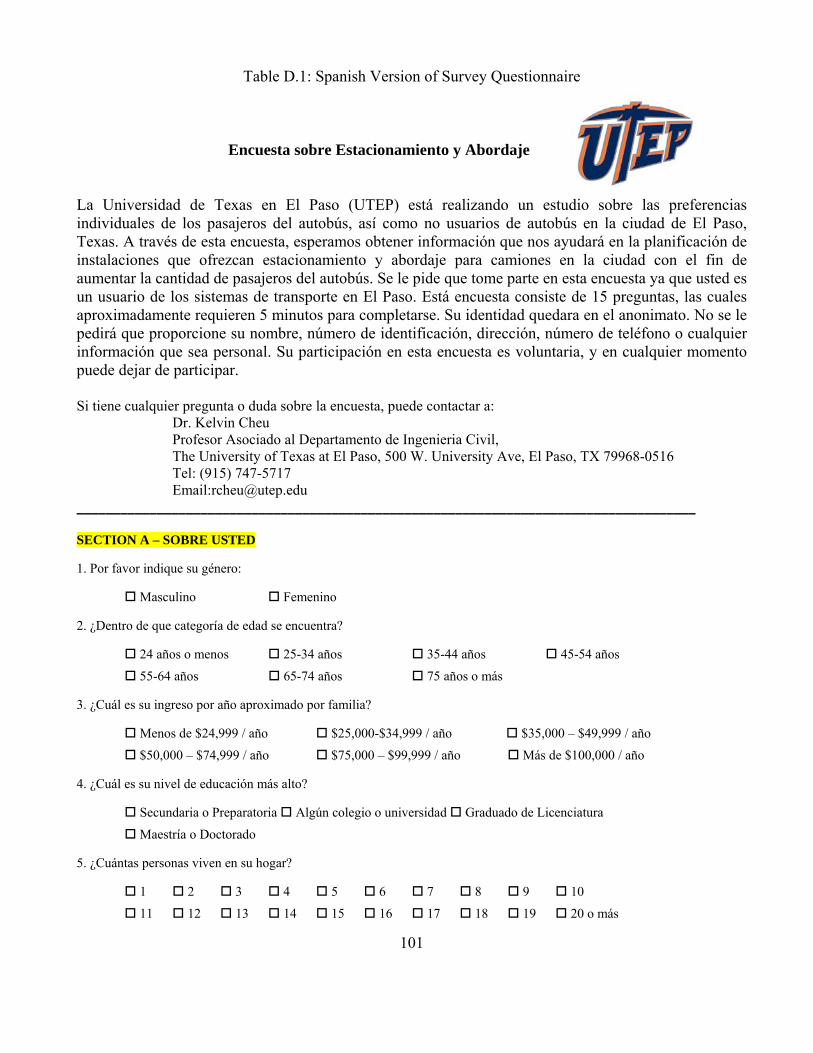
101
Table D.1: Spanish Version of Survey Questionnaire
Encuesta sobre Estacionamiento y Abordaje La Universidad de Texas en El Paso (UTEP) está realizando un estudio sobre las preferencias individuales de los pasajeros del autobús, así como no usuarios de autobús en la ciudad de El Paso, Texas. A través de esta encuesta, esperamos obtener información que nos ayudará en la planificación de instalaciones que ofrezcan estacionamiento y abordaje para camiones en la ciudad con el fin de aumentar la cantidad de pasajeros del autobús. Se le pide que tome parte en esta encuesta ya que usted es un usuario de los sistemas de transporte en El Paso. Está encuesta consiste de 15 preguntas, las cuales aproximadamente requieren 5 minutos para completarse. Su identidad quedara en el anonimato. No se le pedirá que proporcione su nombre, número de identificación, dirección, número de teléfono o cualquier información que sea personal. Su participación en esta encuesta es voluntaria, y en cualquier momento puede dejar de participar. Si tiene cualquier pregunta o duda sobre la encuesta, puede contactar a:
Dr. Kelvin Cheu Profesor Asociado al Departamento de Ingenieria Civil, The University of Texas at El Paso, 500 W. University Ave, El Paso, TX 79968-0516 Tel: (915) 747-5717 Email:[email protected]
_____________________________________________________________________________________
SECTION A – SOBRE USTED
1. Por favor indique su género:
Masculino Femenino
2. ¿Dentro de que categoría de edad se encuentra?
24 años o menos 25-34 años 35-44 años 45-54 años
55-64 años 65-74 años 75 años o más
3. ¿Cuál es su ingreso por año aproximado por familia?
Menos de $24,999 / año $25,000-$34,999 / año $35,000 – $49,999 / año
$50,000 – $74,999 / año $75,000 – $99,999 / año Más de $100,000 / año
4. ¿Cuál es su nivel de educación más alto?
Secundaria o Preparatoria Algún colegio o universidad Graduado de Licenciatura
Maestría o Doctorado
5. ¿Cuántas personas viven en su hogar?
1 2 3 4 5 6 7 8 9 10
11 12 13 14 15 16 17 18 19 20 o más
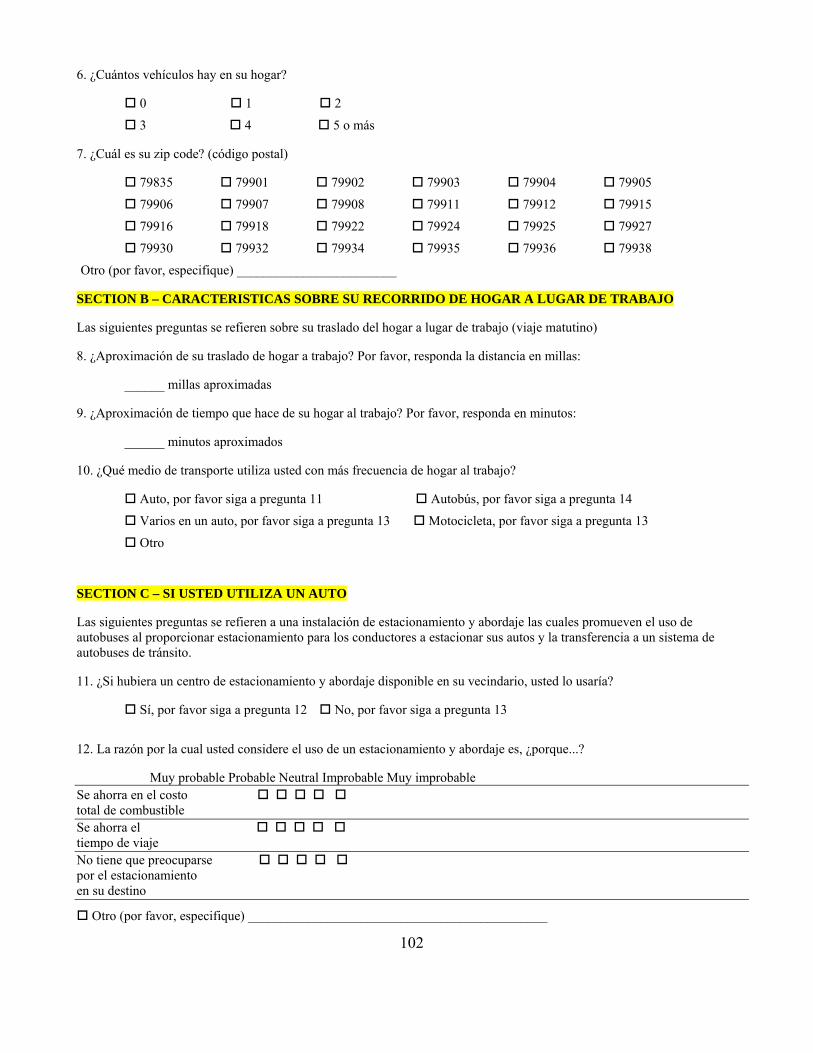
102
6. ¿Cuántos vehículos hay en su hogar?
0 1 2
3 4 5 o más
7. ¿Cuál es su zip code? (código postal)
79835 79901 79902 79903 79904 79905
79906 79907 79908 79911 79912 79915
79916 79918 79922 79924 79925 79927
79930 79932 79934 79935 79936 79938
Otro (por favor, especifique) ________________________
SECTION B – CARACTERISTICAS SOBRE SU RECORRIDO DE HOGAR A LUGAR DE TRABAJO
Las siguientes preguntas se refieren sobre su traslado del hogar a lugar de trabajo (viaje matutino)
8. ¿Aproximación de su traslado de hogar a trabajo? Por favor, responda la distancia en millas:
______ millas aproximadas
9. ¿Aproximación de tiempo que hace de su hogar al trabajo? Por favor, responda en minutos:
______ minutos aproximados
10. ¿Qué medio de transporte utiliza usted con más frecuencia de hogar al trabajo?
Auto, por favor siga a pregunta 11 Autobús, por favor siga a pregunta 14
Varios en un auto, por favor siga a pregunta 13 Motocicleta, por favor siga a pregunta 13
Otro
SECTION C – SI USTED UTILIZA UN AUTO
Las siguientes preguntas se refieren a una instalación de estacionamiento y abordaje las cuales promueven el uso de autobuses al proporcionar estacionamiento para los conductores a estacionar sus autos y la transferencia a un sistema de autobuses de tránsito.
11. ¿Si hubiera un centro de estacionamiento y abordaje disponible en su vecindario, usted lo usaría?
Sí, por favor siga a pregunta 12 No, por favor siga a pregunta 13
12. La razón por la cual usted considere el uso de un estacionamiento y abordaje es, ¿porque...?
Muy probable Probable Neutral Improbable Muy improbable Se ahorra en el costo total de combustible Se ahorra el tiempo de viaje No tiene que preocuparse por el estacionamiento en su destino
Otro (por favor, especifique) _____________________________________________
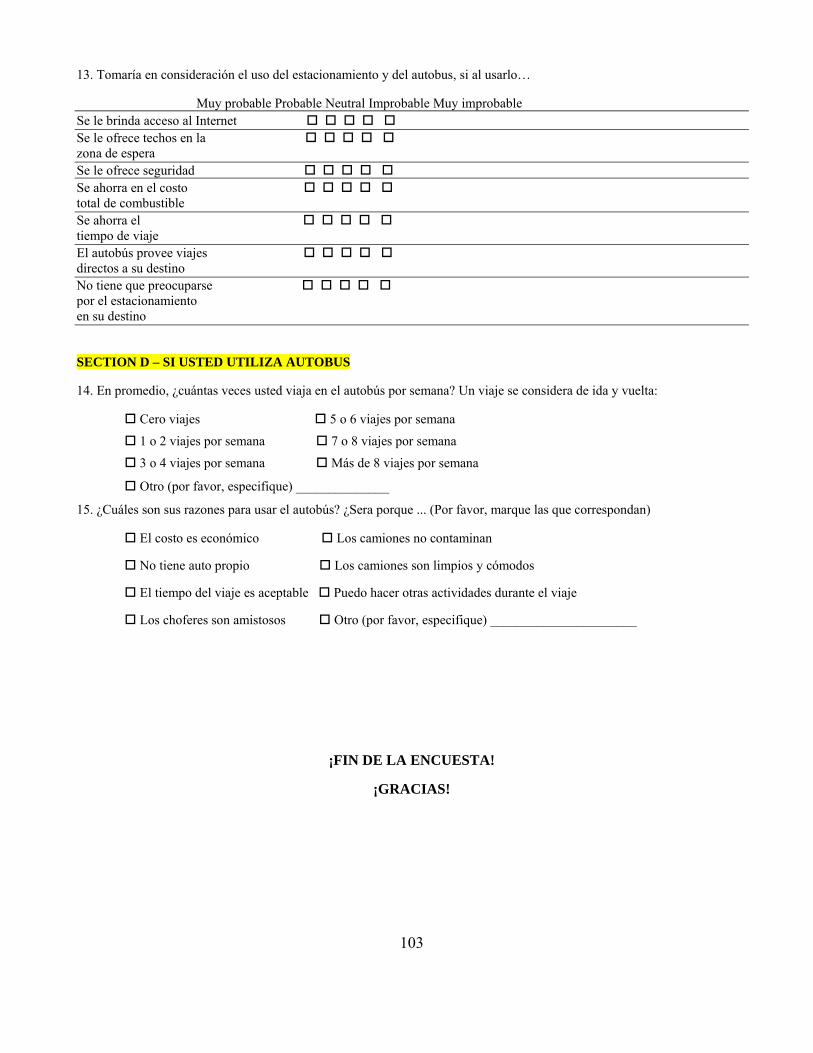
103
13. Tomaría en consideración el uso del estacionamiento y del autobus, si al usarlo…
Muy probable Probable Neutral Improbable Muy improbable Se le brinda acceso al Internet Se le ofrece techos en la zona de espera Se le ofrece seguridad Se ahorra en el costo total de combustible Se ahorra el tiempo de viaje El autobús provee viajes directos a su destino No tiene que preocuparse por el estacionamiento en su destino
SECTION D – SI USTED UTILIZA AUTOBUS
14. En promedio, ¿cuántas veces usted viaja en el autobús por semana? Un viaje se considera de ida y vuelta:
Cero viajes 5 o 6 viajes por semana
1 o 2 viajes por semana 7 o 8 viajes por semana
3 o 4 viajes por semana Más de 8 viajes por semana
Otro (por favor, especifique) ______________
15. ¿Cuáles son sus razones para usar el autobús? ¿Sera porque ... (Por favor, marque las que correspondan)
El costo es económico Los camiones no contaminan
No tiene auto propio Los camiones son limpios y cómodos
El tiempo del viaje es aceptable Puedo hacer otras actividades durante el viaje
Los choferes son amistosos Otro (por favor, especifique) ______________________
¡FIN DE LA ENCUESTA!
¡GRACIAS!
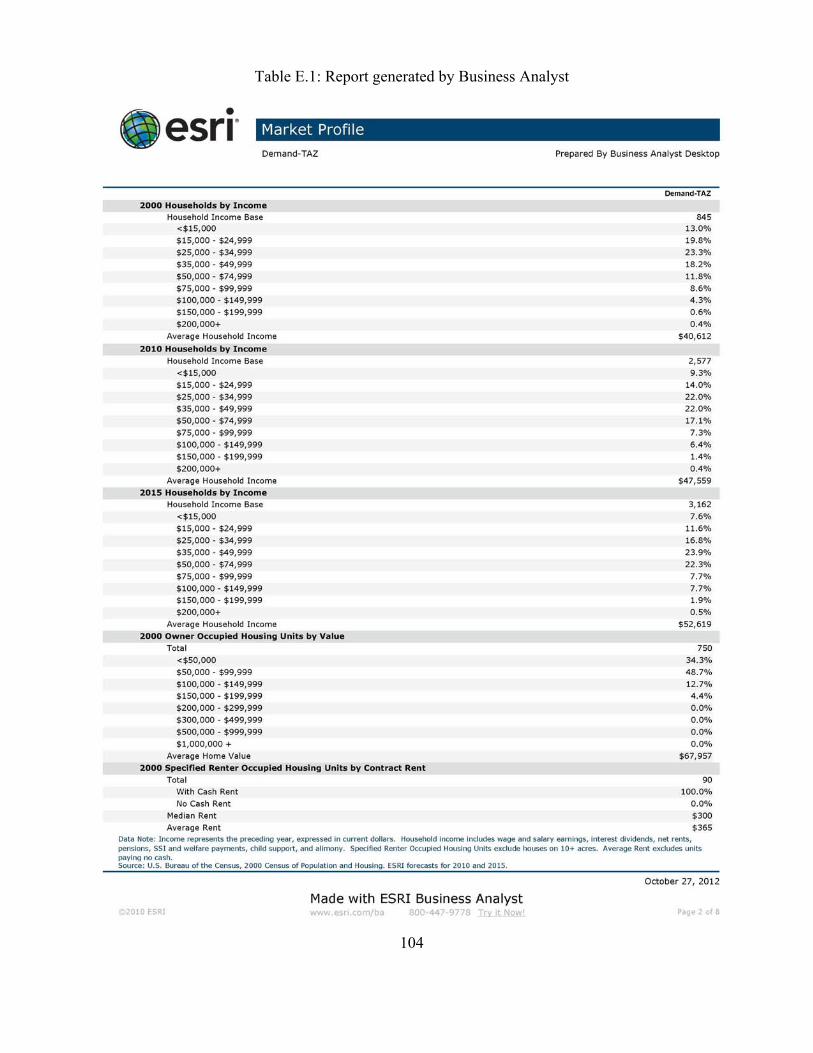
104
Table E.1: Report generated by Business Analyst

105
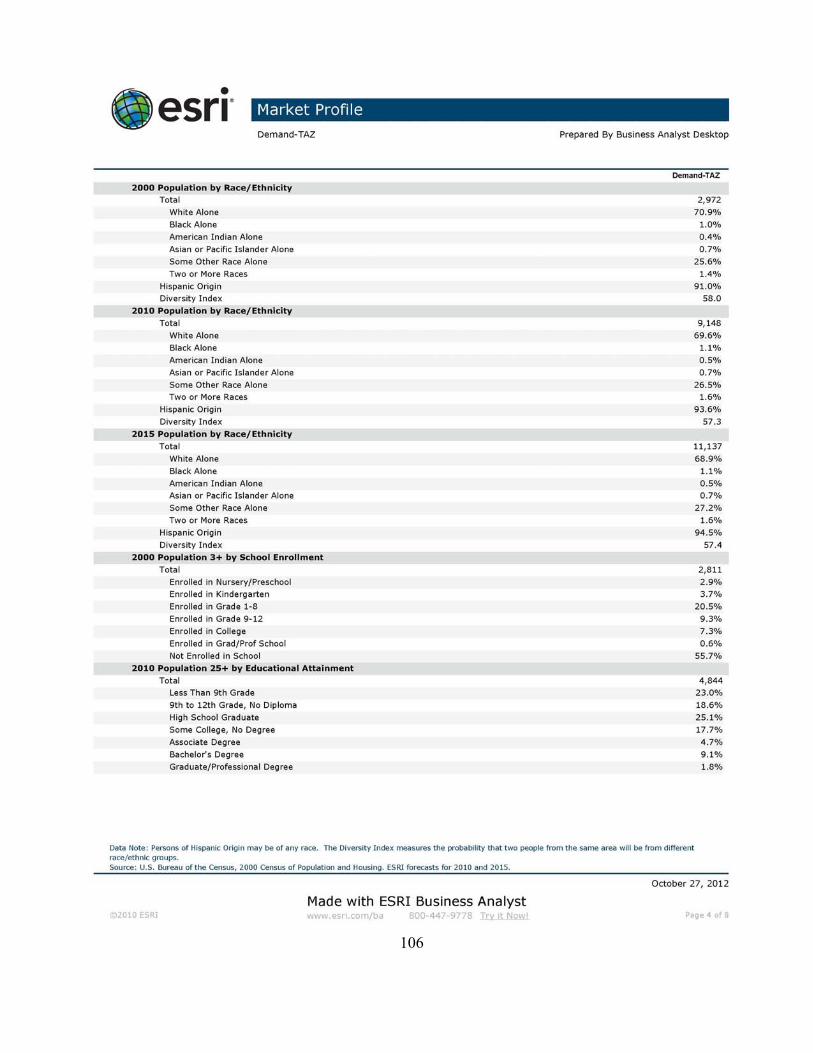
106
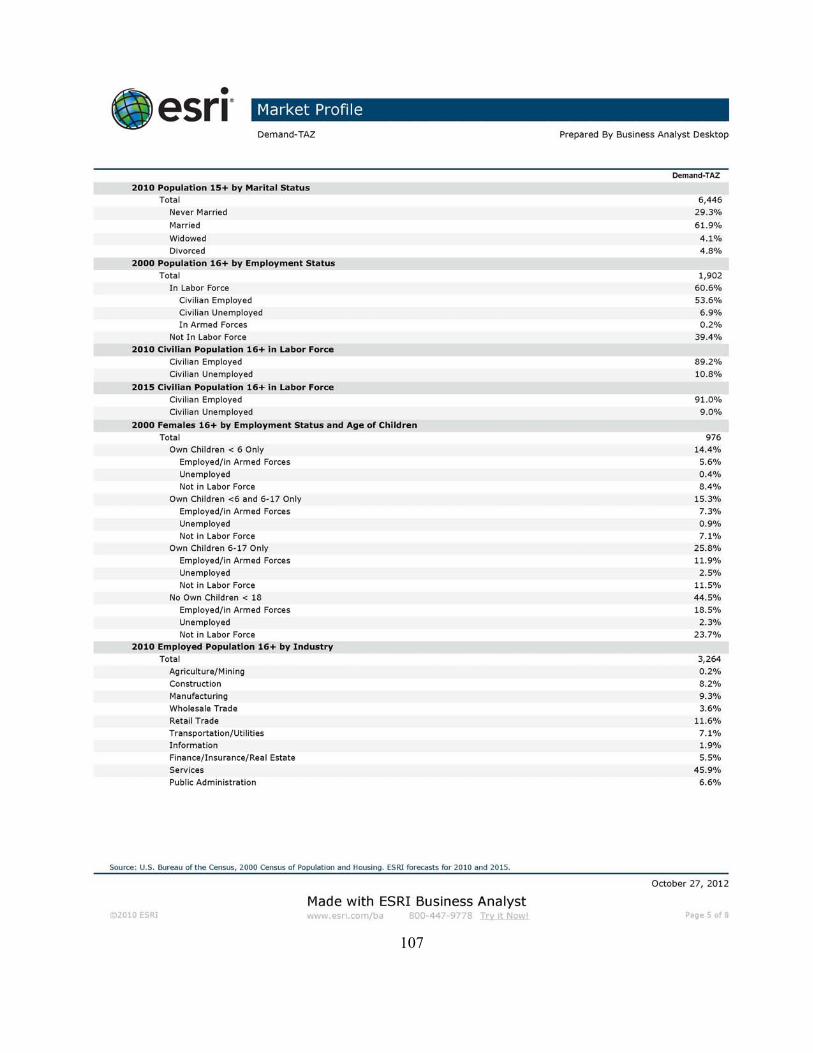
107
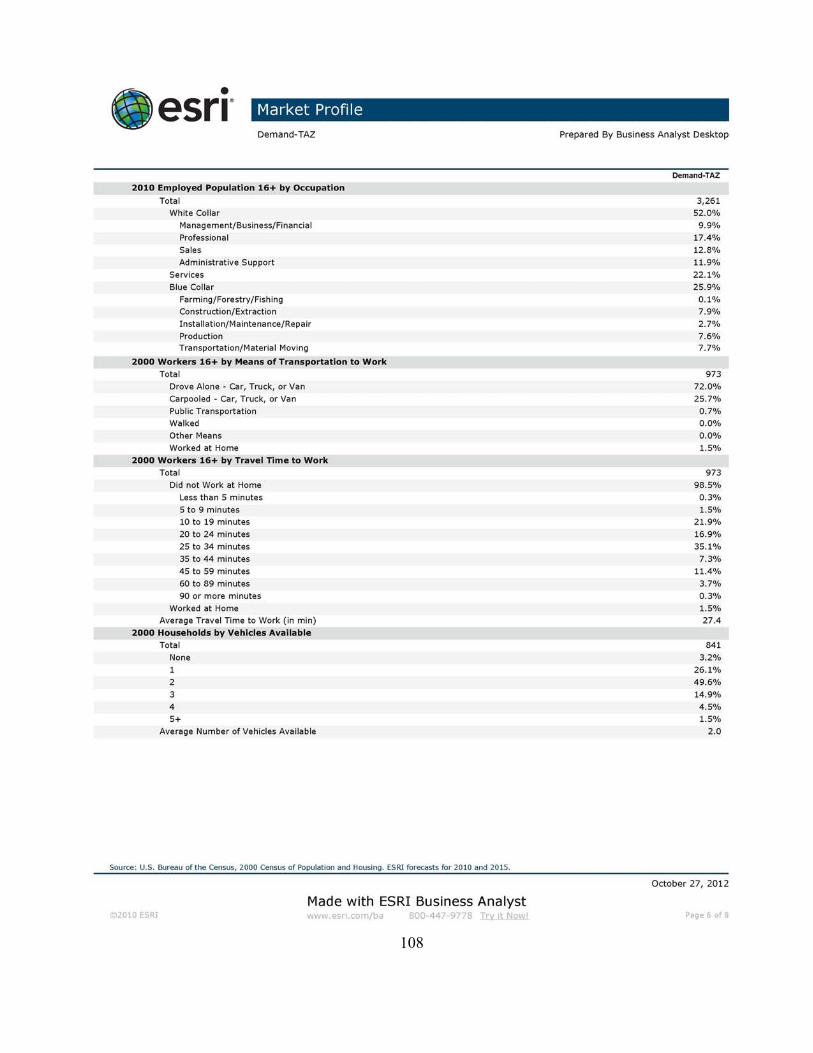
108
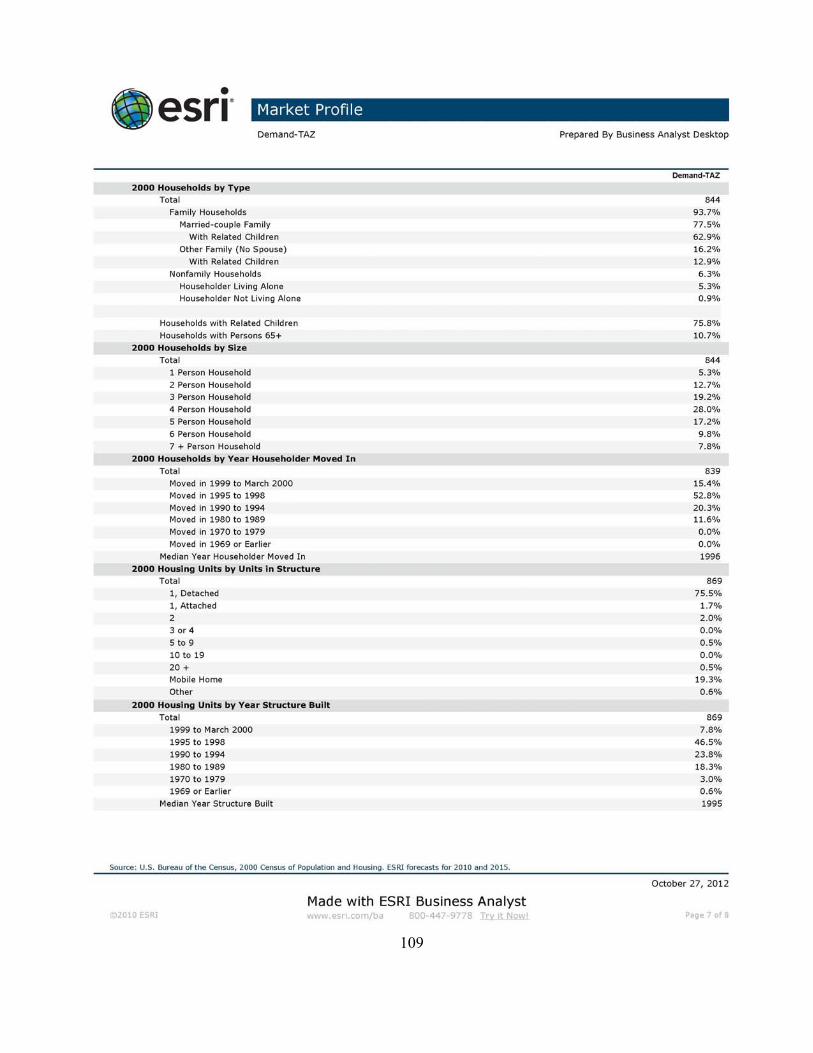
109

110
111
Vita
Lorenzo Emanuel Cornejo Heredia was born in El Paso, Texas on April 16, 1987, the second
born child and son of José de Jesús Cornejo and Hilda Heredia. After graduating from Burges High
School in 2006, he entered the University of Texas at El Paso, Department of Civil Engineering. He
received his Bachelor of Science degree in Civil Engineering at the University of Texas at El Paso, in
August 2011. In August of 2011, he joined the Graduate Master’s Program at the University of Texas at
El Paso in the Transportation Engineering.
Permanent address: 6400 Edgemere Boulevard Apt. # 10
El Paso, Texas 79925
This thesis was typed by Lorenzo E. Cornejo.