
Systematic Alpha Monthly - Credit Suisse
53
DISCLOSURE APPENDIX AT THE BACK OF THIS REPORT CONTAINS IMPORTANT DISCLOSURES, LEGAL ENTITY DISCLOSURE AND ANALYST CERTIFICATIONS. 13 October 2016 Americas Fixed Income Research Index and Alpha Strategy INSTITUTIONAL CLIENTS ONLY/DO NOT FORWARD Systematic Alpha Monthly Research Analysts Baldwin Smith 212 325 5524 [email protected] Yongchu Song 212 538 7013 [email protected] Sherry Li 212-538-2585 [email protected] Olivia Zhong 1 212 538 4328 [email protected] Steven Tang 212 538 0339 [email protected] September 2016 ■ In this month’s Research Spotlight section, we examine the Credit Suisse Multi-Asset Trend Index Suite (MATRIX). ■ The MATRIX strategy is a trend-following strategy that aims to benefit from momentum across a variety of asset classes. ■ It attempts to do so by generating momentum signals comparing exponential moving averages in different time period. ■ Since its inception in April 2002, a multiple asset class basket index with global equity and bonds exposure within MATRIX suite has a Sharpe of 1.25 outperforming the traditional 60-40 portfolio with a Sharpe of 0.61.
Transcript of Systematic Alpha Monthly - Credit Suisse

DISCLOSURE APPENDIX AT THE BACK OF THIS REPORT CONTAINS IMPORTANT DISCLOSURES, LEGAL ENTITY DISCLOSURE AND ANALYST CERTIFICATIONS.
13 October 2016
Americas Fixed Income Research Index and Alpha Strategy
INSTITUTIONAL CLIENTS ONLY/DO NOT FORWARD
Systematic Alpha Monthly
Research Analysts
Baldwin Smith
212 325 5524
Yongchu Song
212 538 7013
Sherry Li
212-538-2585
Olivia Zhong
1 212 538 4328
Steven Tang
212 538 0339
September 2016
■ In this month’s Research Spotlight section, we examine the Credit Suisse
Multi-Asset Trend Index Suite (MATRIX).
■ The MATRIX strategy is a trend-following strategy that aims to benefit from
momentum across a variety of asset classes.
■ It attempts to do so by generating momentum signals comparing
exponential moving averages in different time period.
■ Since its inception in April 2002, a multiple asset class basket index with
global equity and bonds exposure within MATRIX suite has a Sharpe of
1.25 outperforming the traditional 60-40 portfolio with a Sharpe of 0.61.

13 October 2016
Systematic Alpha Monthly 2
Table of contents
Global Market Overview 4
Credit Suisse Alpha Strategies Platform 5
Individual Strategy Performance 6
Research Spotlight: Credit Suisse Multi-Asset Trend Index Suite (MATRIX) 8
Strategy Snapshots 12
Smart Beta 13
HS Global Style Rotation 13
HS Global Style Rotation Equity Hedged 14
HS Market Neutral Index Powered by HOLT® 15
Global Enhanced Momentum Strategy 16
GAINS 01E 17
Commodity Backwardation 18
Alternative Risk Premia 19
Global Carry Selector 19
Global Carry Selector II 20
Advanced Relative Value Volatility Index 21
Mean Reversion Index on Euro Stoxx 50 22
Dividend Alpha Index on Euro Stoxx 50 23
Adaptive Volatility Index Global 24
Adaptive Term Premium Index 25
Commodity Backwardation RV 26
Commodity Momentum Long/Short 27
Commodity Custom 24 Alpha 28
Commodity Custom 88 Enhanced 29
FX Metrics Carry 30
FX Metrics Momentum 31
FX Metrics Value 32
Dynamic Multi Asset Allocation 33
RAII HOLT®: Risk Appetite Investible Index Powered by HOLT® 33
RAII HOLT® Relative Value 34
ARROW 6% 35
Multi-Asset Futures Strategy 36
MASTRO 37
Systematic Tactical Asset Allocation 38
TEMPO 39
13 October 2016
Systematic Alpha Monthly 3
Portfolio Hedging 40
Equity Dynamic Tail Hedge SPX Index 40
Cheapest Slide Index 41
Advanced Defensive Volatility Index 42
Tail Risk Overlay Protection Strategy 43
Liquid Alternative Beta 44
Liquid Alternative Beta 44
Long/Short Liquid Index 45
Event-Driven Liquid Index 46
Merger Arbitrage Liquid Index 47
Managed Futures Liquid Index 48
Global Strategies Liquid Index 49

13 October 2016
Systematic Alpha Monthly 4
Global Market Overview Economics:The September Employment
Report was mostly in line with expectations, and does not fundamentally change the
broader US outlook. Payrolls growth remains on its slowing trend and income details recovered after a disappointing August report.
While this is not quite strong enough to return income growth to its previous trends, it does allay concerns about a sharper slowdown. CS
economists continue to expect personal consumption growth to soften slightly in H2 2016. Solid payrolls growth and the rebound in
labor income will support the hawkish case for a December hike. On the other hand, a sideways unemployment rate and continued
sluggishness in wage growth suggest there is little overheating in the labor market and few signs of inflationary pressure. In our view, the
data appear sufficient to support a hike this year, but the Fed’s cautious approach and the risks from the presidential election make further
delays more likely than not.
■ Fixed Income: The recent back-up in yields
has come on the back of a repricing of Fed hike expectations along with a shift in
international dynamics that had been supporting Treasuries. CS rates strategists expect that front-end inflation BEi will be more
sensitive to oil prices than the long end, marking the return of a more traditional relationship when compared to that observed
from mid-2014 to late last year.
■ Equities: While markets have shown
resilience following the UK referendum, CS equity strategists believe US equities remain
vulnerable to bad news heading into year-end, with risk of shifting negative due to recent weakness in buyback activity.
■ FX: CS FX strategists continue to expect the
PBOC to guide the CNY down about 1% - 1.5% vs. the CFETS basket over the next several months or 93.0 – 93.5 on the basket. This
would imply 6.69 – 6.72 on USDCNY given their broad USD forecast set, including their forecast for USDJPY to fall to 95. They
maintain the forecasts for 6.71 on USDCNY in 3 months and 6.80 in 12 months. A risk is that
the US Fed signals a rate hike at its December
meeting supporting the USD close to current levels. In this scenario their forecast for the CNY vs. its basket would imply 6.678 – 6.798
on USDCNY.
■ Commodities: CS commodity strategists think
that oil markets will remain trapped in a range of $45/b Brent plus or minus $5 through winter.
Fundamentally things will not likely tighten up in the next two quarters; but unlike last year, the wheels are not coming off the
fundamentals cart either. Starved without revenue, the industry and many sovereigns have had to cut back upstream activity sharply,
and oil production is falling in most places.
WTI Crude, Aug 1 to Oct 13, 2016
Note: Data as of 09/30/2016 Source: the BLOOMBERG PROFESSIONAL™ service, Credit Suisse
USDCNY, Aug 1 to Oct 13, 2016
Note: Data as of 09/30/2016 Source: the BLOOMBERG PROFESSIONAL™ service, Credit Suisse
Benchmark Performance
Benchmark
Current
Level
Sept
2016
2016 YTD
Return
VIX 17.1 -0.13 -4.92
MSCI World 1695.5 0.4% 3.8%
S&P GSCI 224.5 4.1% 5.1%
S&P 500 2139.2 -0.1% 6.1%
JPM Global Bond 384.1 -0.1% 6.8%
US 10yr Yield 1.74 0.01 -0.68
Gold 1259.2 0.5% 24.0%
Moody's BAA Spread 189.9 0.8% -20.5%
Note: Current level Data as of 10/13/2016; Sept 2016 uses Data as of 09/30/2016;Source: the BLOOMBERG PROFESSIONAL™ service, Credit Suisse
35
37
39
41
43
45
47
49
51
53
55
1-Aug 16-Aug 31-Aug 15-Sep 30-Sep
WTI Crude
6.56
6.58
6.6
6.62
6.64
6.66
6.68
6.7
6.72
6.74
1-Aug 16-Aug 31-Aug 15-Sep 30-Sep
USDCNY Curncy

13 O
cto
be
r 201
6
Credit Suisse Alpha Strategies Platform
Equities FX Interest Rates Commodities Multi-Asset
Smart Beta HOLT family Sector
Rotation GAINS LAB Broad
Backwardation LAB Managed
Futures
Alternative Risk Premia
Global Carry Selector family
Mean Reversion Momentum Adaptive
Volatility Backwardation
RV RAII HOLT Relative
Value
Advanced RVOL Dividend Alpha Carry Adaptive Term
Premium Momentum Long/Short
LAB Merger Arbitrage
LAB Long/Short Value GEMS Custom 24 Alpha LAB Event Driven
Custom 88 Enhanced
Portfolio Hedging
Dynamic Tail family
Advanced DVOL
TOPS
Cheapest Slide
Dynamic Asset Allocation
RAII HOLT STAA ARROW TEMPO CSMF1
Source: Credit Suisse

13 O
cto
be
r 201
6
Syste
matic
Alp
ha
Mo
nth
ly
6
Individual Strategy Performance
Strategy Asset ClassBloomberg
TickerLive Date Sep-16 Year-to-Date Past 12-Months
Total Return
Since Live
Past 12-
MonthsSince Live
Smart Beta
HS Global Sty le Rotation Equities HSGSRTR 10/14/2009 0.57% 6.18% 9.97% 10.97% 0.74 0.71
HS Global Sty le Rotation Equity Hedged Equities HSGSREH 1/4/2010 -0.03% -0.19% -1.99% 1.19% -0.55 0.36
HS Market Neutral Equities HSGMN 1/9/2007 0.18% -5.14% -4.88% -1.39% -1.07 -0.26
Global Enhanced Momentum Strategy Interest Rates CSGMEREU 1/1/2012 -0.51% -0.32% -1.00% -0.28% -0.56 -0.17
GAINS 01E Commodities CSGADER 10/15/2008 3.32% 8.30% -0.56% 0.33% -0.04 0.02
GAINS S&P GSCI Commodities CSGAGSER 10/15/2008 4.44% 5.27% -7.81% -3.37% -0.35 -0.17
GAINS 01E Long/Short Commodities CSGADLSE 10/15/2008 0.73% -0.94% 1.09% 9.60% 0.29 0.87
Commodity Backw ardation Commodities CSCUBKER 03/27/2012 2.38% 4.56% 3.15% -7.73% 0.26 -0.67
Alternative Risk Premia
Global Carry Selector Equities GCSCS 2/1/2009 3.42% -1.17% 7.45% 10.02% 0.52 0.49
Global Carry Selector II Equities GCSCS2 06/15/2012 1.21% -0.41% -0.94% -2.08% -0.14 -0.26
Adv anced Relativ e Value Volatility Equities CSEAARVL 09/26/2012 -0.73% 6.80% 2.01% -3.63% 0.30 -0.58
Mean Rev ersion on Euro Stox x 50 Equities CSEAMREU 03/27/2013 0.56% 10.93% 11.38% 3.44% 1.40 0.41
Div idend Alpha on Euro Stox x 50 Equities CSEADVAE 11/10/2013 1.28% 4.10% 3.69% 1.39% 1.23 0.35
Adaptiv e Volatility Index – Global Interest Rates CSVIXAEU 1/9/2012 0.58% 3.24% 4.93% 2.37% 1.21 0.58
Adaptiv e Volatility Index – USD Interest Rates CSVIXUSD 1/3/2009 0.67% 6.15% 8.42% 12.89% 1.48 1.39
Adaptiv e Volatility Index – JPY Interest Rates CSVIXJPY 1/1/2011 2.28% -2.81% -1.45% 1.99% -0.25 0.31
Adaptiv e Volatility Index – EUR Interest Rates CSVIXEUR 1/9/2012 -1.20% 6.44% 6.70% 4.42% 1.31 0.72
Adaptiv e Term Premium Index Interest Rates CATPU2P6 11/1/2011 -0.21% 2.83% 3.40% 2.06% 1.13 0.69
Commodity Backw ardation RV Commodities CSCUBKAE 3/6/2013 -0.72% -4.25% 4.98% 2.88% 0.47 0.34
Commodity Momentum Long/Short Commodities CSCUMLSE 11/12/2013 -0.07% -7.14% 2.44% 2.05% 0.17 0.19
Commodity Custom 24 Alpha Commodities CSCUS24A 2/15/2012 1.10% 8.60% 15.15% 11.13% 1.86 1.08
Commodity Custom 88 Enhanced Commodities CSCUE88E 6/18/2012 0.94% 2.30% 3.85% 2.24% 0.93 0.71
FX Metrics Carry FX FXMXCEUS 3/11/2010 0.61% 5.47% 8.25% -0.67% 0.89 -0.09
FX Metrics Momentum FX FXMXMEUS 3/11/2010 0.56% -3.92% -3.34% 0.11% -0.54 0.02
FX Metrics Value FX FXMXVEUS 3/11/2010 0.38% 1.50% 3.91% -0.09% 0.56 -0.02
RETURN SHARPE RATIO
Source: Credit Suisse
Note: Data as of 09/30/2016
Sharpe R at io : We calculate the Sharpe Ratio as the annualized average excess return divided by the annualized daily volat ility of the strategy. For excess return strategies, we simply use the raw strategy returns. For total return
strategies, we deduct the 1-month LIBOR for the currency in which the strategy is denominated. For more information, please visit us on Bloomberg at CSLI <GO>
Past performance should not be taken as an indicat ion or guarantee of future performance, and no representat ion or warranty, express or implied, is made regarding future performance. Information, opinions and est imates
contained in this report ref lect a judgment at the original date of publicat ion by CS and are subject to change without not ice. The price, value of and income from any of the securit ies or f inancial instruments mentioned in this report
can fall as well as rise. The value of securit ies and f inancial instruments may be subject to exchange rate f luctuat ion that may have a posit ive or adverse effect on the price or income of such securit ies or f inancial instruments. The P&L
results shown do not include relevant costs, such as commissions, interest charges, or other applicable expenses.

13 O
cto
be
r 201
6
Syste
matic
Alp
ha
Mo
nth
ly
7
Individual Strategy Performance (cont'd)
Strategy Asset ClassBloomberg
TickerLive Date Sep-16 Year-to-Date Past 12-Months
Total Return
Since Live
Past 12-
MonthsSince Live
Dynamic Multi Asset Allocation
RAII HOLT® Hy brid RAIIHUST 6/4/2010 1.15% -1.07% 3.37% 6.26% 0.19 0.43
RAII HOLT® Relativ e Value Hy brid RAIIHRVU 04/28/2011 0.45% -5.07% -5.60% -0.25% -0.63 -0.06
ARROW 6% Hy brid ARROWUT6 2/11/2011 0.29% 9.84% 7.78% 2.05% 1.37 0.35
Multi-Asset Futures Strategy Hy brid CSMF1ER 10/26/2011 2.38% 2.14% 3.98% 2.53% 0.34 0.27
MASTRO Hy brid CSMST4E 08/31/2010 0.65% -1.90% -2.42% -1.66% -0.31 -0.35
Sy stematic Tactical Asset Allocation Hy brid STAAUE 10/18/2013 0.05% 1.90% -0.34% -0.14% -0.07 -0.03
TEMPO Hy brid CSEATMP6 2/4/2014 -1.87% 3.63% 0.09% 0.28% 0.01 0.05
Portfolio Hedging
Equity Dy namic Tail Hedge SPX Index Equities CSEADTSP 12/15/2011 -0.04% -5.15% -6.25% -6.09% -3.58 -2.86
Cheapest Slide Index Equities CSEACHPS 8/12/2011 -0.75% -7.57% -10.54% -11.39% -0.73 -1.10
Adv anced Defensiv e Volatility Index Equities CSEAADVL 09/26/2012 -0.30% -4.92% -12.98% -10.20% -1.38 -1.15
Tail Risk Ov erlay Protection Strategy Interest Rates CSTSERUS 1/8/2011 -0.11% 1.14% 0.14% 2.57% 0.03 0.50
Liquid Alternative Beta
Liquid Alternativ e Beta Hy brid CSLAB 12/31/2009 0.45% 3.62% 4.16% 3.76% 0.95 0.62
Long/Short Liquid Index Equities CSLABLS 04/30/2008 0.46% -1.07% 2.99% 4.09% 0.44 0.40
Ev ent Driv en Liquid Index Hy brid CSLABED 12/31/2009 0.38% 8.28% 6.77% 5.37% 0.83 0.62
Merger Arbitrage Liquid Index Equities CSLABMA 12/31/2009 0.34% -1.23% 0.72% 1.51% 0.06 0.28
Managed Futures Liquid Index Hy brid CSLABMF 01/31/2011 0.45% 4.09% 1.85% 3.40% 0.15 0.32
RETURN SHARPE RATIO
Source: Credit Suisse
Note: Data as of 09/30/2016
Sharpe R at io : We calculate the Sharpe Ratio as the annualized average excess return divided by the annualized daily volat ility of the strategy. For excess return strategies, we simply use the raw strategy returns. For total return
strategies, we deduct the 1-month LIBOR for the currency in which the strategy is denominated. For more information, please visit us on Bloomberg at CSLI <GO>
Past performance should not be taken as an indicat ion or guarantee of future performance, and no representat ion or warranty, express or implied, is made regarding future performance. Information, opinions and est imates
contained in this report ref lect a judgment at the original date of publicat ion by CS and are subject to change without not ice. The price, value of and income from any of the securit ies or f inancial instruments mentioned in this report
can fall as well as rise. The value of securit ies and f inancial instruments may be subject to exchange rate f luctuat ion that may have a posit ive or adverse effect on the price or income of such securit ies or f inancial instruments. The P&L
results shown do not include relevant costs, such as commissions, interest charges, or other applicable expenses.

13 October 2016
Systematic Alpha Monthly 8
Research Spotlight: Credit Suisse Multi-Asset Trend Index Suite (MATRIX) Trend-following strategy takes advantage of a tendency that assets which have
outperformed will on average continue to have a better performance relative to peers, and
vice versa. This tendency, which is well-known as momentum, exhibits on various asset
markets. Many possible explanations for momentum exist, ranging from disequilibrium on the
market to investor irrationality. Trend can always be measured as positive autocorrelation of
asset prices, i.e., the asset price returns as positively correlated with the same asset’s
lagged return. Under the market environment when there’s a strong driver which causes the
upwards or downwards movement on asset prices, trend-following strategies perform well.
Moreover, those strategies can work as good diversifiers for risky asset portfolios under a
stressful environment.
Aiming to benefit from potential trends exhibited by a variety of assets, Credit Suisse has
developed the CS Multi-Asset Trend Index Suite. The suite contains three types of indices:
Single-Name Indices (SN Indices), which track trends of single types of assets, Single Class
Indices (SC Indices), which are baskets of SN Indices and track single asset class and
Multiple Asset Class Indices (MC Indices) tracking across several asset classes.
In Exhibit 1 and Exhibit 2 we plot one of the MC Indices, MTRXMLTL. This index is a basket
of equity SC Indices and bond SC Indices. We compare it with a group of trend-following
managed futures indices: NEIXCTA (SG CTA Index), BARCCTA (Barclay CTA Index) and
HEDGFUTR (Credit Suisse Managed Futures Liquidity Index). MTRXMLTL outperforms with
a higher Sharpe ratio of 1.25 and lower maximum drawdown of 7% since April 2002.
Exhibit 1: Cumulative Index Performance, Apr 2002 – Sep 2016
Exhibit 2: Performance Statistics, Apr 2002 – Sep 2016
Data as of Sep 30, 2016. Calculated on monthly basis. Data as of Sep 30, 2016
MTRXMLTL NEIXCTA BARCCTA HEDGFUTR
Annual Return
5.8% 5.6% 4.3% 6.5%
Annual Volatility
4.7% 8.2% 6.3% 11.6%
Sharpe Ratio
1.25 0.68 0.69 0.56
Max Drawdown
7% 12% 10% 17%
Source: the BLOOMBERG PROFESSIONAL™ service, Credit Suisse Source: the BLOOMBERG PROFESSIONAL™ service, Credit Suisse
Methodology
The trend signals are generated on SN Index level. Each SN Index component of the
strategy utilizes the exponentially weighted moving averages (EWMA) of its underlying
futures series. We capture trends by comparing EWMA with different terms. In addition, we
adjust weights to inversely proportional to the trailing volatility of the underlying futures for
the purpose of volatility control.
For multi-asset trend harvester SC Indices and MC Indices, the portfolio reconstitution
occurs each month, representing baskets with weights set up to equal on rebalance date and
adjusted afterwards. The daily weight adjustment uses inverse-volatility weighting manner
within asset classes (for SC Indices) and across asset classes (for MC Indices). Meanwhile,
volatility target with leverage cap are applied for basket indices.
50
100
150
200
250
300
2002 2004 2006 2008 2010 2012 2014 2016
MTRXMLTL Index NEIXCTA Index
BARCCTA Index HEDGFUTR Index

13 October 2016
Systematic Alpha Monthly 9
Exhibit 3: Structure of CS Multi-Asset Trend Index Suite
Source: Credit Suisse
Performance Analysis
In Exhibit 4 and Exhibit 5, we plot the time spot when long/short momentum signals are
triggered and how these signals enhance the performance of MATRIX indices. Take two
long/short SN Indices as an example. MTRXSRXB has underlying Euro Bund rolling futures
and MTRXSESB has US S&P E-mini futures as underlying instruments. Both of the charts
show that the signals perform well in capturing the potential underlying trends. When a
strong upward/downward movement appears on the market, the long/short position is
triggered timely to chase positive returns or cut losses.
Exhibit 4: Momentum signal for MTRXSRXB, Apr 2002 – Sep 2016
Exhibit 5: Momentum signal for MTRXSRSB, Apr 2002 – Sep 2016
LHS: index level. RHS: Signal value. Data as of Sep 30, 2016. LHS: index level. RHS: Signal value. Data as of Sep 30, 2016.
Source: the BLOOMBERG PROFESSIONAL™ service, Credit Suisse Source: the BLOOMBERG PROFESSIONAL™ service, Credit Suisse
Besides the efficiency of timing trends and gaining trend following returns, the strategy also
shows the feature of good risk diversification. Both of the advantages can be measured with
strength of correlations with benchmark indices. In the Exhibit 6 and 7, we plot 20 days and
180 days rolling correlation of SPX Index return with two MATRIX indices returns. Exhibit 6
shows MTRXSESB Index with S&P E-mini as underlying and Exhibit 7 shows MTRXCEQB
Index which is a SC Index with exposure on global equity market. When the market sells off,
as it did in during the financial crisis in 2008 and European debt crisis in 2011, the
correlations between MATRIX indices and benchmark index are negative, which shows the
delinking of those indices and market downside trend. On the other hand, the high positive
correlation when market is in risk on face could ensure the strategy will not miss upward
movements.
-1
-0.5
0
0.5
1
50
100
150
200
250
2002 2004 2006 2008 2010 2012 2014 2016
Momentum Long Signal
Momentum Short Signal
MTRXSRXB Index Value
Euro Bund Rolling Futures
-1
-0.5
0
0.5
1
50
100
150
200
250
2002 2004 2006 2008 2010 2012 2014 2016
Momentum Long SignalMomentum Short SignalMTRXSESB Index ValueS&P E-mini

13 October 2016
Systematic Alpha Monthly 10
Exhibit 6: 20- and 180-Day Rolling Correlations of MTRXSESB and SPX Index
Exhibit 7: 20- and 180-Day Rolling Correlations of MTRXCEQB and SPX Index
LHS: index level. RHS: rolling correlation. LHS: index level. RHS: rolling correlation.
Source: the BLOOMBERG PROFESSIONAL™ service, Credit Suisse Source: the BLOOMBERG PROFESSIONAL™ service, Credit Suisse
Multi-Asset Trend Harvester Annual Performance
Exhibits 8 and 9 show the annual return and Sharpe ratio for MTRXMLTL, which is one of
MC Indices and has constituents of global bonds and equity futures. To compare with
MTRXMLTL, we construct a hypothetical combined 60/40 portfolio which consists of 60% of
stocks and 40% of bonds. We use the return of SPX Index as equity asset return and return
of US 10-year treasury index (ticker: BCEY4T) as bond asset return. The MATRIX suite has
multiple levels of volatility control process, which decrease the volatilities and annual
maximum drawdowns.
Exhibit 8: Annual Returns, Apr 2002 – Sep 2016 Exhibit 9: Annual Sharpe Ratios, Apr 2002 – Sep 2016
Data as of Sep 30, 2016. Data as of Sep 30, 2016.
Source: the BLOOMBERG PROFESSIONAL™ service, Credit Suisse Source: the BLOOMBERG PROFESSIONAL™ service, Credit Suisse
-1.5
-1
-0.5
0
0.5
1
1.5
50
100
150
200
2003 2005 2007 2009 2011 2013 2015
20 Days Rolling Correlation
180 Days Rolling CorrelationMTRXSESB Index Value
SPX Index (normalized to same realized vol)
-1.5
-1
-0.5
0
0.5
1
1.5
50
70
90
110
130
150
2003 2005 2007 2009 2011 2013 2015
20 Days Rolling Correlation
180 Days Rolling Correlation
MTRXCEQB Index
SPX Index (normalized to the same realized vol)
-20%
-15%
-10%
-5%
0%
5%
10%
15%
20%
200
2
200
3
200
4
2005
200
6
200
7
200
8
200
9
201
0
201
1
201
2
2013
201
4
201
5
201
6
MTRXMLTL Index Combined 60/40 Portfolio
-1
-0.5
0
0.5
1
1.5
2
2.5
3
200
2
200
3
200
4
200
5
200
6
200
7
2008
2009
2010
201
1
201
2
201
3
201
4
201
5
201
6
MTRXMLTL Index Combined 60/40 Portfolio

13 October 2016
Systematic Alpha Monthly 11
Overlaying to 60/40 Portfolio
We overlay MTRXMLTL to the hypothetical combined 60/40 portfolio with 60% stock and
40% bond allocation. From Exhibit 10 and 11 we can conclude that additional allocation of
CS MATRIX Index in the whole portfolio can enhance the performance with higher Sharpe
ratio and help investors earn extra profits.
Exhibit 10:Cumulative Index Performance, Apr 2002 – Sep 2016
Exhibit 11:Performance Statistics, Apr 2002 – Sep 2016
Data as of Sep 30, 2016. Data as of Sep 30, 2016.
60/40
Portfolio 60/40 Portfolio+
50% MTRXMLTL 60/40 Portfolio+
100% MTRXMLTL
Annual Return 7.1% 10.3% 13.6%
Annual Volatility 11.6% 12.4% 13.6%
Sharpe Ratio 0.61 0.76 0.91
Max Drawdown 33% 32% 32%
Source: the BLOOMBERG PROFESSIONAL™ service, Credit Suisse Source: the BLOOMBERG PROFESSIONAL™ service, Credit Suisse
0
100
200
300
400
500
600
2002 2004 2006 2008 2010 2012 2014 2016
Combined 60/40 Portfolio
Combined 60/40 Portfolio + 50% MTRXMLTL
Combined 60/40 Portfolio + 100% MTRXMLTL

13 October 2016
Systematic Alpha Monthly 12
Strategy Snapshots

13 October 2016
Systematic Alpha Monthly 13
Smart Beta HS Global Style Rotation
Asset Class: Equities BBG Ticker: HSGSRTR
Strategy Overview
The HS Global Style Rotation Index invests according to investment styles that dominate at each
stage of the economic cycle as determined by the Credit Suisse Cycle Clock, an indicator that is a
measure of the output gap. The HOLT®1 framework is used to identify stocks with appropriate
characteristics for the relevant economic cycle stage. Expert financial ratios and rules are used to
pinpoint these qualities systematically.
Cumulative Index Performance Performance Summary
40
60
80
100
120
140
160
180
200
Jan-07 Jan-09 Jan-11 Jan-13 Jan-15
Live date: October 2009
Sept 2016 YTD
Last 12-Mo.
Since Live
Return 0.57% 6.18% 9.97% 10.97%
Volatility 12.96% 15.13%
Sharpe Ratio 0.74 0.71
Draw dow n 12.20% 22.79%
Weekly Correlation with Benchmarks
Last 12 months
MSCI World 96.8%
-21.8%
50.1%
CS Global Govt Bond Index
S&P GSCI
Source: Credit Suisse; Data as of 09/30/2016 Source: Credit Suisse; Data as of 09/30/2016
Monthly Return
Jan Feb Mar Apr May Jun Jul Aug Sep Oct Nov Dec
2007 1.6% 0.8% 3.6% 5.1% 4.2% -0.7% -1.5% 0.9% 5.9% 2.9% -3.2% -0.9%
2008 -7.9% 1.0% -2.2% 3.0% 4.0% -8.1% 0.3% 0.0% -11.8% -19.4% -5.4% 4.4%
2009 -5.8% -8.7% 6.1% 10.5% 12.4% -0.8% 6.5% 2.7% 3.9% -0.5% 4.2% 2.6%
2010 -4.2% 1.0% 6.7% 0.1% -8.7% -2.5% 8.1% -4.0% 10.5% 4.8% -2.1% 7.1%
2011 2.2% 3.7% 1.1% 5.1% -1.0% -0.5% -1.6% -8.2% -10.1% 11.3% -1.3% -0.7%
2012 5.2% 4.1% 1.2% -2.2% -8.9% 3.9% 2.5% 2.6% 3.2% -0.5% 0.9% 1.6%
2013 6.4% -0.1% 2.5% 2.4% 0.3% -2.3% 6.4% -1.1% 5.5% 3.9% 2.1% 2.5%
2014 -3.8% 5.1% 0.5% 0.7% 3.4% 2.2% -1.9% 3.2% -2.8% 0.5% 1.6% -1.1%
2015 -2.3% 6.0% -1.3% 1.4% 1.3% -2.0% 2.5% -5.8% -3.6% 5.2% -0.9% -0.7%
2016 -5.2% 0.5% 6.2% 0.5% 1.3% 0.1% 3.4% -0.9% 0.6%
Source: Credit Suisse; Data as of 09/30/2016
September 2016 Performance Commentary
The HS Global Style Rotation Index (HSGSRTR Index) gained 0.6% in September 2016, while the MSCI World (TR) Index gained 0.5%. Year to date, the HS Global Style Rotation Index has increased by 6.2%, compared to a gain of 5.6% for the MSCI World (TR) Index. Over the month, the highest contribution came from the Health Care, Financials and Real Estate sectors which had weightings of 18%, 9% and 1% respectively, as of 31 August 2016. Consumer Staples, Consumer Discretionary and Telecommunication Services had the largest negative impact on the performance of the index. Across countries, Japan, Britain and Switzerland generated the highest contributions in September. United States, Denmark and Germany had the largest negative impact on the performance of the index. Over the month, the best and worst performing stocks were Mitsubishi Tanabe Pharma (Health Care) and Cognizant Tech Solutions (Information Technology), respectively. The index was last rebalanced in August 2016 and is due to be rebalanced again in November 2016.
For more information regarding this index, please contact the Equities SIS Product Management team at [email protected].
1 HOLT® is Credit Suisse’s corporate performance and valuation financial advisory service.

13 October 2016
Systematic Alpha Monthly 14
HS Global Style Rotation Equity Hedged
Asset Class: Equities BBG Ticker: HSGSREH
Strategy Overview
The HS Global Style Rotation Equity Hedged Index goes short the MSCI World Index against a
long position in the HS Global Style Rotation Index to have a net exposure of zero. The index is
rebalanced quarterly.
Cumulative Index Performance Performance Summary
100
110
120
130
Jan-07 Jan-09 Jan-11 Jan-13 Jan-15
Live date: April 2010
Sept 2016 YTD
Last 12-Mo.
Since Live
Return -0.03% -0.19% -1.99% 1.19%
Volatility 3.60% 3.26%
Sharpe Ratio -0.55 0.36
Draw dow n 2.87% 6.55%
Weekly Correlation with Benchmarks
Last 12 months
MSCI World -53.5%
13.8%
-41.9%
CS Global Govt Bond Index
S&P GSCI
Source: Credit Suisse; Data as of 09/30/2016 Source: Credit Suisse; Data as of 09/30/2016
Monthly Return
Jan Feb Mar Apr May Jun Jul Aug Sep Oct Nov Dec
2007 0.4% 1.3% 1.7% 0.7% 1.3% 0.0% 0.6% 0.8% 1.1% -0.2% 0.8% 0.3%
2008 -0.4% 1.3% -1.4% -2.4% 2.2% -0.3% 2.4% 1.2% 0.0% -0.5% 1.1% 1.2%
2009 2.7% 1.6% -1.3% -1.0% 2.9% -0.4% -1.9% -1.5% -0.2% 1.4% 0.1% 0.8%
2010 -0.1% -0.5% 0.5% 0.0% 0.8% 0.8% 0.0% -0.3% 1.0% 1.1% 0.1% -0.3%
2011 -0.1% 0.1% 2.0% 0.8% 0.9% 1.0% 0.1% -1.4% -1.5% 0.7% 1.1% -0.7%
2012 0.1% -0.9% -0.1% -1.2% -0.3% -1.2% 1.1% 0.0% 0.4% 0.1% -0.5% -0.4%
2013 1.2% -0.3% 0.1% -0.9% 0.2% 0.1% 1.0% 1.0% 0.5% 0.0% 0.2% 0.4%
2014 -0.2% 0.1% 0.3% -0.4% 1.3% 0.4% -0.4% 1.0% -0.2% -0.2% -0.4% 0.5%
2015 -0.6% 0.1% 0.2% -1.0% 0.9% 0.2% 0.6% 0.8% 0.0% -2.5% -0.5% 1.0%
2016 0.6% 1.2% -0.6% -1.2% 0.6% 1.1% -0.8% -1.1% 0.0%
Source: Credit Suisse; Data as of 09/30/2016
September 2016 Performance Commentary
The HS Global Style Rotation Equity Hedged Index (HSGSREH Index) lost 0.1% in September 2016. Over the same period, the MSCI World (Price) Index gained 0.4%. Year to date, the HS Global Style Rotation Equity Hedged Index declined by 0.2% while the MSCI World (Price) Index gained 3.8%. Over the month and on the long component of the index, the highest contribution came from the Health Care, Financials and Real Estate sectors which had weightings of 18%, 9% and 1% respectively, as of 31 August 2016. Consumer Staples, Consumer Discretionary and Telecommunication Services had the largest negative impact on the performance of the index. Across countries, Japan, Britain and Switzerland generated the highest contributions in September. United States, Denmark and Germany had the largest negative impact on the performance of the index. Over the month and on the long component of the index, the best and worst performing stocks were Mitsubishi Tanabe Pharma (Health Care) and Cognizant Tech Solutions (Information Technology), respectively. The long component of the index was last rebalanced in August 2016 and is due to be rebalanced again in November 2016.
For more information regarding this index, please contact the Equities SIS Product Management
team at [email protected].

13 October 2016
Systematic Alpha Monthly 15
HS Market Neutral Index Powered by HOLT®
Asset Class: Equities BBG Ticker: HSGMN
Strategy Overview
The HS Market Neutral Index Powered by HOLT® uses a strategy popular with hedge funds, with
the main aim of achieving stable returns: the emphasis is on reducing risk rather than maximizing
outperformance. Approximately 75 stocks are held on the expectation that their share prices will
go up (long position) and the same number of stocks are held on the expectation that their share
prices will go down (short position). Companies included typically exhibit strong/weak cash flows,
are undervalued/overvalued, and experience positive/negative investor sentiment. HOLT® uses
expert financial ratios and rules to pinpoint these characteristics systematically.
Cumulative Index Performance Performance Summary
85
90
95
100
105
Jan-07 Jan-09 Jan-11 Jan-13 Jan-15
Live date: September 2007
Sept 2016 YTD
Last 12-Mo.
Since Live
Return 0.18% -5.14% -4.88% -1.39%
Volatility 4.56% 5.42%
Sharpe Ratio -1.07 -0.26
Draw dow n 7.58% 15.44%
Weekly Correlation with Benchmarks
Last 12 months
MSCI World 19.3%
-42.7%
15.9%
CS Global Govt Bond Index
S&P GSCI
Source: Credit Suisse; Data as of 09/30/2016 Source: Credit Suisse; Data as of 09/30/2016
Monthly Return
Jan Feb Mar Apr May Jun Jul Aug Sep Oct Nov Dec
2007 0.0% 0.2% -0.6% 2.9% 1.0% -1.4% 1.1% -0.9% -1.3% -1.0% -2.3% 0.6%
2008 0.2% -2.7% 1.4% -2.3% 0.9% -2.3% -0.5% -0.8% -1.5% 1.2% 1.2% -0.1%
2009 2.0% -1.1% -1.4% -2.0% 5.8% -2.5% -1.7% 3.1% -2.8% -0.2% 0.9% -2.0%
2010 0.2% -0.6% 2.9% 0.3% -1.5% -1.1% 1.8% 1.4% 2.2% 0.9% -0.4% 0.6%
2011 1.8% -0.7% 1.1% 0.7% -0.4% -0.5% -1.3% -0.9% -1.0% 2.1% -2.4% 1.2%
2012 0.0% -1.3% -2.7% 1.4% -0.3% -1.5% 1.3% -0.7% 1.4% 1.4% 0.1% 1.6%
2013 2.3% -0.6% -1.7% 2.1% 1.0% -2.4% 1.3% -0.7% -1.4% 0.1% 2.0% 0.1%
2014 0.0% 1.7% 1.2% -0.4% -1.7% -0.7% -0.8% -0.9% -1.1% -0.2% -0.4% -1.6%
2015 -1.4% 0.4% 0.8% -0.2% 2.2% 0.9% -1.8% -0.5% -1.3% -1.0% 1.2% -0.1%
2016 -2.0% -2.0% 0.3% 0.8% 0.8% -3.4% -0.9% 1.1% 0.2%
Source: Credit Suisse; Data as of 09/30/2016
September 2016 Performance Commentary
The HS Market Neutral Index (HSGMN) gained 0.2% in September 2016. Over the same time period, the HFRX Equity Market Neutral Index (HFRXEMN) gained 0.5%. Year to date, the HS Market Neutral Index declined by 5.1% while the HFRXEMN Index declined by 3.8%. The index was rebalanced in early September 2016 and will be rebalanced again in December 2016. Across regions, Germany, Italy and Japan were the best performing geographies in September. Spain, France and South Africa had the largest negative impact on the performance of the index. Consumer Discretionary, Financials and Information Technology were the best performing sectors, while Industrials, Health Care and Real Estate had the largest negative impact on the performance of the index. With regards to the legs of the index, the long side generated positive contribution and the short side of the index produced a negative return.
For more information regarding this index, please contact the Equities SIS Product Management
team at [email protected].

13 October 2016
Systematic Alpha Monthly 16
Global Enhanced Momentum Strategy
Asset Class: Interest Rates BBG Ticker: CSGMEREU
Strategy Overview
The Global Enhanced Momentum Strategy (GEMS) uses a systematic trend-following mechanism
to allocate daily long/short positions in interest rate swaps (one-, two-, and five-year) across four
different yield curves (USD, EUR, CHF, and GBP).
Cumulative Index Performance Performance Summary
90
100
110
120
130
140
Jan-07 Jan-09 Jan-11 Jan-13 Jan-15
Live date: January 2012
Sept 2016 YTD
Last 12-Mo.
Since Live
Return -0.51% -0.32% -1.00% -0.28%
Volatility 1.78% 1.61%
Sharpe Ratio -0.56 -0.17
Draw dow n 1.67% 2.92%
Weekly Correlation with Benchmarks
Last 12 months
MSCI World -11.5%
30.0%
-21.3%
CS Global Govt Bond Index
S&P GSCI
Source: Credit Suisse; Data as of 09/30/2016 Source: Credit Suisse; Data as of 09/30/2016
Monthly Return
Jan Feb Mar Apr May Jun Jul Aug Sep Oct Nov Dec
2007 0.6% -0.4% -0.7% -0.1% 1.0% 0.7% -0.4% 0.9% 0.9% -0.1% 1.6% -0.3%
2008 3.0% 0.2% -1.0% -0.7% 2.1% 1.1% 0.4% 0.9% 0.3% 4.6% 5.4% 3.3%
2009 1.5% -0.2% 0.5% 0.0% 0.3% -1.6% 0.7% 1.0% 0.9% -0.1% 0.3% -0.9%
2010 0.1% 1.3% 0.1% -0.5% 0.7% 0.4% 0.3% 0.8% -0.4% 0.1% -0.9% 0.2%
2011 -0.2% 0.0% -0.3% 0.4% 0.8% 0.5% 1.3% 1.5% 0.0% -0.6% -0.5% 0.0%
2012 0.7% -0.3% -0.7% -0.5% 0.5% 0.0% 1.1% 0.0% 0.0% -0.1% 0.2% 0.0%
2013 -0.2% -0.5% 0.0% 0.5% -0.6% 0.7% -0.9% -0.7% 0.0% 0.6% 0.2% -0.4%
2014 -0.3% -0.1% -0.3% -0.4% 0.3% -0.2% 0.0% 0.3% 0.1% 0.2% 0.4% 0.3%
2015 1.0% -0.6% -0.2% -0.3% -0.1% -0.2% -0.4% 0.2% 0.3% 0.2% -0.2% -0.7%
2016 0.3% 0.7% -0.6% -0.3% -0.5% 1.0% -0.2% -0.2% -0.5% Source: Credit Suisse; Data as of 09/30/2016
September 2016 Performance Commentary
CSGEMS was affected by the choppiness in the rates market for September and fell by 51 bps over the month. Rates markets across the globe exhibited volatility for most of the month and with no clear trend to latch on to some of the swaps switched positions during the month. Rates have started trending lower towards the end and the swaps have correctly positioned themselves into receivers, but this positioning was not sufficient to counter the negative influence on the strategy from the choppy rate markets leading up until then.
For more information regarding this index, please contact the European Rates Structuring team at

13 October 2016
Systematic Alpha Monthly 17
GAINS 01E
Asset Class: Commodities BBG Ticker: CSGADER
Strategy Overview
Credit Suisse GAINS uses market information from Glencore, one of the world’s largest
commodity traders, to reweight the allocation of individual commodities dynamically in a
commodity index. Using “votes” from the commodity trading units, the index determines the
adjusted weights based on the commodity traders’ outlook on the physical market for each
commodity. The CS GAINS methodology can be applied to any commodity benchmark, including
BCOMSM, S&P GSCITM, and to a static index weighted by the relative importance of Glencore’s
underlying physical businesses. GAINS 01E is the BCOM benchmarked excess return index.
Cumulative Index Performance Performance Summary
80
100
120
140
160
180
Oct-08 Oct-10 Oct-12 Oct-14
Live date: October 2008
Sept 2016 YTD
Last 12-Mo.
Since Live
Return 3.32% 8.30% -0.56% 0.33%
Volatility 14.22% 15.22%
Sharpe Ratio -0.04 0.02
Draw dow n 17.69% 53.68%
Weekly Correlation with Benchmarks
Last 12 months
MSCI World 49.6%
8.5%
91.6%
CS Global Govt Bond Index
S&P GSCI
Source: Credit Suisse; Data as of 09/30/2016 Source: Credit Suisse; Data as of 09/30/2016
Monthly Return
Jan Feb Mar Apr May Jun Jul Aug Sep Oct Nov Dec
2008 0.5% 4.0%
2009 -0.1% -1.9% 4.6% 2.3% 13.0% -2.4% 1.2% 1.0% -0.4% 2.8% 4.4% 1.5%
2010 -7.1% 4.0% 0.4% 2.7% -7.7% -0.4% 6.6% -1.3% 7.8% 6.1% -0.6% 11.4%
2011 0.9% 1.8% 2.4% 3.2% -5.6% -5.7% 3.4% 2.7% -15.3% 7.1% -2.0% -2.3%
2012 3.3% 2.1% -4.2% 0.1% -8.5% 6.1% 6.3% 4.3% 0.8% -3.9% -0.3% -3.1%
2013 2.7% -3.9% 1.4% -2.8% -2.0% -4.7% 1.4% 3.0% -2.6% -0.8% -1.1% 1.1%
2014 0.9% 6.1% 0.6% 2.7% -2.5% 0.6% -4.8% -0.7% -6.0% -1.3% -3.6% -7.5%
2015 -3.1% 2.0% -4.6% 4.4% -2.1% 1.7% -10.2% -1.2% -3.4% -0.6% -6.7% -2.1%
2016 -1.1% -1.8% 3.8% 7.4% -0.7% 4.1% -4.5% -1.9% 3.3%
Source: Credit Suisse; Data as of 09/30/2016
September 2016 Performance Commentary
The Credit Suisse GAINS 01E Index returned 3.32% during the month. The first September-week saw a strong rally of crude oil and products on the back of larger-than-expected inventory decreases, a function of the production and logistics disruptions caused by the tropical storm Hermine. Gains were reversed fully the week
after unfortunately. Low demand growth specifically out of Asia was reported by the IEA, paired with an expectation of a prolonged S&D surplus given insufficiently elastic production figures. Price action then flattened in expectation of the OPEC meeting in Algiers on Sep 28. The 14 members agreed to cap production at 32.5 –
33Mb/d in 2017, causing an extended crude rally. The Philippines authorities completed their audit and based on environmental concerns the market priced in further mine closures, supporting Nickel prices specifically. The sector could not entirely emancipate itself from the US Federal Reserve’s rate hike expectations either, yet
following the release of the Fed’s minutes (no rate increase and a de-emphasis of future hike expectations), fundamentals quickly took hold again. Base Metals ended the month ~5% higher. Gold and Silver trade in line with expected central bank action. Both metals proved sensitive to the re-rating of rate hike expectations in the
US and the lack of additional stimulus from the ECB. Overall, the sector finished 0.70% higher after being up 3.75% earlier in the month. With Brazil facing drought and potential frost, Corn and Sugar yield expectations have been reduced, supporting prices. The WASDE report published on September 12 showed higher-than-
expected production of Soybean, leading to temporary weakness in Soybean and Bean Oil.
For more information regarding this index, please contact Mi-Sonn Kim ([email protected]) in Commodities Sales.

13 October 2016
Systematic Alpha Monthly 18
Commodity Backwardation
Asset Class: Commodities BBG Ticker: CSCUBKER
Strategy Overview
The CS Commodity Backwardation Index dynamically allocates to selected components
displaying the highest degree of backwardation in their curve structure, aiming to capture the
commodities with the tightest supply/demand balance in the investment universe.
Cumulative Index Performance Performance Summary
80
140
200
260
Jan-07 Jan-09 Jan-11 Jan-13 Jan-15
Live date: March 2012
Sept 2016 YTD
Last 12-Mo.
Since Live
Return 2.38% 4.56% 3.15% -7.73%
Volatility 12.28% 11.45%
Sharpe Ratio 0.26 -0.67
Draw dow n 11.64% 43.26%
Weekly Correlation with Benchmarks
Last 12 months
MSCI World 47.5%
6.6%
64.7%
CS Global Govt Bond Index
S&P GSCI
Source: Credit Suisse; Data as of 09/30/2016 Source: Credit Suisse; Data as of 09/30/2016
Monthly Return
Jan Feb Mar Apr May Jun Jul Aug Sep Oct Nov Dec
2007 -2.3% 5.5% 2.1% 6.1% 1.5% -2.0% 5.7% -4.8% 6.6% 3.4% -3.5% 1.7%
2008 3.6% 12.6% -5.0% 7.2% 6.8% 7.8% -8.1% -3.8% -7.9% -23.2% -4.9% 6.3%
2009 -0.6% -2.4% 7.1% 1.7% 13.7% -0.6% 7.2% 4.1% 2.4% 3.1% 3.9% 1.4%
2010 -4.9% 3.2% 1.7% 4.7% -6.0% -1.5% 3.6% 1.6% 9.5% 9.6% 0.0% 12.5%
2011 4.2% 6.7% 1.1% 1.9% -3.9% -2.0% 3.8% -1.6% -14.7% 7.5% -0.2% -2.4%
2012 7.4% 5.6% -0.8% -2.6% -9.7% 3.6% 6.5% 7.7% 0.1% -3.8% 1.0% -2.3%
2013 3.2% -2.6% 0.5% -3.0% 0.2% -2.7% 2.4% 2.5% -2.5% -0.5% -0.4% -0.6%
2014 -1.1% 4.2% 1.7% 1.6% -0.9% 0.5% -4.7% -0.8% -5.0% -4.3% -4.8% -7.1%
2015 -1.7% -0.4% -0.9% 5.4% -2.6% -0.5% -6.9% -2.9% -3.5% 3.0% -5.9% 1.1%
2016 -3.7% 4.1% 1.5% 6.3% -3.2% 3.0% -1.9% -3.4% 2.4%
Source: Credit Suisse; Data as of 09/30/2016
September 2016 Performance Commentary
The Credit Suisse Backwardation Index returned 2.38% during the month. The first September-week saw a strong rally of crude oil and products on the back of larger-than-expected inventory decreases, a function of the production and logistics disruptions caused by the tropical storm Hermine. Gains were reversed fully the week after unfortunately. Low demand growth specifically out of Asia was reported by the IEA, paired with an expectation of a prolonged S&D surplus given insufficiently elastic production figures. Price action then flattened in expectation of the OPEC meeting in Algiers on Sep 28. The 14 members agreed to cap production at 32.5 – 33Mb/d in 2017, causing an extended crude rally. The Philippines authorities completed their audit and based on environmental concerns the market priced in further mine closures, supporting Nickel prices specifically. The sector could not entirely emancipate itself from the US Federal Reserve’s rate hike expectations either, yet following the release of the Fed’s minutes (no rate increase and a de-emphasis of future hike expectations), fundamentals quickly took hold again. Base Metals ended the month ~5% higher. Gold and Silver traded in line with expected central bank action. Both metals proved sensitive to the re-rating of rate hike expectations in the US and the lack of additional stimulus from the ECB. Overall, the sector finished 0.70% higher after being up 3.75% earlier in the month. With Brazil facing drought and potential frost, Corn and Sugar yield expectations have been reduced supporting prices. The WASDE report published on September 12 showed higher-than-expected production of Soybean, leading to temporary weakness in Soybean and Bean Oil.
For more information regarding this index, please contact Mi-Sonn Kim (mi-sonn.kim@credit-
suisse.com) in Commodities Sales.

13 October 2016
Systematic Alpha Monthly 19
Alternative Risk Premia
Global Carry Selector
Asset Class: Equities BBG Ticker: GCSCS
Strategy Overview
The Credit Suisse Global Carry Selector Index is an equity volatility arbitrage strategy that
extracts the equity risk premium embedded in the option prices of four global indices (S&P 500,
DJ Euro Stoxx 50, DAX, and Nikkei 225), while attempting to deliver a low beta to the equity
market. The strategy systematically sells variance swaps and opportunistically buys forward
variances as a hedge.
Cumulative Index Performance Performance Summary
80
120
160
200
240
280
320
Jan-07 Jan-09 Jan-11 Jan-13 Jan-15
Live date: January 2009
Sept 2016 YTD
Last 12-Mo.
Since Live
Return 3.42% -1.17% 7.45% 10.02%
Volatility 13.37% 19.98%
Sharpe Ratio 0.52 0.49
Draw dow n 10.40% 35.39%
Weekly Correlation with Benchmarks
Last 12 months
MSCI World 8.0%
0.2%
9.5%
CS Global Govt Bond Index
S&P GSCI
Source: Credit Suisse; Data as of 09/30/2016 Source: Credit Suisse; Data as of 09/30/2016
Monthly Return
Jan Feb Mar Apr May Jun Jul Aug Sep Oct Nov Dec
2007 2.2% -5.2% 0.7% 1.6% 5.5% -0.6% -0.7% 7.3% 0.0% 6.1% 5.4% -0.2%
2008 -10.2% 0.1% 6.2% -0.2% 2.4% 1.1% -3.6% 0.8% -7.6% 5.0% 6.9% -1.2%
2009 6.1% 2.7% -1.4% 0.5% 0.9% 0.3% 1.6% 0.6% 6.1% -5.4% 3.8% 2.9%
2010 -1.2% 2.4% 5.2% -1.5% -13.5% -4.2% 9.5% 3.8% 3.9% 5.5% -4.4% 7.5%
2011 1.0% 4.1% 5.7% 6.0% 1.1% 5.6% 3.8% 1.4% -0.2% 4.6% 1.8% 0.3%
2012 7.1% 7.5% 1.2% 1.5% -1.7% 3.8% 0.0% 1.0% 2.8% -1.2% 4.7% 0.4%
2013 3.7% -2.0% -1.6% 2.4% -1.0% -0.6% 1.9% -7.4% 1.2% 1.9% 0.3% -0.9%
2014 -8.3% 2.9% -2.0% 3.2% 2.3% 1.2% 0.8% -3.4% 3.3% -7.4% 0.2% -5.8%
2015 5.2% 6.3% -0.9% 2.7% 4.5% 0.4% -4.1% -15.7% -12.8% 2.5% 2.4% 3.0%
2016 -2.0% 1.6% -0.1% -6.4% 4.0% -5.3% 0.9% 3.2% 3.4%
Source: Credit Suisse; Data as of 09/30/2016
September 2016 Performance Commentary
The Credit Suisse Global Carry Selector Index (“the Index”) delivered a positive performance of
+3.4% for September. From the August roll date (19 August 2016), the Index was short a variance
swap in the Nikkei 225 Index with a volatility strike of 20.30%. The Index had no long volatility
position as of the August roll date. These positions delivered a positive return of +2.4% to the
Index in September to the roll date. On the most recent roll date (16 September 2016), the Index
was short a variance swap in the Eurostoxx 50 Index with a volatility strike of 19.74%. The Index
had no long volatility position as of the latest roll date. These positions delivered a positive return
of +1.0% to the Index in September from the roll date..
For more information regarding this index, please contact the Equities SIS Product Management
team at [email protected].

13 October 2016
Systematic Alpha Monthly 20
Global Carry Selector II
Asset Class: Equities BBG Ticker: GCSCS2
Strategy Overview
The Credit Suisse Global Carry Selector II is an equity volatility arbitrage strategy that extracts the
equity risk premium embedded in the option prices of four global indices (S&P 500, DJ Euro Stoxx
50, DAX, and Nikkei 225) while attempting to deliver a low beta to the equity market. The strategy
systematically sells variance swaps and opportunistically buys forward variances as a hedge. It
succeeds the Global Carry Selector Index, launched in January 2009.
Cumulative Index Performance Performance Summary
80
100
120
140
160
180
200
220
Jan-07 Jan-09 Jan-11 Jan-13 Jan-15
Live date: June 2012
Sept 2016 YTD
Last 12-Mo.
Since Live
Return 1.21% -0.41% -0.94% -2.08%
Volatility 10.38% 8.94%
Sharpe Ratio -0.14 -0.26
Draw dow n 10.36% 21.83%
Weekly Correlation with Benchmarks
Last 12 months
MSCI World 5.6%
7.6%
4.4%
CS Global Govt Bond Index
S&P GSCI
Source: Credit Suisse; Data as of 09/30/2016 Source: Credit Suisse; Data as of 09/30/2016
Monthly Return
Jan Feb Mar Apr May Jun Jul Aug Sep Oct Nov Dec
2007 0.9% -1.2% -0.7% 0.7% 1.6% 0.0% -1.1% 1.8% -0.1% 2.2% 0.6% 1.9%
2008 -3.8% 0.4% -0.8% 1.0% 0.4% 0.5% 1.4% 1.5% -2.4% 9.1% 3.4% 0.9%
2009 -0.8% 2.2% 0.7% 0.7% 2.0% 1.5% 2.1% 0.6% 1.8% -1.3% 1.0% 3.1%
2010 -1.3% 0.5% 3.1% -3.2% 0.8% -3.1% 5.2% 1.6% 2.5% 2.7% -1.8% 3.5%
2011 1.6% 0.8% 0.0% 1.9% 0.7% -0.7% 1.3% 8.3% 1.1% -0.5% 3.0% 1.7%
2012 2.6% 2.0% 1.5% -0.2% 0.9% 4.4% -0.5% 0.5% 1.8% 0.5% 0.3% -0.3%
2013 1.0% -2.1% 0.5% -1.4% -3.7% -3.4% 2.3% -1.5% 2.0% 1.3% 0.3% 1.0%
2014 -2.1% 1.9% 0.2% 1.7% 1.6% 0.8% -1.3% 0.0% 0.6% -6.0% 0.1% 0.4%
2015 -3.6% 4.0% -0.3% 0.2% 0.8% 2.5% -1.8% -6.6% -1.8% 0.2% 0.7% -1.8%
2016 -8.0% 9.8% 0.2% -1.9% 2.6% -6.7% 2.0% 1.4% 1.2%
Source: Credit Suisse; Data as of 09/30/2016
September 2016 Performance Commentary
The Credit Suisse Global Carry Selector II Index (the "Index") delivered a positive return of +1.2% for
September. On the August roll date (19 August 2016), the Index was short a variance swap in the
Eurostoxx 50 Index with a volatility strike of 22.15%, in addition to the existing short variance swap
positions in the Eurostoxx 50 Index with a volatility strike of 31.17% and in the S&P 500 Index with a
volatility strike of 14.84% (with one and two months remaining, respectively). The Index had no long
volatility position as of the August roll date. These positions delivered a negative return of -0.4% in
September to the roll date. On the most recent roll date (16 September 2016), the Index was short a
new variance swap in the Nikkei 225 Index with a volatility strike of 24.73%, in addition to the
existing short variance swap positions in the S&P 500 Index with a volatility strike of 14.84% and in
the Eurostoxx 50 Index with a volatility strike of 22.15% (with one and two months remaining,
respectively). The Index had no long volatility position as of the latest roll date. These positions
delivered a positive return of +1.7% to the Index in September from the roll date.
For more information regarding this index, please contact the Equities SIS Product Management
team at [email protected].

13 October 2016
Systematic Alpha Monthly 21
Advanced Relative Value Volatility Index
Asset Class: Equities BBG Ticker: CSEAARVL
Strategy Overview
The Credit Suisse Advanced Relative Value Volatility Index aims to capture the term premium or
discount embedded in the carry (roll yield) of the S&P 500 VIX futures curve based on the
expected decay at the short- and medium-term of the VIX futures curve. The index maintains a
limited exposure to the absolute level of the VIX index by entering into a long or short position in
the S&P 500 VIX Short-Term Futures Index ER (Bloomberg: SPVXSP), while taking an opposite
position in the S&P 500 VIX Medium-Term Futures Index. It incorporates a loss-control
mechanism.
Cumulative Index Performance Performance Summary
80
100
120
140
160
180
200
Apr-08 Apr-10 Apr-12 Apr-14 Apr-16
Live date: September 2012
Sept 2016 YTD
Last 12-Mo.
Since Live
Return -0.73% 6.80% 2.01% -3.63%
Volatility 6.78% 6.22%
Sharpe Ratio 0.30 -0.58
Draw dow n 6.73% 22.65%
Weekly Correlation with Benchmarks
Last 12 months
MSCI World 42.3%
-16.7%
12.7%
CS Global Govt Bond Index
S&P GSCI
Source: Credit Suisse; Data as of 09/30/2016 Source: Credit Suisse; Data as of 09/30/2016
Monthly Return
Jan Feb Mar Apr May Jun Jul Aug Sep Oct Nov Dec
2008 2.9% -2.6% -1.1% 1.1% 2.1% 13.1% 0.0% 0.5%
2009 -0.2% 0.3% 0.1% 1.6% 0.0% 1.0% 1.5% 1.2% 2.8% 0.3% 1.5% 1.9%
2010 0.2% 0.7% 3.6% 1.4% -1.4% -0.8% 3.2% 2.2% 3.2% 2.4% 0.1% 1.7%
2011 0.4% -1.3% -1.5% 3.3% 0.4% -1.0% -1.7% 6.6% 2.2% -1.6% 0.3% 0.6%
2012 3.7% 1.3% 4.7% -1.1% -2.0% 3.7% -0.7% 1.9% 0.2% -1.5% 0.8% -0.8%
2013 -1.7% -0.7% 2.4% -2.4% 0.7% -1.4% 2.6% -1.2% 0.4% -1.2% 1.2% -2.2%
2014 -0.5% -2.0% -0.4% -0.1% 2.9% 0.8% -1.7% -1.0% -1.2% -3.1% 1.3% -4.0%
2015 -1.4% 2.1% 1.2% 1.8% 1.3% -2.3% 0.0% -5.0% -0.9% -1.0% -1.5% -2.1%
2016 -0.7% -1.8% 3.6% 1.8% 2.9% -4.2% 3.8% 2.2% -0.7%
Source: Credit Suisse; Data as of 09/30/2016
September 2016 Performance Commentary
Advanced RVOL was down 0.73% in September (SPVXSP Index: -4.63%, SPVXMP Index: -
3.17%). The index had average position of -20% / 20% weights on the short-term and mid-term
VIX future Index as VIX future curve remained in contango during the month. Advanced RVOL
was down as volatility increased due to uncertainty ahead of BOJ/Fed meeting causing short-term
future Index to increase more than mid-term future Index.
For more information regarding this index, please contact US Equity Derivatives Structuring at

13 October 2016
Systematic Alpha Monthly 22
Mean Reversion Index on Euro Stoxx 50
Asset Class: Equities BBG Ticker: CSEAMREU
Strategy Overview
The Credit Suisse Mean Reversion Index aims to provide direct exposure to weekly mean
reversion on the Euro Stoxx 50 Index through a liquid and transparent strategy. The index isolates
exposure to mean reverting behavior by adjusting its exposure based on the prevailing volatility
regime.
Cumulative Index Performance Performance Summary
100
120
140
160
180
Jan-07 Jan-09 Jan-11 Jan-13 Jan-15
Live date: March 2013
Sept 2016 YTD
Last 12-Mo.
Since Live
Return 0.56% 10.93% 11.38% 3.44%
Volatility 7.82% 7.72%
Sharpe Ratio 1.40 0.41
Draw dow n 3.83% 10.64%
Weekly Correlation with Benchmarks
Last 12 months
MSCI World 13.0%
11.6%
17.0%
CS Global Govt Bond Index
S&P GSCI
Source: Credit Suisse; Data as of 09/30/2016 Source: Credit Suisse; Data as of 09/30/2016
Monthly Return
Jan Feb Mar Apr May Jun Jul Aug Sep Oct Nov Dec
2007 2.7% -0.1% 2.2% -0.8% 0.2% 2.6% 0.4% 3.4% 1.0% 0.0% 0.3% 0.6%
2008 -3.8% 5.5% 0.6% -0.5% 0.9% -2.4% 0.8% 1.7% 5.9% -1.9% 1.5% 3.7%
2009 -1.1% -1.5% -1.9% 1.5% 0.4% 1.7% -3.3% 0.7% 0.7% -1.0% -0.5% 1.9%
2010 -2.0% 1.4% -0.9% 2.9% 2.0% -0.9% 1.9% -0.3% -0.5% -0.3% 0.1% 0.8%
2011 0.8% 2.0% -1.2% -1.9% 2.0% 2.2% 2.0% -5.8% 5.2% 3.7% 2.6% -0.4%
2012 -0.4% 0.8% 0.8% 0.3% 0.6% 2.7% 6.2% -0.2% -1.2% 4.3% 0.3% -0.6%
2013 0.4% 2.1% -0.4% 4.2% -1.7% 1.7% -1.2% 0.0% -2.2% -0.3% 0.4% -0.7%
2014 0.0% -1.4% 1.9% -0.1% 0.7% 0.6% 1.7% -2.9% 0.5% -4.5% 0.0% 1.3%
2015 0.0% -1.1% 1.1% 1.5% 0.7% 0.5% -1.3% -1.8% 2.8% -2.5% 0.9% 2.2%
2016 0.3% 2.1% 0.9% -1.4% -0.3% 7.5% -0.2% 1.1% 0.6%
Source: Credit Suisse; Data as of 09/30/2016
September 2016 Performance Commentary
The Credit Suisse Mean Reversion on EuroSTOXX50 Index delivered a positive return of 0.6% in
September while the underlying price return index on the EuroSTOXX50 finished the month with a
negative performance of -0.7%. The index started the month slightly negative as European equity
markets initially trended upwards. A sharp reversal temporarily brought the index into the black,
however the strategy fell back to negative territory as the Eurostoxx 50 continued to fall lower.
Finally, several big swings in the Eurostoxx 50 towards the end of month enabled the index to
recover and end the month positively.
For more information regarding this index, please contact the Equities SIS Product Management
team at [email protected].

13 October 2016
Systematic Alpha Monthly 23
Dividend Alpha Index on Euro Stoxx 50
Asset Class: Equities BBG Ticker: CSEADVAE
Strategy Overview
The Credit Suisse Dividend Alpha Index invests in Euro Stoxx 50 dividend futures to
systematically harvest the embedded dividend risk premium. The index looks to isolate the
dividend risk premium by going long the two front futures contracts and stripping out the portion of
the return attributable to equity price action with an offsetting position in the Euro Stoxx 50 price
index.
Cumulative Index Performance Performance Summary
60
80
100
120
140
160
180
Jul-08Jul-09Jul-10Jul-11Jul-12Jul-13Jul-14Jul-15Jul-16
Live date: October 2013
Sept 2016 YTD
Last 12-Mo.
Since Live
Return 1.28% 4.10% 3.69% 1.39%
Volatility 3.00% 3.96%
Sharpe Ratio 1.23 0.35
Draw dow n 2.16% 5.74%
Weekly Correlation with Benchmarks
Last 12 months
MSCI World -11.0%
17.2%
-6.3%
CS Global Govt Bond Index
S&P GSCI
Source: Credit Suisse; Data as of 09/30/2016 Source: Credit Suisse; Data as of 09/30/2016
Monthly Return
Jan Feb Mar Apr May Jun Jul Aug Sep Oct Nov Dec
2008 1.9% -1.0% -18.5% 12.1% -2.6%
2009 -1.2% 9.2% -0.4% 3.6% 3.6% 4.1% 7.0% -0.3% 4.3% 3.7% 4.0% 2.0%
2010 2.0% -1.3% 0.7% 0.7% -4.7% -2.0% 4.4% 2.6% 2.6% -0.9% -0.6% -0.4%
2011 3.1% 1.6% 0.6% -0.1% -0.3% -0.1% 0.1% -1.3% 5.5% -3.9% -0.7% -0.4%
2012 7.1% 4.4% -1.4% 1.2% -1.0% 1.0% -7.1% 5.2% 1.5% 3.2% -0.3% -1.2%
2013 1.0% 0.6% 0.0% 1.9% 1.0% -2.8% 0.1% 1.6% 0.3% -0.1% -0.3% 0.9%
2014 1.2% -0.3% 0.1% -0.3% -1.3% -0.8% 0.8% -0.3% 1.4% -2.0% 2.6% -1.4%
2015 -2.1% 3.7% 1.0% 1.1% 0.5% -0.6% 0.4% -2.3% -1.5% -0.4% 0.0% 0.0%
2016 0.6% 2.3% 1.1% 0.1% -0.1% -0.8% -0.2% -0.3% 1.3% Source: Credit Suisse; Data as of 09/30/2016
September 2016 Performance Commentary
The Credit Suisse Dividend Alpha Total Return Index delivered a positive return of +1.3% in September, while European equities performed negatively, with the EuroSTOXX50 Total Return Index losing -0.6%. At the beginning of the month, the dividend exposure was 29% in the 2016 dividend future with the remaining 71% in the 2017 dividend future. The index's performance was primarily driven by the performance of the 2017 dividend future, which gained +1.0% during the month, in contrast to the 2016 dividend future which gained +0.4% over the same period. The beta hedging component had a positive contribution to the Index in September (+0.5%).
For more information regarding this index, please contact the Equities SIS Product Management
team at [email protected].

13 October 2016
Systematic Alpha Monthly 24
Adaptive Volatility Index Global
Asset Class: Interest Rates BBG Ticker: CSVIXAEU
Strategy Overview
The Adaptive Volatility Index exploits the bias between implied and realized volatility in global
interest rate options markets (USD, EUR, JPY) by selling one-month into ten-year swaptions and
delta-hedging until expiry. The strategy aims to improve risk-adjusted returns by adjusting its
leverage based on the prevailing volatility environment. Four versions of CSAVI are available, one
for each market (USD, EUR and JPY) and CSAVI Global, which combines the three strategies
based on equal weighting.
Cumulative Index Performance Weekly Correlation with Benchmarks
Last 12 months
MSCI World 30.2%
-3.4%
-2.2%
CS Global Govt Bond Index
S&P GSCI
Source: Credit Suisse; Data as of 09/30/2016
Source: Credit Suisse; Data as of 09/30/2016
Performance Summary
CSAVI Global (CSVIXAEU) Sept 2016 YTD Last 12-Mo. Since Live (Sep 2012)
Return 0.58% 3.24% 4.93% 2.37%
4.07% 4.06%
1.21 0.58
3.07% 7.53%
Volatility
Sharpe Ratio
Drawdown
CSAVI USD (CSVIXUSD) Sept 2016 YTD Last 12-Mo. Since Live (Mar 2009)
Return 0.67% 6.15% 8.42% 12.89%
5.69% 9.28%
1.48 1.39
3.88% 17.28%
Volatility
Sharpe Ratio
Drawdown
CSAVI EUR (CSVIXEUR) Sept 2016 YTD Last 12-Mo. Since Live (Sep 2012)
Return -1.20% 6.44% 6.70% 4.42%
5.12% 6.12%
1.31 0.72
3.16% 10.07%
Volatility
Sharpe Ratio
Drawdown
CSAVI JPY (CSVIXJPY) Sept 2016 YTD Last 12-Mo. Since Live (Jan 2011)
Return 2.28% -2.81% -1.45% 1.99%
5.82% 6.44%
-0.25 0.31
5.92% 20.14%
Volatility
Sharpe Ratio
Drawdown
Source: Credit Suisse; Note: Data as of 09/30/2016
September 2016 Performance Commentary
The Adaptive Volatility Index Global gained 0.58% in September. The USD and JPY sub-
strategies gained 0.67% and 2.28%, respectively; the EUR sub-strategy lost 1.2%. The leverage
ratio is 0.5 for USD and EUR; and 0.5 for JPY most of the time in September, except 1.0 for the
20th
roll day.
For more information regarding this index, please contact the European Rates Structuring team at
50
100
150
200
250
300
350
Jan-07 Jan-09 Jan-11 Jan-13 Jan-15
13 October 2016
Systematic Alpha Monthly 25
Adaptive Term Premium Index
Asset Class: Interest Rates BBG Ticker: CATPU2P6
Strategy Overview
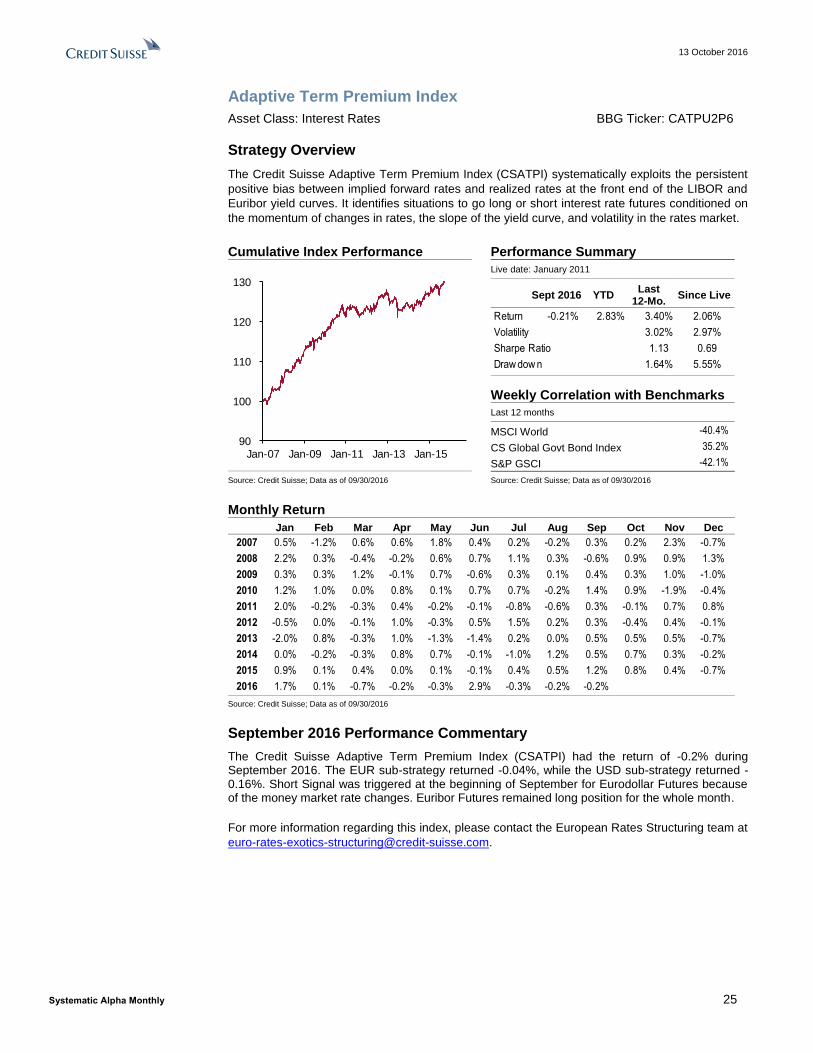
The Credit Suisse Adaptive Term Premium Index (CSATPI) systematically exploits the persistent
positive bias between implied forward rates and realized rates at the front end of the LIBOR and
Euribor yield curves. It identifies situations to go long or short interest rate futures conditioned on
the momentum of changes in rates, the slope of the yield curve, and volatility in the rates market.
Cumulative Index Performance Performance Summary
90
100
110
120
130
Jan-07 Jan-09 Jan-11 Jan-13 Jan-15
Live date: January 2011
Sept 2016 YTD
Last 12-Mo.
Since Live
Return -0.21% 2.83% 3.40% 2.06%
Volatility 3.02% 2.97%
Sharpe Ratio 1.13 0.69
Draw dow n 1.64% 5.55%
Weekly Correlation with Benchmarks
Last 12 months
MSCI World -40.4%
35.2%
-42.1%
CS Global Govt Bond Index
S&P GSCI
Source: Credit Suisse; Data as of 09/30/2016 Source: Credit Suisse; Data as of 09/30/2016
Monthly Return
Jan Feb Mar Apr May Jun Jul Aug Sep Oct Nov Dec
2007 0.5% -1.2% 0.6% 0.6% 1.8% 0.4% 0.2% -0.2% 0.3% 0.2% 2.3% -0.7%
2008 2.2% 0.3% -0.4% -0.2% 0.6% 0.7% 1.1% 0.3% -0.6% 0.9% 0.9% 1.3%
2009 0.3% 0.3% 1.2% -0.1% 0.7% -0.6% 0.3% 0.1% 0.4% 0.3% 1.0% -1.0%
2010 1.2% 1.0% 0.0% 0.8% 0.1% 0.7% 0.7% -0.2% 1.4% 0.9% -1.9% -0.4%
2011 2.0% -0.2% -0.3% 0.4% -0.2% -0.1% -0.8% -0.6% 0.3% -0.1% 0.7% 0.8%
2012 -0.5% 0.0% -0.1% 1.0% -0.3% 0.5% 1.5% 0.2% 0.3% -0.4% 0.4% -0.1%
2013 -2.0% 0.8% -0.3% 1.0% -1.3% -1.4% 0.2% 0.0% 0.5% 0.5% 0.5% -0.7%
2014 0.0% -0.2% -0.3% 0.8% 0.7% -0.1% -1.0% 1.2% 0.5% 0.7% 0.3% -0.2%
2015 0.9% 0.1% 0.4% 0.0% 0.1% -0.1% 0.4% 0.5% 1.2% 0.8% 0.4% -0.7%
2016 1.7% 0.1% -0.7% -0.2% -0.3% 2.9% -0.3% -0.2% -0.2%
Source: Credit Suisse; Data as of 09/30/2016
September 2016 Performance Commentary
The Credit Suisse Adaptive Term Premium Index (CSATPI) had the return of -0.2% during September 2016. The EUR sub-strategy returned -0.04%, while the USD sub-strategy returned -0.16%. Short Signal was triggered at the beginning of September for Eurodollar Futures because of the money market rate changes. Euribor Futures remained long position for the whole month.
For more information regarding this index, please contact the European Rates Structuring team at

13 October 2016
Systematic Alpha Monthly 26
Commodity Backwardation RV
Asset Class: Commodities BBG Ticker: CSCUBKAE
Strategy Overview
The Credit Suisse Commodity Backwardation RV Index maintains a long exposure to the CS
Commodity Backwardation Index, which dynamically allocates to selected components displaying
the highest degree of backwardation in their curve structure, aiming to capture the commodities
with the tightest supply/demand balance in the investment universe, and a short exposure to the
Bloomberg Commodity Index.
Cumulative Index Performance Performance Summary
80
140
200
260
320
Jan-07 Jan-09 Jan-11 Jan-13 Jan-15
Live date: February 2009
Sept 2016 YTD
Last 12-Mo.
Since Live
Return -0.72% -4.25% 4.98% 2.88%
Volatility 10.51% 8.41%
Sharpe Ratio 0.47 0.34
Draw dow n 10.64% 10.64%
Weekly Correlation with Benchmarks
Last 12 months
MSCI World -16.9%
0.3%
-55.9%
CS Global Govt Bond Index
S&P GSCI
Source: Credit Suisse; Data as of 09/30/2016 Source: Credit Suisse; Data as of 09/30/2016
Monthly Return
Jan Feb Mar Apr May Jun Jul Aug Sep Oct Nov Dec
2007 -2.0% 2.5% 1.5% 5.4% 1.8% -0.3% 4.0% -0.8% -1.1% 0.4% -0.1% -2.7%
2008 -0.3% 0.5% 1.5% 3.7% 4.2% -1.1% 3.9% 3.6% 3.8% -1.9% 2.1% 10.8%
2009 4.7% 2.0% 3.6% 1.0% 0.7% 1.3% 4.0% 4.7% 0.8% -0.2% 0.3% -0.6%
2010 2.3% -0.5% 2.9% 2.8% 0.9% -1.8% -3.1% 4.2% 2.2% 4.6% 0.4% 1.8%
2011 3.2% 5.4% -0.9% -1.5% 1.2% 3.0% 0.8% -2.6% 0.1% 0.9% 2.0% 1.4%
2012 4.9% 2.9% 3.4% -2.1% -0.5% -1.8% 0.1% 6.4% -1.6% 0.1% 0.9% 0.3%
2013 0.8% 1.5% -0.2% -0.2% 2.4% 2.0% 1.1% -0.9% 0.0% 1.0% 0.4% -1.8%
2014 -1.4% -2.1% 1.3% -0.8% 2.0% -0.1% 0.3% 0.2% 1.3% -3.5% -0.7% 0.5%
2015 1.6% -2.9% 4.2% -0.3% 0.1% -2.2% 3.8% -2.0% -0.1% 3.5% 1.4% 4.2%
2016 -2.0% 5.7% -2.3% -2.2% -3.0% -1.1% 3.3% -1.6% -0.7%
Source: Credit Suisse; Data as of 09/30/2016
September 2016 Performance Commentary
The Credit Suisse Backwardation RV Strategy returned -0.72% during the month. Industrial
Metals had a strong month (up 2.56%, driven mainly by Lead) however the contribution was negative from all other sectors (especially energy which was down 1.12%).
For more information regarding this index, please contact Mi-Sonn Kim (mi-sonn.kim@credit-
suisse.com) in Commodities Sales.

13 October 2016
Systematic Alpha Monthly 27
Commodity Momentum Long/Short
Asset Class: Commodities BBG Ticker: CSCUMLSE
Strategy Overview
The Credit Suisse Momentum Long/Short Index aims to produce positive absolute returns
regardless of the commodity cycle. It takes long positions in the commodities exhibiting the
strongest upward price trends and short positions in the commodities exhibiting the strongest
downward price trends.
Cumulative Index Performance Performance Summary
80
120
160
200
Jan-07 Jan-09 Jan-11 Jan-13 Jan-15
Live date: February 2009
Sept 2016 YTD
Last 12-Mo.
Since Live
Return -0.07% -7.14% 2.44% 2.05%
Volatility 14.21% 10.95%
Sharpe Ratio 0.17 0.19
Draw dow n 14.75% 14.75%
Weekly Correlation with Benchmarks
Last 12 months
MSCI World -37.0%
15.3%
-82.9%
CS Global Govt Bond Index
S&P GSCI
Source: Credit Suisse; Data as of 09/30/2016 Source: Credit Suisse; Data as of 09/30/2016
Monthly Return
Jan Feb Mar Apr May Jun Jul Aug Sep Oct Nov Dec
2007 -0.2% 1.4% -0.3% 5.1% 0.9% -3.7% -2.4% 4.1% 1.6% 2.5% 4.0% 2.7%
2008 -2.2% 3.0% 1.2% 1.8% 9.5% 4.6% -4.7% -2.4% -0.9% -2.0% -0.2% -0.5%
2009 1.0% 0.2% -2.2% -0.3% -3.1% -4.3% 3.1% 7.2% -1.3% -2.2% 0.1% 2.9%
2010 0.9% 0.9% 7.9% -1.9% -5.5% -5.6% -6.9% 5.6% -0.6% 2.4% -1.8% 2.6%
2011 0.5% 5.9% 0.3% 4.2% -0.4% -2.3% 0.0% 2.9% -4.0% 0.6% 3.0% -1.6%
2012 1.2% 3.3% 3.1% -1.0% -0.1% -2.7% 3.2% 3.2% -7.4% -0.5% -0.1% -1.9%
2013 0.3% -0.6% 0.6% 3.2% 1.0% 1.3% 2.0% 0.4% 0.4% 0.7% 2.0% 2.6%
2014 -1.0% -4.9% -0.7% 2.8% 1.2% -0.4% 3.7% 0.1% 4.0% -3.5% 3.0% 1.7%
2015 3.4% -8.6% 3.3% -3.7% -0.4% -1.7% 1.6% -0.6% 1.4% 1.9% 1.8% 5.4%
2016 0.6% 2.0% -2.8% -3.4% -2.6% -0.6% 4.0% -4.2% -0.1%
Source: Credit Suisse; Data as of 09/30/2016
September 2016 Performance Commentary
The Credit Suisse Momentum Long/Short returned -0.07% during the month. The gains in Industrial Metals, Agriculture, and Precious Metals (0.29%, 0.31%, and 0.33% respectively) were counterbalanced by the loss in Energy (-1.00%).
For more information regarding this index, please contact Mi-Sonn Kim (mi-sonn.kim@credit-
suisse.com) in Commodities Sales, or Victor Belyaev ([email protected]) in
Commodities Structuring.

13 October 2016
Systematic Alpha Monthly 28
Commodity Custom 24 Alpha
Asset Class: Commodities BBG Ticker: CSCUS24A
Strategy Overview
The Credit Suisse Custom 24 Alpha Index provides exposure to a congestion arbitrage strategy in
commodities. It maintains a leveraged long exposure to a version of the Bloomberg Commodity
Index which rolls the underlying futures positions earlier than normal, and a leveraged short
exposure to the Bloomberg Commodity Index itself.
Cumulative Index Performance Performance Summary
80
140
200
260
320
380
440
500
Jan-07 Jan-09 Jan-11 Jan-13 Jan-15
Live date: February 2009
Sept 2016 YTD
Last 12-Mo.
Since Live
Return 1.10% 8.60% 15.15% 11.13%
Volatility 8.15% 10.31%
Sharpe Ratio 1.86 1.08
Draw dow n 6.23% 12.34%
Weekly Correlation with Benchmarks
Last 12 months
MSCI World -15.5%
11.9%
-15.8%
CS Global Govt Bond Index
S&P GSCI
Source: Credit Suisse; Data as of 09/30/2016 Source: Credit Suisse; Data as of 09/30/2016
Monthly Return
Jan Feb Mar Apr May Jun Jul Aug Sep Oct Nov Dec
2007 -0.4% 2.1% -0.6% 4.6% -0.4% 4.4% -0.6% 4.1% 2.2% 1.5% 4.7% 3.7%
2008 1.3% 2.4% 1.1% 0.2% -1.2% 0.1% -0.2% 1.6% 1.2% 4.0% 0.7% 6.9%
2009 5.8% 7.5% 2.7% 6.1% 2.2% 0.2% -0.6% 2.4% 1.6% 1.9% 2.7% 1.9%
2010 1.9% 0.5% 1.0% 3.2% 1.0% -1.3% -2.4% 4.8% -1.3% 3.2% 0.6% -0.2%
2011 1.4% 8.1% 0.0% 0.7% 1.0% 0.7% 1.1% 2.1% -0.3% -1.0% -0.9% 1.2%
2012 0.9% 0.9% 1.3% -3.5% 6.8% -8.9% 1.8% 3.9% -0.3% 0.2% 1.6% 1.5%
2013 0.8% 1.6% 0.8% 1.7% 6.3% -2.3% 2.8% 2.8% 0.8% 0.4% 0.1% -0.8%
2014 -2.2% 4.9% 1.6% 1.2% 0.1% 3.8% 2.4% 0.8% 0.1% 1.5% 1.2% 1.7%
2015 0.9% 0.5% 0.5% -1.9% -2.4% 1.1% -0.7% -0.1% 0.2% 3.4% 0.6% 3.1%
2016 -1.5% 4.4% 1.0% -1.7% 1.7% 2.2% 0.3% 0.8% 1.1%
Source: Credit Suisse; Data as of 09/30/2016
September 2016 Performance Commentary
The Credit Suisse Custom 24 Alpha returned 1.10% during the month. There was a positive performance in all sectors apart from Livestock (-0.30%). The main driver was the strong performance in Energy (1.17%).
For more information regarding this index, please contact Mi-Sonn Kim (mi-sonn.kim@credit-
suisse.com) in Commodities Sales, or Victor Belyaev ([email protected]) in
Commodities Structuring.

13 October 2016
Systematic Alpha Monthly 29
Commodity Custom 88 Enhanced
Asset Class: Commodities BBG Ticker: CSCUE88E
Strategy Overview
The Credit Suisse Custom 88 Enhanced Index provides dynamic exposure to carry returns in
commodities. It allocates short exposure to time spreads in selected commodities with the tenor
of the spreads varying according to the relative risk/reward.
Cumulative Index Performance Performance Summary
80
100
120
140
160
180
Jan-07 Jan-09 Jan-11 Jan-13 Jan-15
Live date: February 2009
Sept 2016 YTD
Last 12-Mo.
Since Live
Return 0.94% 2.30% 3.85% 2.24%
Volatility 4.11% 3.14%
Sharpe Ratio 0.93 0.71
Draw dow n 2.20% 3.61%
Weekly Correlation with Benchmarks
Last 12 months
MSCI World -36.0%
3.2%
-52.4%
CS Global Govt Bond Index
S&P GSCI
Source: Credit Suisse; Data as of 09/30/2016 Source: Credit Suisse; Data as of 09/30/2016
Monthly Return
Jan Feb Mar Apr May Jun Jul Aug Sep Oct Nov Dec
2007 -0.5% 1.6% 0.9% 1.4% 0.4% 0.6% 0.7% 1.9% 1.2% 1.6% 0.9% 1.4%
2008 2.4% 1.2% 2.2% 0.4% 0.5% 1.6% -0.2% -0.7% 0.1% 1.6% -0.1% 2.6%
2009 1.0% 1.6% 0.4% 2.2% -1.5% 0.9% 1.5% 2.6% -1.3% -0.2% 1.2% -0.7%
2010 0.8% -0.5% 0.5% 0.5% 0.5% -0.6% -0.9% 1.1% -0.1% 1.1% 0.3% -0.2%
2011 0.0% 2.0% 1.2% 1.9% 1.2% 0.7% 0.0% 0.6% -0.3% 0.2% -0.1% 0.4%
2012 1.0% 0.6% 1.7% -0.1% -0.5% -0.7% -0.1% 0.6% -0.4% 0.1% -0.1% 0.5%
2013 -0.8% 0.7% -0.5% 0.3% 0.5% -0.9% -0.3% -0.2% 0.7% 1.1% 0.3% -0.1%
2014 -0.4% -0.4% -1.0% 1.1% 1.3% 0.0% 1.9% 0.6% -1.1% 1.4% -0.7% 1.1%
2015 1.2% 1.1% 0.6% -1.2% -0.2% 0.3% 0.2% -0.6% 0.0% -0.1% 1.2% 0.5%
2016 0.3% 2.2% -0.2% -0.1% 0.2% -1.4% 1.4% -1.0% 0.9%
Source: Credit Suisse; Data as of 09/30/2016
September 2016 Performance Commentary
The Credit Suisse Enhanced 88 Strategy returned 0.94% during the month. Lean Hogs had a very good month, returning 1.36% with moderately negative performance in the other components.
For more information regarding this index, please contact Mi-Sonn Kim (mi-sonn.kim@credit-
suisse.com) in Commodities Sales, or Victor Belyaev ([email protected]) in
Commodities Structuring.

13 October 2016
Systematic Alpha Monthly 30
FX Metrics Carry
Asset Class: Currencies BBG Ticker: FXMXCEUS
Strategy Overview
The Credit Suisse FX Metrics Carry: Foreign Currency Strategy systematically trades FX carry in
18 currencies with one-month Cash Settled Forwards. It invests in an equally weighted basket of
top high-yielding currencies and selling an equally weighted basket of low-yielding currencies.
Cumulative Index Performance Performance Summary
85
90
95
100
105
110
115
Jan-07 Jan-09 Jan-11 Jan-13 Jan-15
Live date: March 2010
Sept 2016 YTD
Last 12-Mo.
Since Live
Return 0.61% 5.47% 8.25% -0.67%
Volatility 9.33% 7.32%
Sharpe Ratio 0.89 -0.09
Draw dow n 7.67% 20.39%
Weekly Correlation with Benchmarks
Last 12 months
MSCI World 66.8%
-45.9%
43.2%
CS Global Govt Bond Index
S&P GSCI
Source: Credit Suisse; Data as of 09/30/2016 Source: Credit Suisse; Data as of 09/30/2016
Monthly Return
Jan Feb Mar Apr May Jun Jul Aug Sep Oct Nov Dec
2007 1.5% -0.1% -45.9% 89.2% 3.2% 2.1% -0.6% -3.0% 2.2% 1.9% -48.2% 87.2%
2008 -2.9% -1.2% -6.2% 5.1% 1.8% -1.7% 2.4% 0.0% -6.4% -9.2% -0.6% -0.5%
2009 0.8% 2.3% 2.5% 3.2% 2.2% 2.0% -0.4% -1.1% 2.1% 1.0% -2.3% 4.1%
2010 -1.3% -0.5% 2.1% 3.0% -2.6% -0.6% -0.2% -1.5% 2.3% -0.2% 1.0% 1.4%
2011 -2.3% 0.3% 1.9% 0.9% -0.7% -0.5% -1.3% -1.1% -4.0% 3.9% -1.2% 1.1%
2012 2.1% 2.4% -2.6% -0.5% -1.2% 1.5% 1.0% -1.0% -0.2% -0.1% 0.1% 1.8%
2013 0.8% 0.5% 0.9% 0.7% -3.1% -2.3% -1.5% -2.6% 1.8% 0.5% -0.3% -2.0%
2014 -1.3% 1.8% 3.1% 0.1% 0.7% 0.5% 0.6% 1.9% -2.4% 1.4% -0.2% -0.5%
2015 -2.5% 0.0% -1.3% -0.1% -0.6% -1.3% -2.5% -4.3% -2.4% 3.5% 2.1% -2.7%
2016 -1.1% -0.5% 2.3% 0.5% -1.1% 3.8% 0.5% 0.3% 0.6%
Source: Credit Suisse; Data as of 09/30/2016
September 2016 Performance Commentary
The FX Metrics Carry index gained 0.61% for the month of September 2016. The strategy
continues to produce the same carry signals since April of this year. ZAR soared during the
month, itself gaining 1.2% in the portfolio amid inflows into the country’s bond market and
speculation related to the AB Inbev buying Rand for its M&A activity with SABMiller. AUD, BRL
and NZD were the other gainers in the index, at 0.3%, 0.08% and 0.06% respectively. The Yen
dropped the most in the strategy. With a short position, the Yen appreciated against the Dollar
roughly 2%, leaving a loss of 0.32% for the month. With no major action from the BOJ towards
the end of the month, the Yen has generally appreciated throughout the month, continuing its safe
haven status.
For more information regarding this index, please contact Mi-Sonn Kim (mi-sonn.kim@credit-
suisse.com) in Commodities Sales, or Victor Belyaev ([email protected]) in
Commodities Structuring.

13 October 2016
Systematic Alpha Monthly 31
FX Metrics Momentum
Asset Class: Currencies BBG Ticker: FXMXMEUS
Strategy Overview
The Credit Suisse FX Metrics Momentum: Foreign Currency Strategy systematically trades FX
carry in 18 currencies with one-month Cash Settled Forwards. It invests in currencies in an
upward trend (against the USD) and selling those in a downward trend (against the USD).
Cumulative Index Performance Performance Summary
90
100
110
120
130
Jan-07 Jan-09 Jan-11 Jan-13 Jan-15
Live date: March 2010
Sept 2016 YTD
Last 12-Mo.
Since Live
Return 0.56% -3.92% -3.34% 0.11%
Volatility 6.13% 6.05%
Sharpe Ratio -0.54 0.02
Draw dow n 7.73% 18.49%
Weekly Correlation with Benchmarks
Last 12 months
MSCI World -41.7%
-9.7%
-36.4%
CS Global Govt Bond Index
S&P GSCI
Source: Credit Suisse; Data as of 09/30/2016 Source: Credit Suisse; Data as of 09/30/2016
Monthly Return
Jan Feb Mar Apr May Jun Jul Aug Sep Oct Nov Dec
2007 -1.3% 0.2% 0.9% 1.7% -0.2% 0.3% -0.5% -1.8% 4.7% 2.6% -0.8% -0.2%
2008 0.5% 2.5% 1.0% -0.2% 1.3% 0.9% 0.3% -4.3% 1.0% 7.9% 2.6% -3.4%
2009 6.6% 0.9% -4.8% -3.4% -2.6% 1.3% -0.5% 0.4% 2.3% -0.3% 1.5% -1.6%
2010 -1.7% 0.1% 0.5% 0.6% -2.8% 0.6% -2.0% 0.4% 1.7% 0.4% -3.9% 3.9%
2011 0.5% 1.3% 1.2% 4.2% -1.9% 0.2% 1.3% -1.2% -5.1% -0.8% 1.7% 0.0%
2012 -2.9% -0.8% -1.0% -1.0% 3.7% -3.2% 0.9% -1.4% -1.3% 0.0% -0.1% 0.0%
2013 1.1% -1.6% -0.1% -0.5% -0.8% -0.5% -0.8% 0.3% -0.4% -1.0% -0.5% 1.3%
2014 0.1% -0.4% -1.2% -0.6% -0.2% -0.6% -0.3% 0.4% 1.2% 0.7% 1.1% 3.3%
2015 3.0% -0.1% 2.1% -3.3% 1.5% -0.4% 1.9% 1.6% 1.1% -1.4% 2.1% -0.3%
2016 1.2% -0.8% -4.3% 1.1% -2.0% 1.5% -0.3% -0.8% 0.6%
Source: Credit Suisse; Data as of 09/30/2016
September 2016 Performance Commentary
The FX Metrics Momentum index gained 0.57% during September 2016. The momentum signals remained mostly the same, with CAD, NOK and PLN turning bearish from long positions based on the medium term signal. Again the South African Rand was the biggest gainer, rising 0.44% on speculation of currency demand with the AB Inbev and SABMiller M&A activity. Other gainers were the Peso and Yen, at 0.12% and 0.11% respectively. The Krona was the biggest loser at 0.16%, while the CAD lost 0.05%. Unfortunately for the NOK and CAD, the signal changed mid-month while the currency incurred loses both on the rise and fall during the month.
For more information regarding this index, please contact Mi-Sonn Kim (mi-sonn.kim@credit-
suisse.com) in Commodities Sales, or Victor Belyaev ([email protected]) in
Commodities Structuring.

13 October 2016
Systematic Alpha Monthly 32
FX Metrics Value
Asset Class: Currencies BBG Ticker: FXMXVEUS
Strategy Overview
The Credit Suisse FX Metrics Value: systematically trades FX carry in 18 currencies with one-
month Cash Settled Forwards. It exploits currencies' mean-reversion towards equilibrium levels
based on the CS Fair Value Model. The Strategy buys the cheapest currencies and sells the most
expensive ones on an equally-weighted basis.
Cumulative Index Performance Performance Summary
90
95
100
105
110
115
120
125
Jan-07 Jan-09 Jan-11 Jan-13 Jan-15
Live date: March 2010
Sept 2016 YTD
Last 12-Mo.
Since Live
Return 0.38% 1.50% 3.91% -0.09%
Volatility 6.99% 5.09%
Sharpe Ratio 0.56 -0.02
Draw dow n 5.19% 9.77%
Weekly Correlation with Benchmarks
Last 12 months
MSCI World 63.1%
-21.5%
59.3%
CS Global Govt Bond Index
S&P GSCI
Source: Credit Suisse; Data as of 09/30/2016 Source: Credit Suisse; Data as of 09/30/2016
Monthly Return
Jan Feb Mar Apr May Jun Jul Aug Sep Oct Nov Dec
2007 0.9% 0.1% 0.2% -0.3% 2.1% 0.7% 0.3% 0.2% -1.3% -0.7% 0.9% -0.6%
2008 -1.0% -3.6% -2.1% 2.1% 0.2% -1.6% 2.7% 4.1% 0.9% 2.6% 1.6% -3.8%
2009 5.3% 1.6% 3.8% 2.0% -2.1% 0.5% -0.2% -0.2% -2.3% 0.6% 1.5% -0.2%
2010 1.8% -0.5% -1.1% -1.5% 1.5% -0.3% 0.2% -0.2% 0.0% 0.1% -1.1% -2.3%
2011 2.1% 1.0% -0.5% -1.1% -0.7% -1.5% -3.0% -0.5% 2.5% -2.4% 1.5% 0.3%
2012 -0.1% 1.0% 1.1% 1.0% -0.5% 0.8% 0.2% 1.2% 2.1% -1.1% 0.0% -0.4%
2013 -2.1% -0.3% -1.9% 0.1% 1.9% 2.7% 0.8% 0.2% -2.9% 0.1% 1.0% -0.5%
2014 -0.8% -0.5% -0.2% 0.2% 0.6% -2.4% -0.1% -0.1% 0.6% -0.5% 0.2% -0.8%
2015 0.7% 0.7% 0.5% -0.2% 1.0% 0.4% -0.4% -1.0% -1.3% 1.9% 0.7% -0.3%
2016 0.9% 0.9% 2.1% 2.2% -2.5% -1.4% -0.4% -0.6% 0.4%
Source: Credit Suisse; Data as of 09/30/2016
September 2016 Performance Commentary
The FX Metrics Value index gained 0.38% for the month of September. The fair value signal indicator remains the same from August. The Rand was also long in the Value strategy, and contributed a positive return to the strategy at 1.2%. The NOK was the only other positive currency for the month, at 0.07%. The remaining ten positions all lost small amounts, ranging from 0.01% to 0.35%, with the biggest loser being the Peso. The fair value signal determined the Peso to be undervalued, going long in the strategy. However, the US election has weighted on MXN. Trump showed gains in the polls during mid-September, prompting traders to sell the Peso overall. Though after the first debate, the currency recovered a bit as Clinton was generally perceived to win the debate. The other big loser was the Aussie Dollar, at 0.32%.
For more information regarding this index, please contact Mi-Sonn Kim (mi-sonn.kim@credit-
suisse.com) in Commodities Sales, or Victor Belyaev ([email protected]) in
Commodities Structuring.

13 October 2016
Systematic Alpha Monthly 33
Dynamic Multi Asset Allocation
RAII HOLT®: Risk Appetite Investible Index Powered by HOLT®
Asset Class: Hybrid BBG Ticker: RAIIHUST
Strategy Overview
The Credit Suisse Risk Appetite Investable Indices offer investors a rules-based asset allocation between
equities and bonds. The core concept is to use a highly disciplined rule system to reduce risk (decrease
equities) when investors are unusually optimistic, and to add risk when investors are unusually pessimistic,
as measured by extremes in the Credit Suisse Global Risk Appetite Index (“CS GRAI”). RAII Powered by
HOLT® Total Return consists of: (1) the Credit Suisse HOLT® Long Index Total Return (HSGMNLTR);
and (2) a bond portfolio tracking the Citigroup World Government Bond Index.
Cumulative Index Performance
Performance Summary
80
100
120
140
160
180
200
220
240
Jan-07 Jan-09 Jan-11 Jan-13 Jan-15
Live date: April 2010
Sept 2016 YTD
Last 12-Mo.
Since Live
Return 1.15% -1.07% 3.37% 6.26%
Volatility 15.32% 14.05%
Sharpe Ratio 0.19 0.43
Draw dow n 11.82% 25.63%
Weekly Correlation with Benchmarks Last 12 months
MSCI World 80.8%
-12.3%
43.0%
CS Global Govt Bond Index
S&P GSCI
Source: Credit Suisse; Data as of 09/30/2016 Source: Credit Suisse; Data as of 09/30/2016
Monthly Return
Jan Feb Mar Apr May Jun Jul Aug Sep Oct Nov Dec
2007 0.8% 1.1% 1.9% 5.3% 2.7% -1.7% -1.4% -3.8% 2.6% 3.0% 0.9% -0.6%
2008 4.2% -1.1% 1.1% 4.6% 3.2% -8.0% -1.3% -2.1% -1.5% -4.8% -4.1% 4.3%
2009 -8.2% -8.1% 5.3% 9.7% 13.8% -1.2% 7.9% 4.7% 2.4% -2.5% 4.4% 0.9%
2010 -3.0% 0.3% 5.0% -0.4% -7.5% 0.4% 5.5% -0.3% 5.9% 4.4% -2.0% 7.1%
2011 2.5% 3.5% -1.8% 3.3% -1.9% 0.1% 1.8% 4.0% -7.4% 6.9% -6.5% -2.5%
2012 4.2% 5.5% -0.9% -0.3% -9.6% 1.2% 0.7% 1.1% 3.8% 0.8% 0.9% 3.2%
2013 5.8% -0.9% 1.8% 4.2% 0.8% -4.2% 5.7% -2.2% 5.4% 2.9% 1.5% 1.5%
2014 -2.3% 5.8% 0.2% 0.2% 1.0% 0.6% -2.8% -2.0% -3.4% -0.4% -0.6% -3.3%
2015 -0.7% 3.9% -1.1% 2.2% 2.2% -2.2% 0.5% -9.9% -1.4% 3.9% -1.0% 0.2%
2016 -3.7% -4.1% 6.5% 2.1% 0.5% -6.7% 3.6% 0.3% 1.1%
Source: Credit Suisse; Data as of 09/30/2016
September 2016 Performance Commentary
During September the RAII HOLT Total Return Index’s allocation model reverted to a 100%
allocation to equities following a positive signal from the Trend Model. The allocation model is
positioned as follows: Global Risk Appetite: the Global Risk Appetite Index started the month at
0.47 and deteriorated to 0.06 by month end. The contrarian component is not active at these
levels. Stop Losses: Currently active, should equity markets fall significantly from here, the stop
will move the allocation towards 50/50; Equity Valuation: The metric of equity valuation remains
comfortably below long term extremes, so the valuation component of the allocation model is not
currently relevant; Trend Following: the Trend signal turned positive in September. Significant
equity market weakness or bond strength from here could lead to a 100% allocation to bonds.
For more information regarding this index, please contact the Equities SIS Product Management
team at [email protected].

13 October 2016
Systematic Alpha Monthly 34
RAII HOLT® Relative Value
Asset Class: Hybrid BBG Ticker: RAIIHRVU
Strategy Overview
RAII Powered by HOLT® Relative Value consists of a long component and a short component.
The long component comprises (1) the Credit Suisse HOLT® Long Index Total Return
(HSGMNLTR) and (2) a bond portfolio tracking the Citigroup World Government Bond Index. The
short component consists of a static portfolio of 50% MSCI World Index and 50% cash. The index
can have an equity exposure of -50% to +50% and has a volatility control mechanism that
maintains volatility at or below 10%.
Cumulative Index Performance Performance Summary
80
100
120
140
160
180
Jan-07 Jan-09 Jan-11 Jan-13 Jan-15
Live date: April 2011
Sept 2016 YTD
Last 12-Mo.
Since Live
Return 0.45% -5.07% -5.60% -0.25%
Volatility 9.56% 8.41%
Sharpe Ratio -0.63 -0.06
Draw dow n 8.63% 22.84%
Weekly Correlation with Benchmarks
Last 12 months
MSCI World 34.8%
-0.2%
17.7%
CS Global Govt Bond Index
S&P GSCI
Source: Credit Suisse; Data as of 09/30/2016 Source: Credit Suisse; Data as of 09/30/2016
Monthly Return
Jan Feb Mar Apr May Jun Jul Aug Sep Oct Nov Dec
2007 0.0% 1.1% 0.8% 2.9% 1.1% -1.5% -0.5% -4.0% 0.1% 1.3% 2.9% -0.3%
2008 6.5% -0.7% 1.2% 1.8% 2.3% -4.2% -0.3% -1.5% 2.9% 2.8% -0.4% 1.2%
2009 -1.9% -2.3% 1.8% 3.4% 6.4% -0.7% 3.0% 2.5% 0.4% -1.6% 2.3% 0.0%
2010 -0.9% -0.3% 1.9% -0.4% -2.8% 2.1% 1.6% 1.5% 1.2% 2.6% -1.0% 3.6%
2011 1.2% 1.7% -1.3% 1.3% -1.0% 0.8% 2.7% 7.6% -2.4% 1.7% -3.5% -1.6%
2012 1.3% 2.2% -1.2% 0.1% -5.3% -1.3% 0.1% -0.1% 2.4% 1.1% 0.3% 2.7%
2013 2.8% -1.0% 0.7% 2.6% 0.8% -3.0% 3.0% -1.1% 2.9% 1.0% 0.6% 0.6%
2014 -0.5% 3.2% 0.1% -0.3% 0.0% -0.3% -2.0% -3.1% -2.1% -0.8% -1.6% -2.8%
2015 0.5% 1.0% -0.4% 1.0% 2.0% -1.0% -0.3% -7.1% 0.9% 0.0% -0.8% 0.6%
2016 -0.3% -3.7% 3.0% 1.1% 0.4% -6.6% 0.8% 0.1% 0.4% Source: Credit Suisse; Data as of 09/30/2016
September 2016 Performance Commentary
During September the RAII HOLT Relative Value Index’s allocation model reverted to a 50% net
allocation to equities (100% in the long strategy) following a positive signal from the Trend Model.
The allocation model is positioned as follows: Global Risk Appetite: the Global Risk Appetite Index
started the month at 0.47 and deteriorated to 0.06 by month end. The contrarian component is not
active at these levels; Stop Losses: Currently active, should equity markets fall significantly from
here, the stop will move the net equity allocation towards 0% (50% equities / 50% bonds in the
long strategy); Equity Valuation: The metric of equity valuation remains comfortably below long
term extremes, so the valuation component of the allocation model is not currently relevant; Trend
Following: the Trend signal turned positive in September. Significant equity market weakness or
bond strength from here could lead to a 50% allocation to bonds (100% in the long strategy).
For more information regarding this index, please contact the Equities SIS Product Management
team at [email protected].

13 October 2016
Systematic Alpha Monthly 35
ARROW 6%
Asset Class: Hybrid BBG Ticker: ARROWUT6
Strategy Overview
The Credit Suisse ARROW index is a simple, long only, research-based index that invests across
various liquid asset classes: equities, bonds, commodities, and real estate. The index is
rebalanced monthly to capture market trends and timing. Its transparent allocation mechanism
consists of three layers that aim to maximize return for a given target volatility: (1) Trend-following
signals, (2) Markowitz optimization, and (3) Volatility control mechanism.
Cumulative Index Performance Performance Summary
100
120
140
160
Jan-07 Jan-09 Jan-11 Jan-13 Jan-15
Live date: November 2011
Sept 2016 YTD
Last 12-Mo.
Since Live
Return 0.29% 9.84% 7.78% 2.05%
Volatility 5.35% 5.12%
Sharpe Ratio 1.37 0.35
Draw dow n 4.07% 11.91%
Weekly Correlation with Benchmarks
Last 12 months
MSCI World 5.4%
69.9%
3.1%
CS Global Govt Bond Index
S&P GSCI
Source: Credit Suisse; Data as of 09/30/2016 Source: Credit Suisse; Data as of 09/30/2016
Monthly Return
Jan Feb Mar Apr May Jun Jul Aug Sep Oct Nov Dec
2007 1.6% 0.4% 0.8% 1.6% 0.3% -0.5% 1.8% -0.3% 4.0% 4.1% -0.7% 0.6%
2008 2.4% 2.4% -1.2% -1.5% 0.4% 0.5% -0.9% -1.4% -1.5% -3.2% 2.0% 3.3%
2009 -2.0% -0.5% 0.2% -0.1% 3.6% -0.1% 3.1% 1.5% 3.6% -0.1% 3.0% -2.4%
2010 -1.0% 0.0% 1.0% 1.3% -1.7% 2.2% -0.9% 1.7% 2.9% 1.9% -3.0% 1.2%
2011 -1.3% 1.4% 0.6% 2.0% -1.3% -1.3% 3.1% 4.4% -2.0% 0.4% -0.5% -0.7%
2012 2.4% 1.6% -0.9% 1.5% -2.4% 1.2% 2.0% 0.1% 1.2% -0.4% 0.5% 0.9%
2013 0.9% -0.3% 0.9% 3.1% -4.1% -3.5% 1.4% -1.3% 0.4% 1.1% -0.3% 0.5%
2014 -1.6% 2.0% -0.6% 1.4% 1.8% 1.0% -1.7% 1.3% -4.3% 2.1% 0.3% -0.4%
2015 2.1% -1.3% -0.3% 0.0% -1.0% -2.2% -0.8% -0.5% 0.1% -0.2% -1.8% -0.4%
2016 1.3% 1.7% 1.0% 0.8% -0.8% 3.8% 1.8% -0.3% 0.3%
Source: Credit Suisse; Data as of 09/30/2016
September 2016 Performance Commentary
There was varied performance across the range of assets within ARROW's universe in
September. ARROW, which was in a Risk-Neutral portfolio stance throughout the month, finished
up with a positive performance of +0.3%. Most of the strategy's positions contributed positively in
September: commodities (+4.1%), emerging market equity (+1.3%), gold (+1.0%) and emerging
market bonds (+0.3%). ARROW's risk remained in a Risk-Neutral portfolio stance on the August
roll date. The strategy increased its exposure by 10% to inflation linked bonds (from 0% to 10%),
by 5% to US government bonds (from 5% to 10%) and subsequently lowered its allocation to gold
(from 15% to 5%) and to commodities (from 5% to 0%).
For more information regarding this index, please contact the Equities SIS Product Management
team at [email protected].

13 October 2016
Systematic Alpha Monthly 36
Multi-Asset Futures Strategy
Asset Class: Hybrid BBG Ticker: CSMF1ER
Strategy Overview
The Credit Suisse Multi-Asset Futures Strategy (CSMF1) is a long/short systematic investment
strategy that dynamically adjusts its exposure to futures markets in commodities, equities, foreign
exchange, and interest rates based on trend-following signals.
Cumulative Index Performance Performance Summary
80
100
120
140
160
180
200
Jan-07 Jan-09 Jan-11 Jan-13 Jan-15
Live date: October 2011
Sept 2016 YTD
Last 12-Mo.
Since Live
Return 2.38% 2.14% 3.98% 2.53%
Volatility 11.56% 9.19%
Sharpe Ratio 0.34 0.27
Draw dow n 13.69% 16.34%
Weekly Correlation with Benchmarks
Last 12 months
MSCI World -58.6%
37.9%
-57.3%
CS Global Govt Bond Index
S&P GSCI
Source: Credit Suisse; Data as of 09/30/2016 Source: Credit Suisse; Data as of 09/30/2016
Monthly Return
Jan Feb Mar Apr May Jun Jul Aug Sep Oct Nov Dec
2007 -0.3% 1.6% 2.9% 1.8% 1.9% -0.5% 0.4% 1.5% 2.6% 3.7% -1.9% 2.0%
2008 1.6% 5.9% -1.1% 0.2% 4.8% 4.1% -8.0% -0.3% 10.3% 15.3% 5.1% 0.0%
2009 3.6% 3.0% -7.4% -0.3% 0.0% 0.0% -0.2% 1.8% 0.4% -3.5% 3.3% -1.0%
2010 -3.6% 0.1% 1.9% 2.1% -9.2% -0.7% -0.8% 1.9% 1.2% 3.6% -2.3% 8.5%
2011 2.1% 4.6% -0.7% 5.0% -7.5% 0.3% 1.8% -1.8% 4.0% -4.2% 6.3% 2.0%
2012 -2.4% 0.3% 3.0% -1.2% -1.5% -4.2% -1.4% -1.0% -2.8% -2.7% -0.5% 0.2%
2013 1.1% -0.7% 1.6% 0.0% -0.4% 1.7% -0.7% -1.0% -0.7% 1.8% 1.4% 0.3%
2014 0.2% 0.8% -1.6% 1.8% -1.8% 0.6% 0.5% 0.8% 4.2% -0.5% 3.6% 3.2%
2015 -0.3% -2.9% 2.9% -5.7% 0.7% -1.7% 5.2% -0.6% 1.3% -2.8% 2.7% 1.5%
2016 4.6% 2.6% -7.4% -0.3% -2.1% 3.6% -1.6% 1.0% 2.4%
Source: Credit Suisse; Data as of 09/30/2016
September 2016 Performance Commentary
The Credit Suisse Multi-Asset Futures Strategy returned 2.38% during the month. The main drivers of the positive performance were Livestock (mainly Lean Hogs which were up 1.48%) with other sectors having a less significant contribution.
For more information regarding this index, please contact Mi-Sonn Kim (mi-sonn.kim@credit-
suisse.com) in Commodities Sales, or Victor Belyaev ([email protected]) in
Commodities Structuring.

13 October 2016
Systematic Alpha Monthly 37
MASTRO
Asset Class: Hybrid BBG Ticker: CSMST4E
Strategy Overview
The Credit Suisse MASTRO 4% EUR Index is an algorithmic index that offers exposure to indices
across diversified asset classes, including Equity, FX, and Commodities. The index comprises
three Credit Suisse absolute return sub-indices – Equity: HS Global Style Rotation Equity Hedged
Index (HSGSREHE), FX: CS FX Factor Index (FXFTEREU), and Commodities: CS MOVERS
Market Neutral Index (CSMVNEER) – and uses an intelligent weighting mechanism to optimize
returns for the given 4% maximum volatility. Low correlation between the sub-indices enables the
combined strategy to provide stable and attractive returns with low volatility across different
macroeconomic environments.
Cumulative Index Performance Performance Summary
100
105
110
115
120
125
Jan-07 Jan-09 Jan-11 Jan-13 Jan-15
Live date: August 2010
Sept 2016 YTD
Last 12-Mo.
Since Live
Return 0.65% -1.90% -2.42% -1.66%
Volatility 7.82% 4.67%
Sharpe Ratio -0.31 -0.35
Draw dow n 5.51% 15.75%
Weekly Correlation with Benchmarks
Last 12 months
MSCI World 7.3%
0.3%
0.5%
CS Global Govt Bond Index
S&P GSCI
Source: Credit Suisse; Data as of 09/30/2016 Source: Credit Suisse; Data as of 09/30/2016
Monthly Return
Jan Feb Mar Apr May Jun Jul Aug Sep Oct Nov Dec
2007 -0.2% 0.7% 1.1% 0.9% 0.8% 1.1% 0.6% 0.8% 1.2% 0.8% 1.4% 1.4%
2008 -1.3% 1.5% -0.6% 0.3% 3.4% 0.4% -0.8% -0.9% -1.9% 0.7% 0.5% 0.2%
2009 2.2% 0.5% -0.2% 0.8% 1.0% 0.8% 0.3% 0.8% -1.4% -0.8% -0.1% 0.9%
2010 -0.5% -0.8% 1.0% -0.3% -0.1% 0.1% -2.1% 0.5% -0.4% 1.1% -0.5% 0.4%
2011 -0.7% 0.7% 1.1% 1.8% -2.0% 0.8% 0.0% -1.5% -2.2% -0.8% 1.1% -0.1%
2012 1.1% 1.1% -0.2% -0.4% -2.2% -0.5% 1.5% -1.3% -0.9% 0.1% -0.9% -0.2%
2013 0.4% -0.4% -0.2% -0.9% 0.7% 1.6% 0.7% 0.1% -0.1% 0.1% 0.5% 0.7%
2014 -0.2% -1.2% -0.5% 0.7% -0.2% -0.7% -1.1% 0.3% -0.4% -0.1% 0.3% 0.5%
2015 -1.6% -1.0% 0.2% -1.3% 0.8% -1.0% 0.0% -0.7% 0.1% -1.0% 0.1% 0.0%
2016 0.4% 0.8% -0.7% -0.5% 1.1% 0.4% -2.8% -1.2% 0.7%
Source: Credit Suisse; Data as of 09/30/2016
September 2016 Performance Commentary
The Credit Suisse MASTRO 4% EUR Index gained 0.7%. The HS Global Style Rotation Equity
Hedged Index was flat, The CS FX Factor Index gained 0.69%. The CS MOVERS Market Neutral
Index gained 2.25%.
For more information regarding this index, please contact the Equities SIS Product Management
team at [email protected].

13 October 2016
Systematic Alpha Monthly 38
Systematic Tactical Asset Allocation
Asset Class: Hybrid BBG Ticker: STAAUE
Strategy Overview
The Systematic Tactical Asset Allocation (STAA) index is a long-only asset allocation strategy
based on short-term momentum and long-term mean reversion. The index gains daily long
exposure to global equities, government bonds, commodities and real estate when it detects a
short-term upward trend and relies on long-term reversal patterns to implement caps and floors for
each asset class.
Cumulative Index Performance Performance Summary
90
100
110
120
130
140
150
160
Jan-07 Jan-09 Jan-11 Jan-13 Jan-15
Live date: October 2013
Sept 2016 YTD
Last 12-Mo.
Since Live
Return 0.05% 1.90% -0.34% -0.14%
Volatility 4.99% 4.87%
Sharpe Ratio -0.07 -0.03
Draw dow n 7.21% 14.93%
Weekly Correlation with Benchmarks
Last 12 months
MSCI World 64.8%
20.2%
54.4%
CS Global Govt Bond Index
S&P GSCI
Source: Credit Suisse; Data as of 09/30/2016 Source: Credit Suisse; Data as of 09/30/2016
Monthly Return
Jan Feb Mar Apr May Jun Jul Aug Sep Oct Nov Dec
2007 0.3% -0.3% 0.2% 1.5% -0.1% -1.0% -0.2% -1.5% 2.0% 2.4% -0.3% 0.1%
2008 0.4% 2.8% 0.1% -1.1% 0.3% -2.1% -2.2% -1.4% -1.4% 0.0% 3.9% 2.5%
2009 -3.8% -2.2% 2.9% 3.0% 4.9% -1.5% 5.6% 3.1% 0.9% -0.3% 1.9% 1.0%
2010 -2.6% 1.2% 2.9% 1.0% -3.8% 0.5% 0.8% 0.4% 2.6% 1.3% -1.6% 2.5%
2011 1.5% 2.7% -0.6% 2.9% -1.9% -1.8% 1.6% -0.6% -0.3% -0.2% -0.1% 1.0%
2012 1.3% 2.1% -0.1% -0.4% -4.4% 1.4% 1.3% 0.0% 0.5% -0.5% 1.3% 1.1%
2013 1.8% 0.3% 1.7% 2.1% -1.4% -2.6% 2.2% -0.5% 1.7% 1.5% 0.1% -0.5%
2014 -0.5% 1.3% -0.3% 0.8% 1.2% 0.9% -0.7% 1.0% -1.4% 1.2% 1.3% 0.4%
2015 2.0% 0.7% 0.3% 0.1% -0.3% -2.0% -2.2% -2.7% -0.8% -0.1% -1.2% -1.0%
2016 -1.6% 0.5% 0.4% 0.7% -0.1% 1.8% 0.6% -0.3% 0.1%
Source: Credit Suisse; Data as of 09/30/2016
September 2016 Performance Commentary
There was varied performance across the range of assets within CS STAA's universe in September. The strategy, which started the month with a significant allocation to bonds, finished the month with a positive performance of +0.1%. Most of the strategy's positions contributed positively in September, led by exposure to commodities (+4.1%), emerging market equity (+1.2%), Euro treasuries (+0.6%), Japanese treasuries (+0.4%), gold (+0.4%) and US treasuries (+0.1%). The remainder of the positions exhibited negative performance: Japanese equity (-2.0%), global real estate (-1.1%), European equity (-0.8%) and US equity (-0.2%). The CS STAA Index marginally increased its allocation to equities (up 3.8% to 31.6%) following improved trends. Consequently, the strategy has reduced its allocation to bonds (down 3.2% to 43.1%). Other long-term mean reversion signals remained the same, with commodities deemed oversold and US and European treasuries deemed overbought.
For more information regarding this index, please contact the Equities SIS Product Management team at [email protected].

13 October 2016
Systematic Alpha Monthly 39
TEMPO
Asset Class: Hybrid BBG Ticker: CSEATMP6
Strategy Overview
The Credit Suisse Tactical Mean-Variance Portfolio Optimizer (TEMPO) Index seeks to apply
modern portfolio theory in the form of Mean-Variance Optimization analysis to allocate a notional
portfolio across various asset classes via long only exposure in ETFs. The strategy identifies the
hypothetical portfolio that over a recent historical period would have resulted in the highest
volatility adjusted return on daily basis. The Volatility Targeted Index attempts to control the
volatility of the index to a predefined level.
Cumulative Index Performance Performance Summary
90
110
130
150
170
190
Jan-07 Jan-09 Jan-11 Jan-13 Jan-15
Live date: February 2014
Sept 2016 YTD
Last 12-Mo.
Since Live
Return -1.87% 3.63% 0.09% 0.28%
Volatility 6.76% 5.97%
Sharpe Ratio 0.01 0.05
Draw dow n 4.50% 16.16%
Weekly Correlation with Benchmarks
Last 12 months MSCI World 7.4%
28.5%
-0.7%
CS Global Govt Bond Index
S&P GSCI
Source: Credit Suisse; Data as of 09/30/2016 Source: Credit Suisse; Data as of 09/30/2016
Monthly Return
Jan Feb Mar Apr May Jun Jul Aug Sep Oct Nov Dec
2007 -0.3% 0.3% -0.9% -1.4% 0.2% 3.2% 6.0% 1.5% 2.3% 3.9% 0.5% -2.2%
2008 3.0% -0.3% -0.5% 0.3% 1.8% 0.3% -1.0% 0.6% -2.0% 8.8% 1.9% 3.3%
2009 0.1% -0.6% 1.5% -0.9% 1.1% -0.4% 1.0% -0.3% -0.4% -0.9% 2.5% -1.1%
2010 0.0% -0.4% 1.4% 2.2% 1.4% -0.2% 0.2% 1.1% 1.8% 1.6% -0.1% 1.5%
2011 0.4% 1.3% -1.6% 3.3% -1.2% -1.9% 1.0% 5.3% 0.4% 0.7% -1.1% 0.4%
2012 1.5% 0.0% -1.0% 0.3% 0.8% -1.5% 2.0% -0.6% 1.8% -0.7% -0.4% 0.4%
2013 0.1% 0.6% 1.2% 1.0% -2.5% 2.3% -0.5% -0.8% -4.4% 1.9% 0.1% 0.8%
2014 -0.3% 1.2% -1.2% -0.8% 1.5% -0.2% -1.0% 1.1% -0.1% 0.8% 0.9% -1.2%
2015 5.2% -1.1% -0.9% -0.4% -1.2% -2.1% -1.1% -5.2% -1.6% -0.6% -1.3% -1.8%
2016 1.7% 2.1% 2.3% 0.2% -0.9% 1.2% 0.8% -1.7% -1.9%
Source: Credit Suisse; Data as of 09/30/2016
EEM GLD HYG IYR LQD SHY SPY TIP USO UUP VIXY
Monthly Performance Attribution 0.39% -0.08% 0.10% 0.00% -0.30% 0.00% -0.08% -0.04% -0.20% 0.03% -1.66%
Source: Credit Suisse
September 2016 Performance Commentary
TEMPO was down 1.9% in September. It was mainly led down by VIXY (VIX), LQD (IG Bond) which had average exposure of 6%, 8% and contributed -1.7%,-0.3% to Index performance. The Index has positive attribution from EEM(Emerging Markets) with average weight of 16% and attribution of 0.39% to Index performance.
For more information regarding this index, please contact US Equity Derivatives Structuring at

13 October 2016
Systematic Alpha Monthly 40
Portfolio Hedging
Equity Dynamic Tail Hedge SPX Index
Asset Class: Equity BBG Ticker: CSEADTSP
Strategy Overview
The Credit Suisse Dynamic Tail Hedge SPX Index is a rule-based algorithm on the SPX Index
that achieves long equity tail risk protection through exposure to three-month ratio put spreads
(short 95% strike puts, long 80% strike puts) when indicators identify extreme negative market
scenarios and is allocated to cash during stable markets. If only one of its indicators identifies a
negative market scenario, the strategy allocates 50% to cash and the other 50% to the hedging
component. If none of its indicators identify market stress, the strategy is entirely allocated to cash.
The index relies on two indicators – CDS spreads on US companies and the skew level of the
S&P 500.
Cumulative Index Performance Performance Summary
80
100
120
140
160
Jul-07 Jul-09 Jul-11 Jul-13 Jul-15
Live date: December 2011
Sept 2016 YTD
Last 12-Mo.
Since Live
Return -0.04% -5.15% -6.25% -6.09%
Volatility 1.89% 2.22%
Sharpe Ratio -3.58 -2.86
Draw dow n 6.41% 25.34%
Weekly Correlation with Benchmarks
Last 12 months
MSCI World 24.7%
-9.7%
4.6%
CS Global Govt Bond Index
S&P GSCI
Source: Credit Suisse; Data as of 09/30/2016 Source: Credit Suisse; Data as of 09/30/2016
Monthly Return
Jan Feb Mar Apr May Jun Jul Aug Sep Oct Nov Dec
2007 0.4% 0.3% -0.3% -3.3% -0.4%
2008 -1.5% -0.7% -1.7% -0.2% 0.1% 0.0% -2.3% -1.2% 2.5% 38.0% -3.5% -0.7%
2009 -0.1% -0.1% -0.1% -0.1% -0.1% -0.1% -0.1% -0.1% -0.1% -0.1% -0.8% -0.1%
2010 -0.1% -0.6% -0.1% -0.1% 8.0% -2.3% -1.5% -0.1% -0.1% -0.1% -0.1% -0.1%
2011 -0.1% -0.3% -1.5% -0.1% -0.1% -0.1% -1.0% 17.9% -1.0% -0.8% -0.1% -0.1%
2012 -0.1% -0.1% -0.1% -0.1% -2.1% -1.4% -0.1% -0.1% -0.1% -0.1% -0.1% 0.0%
2013 -0.3% -0.1% -0.1% -1.1% -0.1% -1.6% -0.3% -0.1% -0.1% -0.7% -0.1% -0.1%
2014 -0.2% -1.0% -0.3% -0.1% -0.1% -0.1% -0.1% -0.8% -0.7% -2.0% -0.1% -0.7%
2015 -1.5% -0.2% -0.1% -0.1% -0.1% -0.2% -1.0% -1.0% -4.1% -0.6% -0.1% -0.4%
2016 -2.8% -0.3% -0.2% 0.0% 0.0% -1.7% 0.0% 0.0% 0.0%
Source: Credit Suisse; Data as of 09/30/2016
September 2016 Performance Commentary
The Credit Suisse Equity Dynamic Tail Hedge on S&P 500 Index was flat in September (0.0%). The Skew and CDS signals remained OFF for the entire month of September, implying a 0% index allocation throughout the month.
For more information regarding this index, please contact the Equities SIS Product Management
team at [email protected].

13 October 2016
Systematic Alpha Monthly 41
Cheapest Slide Index
Asset Class: Equity BBG Ticker: CSEACHPS
Strategy Overview
The Credit Suisse Cheapest Slide index aims to gain long exposure to Euro Stoxx 50 implied
volatility at the lowest possible cost of carry by entering into long forward-starting variance swaps
and positioning at the most advantageous point on the term structure.
Cumulative Index Performance Performance Summary
80
120
160
200
240
280
Jan-07 Jan-09 Jan-11 Jan-13 Jan-15
Live date: December 2011
Sept 2016 YTD
Last 12-Mo.
Since Live
Return -0.75% -7.57% -10.54% -11.39%
Volatility 15.04% 10.61%
Sharpe Ratio -0.73 -1.10
Draw dow n 21.49% 43.89%
Weekly Correlation with Benchmarks
Last 12 months
MSCI World -85.3%
22.0%
-47.6%
CS Global Govt Bond Index
S&P GSCI
Source: Credit Suisse; Data as of 09/30/2016 Source: Credit Suisse; Data as of 09/30/2016
Monthly Return
Jan Feb Mar Apr May Jun Jul Aug Sep Oct Nov Dec
2007 -1.2% 0.2% -1.1% -1.0% -0.6% 0.2% 2.1% 5.9% -6.1% -2.7% -0.9% -2.4%
2008 2.1% 0.1% -0.8% -3.8% 0.2% 0.3% -0.7% -0.2% 10.0% 117.9% 13.7% -4.9%
2009 0.7% -1.0% -0.7% -3.2% -0.6% -0.5% -0.6% -0.3% -0.5% 0.3% -0.7% -2.4%
2010 -1.7% -0.8% -1.4% 1.4% 8.3% -0.2% -2.0% 0.1% -1.1% -1.9% 1.7% -2.9%
2011 -0.9% -0.2% -0.9% -0.7% -0.7% -0.7% -0.9% 18.5% 8.8% -8.2% 0.8% -3.5%
2012 -2.5% -1.3% -0.9% 0.1% 1.5% -2.3% -0.2% -0.4% -1.2% -1.7% -1.9% -0.6%
2013 -2.9% 0.4% -0.5% -2.9% -2.4% -0.4% -2.8% 0.4% -2.4% -1.0% -1.0% -1.1%
2014 1.8% -2.4% -0.6% -2.4% -1.2% -1.0% -0.3% -1.9% -0.8% -2.8% -1.2% 1.6%
2015 -1.4% -2.6% 0.2% -0.5% -1.1% 10.2% -11.1% 3.7% 1.1% -3.3% -1.0% 0.6%
2016 6.3% -1.5% -7.6% -0.6% -2.1% 1.3% -2.0% -0.3% -0.8%
Source: Credit Suisse; Data as of 09/30/2016
September 2016 Performance Commentary
The Credit Suisse Cheapest Slide Index delivered a negative return of 0.8% in September amidst
falling European equity markets, with the EuroSTOXX50 Total Return Index delivering a negative
return of -0.6%. On the August roll date (19 August 2016), the Index was long the December 2016
forward-starting variance swap of two-month maturity with volatility strike of 27.36%. This position
delivered a negative return of -0.1% to the Index in September to the roll date. On the most recent
roll date (16 September 2016), the Index extended its position in the same December 2016
forward starting of two month maturity, with volatility strike of 27.62%. This position delivered a
negative return of -0.6% to the Index in September from the roll date.
For more information regarding this index, please contact the Equities SIS Product Management
team at [email protected].

13 October 2016
Systematic Alpha Monthly 42
Advanced Defensive Volatility Index
Asset Class: Equity BBG Ticker: CSEAADVL
Strategy Overview
The Credit Suisse Advanced Defensive Volatility Index aims to gain long exposure to S&P 500
implied volatility based on the expected decay at the short and medium term of the VIX futures
curve. The strategy enters into a long position in either the S&P 500 VIX Short-Term Futures
Index or the S&P 500 VIX Medium-Term Futures and incorporates a loss-control mechanism.
Cumulative Index Performance Performance Summary
80
100
120
140
160
180
200
Apr-08 Apr-10 Apr-12 Apr-14 Apr-16
Live date: September 2012
Sept 2016 YTD
Last 12-Mo.
Since Live
Return -0.30% -4.92% -12.98% -10.20%
Volatility 9.43% 8.90%
Sharpe Ratio -1.38 -1.15
Draw dow n 11.85% 37.93%
Weekly Correlation with Benchmarks
Last 12 months
MSCI World -71.1%
14.0%
-46.0%
CS Global Govt Bond Index
S&P GSCI
Source: Credit Suisse; Data as of 09/30/2016 Source: Credit Suisse; Data as of 09/30/2016
Monthly Return
Jan Feb Mar Apr May Jun Jul Aug Sep Oct Nov Dec
2008 0.1% 0.2% -2.2% 0.0% 6.6% 32.6% 4.7% 1.7%
2009 0.4% 2.6% -1.0% -0.4% -0.8% -0.2% 0.0% 0.1% -0.2% 0.1% -0.2% -0.4%
2010 -0.4% -0.4% -0.2% 0.4% 4.5% 1.0% -0.9% 0.4% -0.3% -0.7% 0.0% -0.6%
2011 -0.6% -0.5% -2.1% -0.4% -0.1% -0.8% -1.6% 18.7% 12.6% -5.6% 1.3% -0.4%
2012 -0.5% 0.1% -0.9% 0.0% 0.6% -0.6% -0.3% -0.1% -1.0% 0.1% -0.6% -0.2%
2013 -4.3% 0.3% -0.2% -0.6% 0.3% 0.3% -0.9% 0.3% -0.4% -4.5% -0.3% -2.7%
2014 1.8% -5.3% -0.5% -0.5% -0.2% -0.5% 0.2% -2.5% 0.4% -5.3% -0.1% -3.2%
2015 -0.5% -0.9% 0.1% -0.3% -0.3% 0.1% -1.3% 3.7% -0.3% -7.3% -0.4% -1.0%
2016 1.6% -2.3% -0.8% 0.2% -0.3% -2.5% -0.6% 0.0% -0.3%
Source: Credit Suisse; Data as of 09/30/2016
September 2016 Performance Commentary
Advanced DVOL was down 0.30% in September (SPVXSP Index: -4.63%, SPVXMP Index: -
3.17%). The Index had a weight of 5% in mid-term future Index during the whole month except in
the middle when it switched to short-term future (5%) for a day ahead of BOJ/Fed meeting. Index
was down due to decay of mid-term future index.
For more information regarding this index, please contact US Equity Derivatives Structuring at

13 October 2016
Systematic Alpha Monthly 43
Tail Risk Overlay Protection Strategy
Asset Class: Interest Rates BBG Ticker: CSTSERUS
Strategy Overview
The Credit Suisse Tail risk Overlay Protection Strategy (CSTOPS) trades US and euro zone bond
futures, with tenors ranging from three months to ten years when the model detects upward
momentum in these futures. The strategy focuses on upward momentum in interest rate futures
prices because the goal is to mitigate one-sided tail risk.
Cumulative Index Performance Performance Summary
80
100
120
140
160
180
200
220
Jan-07 Jan-09 Jan-11 Jan-13 Jan-15
Live date: August 2011
Sept 2016 YTD
Last 12-Mo.
Since Live
Return -0.11% 1.14% 0.14% 2.57%
Volatility 5.05% 5.14%
Sharpe Ratio 0.03 0.50
Draw dow n 3.48% 6.33%
Weekly Correlation with Benchmarks
Last 12 months
MSCI World -29.3%
48.1%
-29.4%
CS Global Govt Bond Index
S&P GSCI
Source: Credit Suisse; Data as of 09/30/2016 Source: Credit Suisse; Data as of 09/30/2016
Monthly Return
Jan Feb Mar Apr May Jun Jul Aug Sep Oct Nov Dec
2007 -0.1% 0.0% 0.0% 0.0% 0.0% 0.0% 0.0% -0.9% 0.5% -0.8% 5.6% -2.7%
2008 9.0% 2.8% -2.3% -5.3% -0.1% 0.0% 0.0% 0.1% -1.8% 12.4% 10.4% 13.3%
2009 -0.9% 2.7% 2.4% -0.7% 1.6% -4.7% 1.9% 2.0% 2.4% 0.6% 3.8% -2.5%
2010 3.5% 3.0% 0.4% 0.9% 2.4% 1.6% 0.7% 3.0% -2.0% -0.3% -1.5% 0.1%
2011 -0.7% 0.3% -0.7% 0.6% 1.2% -1.2% 5.4% 6.0% 1.4% -1.7% 0.1% 1.2%
2012 0.9% -0.1% -1.2% 1.5% 1.9% -1.4% 4.1% -0.3% -0.3% -0.6% 0.1% -0.2%
2013 -2.0% 0.0% 0.0% 0.5% -1.8% -0.4% 0.0% 0.0% 0.1% 0.6% 0.4% -1.8%
2014 0.5% -0.2% -0.6% 0.6% 1.5% 0.1% -0.3% 1.6% 0.1% -0.6% 0.9% -0.2%
2015 2.1% -0.5% 0.3% -0.4% -0.2% -0.6% 0.2% 0.0% 1.0% 0.1% 0.2% -1.4%
2016 1.6% 0.9% -1.7% -0.4% -0.1% 2.8% -1.0% -0.7% -0.1%
Source: Credit Suisse; Data as of 09/30/2016
September 2016 Performance Commentary
The Credit Suisse Tail Risk Protection Strategy (CSTOPS) had the return of -0.11% during the ninth month in year 2016. The index value changes were caused by the decrease of underlying futures prices. SCHATZ Futures and 4th Euribor Futures remained long position for the whole month, while BOBL and BUND Futures was risk off for several days in the middle of the month. For US Treasury Futures, Euro Dollar Futures and 1st, 2nd and 3rd Euribor Futures , no signal changed during this month and they kept zero positions.
For more information regarding this index, please contact the European Rates Structuring team at

13 October 2016
Systematic Alpha Monthly 44
Liquid Alternative Beta
Liquid Alternative Beta
Asset Class: Hybrid BBG Ticker: CSLAB
Strategy Overview
The Credit Suisse Liquid Alternative Beta Index reflects the return of a dynamic basket of liquid,
investable market factors selected and weighted in accordance with an algorithm that aims to
approximate the aggregate returns of the universe of hedge fund managers as represented by the
Credit Suisse Hedge Fund Index. The algorithm has been determined by an index committee,
taking into consideration extensive quantitative research into alternative beta. It benefits from
accurate daily valuations with objective and transparent rules-based construction.
Cumulative Index Performance Performance Summary
90
100
110
120
130
140
150
Jan-07 Jan-09 Jan-11 Jan-13 Jan-15
Live date: December 2009
Sept 2016 YTD
Last 12-Mo.
Since Live
Return 0.45% 3.62% 4.16% 3.76%
Volatility 3.92% 5.62%
Sharpe Ratio 0.95 0.62
Draw dow n 5.91% 10.40%
Weekly Correlation with Benchmarks
Last 12 months
MSCI World 86.4%
-27.5%
49.4%
CS Global Govt Bond Index
S&P GSCI
Source: Credit Suisse; Data as of 09/30/2016 Source: Credit Suisse; Data as of 09/30/2016
Monthly Return
Jan Feb Mar Apr May Jun Jul Aug Sep Oct Nov Dec
2007 1.1% 1.2% 1.9% 2.5% 1.0% -0.2% -0.6% 0.4% 3.8% 3.0% -2.4% 0.3%
2008 -3.9% 2.6% 0.0% 2.0% 1.2% -1.1% -0.6% -0.9% -6.5% -7.6% -0.7% 3.5%
2009 1.2% -0.6% 2.2% 1.1% 2.1% 1.0% 2.0% 0.7% 1.7% -0.4% 0.6% 0.8%
2010 0.0% 0.8% 1.0% 1.1% -2.6% -0.4% 3.1% -1.1% 3.6% 1.1% -1.3% 2.8%
2011 0.2% 1.6% 1.3% 1.8% -0.9% -0.6% -0.9% -3.4% -3.6% 4.2% -0.4% 0.9%
2012 1.3% 1.7% -0.8% -0.3% -2.3% 1.4% 0.9% 0.5% 0.6% -0.6% -0.2% 1.1%
2013 1.1% -0.2% 1.2% 1.1% 0.0% -1.1% 1.7% -1.0% 1.4% 1.7% 0.8% 0.5%
2014 -0.9% 1.5% 0.3% 0.1% 0.6% 0.6% -1.3% 1.8% -0.9% 0.6% 1.4% -0.3%
2015 -0.3% 2.6% 0.3% -0.4% 0.8% -2.0% 1.4% -2.2% -1.4% 2.7% -0.6% -1.5%
2016 -1.4% 0.1% 1.2% 0.1% 0.5% 0.7% 1.4% 0.6% 0.5%
Source: Credit Suisse; Bloomberg, Data as of 09/30/2016
September 2016 Performance Commentary
The Credit Suisse Liquid Alternative Beta Index was up 0.45% for the month of September, mainly due to its long high yield credit, currency carry and Nasdaq 100 exposure. Within Event Driven, the Russell 2000 position was removed and exposure to the Merger Arbitrage strategy and high yield credit increased slightly. Within Long/Short, the short MSCI Emerging Markets and Materials positions were removed, while short S&P 500 and Russell 2000 positions have been added. Within Global Strategies, positions remained relatively unchanged.
For more information regarding this index, please contact the Equities SIS Product Management
team at [email protected] or [email protected].

13 October 2016
Systematic Alpha Monthly 45
Long/Short Liquid Index
Asset Class: Equities BBG Ticker: CSLABLS
Strategy Overview
The Credit Suisse Long/Short Liquid Index reflects the return of a dynamic basket of liquid,
investable market factors selected and weighted in accordance with an algorithm that aims to
track the performance of the Credit Suisse Long/Short Equity Hedge Fund Index by allocating
weights to non-hedge fund, transparent market factors. The algorithm has been determined by an
index committee, taking into consideration extensive quantitative research into systematic ways of
achieving certain risk/return profiles by using alternative investing techniques. The index is
calculated daily by the NYSE and benefits from objective and transparent rules-based
construction.
Cumulative Index Performance Performance Summary
80
100
120
140
Jan-07 Jan-09 Jan-11 Jan-13 Jan-15
Live date: April 2008
Sept 2016 YTD
Last 12-Mo.
Since Live
Return 0.46% -1.07% 2.99% 4.09%
Volatility 5.79% 9.14%
Sharpe Ratio 0.44 0.40
Draw dow n 5.72% 24.85%
Weekly Correlation with Benchmarks
Last 12 months
MSCI World 54.6%
-30.0%
6.7%
CS Global Govt Bond Index
S&P GSCI
Source: Credit Suisse; Data as of 09/30/2016 Source: Credit Suisse; Data as of 09/30/2016
Monthly Return
Jan Feb Mar Apr May Jun Jul Aug Sep Oct Nov Dec
2007 0.5% 1.9% 2.4% 3.1% 1.3% 0.0% -0.4% 0.0% 4.8% 2.4% -1.7% -1.8%
2008 -7.8% 2.9% 0.0% 3.4% 0.5% -2.6% -0.3% -0.5% -7.1% -9.0% -0.2% 2.5%
2009 1.1% -1.1% 3.5% 0.8% 3.6% 0.0% 2.1% 1.6% 1.1% 0.2% -0.7% 1.2%
2010 -1.5% 1.0% 3.6% 1.4% -3.7% -1.9% 3.3% -2.1% 5.4% 2.4% -1.1% 2.5%
2011 0.7% 1.7% 1.2% 2.9% -0.9% -0.4% -1.7% -3.7% -4.4% 5.9% -0.5% 0.0%
2012 2.6% 2.3% -0.1% -1.1% -3.6% 1.3% 0.4% 2.0% 1.3% -2.0% -0.3% 1.4%
2013 -0.9% -1.0% 1.6% 2.4% 0.5% -1.5% 3.6% -1.1% 1.3% 2.2% 0.5% 0.2%
2014 -1.8% 1.5% 0.6% 0.7% 1.8% 0.9% -0.5% 2.3% -0.9% 2.0% 2.1% -0.5%
2015 -1.2% 2.5% 0.2% -0.5% 1.3% -1.3% 4.7% -1.3% -0.8% 3.6% 0.2% 0.1%
2016 -2.4% -0.8% 0.1% -1.9% 1.6% -1.1% 2.4% 0.6% 0.5%
Source: Credit Suisse; Bloomberg, Data as of 09/30/2016
September 2016 Performance Commentary
The Credit Suisse Long/Short Liquid Index was up 0.46% for the month of September, mainly due to long technology and MSCI EAFE exposure, while short exposure to US large-cap equities took back some gains. At the mid-month rebalance, the short MSCI Emerging Markets and Materials positions were removed, while short S&P 500 and Russell 2000 positions have been added.
For more information regarding this index, please contact the Equities SIS Product Management
team at [email protected] or [email protected].

13 October 2016
Systematic Alpha Monthly 46
Event-Driven Liquid Index
Asset Class: Hybrid BBG Ticker: CSLABED
Strategy Overview
The Credit Suisse Event-Driven Liquid Index reflects the return of a dynamic basket of liquid,
investable market factors selected and weighted in accordance with an algorithm that aims to
approximate the aggregate returns of the universe of event-driven hedge fund managers. The
algorithm has been determined by an index committee, taking into consideration quantitative
research into alternative beta. The index benefits from daily valuations with objective and
transparent rules-based construction.
Cumulative Index Performance Performance Summary
80
100
120
140
160
Jan-07 Jan-09 Jan-11 Jan-13 Jan-15
Live date: December 2009
Sept 2016 YTD
Last 12-Mo.
Since Live
Return 0.38% 8.28% 6.77% 5.37%
Volatility 7.64% 8.17%
Sharpe Ratio 0.83 0.62
Draw dow n 13.03% 17.51%
Weekly Correlation with Benchmarks
Last 12 months
MSCI World 81.8%
-22.6%
63.6%
CS Global Govt Bond Index
S&P GSCI
Source: Credit Suisse; Data as of 09/30/2016 Source: Credit Suisse; Data as of 09/30/2016
Monthly Return
Jan Feb Mar Apr May Jun Jul Aug Sep Oct Nov Dec
2007 1.5% 1.0% 0.6% 1.4% 1.4% -1.3% -3.6% 1.6% 3.2% 2.9% -2.5% 2.8%
2008 -2.3% 1.6% -0.4% 1.9% 1.9% -1.2% -0.3% 0.3% -7.7% -8.5% -1.5% 3.3%
2009 0.9% -0.6% 1.8% 1.4% 0.6% 1.6% 2.2% 0.4% 2.1% -0.9% 1.1% 1.9%
2010 0.9% 0.5% 2.2% 0.9% -3.2% 0.4% 4.2% -1.8% 4.7% 2.2% -1.3% 3.5%
2011 1.2% 2.1% 1.0% 1.4% -0.4% -1.4% -1.1% -4.6% -5.1% 7.8% -1.6% 1.8%
2012 2.1% 2.2% -1.2% 0.7% -3.8% 4.8% 0.9% 1.4% 0.9% 0.9% 0.4% 1.5%
2013 1.6% 0.2% 1.6% 0.9% 0.2% -1.8% 2.6% -1.5% 2.6% 2.4% 0.8% 0.8%
2014 0.2% 2.3% 0.4% -0.2% -0.1% 0.6% -2.2% 1.2% -2.0% 0.3% 0.0% -1.2%
2015 -0.2% 4.2% -1.3% 1.4% 0.2% -2.2% -1.1% -2.9% -3.7% 4.8% -2.9% -3.1%
2016 -2.2% 0.3% 4.3% 1.6% 0.0% 0.4% 2.0% 1.4% 0.4%
Source: Credit Suisse; Bloomberg, Data as of 09/30/2016
September 2016 Performance Commentary
The Credit Suisse Event Driven Liquid Index was up 0.38% for the month of September, mainly due to long high yield credit exposure. At the mid-month rebalance, the Russell 2000 position was removed and exposure to the Merger Arbitrage strategy and high yield credit increased slightly.
For more information regarding this index, please contact the Equities SIS Product Management
team at [email protected] or [email protected].

13 October 2016
Systematic Alpha Monthly 47
Merger Arbitrage Liquid Index
Asset Class: Equities BBG Ticker: CSLABMA
Strategy Overview
The Credit Suisse Merger Arbitrage Liquid Index aims to gain broad exposure to the merger
arbitrage strategy using a pre-defined quantitative methodology to gain exposure to a liquid,
diversified, and broadly representative set of announced merger deals in accordance with index
rules. The algorithm has been determined by an index committee, taking into consideration
quantitative research into alternative beta. The index benefits from daily valuations with objective
and transparent rules-based construction.
Cumulative Index Performance Performance Summary
90
100
110
120
130
Jan-07 Jan-09 Jan-11 Jan-13 Jan-15
Live date: December 2009
Sept 2016 YTD
Last 12-Mo.
Since Live
Return 0.34% -1.23% 0.72% 1.51%
Volatility 4.18% 4.33%
Sharpe Ratio 0.06 0.28
Draw dow n 4.43% 8.94%
Weekly Correlation with Benchmarks
Last 12 months
MSCI World 34.7%
-4.1%
17.8%
CS Global Govt Bond Index
S&P GSCI
Source: Credit Suisse; Data as of 09/30/2016 Source: Credit Suisse; Data as of 09/30/2016
Monthly Return
Jan Feb Mar Apr May Jun Jul Aug Sep Oct Nov Dec
2007 2.1% 0.8% 1.1% 1.2% 1.3% -0.3% -1.0% 1.3% 1.8% 1.8% -2.0% 0.0%
2008 -1.1% 1.2% 0.0% 1.6% 1.5% -0.8% 0.3% 0.3% -6.7% -5.1% 0.0% 1.3%
2009 -0.8% 0.5% 2.9% 0.0% 0.6% 0.6% 0.7% 0.5% 1.2% -1.1% 2.0% 0.0%
2010 1.2% 0.1% 0.9% 0.4% -0.8% 2.1% 1.9% -0.4% 2.0% 0.6% -2.4% 2.3%
2011 1.7% 0.7% 1.4% 1.2% 0.2% -0.7% -0.8% -0.8% -0.8% 1.5% 0.4% -0.8%
2012 0.5% 0.1% -0.3% -0.3% -1.7% -0.8% 0.5% -0.1% -0.9% -1.4% 0.9% 1.2%
2013 2.3% 0.0% 2.3% -0.5% 1.3% -0.9% 1.2% -0.1% 1.0% -0.4% 0.3% 0.1%
2014 -0.9% 1.3% -0.7% -0.7% -1.6% -0.1% 0.1% -1.6% -1.1% -1.7% 1.2% -0.4%
2015 -0.3% 1.0% -0.9% 1.8% -0.1% -0.2% -0.8% -0.4% -0.1% 1.6% -1.1% 1.4%
2016 0.4% 0.3% 1.5% -1.4% -0.8% -1.0% -0.2% -0.4% 0.3%
Source: Credit Suisse, Bloomberg; Data as of 09/30/2016
September 2016 Performance Commentary
The Credit Suisse Merger Arbitrage Liquid Index was up 0.34% for the month of September. The top positive deal contributor to the Credit Suisse Merger Arbitrage Liquid Index (the “Index”) in September was the Apex Technology Co Ltd acquisition of Lexmark International Inc, which added 0.18% to Index performance. On 04/19/16, Lexmark International Inc had agreed to be acquired by Apex Technology Co Ltd, PAG, and Legend Capital Management Ltd for USD 40.50 per share. At the time of announcement, this was the third largest acquisition on record of targeting U.S. companies in April, 2016. The Midea Group Co Ltd acquisition of Kuka AG subtracted 0.20% from Index performance. On 05/18/2016, Midea Group Co Ltd announced its intention to takeover Kuka AG for EUR 115.00 per share. At the time of announcement, this is Midea's biggest foreign acquisition on record. Midea Group Co Ltd might purchase an additional stake in Kuka AG over 30% giving the company a value of USD 5,000.00M per WSJ on 05/17/2016.
For more information regarding this index, please contact the Equities SIS Product Management
team at [email protected] or [email protected].

13 October 2016
Systematic Alpha Monthly 48
Managed Futures Liquid Index
Asset Class: Hybrid BBG Ticker: CSLABMF
Strategy Overview
The Credit Suisse Managed Futures Liquid Index is a long/short momentum strategy that trades
futures across asset classes based on short- and long-term moving averages while targeting 10%
portfolio volatility. The strategy focuses on four asset classes (equities, fixed income, commodities,
and currencies) frequently traded by managed futures funds.
Cumulative Index Performance Performance Summary
80
100
120
140
160
180
Jan-07 Jan-09 Jan-11 Jan-13 Jan-15
Live date: January 2011
Sept 2016 YTD
Last 12-Mo.
Since Live
Return 0.45% 4.09% 1.85% 3.40%
Volatility 9.31% 9.79%
Sharpe Ratio 0.15 0.32
Draw dow n 7.04% 16.83%
Weekly Correlation with Benchmarks
Last 12 months
MSCI World -46.8%
53.8%
-41.1%
CS Global Govt Bond Index
S&P GSCI
Source: Credit Suisse; Data as of 09/30/2016 Source: Credit Suisse; Data as of 09/30/2016
Monthly Return
Jan Feb Mar Apr May Jun Jul Aug Sep Oct Nov Dec
2007 0.5% -0.7% -0.4% 5.0% 2.4% 2.1% -4.1% -2.9% 5.0% 4.7% -2.0% 0.1%
2008 5.8% 6.9% -1.1% -5.0% 0.2% 2.6% -4.2% 0.7% 3.3% 8.0% 3.5% 1.2%
2009 -0.1% 0.6% -1.1% -1.7% 1.6% -2.6% 1.2% 0.2% 2.1% -1.3% 4.4% -2.1%
2010 -3.9% 0.7% 2.2% 0.3% 1.2% 0.5% -2.4% 2.9% 0.9% 3.5% -4.6% 4.1%
2011 0.2% 1.0% -3.6% 3.0% -3.5% -3.1% 3.1% 0.1% 2.0% -4.2% 0.4% 0.1%
2012 -0.3% 0.9% -1.4% -1.2% 2.5% -5.6% 1.4% -1.5% -1.3% -2.4% -0.7% 1.6%
2013 2.2% 0.1% 1.5% 2.0% -0.4% 0.7% -1.2% -0.8% -0.3% -0.5% 3.1% 1.0%
2014 -3.4% -0.4% -1.2% 0.2% 0.5% 0.0% 0.2% 3.2% 4.3% 1.1% 7.2% 3.5%
2015 8.2% -1.3% 4.3% -4.0% 0.8% -4.5% 2.6% -1.7% 2.3% -3.9% 2.1% -0.7%
2016 3.3% 3.0% -1.5% 0.6% -3.0% 3.9% 0.0% -2.5% 0.5%
Source: Credit Suisse; Bloomberg, Data as of 09/30/2016
September 2016 Performance Commentary
The Credit Suisse Managed Futures Liquid Index was up 0.45% for the month of September.
Currency positions added the most to performance, particularly the long exposure to the
Japanese Yen and Australian Dollar vs. the US Dollar. Equities also added to performance overall,
helped by long Hang Seng and FTSE 100 positions. Commodities were flat overall, with gains
from long metals positions being mostly offset by the losses in the long agriculture position. Fixed
Income subtracted from performance, with long exposure to 10yr UK Bonds dragging the asset
class performance down the most.
For more information regarding this index, please contact the Equities SIS Product Management
team at [email protected] or [email protected].

13 October 2016
Systematic Alpha Monthly 49
Global Strategies Liquid Index
Asset Class: Hybrid BBG Ticker: CSLABGS
Strategy Overview
The Credit Suisse Global Strategies Liquid Index reflects the return of a dynamic basket of liquid,
investable market factors selected and weighted in accordance with an algorithm that aims to
approximate the aggregate returns of those hedge funds which are not classified as Long/Short
Equity or Event Driven.
Cumulative Index Performance Performance Summary
80
100
120
140
Jan-07 Jan-09 Jan-11 Jan-13 Jan-15
Live date: January 2011
Sept 2016 YTD
Last 12-Mo.
Since Live
Return 0.47% 3.02% 3.49% 1.86%
Volatility 3.01% 4.60%
Sharpe Ratio 1.01 0.34
Draw dow n 3.19% 8.70%
Weekly Correlation with Benchmarks
Last 12 months
MSCI World 67.6%
-20.6%
25.7%
CS Global Govt Bond Index
S&P GSCI
Source: Credit Suisse; Data as of 09/30/2016 Source: Credit Suisse; Data as of 09/30/2016
Monthly Return
Jan Feb Mar Apr May Jun Jul Aug Sep Oct Nov Dec
2007 0.9% 0.4% 1.1% 1.9% 0.9% 0.5% -0.5% -1.4% 2.7% 2.4% -1.3% 0.8%
2008 -4.3% 2.6% 0.1% 1.7% 1.9% -1.0% -0.9% -2.8% -8.0% -7.3% -0.7% 2.7%
2009 -1.4% -1.1% 3.2% 1.0% 1.9% 1.8% 2.9% 1.7% 2.3% -0.4% 1.2% 1.3%
2010 -0.8% 0.7% 2.8% 1.1% -5.2% -0.6% 2.1% -1.7% 5.2% 2.8% -0.9% 3.4%
2011 0.6% 1.9% -0.3% 1.9% -1.1% -0.3% -0.6% -2.7% -2.8% 2.2% 0.1% 0.9%
2012 0.6% 1.4% -0.9% -0.4% -1.4% 0.1% 1.0% -0.2% 0.2% -0.9% -0.5% 0.9%
2013 1.4% -0.1% 1.0% 0.9% -0.2% -0.7% 0.8% -0.8% 0.9% 1.2% 0.8% 0.4%
2014 -1.2% 1.2% 0.2% 0.1% 0.6% 0.5% -1.1% 2.0% -0.4% 0.3% 1.8% 0.2%
2015 -0.1% 2.0% 1.0% -1.1% 1.0% -2.2% 1.7% -2.2% -0.5% 1.4% 0.2% -1.1%
2016 -0.7% 0.3% 0.1% -0.1% 0.3% 1.4% 0.9% 0.2% 0.5%
Source: Credit Suisse; Bloomberg, Data as of 09/30/2016
September 2016 Performance Commentary
The Credit Suisse Global Strategies Liquid Index was up 0.47% for the month of September, mainly due to long currency carry exposure. At the mid-month rebalance, positions remained relatively unchanged
For more information regarding this index, please contact the Equities SIS Product Management
team at [email protected] or [email protected].

GLOBAL INDEX & ALPHA STRATEGIES
Baldwin Smith
Group Head
+1 212 325 5524
NEW YORK
Antony Arenas Peter Han Haresh Hingorani
+1 212 325 1112 +1 212 325 5754 +1 212 325 9019
[email protected] [email protected] [email protected]
Young Kim Sherry Li Shonan Noronha
+1 212 538 3766 +1 212 538 2585 +1 212 325 0918
[email protected] [email protected] [email protected]
Samarth Sanghavi Yongchu Song, Ph.D Steven Tang, Ph.D
+1 212 538 4341 +1 212 538 7013 +1 212 538 0339
[email protected] [email protected] [email protected]
Olivia Zhong
+1 212 538 4328
LONDON
Varin Wimalasena Daniela Toro Ghassane Bentahar
+44 20 7883 8369 +44 20 7883 3875 +44 20 7888 3196
[email protected] [email protected] [email protected]
SINGAPORE
Yoon May Choong Dian Hong Chua
+65 6212 4346 +65 6306 0182

Disclosure Appendix
Analyst Certification The analysts identified in this report each certify, with respect to the companies or securities that the individual analyzes, that (1) the views expressed in this report accurately reflect his or her personal views about all of the subject companies and securities and (2) no part of his or her compensation was, is or will be directly or indirectly related to the specific recommendations or views expressed in this report.
Important Disclosures Credit Suisse's policy is only to publish investment research that is impartial, independent, clear, fair and not misleading. For more detail, please refer to Credit Suisse's Policies for Managing Conflicts of Interest in connection with Investment Research: http://www.csfb.com/research-and-analytics/disclaimer/managing_conflicts_disclaimer.html . Credit Suisse's policy is to publish research reports as it deems appropriate, based on developments with the subject issuer, the sector or the market that may have a material impact on the research views or opinions stated herein. The analyst(s) involved in the preparation of this research report received compensation that is based upon various factors, including Credit Suisse's total revenues, a portion of which are generated by Credit Suisse's Investment Banking and Fixed Income Divisions. Credit Suisse may trade as principal in the securities or derivatives of the issuers that are the subject of this report. At any point in time, Credit Suisse is likely to have significant holdings in the securities mentioned in this report. As at the date of this report, Credit Suisse acts as a market maker or liquidity provider in the debt securities of the subject issuer(s) mentioned in this report. For important disclosure information on securities recommended in this report, please visit the website at https://rave.credit-suisse.com/disclosures/view/fixedincome or call +1-212-538-7625. For the history of trade ideas suggested by the Fixed Income Research department over the previous 12 months, please view the document at https://plus.credit-suisse.com/r/aaCzfz . Credit Suisse clients with access to the Locus website may refer to http://www.credit-suisse.com/locus . For the history of trade ideas suggested by Emerging Markets Strategy Research, please see the latest Emerging Markets Fixed Income Views report on Credit Suisse PLUS . For the history of recommendations provided by Technical Analysis, please visit the website at https://plus.credit-suisse.com/ECP_S/app/container.html#loc=/MENU_FI_ECON_TECHNICAL_ANALYSIS . Credit Suisse does not provide any tax advice. Any statement herein regarding any US federal tax is not intended or written to be used, and cannot be used, by any taxpayer for the purposes of avoiding any penalties. For a history of recommendations for the financial instrument(s) featured in this report, disseminated within the past 12 months, please refer to https://rave.credit-suisse.com/disclosures/view/reportfi?i=197092&v=-46419h19nua7opli5adcu63qr . This research report is authored by: Credit Suisse Securities (USA) LLC ........................................................ Baldwin Smith ; Yongchu Song ; Sherry Li ; Olivia Zhong ; Steven Tang
Structured Securities, Derivatives, Options, and Futures Disclaimer General risks: Structured securities, derivatives, options (OTC and listed), and futures (including, but not limited to, commodity, foreign exchange, and security futures) are complex instruments that are not suitable for every investor, may involve a high degree of risk, may be highly illiquid, and may be appropriate investments only for sophisticated investors who are capable of understanding and assuming the risks involved. There is a risk of unlimited, total, or significant loss resulting from the use of these instruments for trading and investment. Before entering into any transaction involving these instruments, you should ensure that you fully understand their potential risks and rewards and independently determine that they are appropriate for you given your objectives, experience, financial and operational resources, and other relevant circumstances. For options, please ensure that you have read the Options Clearing Corporation's disclosure document, available at: http://www.optionsclearing.com/publications/risks/riskchap1.jsp. Risk of losses on options: The maximum potential loss on buying a call or put option is the loss of total premium paid. The maximum potential loss on selling a call option is unlimited. The maximum potential loss on selling a put option is substantial and may exceed the premium received by a significant amount. There are many other options combinations that entail significant risks and transaction costs: you should ensure they are appropriate for your situation and that you understand the risks. Risk of losses on futures: The maximum potential loss on buying a futures contract is substantial (the loss of the value of the contract) and can be amplified by leverage. The maximum potential loss on selling a futures contract is unlimited. OTC options and other derivatives: In discussions of OTC options and other derivatives, the results and risks are based solely on the hypothetical examples cited; actual results and risks will vary depending on specific circumstances. Investors are urged to consider carefully whether these products, as well as the products or strategies discussed herein, are suitable to their needs. While some OTC markets may be liquid, transactions in OTC derivatives may involve greater risk than investments in exchange-listed derivatives because there is no exchange market on which to liquidate a position and it may be very difficult to assess the value of the position because bid and offer prices need not be quoted. Structured products: These products often have a derivative component. As a result, they carry not only the risk of loss of principal, but also the possibility that at expiration the investor will own the reference asset at a depressed price. Even if a structured product is listed on an exchange, active and liquid trading markets may not develop and the structured product may be thinly traded. Taxation: Because of the importance of tax considerations for many option and other derivative transactions, investors considering these products should consult with their tax advisors as to how taxes affect the outcome of contemplated options or other derivatives transactions. You should consult with such tax, accounting, legal or other advisors as you deem necessary to assist you in making these determinations. Transaction costs: Such costs may be significant in option strategies calling for multiple purchases and sales of options and other derivatives, such as spreads and straddles. Commissions and transaction costs may be a factor in actual returns realized by the investor and should be taken into consideration. Trading on margin: Margin requirements vary and should be determined before investing as they can impact your profit potential. If the market moves against your position, you may be called upon by your broker to deposit a substantial amount of additional margin funds, on short notice, in order to maintain your position. If you do not provide the required funds within the time required by your broker, your position may be liquidated at a loss, and you will be liable for any resulting deficit in your account. Further information: Supporting documentation for any claims, comparisons, recommendations, statistics or other technical data in this material will be supplied upon request. Any trade information is preliminary and not intended as an official transaction confirmation. If you have any questions about whether you are eligible to enter into these transactions with Credit Suisse, please contact your sales representative.

Important MSCI Disclosures The MSCI sourced information is the exclusive property of Morgan Stanley Capital International Inc. (MSCI). Without prior written permission of MSCI, this information and any other MSCI intellectual property may not be reproduced, re-disseminated or used to create and financial products, including any indices. This information is provided on an "as is" basis. The user assumes the entire risk of any use made of this information. MSCI, its affiliates and any third party involved in, or related to, computing or compiling the information hereby expressly disclaim all warranties of originality, accuracy, completeness, merchantability or fitness for a particular purpose with respect to any of this information. Without limiting any of the foregoing, in no event shall MSCI, any of its affiliates or any third party involved in, or related to, computing or compiling the information have any liability for any damages of any kind. MSCI, Morgan Stanley Capital International and the MSCI indexes are services marks of MSCI and its affiliates. The Global Industry Classification Standard (GICS) was developed by and is the exclusive property of Morgan Stanley Capital International Inc. and Standard & Poor’s. GICS is a service mark of MSCI and S&P and has been licensed for use by Credit Suisse.
Important Credit Suisse HOLT Disclosures With respect to the analysis in this report based on the Credit Suisse HOLT methodology, Credit Suisse certifies that (1) the views expressed in this report accurately reflect the Credit Suisse HOLT methodology and (2) no part of the Firm’s compensation was, is, or will be directly related to the specific views disclosed in this report. The Credit Suisse HOLT methodology does not assign ratings to a security. It is an analytical tool that involves use of a set of proprietary quantitative algorithms and warranted value calculations, collectively called the Credit Suisse HOLT valuation model, that are consistently applied to all the companies included in its database. Third-party data (including consensus earnings estimates) are systematically translated into a number of default algorithms available in the Credit Suisse HOLT valuation model. The source financial statement, pricing, and earnings data provided by outside data vendors are subject to quality control and may also be adjusted to more closely measure the underlying economics of firm performance. The adjustments provide consistency when analyzing a single company across time, or analyzing multiple companies across industries or national borders. The default scenario that is produced by the Credit Suisse HOLT valuation model establishes the baseline valuation for a security, and a user then may adjust the default variables to produce alternative scenarios, any of which could occur. Additional information about the Credit Suisse HOLT methodology is available on request. The Credit Suisse HOLT methodology does not assign a price target to a security. The default scenario that is produced by the Credit Suisse HOLT valuation model establishes a warranted price for a security, and as the third-party data are updated, the warranted price may also change. The default variable may also be adjusted to produce alternative warranted prices, any of which could occur. CFROI®, HOLT, HOLTfolio, ValueSearch, AggreGator, Signal Flag and “Powered by HOLT” are trademarks or service marks or registered trademarks or registered service marks of Credit Suisse or its affiliates in the United States and other countries. HOLT is a corporate performance and valuation advisory service of Credit Suisse.
Backtested, Hypothetical or Simulated Performance Results Backtested, hypothetical or simulated performance results have inherent limitations, some of which are described below. Unlike an actual performance record based on trading actual client portfolios, backtested, hypothetical or simulated results are achieved by means of the retroactive application of a backtested model itself designed with the benefit of hindsight. Backtested performance does not reflect the impact that material economic or market factors might have on an adviser's decision-making process if the adviser were actually managing a client’s portfolio. The backtesting of performance differs from actual account performance because the investment strategy may be adjusted at any time, for any reason, and can continue to be changed until desired or better performance results are achieved. The backtested performance includes hypothetical results that do not reflect the reinvestment of dividends and other earnings or the deduction of advisory fees, brokerage or other commissions, and any other expenses that a client would have paid or actually paid. No representation is made that any account will or is likely to achieve profits or losses similar to those shown. Alternative modeling techniques or assumptions might produce significantly different results and prove to be more appropriate. Past hypothetical backtest results are neither an indicator nor guarantee of future returns. In fact, there are frequently sharp differences between hypothetical performance results and the actual results subsequently achieved. Actual results will vary, perhaps materially, from the analysis. In addition, hypothetical trading does not involve financial risk, and no hypothetical trading record can completely account for the impact of financial risk in actual trading. For example, the ability to withstand losses or to adhere to a particular trading program in spite of trading losses are material points which can also adversely affect actual trading results. There are numerous other factors related to the markets in general or to the implementation of any specific trading program which cannot be fully accounted for in the preparation of hypothetical performance results and all of which can adversely affect actual trading results. As a sophisticated investor, you accept and agree to use such information only for the purpose of discussing with Credit Suisse your preliminary interest in investing in the strategy described herein.

This report is produced by subsidiaries and affiliates of Credit Suisse operating under its Global Markets Division. For more information on our structure, please use the following link: https://www.credit-suisse.com/who-we-are This report may contain material that is not directed to, or intended for distribution to or use by, any person or entity who is a citizen or resident of or located in any locality, state, country or other jurisdiction where such distribution, publication, availability or use would be contrary to law or regulation or which would subject Credit Suisse or its affiliates ("CS") to any registration or licensing requirement within such jurisdiction. All material presented in this report, unless specifically indicated otherwise, is under copyright to CS. None of the material, nor its content, nor any copy of it, may be altered in any way, transmitted to, copied or distributed to any other party, without the prior express written permission of CS. All trademarks, service marks and logos used in this report are trademarks or service marks or registered trademarks or service marks of CS or its affiliates.The information, tools and material presented in this report are provided to you for information purposes only and are not to be used or considered as an offer or the solicitation of an offer to sell or to buy or subscribe for securities or other financial instruments. CS may not have taken any steps to ensure that the securities referred to in this report are suitable for any particular investor. CS will not treat recipients of this report as its customers by virtue of their receiving this report. The investments and services contained or referred to in this report may not be suitable for you and it is recommended that you consult an independent investment advisor if you are in doubt about such investments or investment services. Nothing in this report constitutes investment, legal, accounting or tax advice, or a representation that any investment or strategy is suitable or appropriate to your individual circumstances, or otherwise constitutes a personal recommendation to you. CS does not advise on the tax consequences of investments and you are advised to contact an independent tax adviser. Please note in particular that the bases and levels of taxation may change. Information and opinions presented in this report have been obtained or derived from sources believed by CS to be reliable, but CS makes no representation as to their accuracy or completeness. CS accepts no liability for loss arising from the use of the material presented in this report, except that this exclusion of liability does not apply to the extent that such liability arises under specific statutes or regulations applicable to CS. This report is not to be relied upon in substitution for the exercise of independent judgment. CS may have issued, and may in the future issue, other communications that are inconsistent with, and reach different conclusions from, the information presented in this report. Those communications reflect the different assumptions, views and analytical methods of the analysts who prepared them and CS is under no obligation to ensure that such other communications are brought to the attention of any recipient of this report. Some investments referred to in this report will be offered solely by a single entity and in the case of some investments solely by CS, or an associate of CS or CS may be the only market maker in such investments. Past performance should not be taken as an indication or guarantee of future performance, and no representation or warranty, express or implied, is made regarding future performance. Information, opinions and estimates contained in this report reflect a judgment at its original date of publication by CS and are subject to change without notice. The price, value of and income from any of the securities or financial instruments mentioned in this report can fall as well as rise. The value of securities and financial instruments is subject to exchange rate fluctuation that may have a positive or adverse effect on the price or income of such securities or financial instruments. Investors in securities such as ADR's, the values of which are influenced by currency volatility, effectively assume this risk. Structured securities are complex instruments, typically involve a high degree of risk and are intended for sale only to sophisticated investors who are capable of understanding and assuming the risks involved. The market value of any structured security may be affected by changes in economic, financial and political factors (including, but not limited to, spot and forward interest and exchange rates), time to maturity, market conditions and volatility, and the credit quality of any issuer or reference issuer. Any investor interested in purchasing a structured product should conduct their own investigation and analysis of the product and consult with their own professional advisers as to the risks involved in making such a purchase. Some investments discussed in this report may have a high level of volatility. High volatility investments may experience sudden and large falls in their value causing losses when that investment is realised. Those losses may equal your original investment. Indeed, in the case of some investments the potential losses may exceed the amount of initial investment and, in such circumstances, you may be required to pay more money to support those losses. Income yields from investments may fluctuate and, in consequence, initial capital paid to make the investment may be used as part of that income yield. Some investments may not be readily realisable and it may be difficult to sell or realise those investments, similarly it may prove difficult for you to obtain reliable information about the value, or risks, to which such an investment is exposed. This report may provide the addresses of, or contain hyperlinks to, websites. Except to the extent to which the report refers to website material of CS, CS has not reviewed any such site and takes no responsibility for the content contained therein. Such address or hyperlink (including addresses or hyperlinks to CS's own website material) is provided solely for your convenience and information and the content of any such website does not in any way form part of this document. Accessing such website or following such link through this report or CS's website shall be at your own risk.
This report is issued and distributed in European Union (except Switzerland): by Credit Suisse Securities (Europe) Limited, One Cabot Square, London E14 4QJ, England, which is authorised by the Prudential Regulation Authority and regulated by the Financial Conduct Authority and the Prudential Regulation Authority. Germany: Credit Suisse Securities (Europe) Limited Niederlassung Frankfurt am Main regulated by the Bundesanstalt fuer Finanzdienstleistungsaufsicht ("BaFin"). United States and Canada: Credit Suisse Securities (USA) LLC; Switzerland: Credit Suisse AG; Brazil: Banco de Investimentos Credit Suisse (Brasil) S.A or its affiliates; Mexico: Banco Credit Suisse (México), S.A. (transactions related to the securities mentioned in this report will only be effected in compliance with applicable regulation); Japan: by Credit Suisse Securities (Japan) Limited, Financial Instruments Firm, Director-General of Kanto Local Finance Bureau ( Kinsho) No. 66, a member of Japan Securities Dealers Association, The Financial Futures Association of Japan, Japan Investment Advisers Association, Type II Financial Instruments Firms Association; Hong Kong: Credit Suisse (Hong Kong) Limited; Australia: Credit Suisse Equities (Australia) Limited; Thailand: Credit Suisse Securities (Thailand) Limited, regulated by the Office of the Securities and Exchange Commission, Thailand, having registered address at 990 Abdulrahim Place, 27th Floor, Unit 2701, Rama IV Road, Silom, Bangrak, Bangkok10500, Thailand, Tel. +66 2614 6000; Malaysia: Credit Suisse Securities (Malaysia) Sdn Bhd, Credit Suisse AG, Singapore Branch; India: Credit Suisse Securities (India) Private Limited (CIN no.U67120MH1996PTC104392) regulated by the Securities and Exchange Board of India as Research Analyst (registration no. INH 000001030) and as Stock Broker (registration no. INB230970637; INF230970637; INB010970631; INF010970631), having registered address at 9th Floor, Ceejay House, Dr.A.B. Road, Worli, Mumbai - 18, India, T- +91-22 6777 3777; South Korea: Credit Suisse Securities (Europe) Limited, Seoul Branch; Taiwan: Credit Suisse AG Taipei Securities Branch; Indonesia: PT Credit Suisse Securities Indonesia; Philippines: Credit Suisse Securities (Philippines ) Inc., and elsewhere in the world by the relevant authorised affiliate of the above. Additional Regional Disclaimers Hong Kong: Credit Suisse (Hong Kong) Limited ("CSHK") is licensed and regulated by the Securities and Futures Commission of Hong Kong under the laws of Hong Kong, which differ from Australian laws. CSHKL does not hold an Australian financial services licence (AFSL) and is exempt from the requirement to hold an AFSL under the Corporations Act 2001 (the Act) under Class Order 03/1103 published by the ASIC in respect of financial services provided to Australian wholesale clients (within the meaning of section 761G of the Act). Research on Taiwanese securities produced by Credit Suisse AG, Taipei Securities Branch has been prepared by a registered Senior Business Person. Malaysia: Research provided to residents of Malaysia is authorised by the Head of Research for Credit Suisse Securities (Malaysia) Sdn Bhd, to whom they should direct any queries on +603 2723 2020. Singapore: This report has been prepared and issued for distribution in Singapore to institutional investors, accredited investors and expert investors (each as defined under the Financial Advisers Regulations) only, and is also distributed by Credit Suisse AG, Singapore branch to overseas investors (as defined under the Financial Advisers Regulations). By virtue of your status as an institutional investor, accredited investor, expert investor or overseas investor, Credit Suisse AG, Singapore branch is exempted from complying with certain compliance requirements under the Financial Advisers Act, Chapter 110 of Singapore (the "FAA"), the Financial Advisers Regulations and the relevant Notices and Guidelines issued thereunder, in respect of any financial advisory service which Credit Suisse AG, Singapore branch may provide to you. UAE: This information is being distributed by Credit Suisse AG (DIFC Branch), duly licensed and regulated by the Dubai Financial Services Authority (“DFSA”). Related financial services or products are only made available to Professional Clients or Market Counterparties, as defined by the DFSA, and are not intended for any other persons. Credit Suisse AG (DIFC Branch) is located on Level 9 East, The Gate Building, DIFC, Dubai, United Arab Emirates. EU: This report has been produced by subsidiaries and affiliates of Credit Suisse operating under its Global Markets Division This research may not conform to Canadian disclosure requirements. In jurisdictions where CS is not already registered or licensed to trade in securities, transactions will only be effected in accordance with applicable securities legislation, which will vary from jurisdiction to jurisdiction and may require that the trade be made in accordance with applicable exemptions from registration or licensing requirements. Non-US customers wishing to effect a transaction should contact a CS entity in their local jurisdiction unless governing law permits otherwise. US customers wishing to effect a transaction should do so only by contacting a representative at Credit Suisse Securities (USA) LLC in the US. Please note that this research was originally prepared and issued by CS for distribution to their market professional and institutional investor customers. Recipients who are not market professional or institutional investor customers of CS should seek the advice of their independent financial advisor prior to taking any investment decision based on this report or for any necessary explanation of its contents. This research may relate to investments or services of a person outside of the UK or to other matters which are not authorised by the Prudential Regulation Authority and regulated by the Financial Conduct Authority and the Prudential Regulation Authority or in respect of which the protections of the Prudential Regulation Authority and Financial Conduct Authority for private customers and/or the UK compensation scheme may not be available, and further details as to where this may be the case are available upon request in respect of this report. CS may provide various services to US municipal entities or obligated persons ("municipalities"), including suggesting individual transactions or trades and entering into such transactions. Any services CS provides to municipalities are not viewed as "advice" within the meaning of Section 975 of the Dodd-Frank Wall Street Reform and Consumer Protection Act. CS is providing any such services and related information solely on an arm's length basis and not as an advisor or fiduciary to the municipality. In connection with the provision of the any such services, there is no agreement, direct or indirect, between any municipality (including the officials,management, employees or agents thereof) and CS for CS to provide advice to the municipality. Municipalities should consult with their financial, accounting and legal advisors regarding any such services provided by CS. In addition, CS is not acting for direct or indirect compensation to solicit the municipality on behalf of an unaffiliated broker, dealer, municipal securities dealer, municipal advisor, or investment adviser for the purpose of obtaining or retaining an engagement by the municipality for or in connection with Municipal Financial Products, the issuance of municipal securities, or of an investment adviser to provide investment advisory services to or on behalf of the municipality. If this report is being distributed by a financial institution other than Credit Suisse AG, or its affiliates, that financial institution is solely responsible for distribution. Clients of that institution should contact that institution to effect a transaction in the securities mentioned in this report or require further information. This report does not constitute investment advice by Credit Suisse to the clients of the distributing financial institution, and neither Credit Suisse AG, its affiliates, and their respective officers, directors and employees accept any liability whatsoever for any direct or consequential loss arising from their use of this report or its content. Principal is not guaranteed. Commission is the commission rate or the amount agreed with a customer when setting up an account or at any time after that. Copyright © 2016 CREDIT SUISSE AG and/or its affiliates. All rights reserved.
Investment principal on bonds can be eroded depending on sale price or market price. In addition, there are bonds on which investment principal can be eroded due to changes in redemption amounts. Care is required when investing in such instruments. When you purchase non-listed Japanese fixed income securities (Japanese government bonds, Japanese municipal bonds, Japanese government guaranteed bonds, Japanese corporate bonds) from CS as a seller, you will be requested to pay the purchase price only.