
System Study on Hydrothermal Gasification Combined with a ...
18
HAL Id: hal-00552368 https://hal.archives-ouvertes.fr/hal-00552368 Submitted on 6 Jan 2011 HAL is a multi-disciplinary open access archive for the deposit and dissemination of sci- entific research documents, whether they are pub- lished or not. The documents may come from teaching and research institutions in France or abroad, or from public or private research centers. L’archive ouverte pluridisciplinaire HAL, est destinée au dépôt et à la diffusion de documents scientifiques de niveau recherche, publiés ou non, émanant des établissements d’enseignement et de recherche français ou étrangers, des laboratoires publics ou privés. System Study on Hydrothermal Gasification Combined with a Hybrid Solid Oxide Fuel Cell Gas Turbine Richard Toonssen, P.V. Aravind, Gerton Smit, Nico Woudstra, Adrian Verkooijen To cite this version: Richard Toonssen, P.V. Aravind, Gerton Smit, Nico Woudstra, Adrian Verkooijen. System Study on Hydrothermal Gasification Combined with a Hybrid Solid Oxide Fuel Cell Gas Turbine. Fuel Cells, Wiley-VCH Verlag, 2010, 10 (4), pp.643. 10.1002/fuce.200900188. hal-00552368
Transcript of System Study on Hydrothermal Gasification Combined with a ...
HAL Id: hal-00552368https://hal.archives-ouvertes.fr/hal-00552368
Submitted on 6 Jan 2011
HAL is a multi-disciplinary open accessarchive for the deposit and dissemination of sci-entific research documents, whether they are pub-lished or not. The documents may come fromteaching and research institutions in France orabroad, or from public or private research centers.
L’archive ouverte pluridisciplinaire HAL, estdestinée au dépôt et à la diffusion de documentsscientifiques de niveau recherche, publiés ou non,émanant des établissements d’enseignement et derecherche français ou étrangers, des laboratoirespublics ou privés.
System Study on Hydrothermal Gasification Combinedwith a Hybrid Solid Oxide Fuel Cell Gas Turbine
Richard Toonssen, P.V. Aravind, Gerton Smit, Nico Woudstra, AdrianVerkooijen
To cite this version:Richard Toonssen, P.V. Aravind, Gerton Smit, Nico Woudstra, Adrian Verkooijen. System Study onHydrothermal Gasification Combined with a Hybrid Solid Oxide Fuel Cell Gas Turbine. Fuel Cells,Wiley-VCH Verlag, 2010, 10 (4), pp.643. 10.1002/fuce.200900188. hal-00552368

For Peer Review
System Study on Hydrothermal Gasification Combined with
a Hybrid Solid Oxide Fuel Cell Gas Turbine
Journal: Fuel Cells
Manuscript ID: fuce.200900188.R1
Wiley - Manuscript type: Original Research Paper
Date Submitted by the Author:
15-Jan-2010
Complete List of Authors: Toonssen, Richard; TU-Delft, Process and Energy Aravind, P.V.; TU-Delft, Process and Energy Smit, Gerton; Gensos V.O.F Woudstra, Nico; TU-Delft, Process and Energy Verkooijen, Adrian; TU-Delft, Process and Energy
Keywords: Cycle Tempo, Exergy analysis, Hydrothermal biomass gasification, Modelling, Solid Oxide Fuel Cell, SOFC-GT hyrbid system
Wiley-VCH
Fuel Cells
For Peer Review
System Study on Hydrothermal Gasification Combined with a Hybrid Solid Oxide Fuel Cell Gas Turbine
R. Toonssen1*
, P.V. Aravind1, G. Smit
2, N. Woudstra
1, A. H. M. Verkooijen
1
1 Delft University of Technology, Faculty of Mechanical, Marine and Material Engineering, Process and Energy
Department, Section Energy Technology, Leeghwaterstraat 44, 2628CA Delft, The Netherlands 2 GENSOS V.O.F., Wijdense Spaansweg 57, 1764GK Breezand, The Netherlands
Recieved:
[*] Corresponding author, [email protected]
Abstract The application of wet biomass in energy conversion systems is challenging, since in most conventional systems
the biomass has to be dried. Drying can be very energy intensive especially when the biomass has a moisture
content above 50 wt% on a wet basis. The combination of hydrothermal biomass gasification and a solid oxide
fuel cell (SOFC) gas turbine (GT) hybrid system could be an efficient way to convert very wet biomass into
electricity. Therefore, thermodynamic evaluation of combined systems with hydrothermal gasification units and
SOFC-GT hybrid units has been performed. Three hydrothermal gasification cases have been evaluated; one
producing mainly methane, a second one producing a mixture of hydrogen and methane and the last one
producing mainly hydrogen. These three gasification systems have been coupled to the same SOFC-GT hybrid
system. All the integrated systems have electrical exergy efficiencies around 50%, therefore the combination of
supercritical water gasification and SOFC-GT hybrid systems seems promising. The overall system
performance depends for a large part on the liquid gas separation. Further research is required for finding out the
optimal separation conditions.
Keywords: Cycle-Tempo, Exergy Analysis, Hydrothermal Biomass Gasification, Modelling, SOFC-GT Hybrid
System
1. Introduction Increasing concerns about the environmental impacts of fossil fuel consumption and their depletion lead to a
rising attention towards more sustainable sources of energy. Biomass is one of the considered sustainable energy
sources, due to its carbon dioxide neutrality. Especially, biomass waste and residual biomass streams can be used
for energy conversion processes. Many of the modern energy conversion systems convert the biomass first into a
secondary energy carrier, before it is converted into electricity. This is because the biomass is usually in a form,
which is hard to convert into electricity directly. For instance, manure is usually very wet and cannot be
combusted without being dried first. In hydrothermal gasifiers, it is possible to convert wet biomass into a
methane or hydrogen rich gas. The gas produced in hydrothermal gasification is relatively clean compared to gas
coming from conventional gasification processes. Therefore, simple gas cleaning is sufficient when compared
with conventional gasification systems. The methane or hydrogen rich gas produced in hydrothermal gasifiers
can be used to produce electricity.
The solid oxide fuel cell (SOFC) is an electrochemical device, which can convert the chemical energy in fuel
into electricity in an efficient manner. Common fuels for solid oxide fuel cells are hydrogen, methane, or
synthesis gas. When operated at elevated pressures, the SOFC can be combined with a gas turbine (GT), to
obtain a very efficient power plant.
The combination of biomass gasification with SOFC-GT hybrid systems is getting significant attention from
the scientific community [1-11]. All these studies focus on the gasification of relatively dry biomass combined
with either SOFCs or SOFC-GT hybrid systems. The combination of super critical water gasification and fuel
cells is a new concept. There is one study performed by Li et al. [12], where a tubular SOFC is tested with
simulated syn-gas assumed to be coming from supercritical water gasification.
In this paper, results from thermodynamic evaluations of power plants with hydrothermal gasification
systems coupled with SOFC-GT systems are presented. Three different hydrothermal gasification options have
been evaluated; one operates at a temperature of 673 K for the production of mainly methane, the second
operates at 773 K for the production of a mixture of methane and hydrogen and the last one operates at 873 K for
the production of mainly hydrogen. The three types of gasifiers have been coupled to a solid oxide fuel cell- gas
turbine hybrid system. Exergy analyses of the complete systems were performed.
Page 1 of 16
Wiley-VCH
Fuel Cells
123456789101112131415161718192021222324252627282930313233343536373839404142434445464748495051525354555657585960

For Peer Review
2. Description of Subsystems The considered systems are divided into three sub-systems, the hydrothermal gasification system, the solid
oxide fuel cell system and the gas turbine system. The sub-systems are described in the following sections,
respectively.
2.1. Hydrothermal Gasification Hydrothermal gasification is also known as subcritical or supercritical water gasification. With this
technique, a primary fuel is converted into a secondary fuel in an aqueous medium at temperatures above or
around 473 K and a sufficient high pressure to keep the water in a liquid or super critical state [13]. This
gasification technique has several advantages over conventional gasification techniques:
• Ability to use very wet biomass sources (>80%), like manure
• High gasification efficiency at relative low temperatures
• Low formation of tars and chars
Hydrothermal biomass gasification can be divided into three main types [14, 15]:
(i) Aqueous phase reforming, compounds originating from biomass (for instance, glucose, sorbitol, glycerol) are
gasified at around 488-543 K to mainly hydrogen and carbon dioxide in the presence of a heterogeneous
catalyst.
(ii) Catalyzed (near)-critical gasification, biomass is gasified in the presence of a catalyst to mainly methane and
carbon dioxide at either around 623 K in the liquid phase or around 673 K in the supercritical state.
(iii) Super critical water gasification, biomass compounds are gasified to mainly hydrogen and carbon
dioxide with or without a catalyst at temperatures around 873-973K.
In hydrothermal gasification the idea is to benefit from the special properties of near critical or supercritical
water [14]. Water from ambient to supercritical conditions changes its character from a solvent for ionic species
to a solvent for non-ionic species [16]. Also the electrochemical properties of water change from ambient
conditions. The pH values decreases by three units, providing more hydronium ions for acid catalyzed reactions
[16]. The reactivity of water increases near the critical point with as well as without catalyst [16]. At near critical
and supercritical conditions water and gasses like O2, N2, NH3, CO, CO2 are completely miscible and the
solubility for inorganic compounds in water decreases [15].
In hydrothermal gasification, water is not only used as a solvent, but also as a reaction partner. Biomass is
relatively fast hydrolysed in near or supercritical water resulting in a rapid degradation of the polymeric structure
of the biomass into a mixture of sugars [14]. The sugars are further converted as indicated in reactions (1) and
(2).
6 12 6 2 2 2C H O +6H O 6CO +12H→ (1)
6 12 6 4 2C H O 3CH +3CO→ (2)
In these reactions, the sugars are represented as glucose. The reactions (1) and (2) are also relatively fast
resulting in a gas at relatively low temperature compared to the “dry process” [14, 15]. The high solubility of the
intermediates in the reaction medium significantly inhibits tar and coke formation [14, 15]. After the reaction
and cooling carbon dioxide is mainly dissolved in the water, due to its high solubility at elevated pressures. The
pressurized gas separated from the liquid phase has a relatively low CO2 content, hence, a high heating value
[14].
A major disadvantage of hydrothermal gasification is the large amount of water which needs to be heated.
The heat required to reach e.g. 873 K can exceed the energy content of the applied biomass [14]. Therefore, the
application of a heat recovery heat exchanger is required and the efficiency of the heat exchanger is very
important.
Supercritical water gasification (SCWG) has special material requirements for the reactor, since in super
critical water gasification both the temperature and pressure are high [14]. One of the important problems in
hydrothermal gasification is reactor plugging [14, 17, 18]. This is caused by the formation of inorganic salts,
which precipitate during the gasification process. The salts can also have deteriorating effect on catalysts [16].
In this paper three cases are considered; the main difference between these cases is the type of hydrothermal
gasification employed.
• Case 1, the hydrothermal gasification operates at a temperature of around 673 K, a pressure of 34 MPa and
uses a catalyst (activated carbon). This system produces mainly methane and carbon dioxide using mainly
reaction (2)
• Case 2, operates at a temperature of approximately 773 K, a pressure of 34 MPa and without a catalyst. The
product of this system is a mixture of hydrogen, methane and carbon dioxide using both reaction (1) and (2)
• Case 3, operates at 873 K, a pressure of 24 MPa and also without catalyst. This system produces mainly
hydrogen and carbon dioxide using mainly reaction (1).
Page 2 of 16
Wiley-VCH
Fuel Cells
123456789101112131415161718192021222324252627282930313233343536373839404142434445464748495051525354555657585960
For Peer Review
The gas produced during the SCWG is separated from the water by flashing. The produced gas contains some
impurities, like hydrochloric acid and hydrogen sulphide. These compounds need to be removed before the gas is
fed to the SOFC-GT hybrid system. The SOFC-GT is considered as sensitive towards poisoning by hydrochloric
acid and hydrogen sulphide when they are present in excessive quantities, which results in performance
deterioration of the systems. Before the removal of hydrochloric acid and hydrogen sulphide, superheated steam
is added to the gas to increase the moisture content of the gas and to prevent carbon deposition in the acid gas
removal units. Hydrochloric acid is removed by adsorption on sodium carbonate and hydrogen sulphide is
removed by adsorption on zinc oxide. Both adsorption processes are performed in packed beds.
The technology of hydrothermal biomass gasification is still in its development stage.
There is some experimental data available, but the results are not compared to experimental results. Most of
the experimental data available is based on model compounds, like glucose, and very limited data on actual
biomass or in this case manure.
2.2. Solid oxide fuel cell system As it is in the case of hydrothermal gasification, the SOFC technology is also still in a development stage. The
solid oxide fuel cell considered in this work is based on Ni/GDC anodes and lanthanum strontium manganite
(LSM) cathodes at temperatures above 1173K. No relevant data is available about stack performance using bio-
syngas. Some reports on cell performance using bio-syngas are available [1, 19]. Based on these reports, data
necessary for system calculations have been assumed. These assumptions are for the values of different
parameters, like fuel cell resistance and current density.
2.3. Gas turbine and heat recovery system The gas turbine system does not represent any commercially available gas turbine. The isentropic and
mechanical efficiencies are chosen such that, they could represent a well matched gas turbine. The anode gas and
cathode gas coming from the fuel cell are partially recycled to the inlet of the fuel cell. The residual gasses are
fed to the combustion chamber of the gas turbine. All these units operate at elevated pressure. The flue gasses
from the combustion are expanded in the turbine. The turbine exhaust gasses are used to pre-heat the air for the
fuel cell.
The flue gasses coming from the gas turbine are mixed with the flue gasses coming form the gasification
part. After the mixing of the flue gasses, it is still possible to extract heat from the flue gasses. This is included as
a heat sink which represents a heat consumer. The recovered heat can be applied for various purposes. The flue
gasses are released in the atmosphere through a stack at a temperature of 383 K.
3. Modelling For the modelling of hydrothermal gasification systems combined with the SOFC-GT hybrid system, the
flow sheeting program Cycle-Tempo [20] is used. This flow sheeting program is especially designed for the
evaluation of energy conversion systems. For the flash calculations required in the systems, the computer
program Aspen Plus [21] is used. In this section, a description of the model and of the modelling principles
applied is given. First the gasification model is discussed and then the SOFC-GT hybrid system. Finally, the
used assumptions and model input are presented.
3.1. Hydrothermal gasification of manure The manure used in this system study is assumed to be a mixture of cow manure and pig manure. The dry ash
free (daf) composition of the manure is taken from Phyllis [22], a database of compositions of biomass and
waste. The used values are given in Table 1. These values in the wet composition are based on the assumption of
a moisture content of 80 wt% on wet basis. The calculated values of the wet manure can also be found in Table
1.
In Fig. 1, the flow sheet of the hydrothermal gasification of manure is given. For modelling purposes the
manure is put into the model as a gas stream. The compression of the manure is modelled as a sink (no. 2). The
output pressure and output temperature are set to the values calculated for the compression of liquid water with
an isentropic efficiency of 60% and a mechanical efficiency of 90%. The required power input for the pump is
also included in the calculations. This approach is used since Cycle-Tempo overestimated the power input
requirement of the compression as Cycle-Tempo could not handle the fuel as a liquid.
The hydrothermal gasification is modelled with single gasifier unit (no. 5); this unit calculates the outgoing
gas composition via minimization of the Gibbs energy. For a first estimation of the gas composition coming
from the SCWG, Gibbs energy minimization has shown to give good overall predictions for the gas composition
[23, 24].
The salts which are formed during the gasification are removed in a separator (no. 6). Some of the heat is
then recuperated in heat exchanger (no. 3).
To separate the product gas from the water the pressure is released to flash pressure (sink no. 7) and the fluid is
cooled to 298 K with cooling water (heat exchanger no. 8). The mixture is flashed separating the gas from the
Page 3 of 16
Wiley-VCH
Fuel Cells
123456789101112131415161718192021222324252627282930313233343536373839404142434445464748495051525354555657585960
For Peer Review
liquid. The liquid stream is flashed to atmospheric pressure (separator no. 71), to release the dissolved gasses
from the liquid water. These released gasses are combusted in a combustor (no. 72) to provide additional heat to
the process (heat exchangers no. 4 and 11).
For the flash calculations, a separate Aspen model is used, since in Cycle-Tempo it is not possible to do this
type of flash calculations. The thermodynamic model used for these flash calculations is Redlich-Kwong-Soave
model with modified Huron-Vidal mixing rules [25]. From the flash calculations the separation ratios are
determined for the two separators which represent the flashes (no.9 & 71) in the Cycle-Tempo model. The
separation factors for hydrochloric acid are not calculated by Aspen, since Aspen is not able to do the
calculations on ioninc compounds with the Redlich-Kwong-Soave with modified Huron-Vidal mixing rules
equations of state model. The solubility of hydrochloric acid is expected to be high, so the separation factors of
95% for the first flash and 75% for the second flash are chosen.
The gas released by the first flash (separator no. 9) is the product which is used later as fuel for the fuel cell.
This gas still contains small amounts of hydrochloric acid and hydrogen sulphide. These small amounts need to
be removed, since they will have a deteriorating effect on the SOFC-GT hybrid system. Before the hydrogen
sulphide and hydrochloric acid is removed, steam is added to the gas in order to prevent carbon formation in the
removal system. The superheated steam is produced in a boiler (no. 73) using the hot flue gasses coming from
the combustor.
The hydrochloric acid is removed in packed bed with sodium carbonate and hydrogen sulphide is removed
from the gas in a packed bed with zinc oxide. This is modelled as a separator (no. 13) with a pressure drop which
is assumed to remove all the hydrochloric acid and hydrogen sulphide from the gas. The gas is then heated in a
heat exchanger (no. 14) with the hot flue gas coming from the combustor (no 72).
3.2. Solid Oxide Fuel Cell Gas Turbine Hybrid System In Fig. 2 the flow sheet for the SOFC-GT hybrid system is given. The fuel gas coming from the gasification
section is mixed with a recycled stream from the fuel cell anode before it enters the fuel cell (no. 16). The fuel
cell is modelled as a direct internal reforming (DIR) solid oxide fuel cell. The anode gas entering the fuel cell is
brought to its chemical equilibrium by means of Gibbs minimization calculations. Then the cell voltage V, active
cell area, the current flow I and the electrical power output Pe are calculated by the model. The fuel mass flow
into the fuel cell is related to the current flow as indicated in equation (3).
2 4
m,a,in 0 0 0H CO CH f
a
2 ( 4 )I F y y y UM
φ= + + (3)
Here, 0iy are the concentrations of the different components at the inlet, Ma is the molar mass of the anode
gas, F is the Faraday constant and Uf is the fuel utilization.
The temperature and pressure are supposed to be constant during the process. The mass flow of oxygen from
the cathode to the anode is calculated based on the current flow. An energy balance is used to calculate the air
flow through the fuel cell, since the temperature at the outlet is given. For the calculation of the cell voltage, the
current density and power output a one dimensional model is used. This means that the temperature, pressure and
composition are supposed to be constant in a cross-section, perpendicular to the flow of fuel through the fuel
cell. The local reversible cell voltage Vrev,x, the local current density ix and the local concentrations yx(H2, CO,
CO2, CH4 and H2O) are calculated. For the cross-section the reversible cell voltage Vrev,x is determined with the
Nernst equation assuming ideal gas:
2 2
2
0.5O ,c H ,a0 0.5
rev,x rev cellH O,a
ln2
y yRTV V p
F y
= + ×
(4)
Where 0revV is the standard reversible voltage for hydrogen, R the universal gas constant, T is the
temperature, y is the mole fraction at the cross-section and pcell is the pressure. It is assumed that the voltage
losses on the level of the electrodes are negligible in the x-direction. This means that the cell voltage is supposed
to be constant over the fuel cell. So, the voltage loss ∆Vx can be calculated using the following equation:
x rev,xV V V∆ = − (5)
Where ∆Vx is the voltage loss. The current density can then be calculated with:
xx
eq
Vi
R
∆= (6)
Here Req is the equivalent fuel cell resistance.
Over the whole fuel cell these quantities are connected with the following equation:
F
f
eqrev,x
0( )
U
UI
Ad
RV V
ξ=
−∫ (7)
Page 4 of 16
Wiley-VCH
Fuel Cells
123456789101112131415161718192021222324252627282930313233343536373839404142434445464748495051525354555657585960
For Peer Review
Here, I is the total current, A is the fuel cell area and ξ is the dimensionless reaction coordinate. With the
current and voltage known the power output can be calculated.
The residual fuel leaving the fuel cell is combusted in a combustor (no. 18). The hot flue gasses are then
expanded in a turbine (no. 19) which is connected to a generator through a shaft. The enthalpy of the outlet is
calculated using equation (8), for the compressor equation (9) is used.
out in i in out,s( )h h h hη= − − (8)
out,s in
out in
i
( )h hh h
η
−= + (9)
In these equations, hout is the specific enthalpy of the outlet, hin the specific enthalpy of the inlet, ηi the
isentropic efficiency and hout,s is the specific enthalpy of the gas when isentropically expanded. When the
enthalpy change is known, the power output can be determined with the mass flow.
The flue gasses are used in a recuperator (no. 20) to pre-heat the cathode air. Finally the flue gasses are
mixed with the flue gas from the gasification plant and a part of the heat is recovered in a heat sink (no. 23). This
heat could be used to produce even more electricity, for example, with an organic rankine cycle. After this, the
gas is released to the environment through a stack (no. 21).
3.3 Assumptions and model input Several general assumptions have been made for the models:
• Steady state
• No fouling in the equipment
• No catalyst deactivation
• All processes are adiabatic
• The heat exchangers are operated in counter current flow
The input values for the hydrothermal gasification of the different systems are given in Table 2. In Table 3,
the input values for the SOFC-GT hybrid system are given. For both tables, the temperatures (T) are given in °C,
the pressures (p) in bar, the mass flow (φm) in kg s-1
, the equivalent fuel cell resistance (Req) in Ω m2 and the
current density (i) in A m-2
. The full description of the symbols is given in the list of symbols.
Cycle Tempo can perform exergy calculations. The exergy of all flows considered in the flow sheet is
calculated based on previously calculated temperatures, pressures and chemical composition. The thermo-
mechanical (physical) exergy and chemical exergy are calculated separately.
The thermo-mechanical exergy Extm is calculated using equation (10).
0 0 0( ) ( )tmEx h h T s s= − − − (10)
Here, h is the enthalpy of a stream, s is the entropy of a stream, h0 is the enthalpy of a stream at reference
conditions, s0 is the entropy of a stream at reference conditions and T0 is the temperature at reference conditions.
For the calculation of the chemical exergy, a definition of the environment is required. The composition of
the environment in the calculation is given in Table 4, which is the composition of air saturated with water
vapour as specified by Baehr [26], but at an environmental temperature of 288 K and pressure of 101325 Pa. The
chemical exergy Exch is calculated using equation (11).
ch 0, 0 lni i i i
i i
Ex y ex RT y y= +∑ ∑ (11)
Here, yi is the molar fraction of component i, ex0,i is the standard chemical exergy of component i which is based
on the reference environment and T0 is the reference temperature,
The overall exergy Ex is calculated using the following relation:
mol tm ch( )Ex Ex Exφ= + (12)
Where, φmol is the molar flow.
Chlorine, sulphur and the elements in the ash are not defined in the chemical composition of the
environment. Therefore, the components containing these elements are assumed to have zero exergy. Since the
concentrations of these elements in the biomass are very low this assumption would result only in a negligible
error.
Energy efficiencies are based on the Lower Heating Value (LHV) of the fuel. The exergy efficiency is
generally defined as follows.
products
ex
source
Ex
Exη =∑
∑ (13)
Page 5 of 16
Wiley-VCH
Fuel Cells
123456789101112131415161718192021222324252627282930313233343536373839404142434445464748495051525354555657585960

For Peer Review
Where Exproducts is the exergy of the flows which are considered to be products going out of the systems,
Exsource is the exergy of the flows which are considered to be necessary for making the product going into the
system. Further specification of the Exproduct and Exsource is necessary in order to calculate system efficiencies. In
this paper the electrical exergy efficiency (ηex,el) is defined as:
el.out el,in
ex,el
fuel,in
P P
Exη
−=∑ ∑
(14)
Here is Pel,out the gross electrical output of the system, Pel,in the electrical power input in the system (auxiliary
power) and Exfuel,in is the exergy of the fuel put into the system.
4. Results and discussion The mixture of pig and cow manure enters the system with a mass flow of 0.28 kg/s at environmental
conditions. This stream is pressurized to a pressure of 35 MPa for cases 1 and 2. For case 3 the manure is
pressurized to a pressure of 25 MPa. The pressurization results in power consumption of the pump of 17.83 kW
for cases 1 and 2, for case 3 this is 12.75 kW. After the pressurization, the fluid is heated in heat exchangers to
process conditions and then gasified. The precipitated solid salts are removed and the fluid is cooled by heat
exchanging with the pressurized feed. Then some pressure is released till a pressure of 15.3 MPa and the fluid is
further cooled. In Table 5, the composition of the resulting fluid (pipe 10) for the different systems is given.
The composition of pipe 10 is entered into the Aspen flash model to determine the separation factors. These
separation factors are given in Table 6 for every case. The chosen separation factors for hydrochloric acid will
hardly influence the calculations since the concentrations are low. In this model it is not important for
determining the system performance, since it is assumed that the chlorine removal bed will adsorb all the
residual chlorine. When designing an actual system to be built; it is important to know how much chlorine will
be in the gas after the flash. Especially, when dimensioning the chlorine removal system. Hydrochloric acid may
have a detrimental effect on the solid oxide fuel cell. Chlorine is a bit tricky, its influence is not that clearly
known.
For case 3, a higher pressure is used in the first flash. This is done to increase the amount of combustibles
dissolved in the water. These combustibles are used after the second flash for the generation of heat for the
process. When the same pressure was used as in the cases 1 & 2, the heat generation was not sufficient for the
process.
The resulting gas composition for pipe 11 can be found in Table 5. The gas is further expanded to 6.9 bar and
then heated in the following heat exchanger to 673 K before steam is added. In case 1, 0.008 kg s-1
steam is
added with a temperature of 673 K and a pressure of 6.8 bar. In cases 2 and 3, 0.005 kg s-1
steam is added at
same conditions as in case 1. Since the gas in case 1 is methane rich, more steam is required. This steam is also
used in the reforming process in the SOFC downstream. The steam is added to prevent carbon formation in the
sulphur and chlorine removal as well as in the SOFC. The composition of the gas sent to the SOFC-GT hybrid
system (pipe 16) is given in Table 5.
Before the gas enters the anode of the fuel cell, it is mixed with the anode recycle stream. The mixture enters
the fuel cell at 1173 K. Air extracted from the environment is compressed in the compressor of the gas turbine
and heated in the recuperator, before it is mixed with the cathode recycle stream. The air mixture enters the
cathode of the fuel cell at a temperature of 1173 K. Part of the anode off-gas is recycled as well as a part of the
cathode off-gas is recycled, the recycle ratios for every case can be found in Table 7. The residual off-gasses
enter a combustor where the residual fuel in the anode off-gas is combusted. The hot flue gas is expanded in the
turbine. In Table 7, results can be found of the SOFC/GT hybrid system for the different cases.
In Table 8, an overview of the power production and the efficiencies of the different systems are given.
As can be seen in Table 8, the net electrical performances of the three cases do not deviate much from each
other. The electrical exergy efficiency is around 50%, which is comparable to the efficiency of conversion
systems based on dry biomass, like in refs. [2, 11]. When wet biomass is applied in systems for dry biomass, the
biomass has to be dried first. The drying will reduce the performance of the systems based on dry biomass.
In order to get an overview where the exergy losses within the system occur, an exergy flow diagram has
been created for each case. In these diagrams, the losses are indicated by the gray areas. In Fig. 3, the exergy
flow diagrams for the three cases are given. The unit numbers which are included in the different system sections
as indicated in Fig. 3 are given in Table 9.
From Fig. 3, it can be seen that the gasification section has the largest losses in the whole system. The losses
for the gasification are in case 1 larger than for cases 2 &3. The losses are mainly caused by the irreversibilities
in the gasifier (unit 5). The chemical exergy of the stream leaving the gasifier is smaller for case 1 than for the
Page 6 of 16
Wiley-VCH
Fuel Cells
123456789101112131415161718192021222324252627282930313233343536373839404142434445464748495051525354555657585960

For Peer Review
other two cases and the chemical exergy of the input stream is for the three cases the same. This chemical exergy
is lost for a large part. Since the loss of exergy should be minimized, cases 2 & 3 are preferred. Other larger
contributors in losses of the gasification section are the heat exchangers (unit 3 & 8) and the combustor (unit 72).
The losses in the gas cleaning section of case 2 are significantly lower than for the other two systems. The
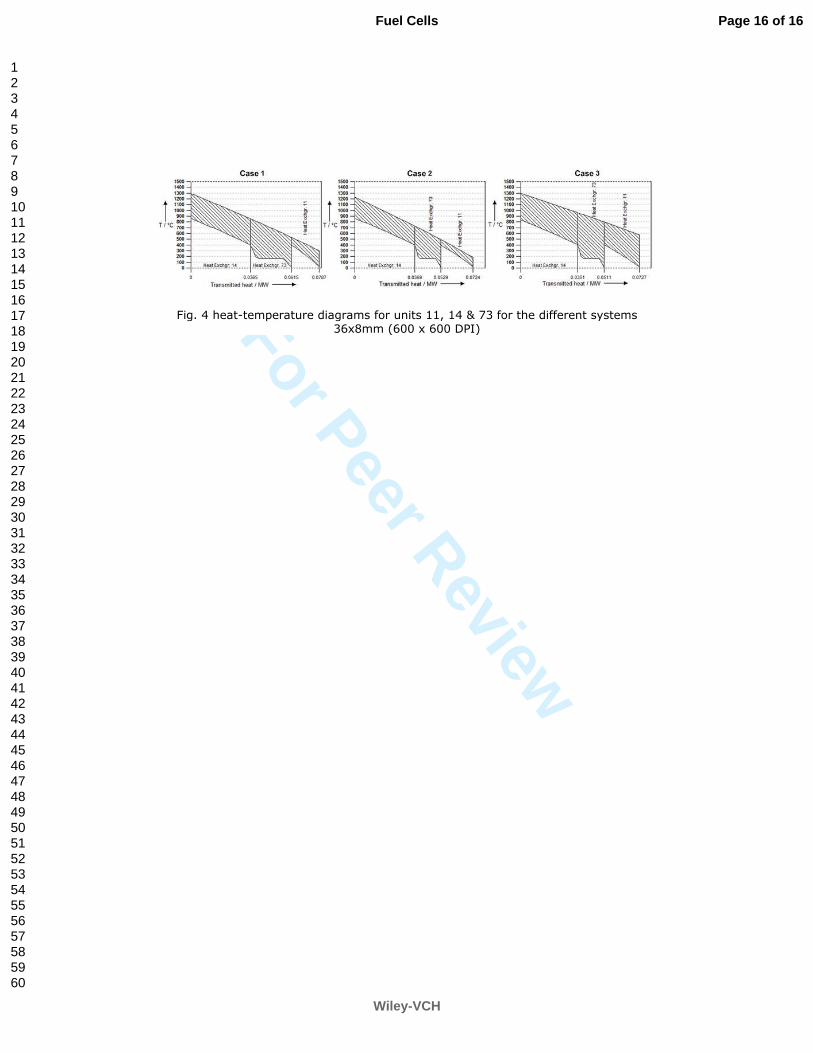
losses in this section are dominated by the heat exchangers and the boiler. The cause of these losses can be
clearly shown by heat-temperature diagrams of the heat exchangers (units 11 & 14) and the boiler (unit 73) for
every case. In Fig. 4, the heat-temperature diagrams of units 11, 14 and 73 for the different cases are given.
The slope of the hot fluid temperature line is steeper in case 2 (14.1 K kW-1
) than for the other two cases (for
case 1: 12.7 K kW-1
and for case 3: 9.6 K kW-1
). In the other two cases more flue gas is formed in combustor
(unit 72), resulting in a larger mass flow. The amount of combustibles going to the combustor is determined by
the flash conditions, and that determines the amount of flue gas that is produced. The air factor is for every
system the same. Also, the temperature differences between the hot fluid and cold fluids are smaller for case 2
than for the other cases. This is represented by the shaded area in Fig. 4.
The power output of the fuel cell in case 3 is lower than in the other systems. This is partly caused by the fact
that more anode gas is recycled than in the other systems. The recycling has a diluting effect on the fuel,
resulting in a lower fuel cell output. The lower performance of the fuel cell is partly compensated by the higher
output of the gas turbine. The air flow through the fuel cell is higher than in the other cases, because the fuel cell
requires more cooling due to lower methane fraction and higher hydrogen fraction in the fuel.
For case 1, the losses for the gas turbine are smaller than in the other systems. This is partly caused by the
amount of air required in the SOFC-GT hybrid system. The fuel cell is cooled by the cathode air flow. If the
amount of hydrogen in fuel increases, the fuel cell requires more cooling, because less heat is extracted by the
internal reforming. The increased mass flow of air causes an increase of the losses in the air compressor, air
recycle blower, turbine and mixing points.
Case 3 has a larger heat production than the cases 1 &2. Since case 3 has the largest mass flow of flue gas
coming from the combustor.
The two flue gas streams coming from the gasification section and from the gas turbine are mixed to make it
easier to extract heat from it. The heat is extracted by a heat consumer, which cools the flue gas to a temperature
of 383 K. This value is chosen to prevent condensation of the water in the flue gas. The type of heat consumer is
not further researched, many options are available, for instance, an organic rankine cycle for the production of
additional electricity, steam production for other process, production of hot water for district heating, etc.
The most determining factor for the performance of the whole system is the flash conditions of the first flash
vessel. The flash conditions determine the amount of gas and the composition of the gas. The solubility of the
different components in water depends on the pressure. The secondary flash is used to release the dissolved
compounds from the water, which results in a combustible gas. It is possible to optimize the flash conditions in
such a way that the maximal amount of gas for the fuel cell is produced and still enough heat can be produced
from the gas released in the second flash to support the processes. This optimization is not performed, and is
considered as a future research topic. The current flash conditions deliver almost similar mass flows of gas
towards the gas cleaning section and SOFC-GT system.
5. Conclusions The coupling of hydrothermal biomass gasification and a SOFC-GT hybrid system has been
thermodynamically evaluated by modelling several systems in Cycle Tempo. The biomass used in this study is a
mixture of pig and cow manure with a moisture content of 80 wt% on a wet basis. Three different types of
hydrothermal gasification have been modelled and combined with a SOFC-GT hybrid system. Case 1 is based on
catalytic gasification at a temperature of around 673K and a pressure of 34 MPa; this results in a producer gas of
mainly methane, carbon dioxide and a relatively small amount of hydrogen. Case 2 is based on non-catalytic
gasification at a temperature of 773K and a pressure of 34 MPa resulting in a mixture of hydrogen, methane and
carbon dioxide. Case 3 is based on non-catalytic hydrothermal gasification at a temperature of 873K and a
pressure of 24 MPa resulting in a hydrogen rich gas. The coupled SOFC-GT hybrid is kept identical for every
system. The electrical exergy efficiency for the cases 1, 2 and 3 are 49.8%, 51.8% and 49.6%, respectively.
These efficiency values are reasonably comparable with previously reported efficiencies for SOFC-GT systems
combined with conventional gasification techniques based on dry biomass. The combination of hydrothermal
gasification and SOFC-GT hybrid systems seems very promising especially for wet biomass streams.
The non-catalytic hydrothermal gasification processes of cases 2 & 3 are preferred, since these processes
have lower chemical exergy losses in the gasification than case 1.
Page 7 of 16
Wiley-VCH
Fuel Cells
123456789101112131415161718192021222324252627282930313233343536373839404142434445464748495051525354555657585960
For Peer Review
The conditions of the flash used for separating the gas from the liquid have a large influence on the
performance of the system because it influences the amount of combustibles dissolved in the liquid. Further
study into the flash conditions is required to optimize the system.
List of Symbols λ Air factor
η Efficiency / %
ηex Exergy efficiency / %
ηex,el Electrical exergy efficiency / %
∆Hout Enthalpy change / kJ kg-1
ηi Isentropic efficiency / %
φm Mass flow / kg s-1
φm,a,in Mass flow at inlet of anode / kg s-1
φmol Molar flow / mol s-1
ξ Dimensionless reaction coordinate
∆p Pressure drop / bar
∆p1 Pressure drop for primary stream / bar
∆p2 Pressure drop for secondary stream / bar
∆pan Pressure drop at the anode of a fuel cell / bar
∆pcat Pressure drop at the cathode of a fuel cell / bar
∆ph Pressure drop at hot side of a heat exchanger / bar
∆pl Pressure drop at cold side of a heat exchanger / bar
∆Vx Voltage loss / V
A Active cell area / m2
DCAC Efficiency of the DC to AC conversion / %
ex0,i Standard chemical exergy of component i / kJ mol-1
Ex Exergy of a stream / kW
Extm Thermo-mechanical exergy / kJ mol-1
Exch Chemical exergy / kJ mol-1
Exfuel,in Exergy of the fuel input / kW
Exproduct Exergy content of the products / kW
Exsource Exergy content of the sources / kW
F Faradays’ constant
h Enthalpy of a stream / kJ mol-1
h0 Enthalpy of a stream at reference conditions / kJ mol-1
hin Enthalpy of a stream at the inlet / kJ mol-1
hout Enthalpy of a stream at the outlet / kJ mol-1
hout,s Enthalpy of a stream at the outlet in case of isentropic compression/expansion / kJ mol-1
i Current density / A m-2
I Current / A 0iy Molar fraction of component i at the inlet
yi,c Molar fraction of component i at the cathode
yi,a Molar fraction of component i at the anode
Ma Molar mass anode gas / kg mol-1
Pel,in Electrical power input / kW
Pel,out Electrical power output / kW
pcell Fuel cell pressure / bar
pout Outlet pressure / bar
pout,2 Outlet pressure of the secondary stream / bar
PR Pressure ratio
preact Reaction pressure / bar
R Universal gas constant
Req Equivalent fuel cell resistance / Ω m2
s Entropy of a stream / kJ mol-1
K-1
s0 Entropy of a stream at reference conditions / kJ mol-1
K-1
T0 Reference temperature / °C
Tfc Fuel cell temperature / °C
Tin,2 Inlet temperature secondary stream / °C
Tin,an Inlet temperature at the anode of a fuel cell / °C
Page 8 of 16
Wiley-VCH
Fuel Cells
123456789101112131415161718192021222324252627282930313233343536373839404142434445464748495051525354555657585960

For Peer Review
Tin,cat Inlet temperature at the cathode of a fuel cell / °C
Tout Outlet temperature / °C
Tout,2 Outlet temperature of the secondary stream / °C
Tout,est Estimate outlet temperature / °C
Tout,h Temperature of the outlet at the hot side of a heat exchanger / °C
Treact Reaction temperature / °C
Uf Fuel utilization
V Cell voltage / V
Vrev,x Reversible cell voltage / V 0
rev,xV Standard reversible cell voltage /V
References [1] P. V. Aravind, PhD Thesis, University of Technology Delft, Delft, 2007
[2] P. V. Aravind, T. Woudstra, N. Woudstra,H. Spliethoff, J. Power Sources 2009, 190, 461
[3] K. D. Panopoulos, L. E. Fryda, J. Karl, S. Poulou,E. Kakaras, J. Power Sources 2006, 159, 570
[4] C. Athanasiou, F. Coutelieris, E. Vakouftsi, V. Skoulou, E. Antonakou, G. Marnellos,A. Zabaniotou, Int. J.
Hydrogen Energy 2007, 32, 337
[5] C. Athanasiou, E. Vakouftsi, F. A. Coutelieris, G. Marnellos,A. Zabaniotou, Chem. Eng. J. 2009, 149, 183
[6] T. Seitarides, C. Athanasiou,A. Zabaniotou, Renew. Sustain. Energy Rev. 2008, 12, 1251
[7] A. O. Omosun, A. Bauen, N. P. Brandon, C. S. Adjiman,D. Hart, J. Power Sources 2004, 131, 96
[8] L. Fryda, K. D. Panopoulos,E. Kakaras, Energy Convers. Manage. 2008, 49, 281
[9] T. Proell, C. Aichernig, R. Rauch,H. Hofbauer, Proc. ASME Turbo Expo 2004: Power for Land, Sea, and Air,
(Eds. Vienna, Austria, 2004, pp.
[10] M. Sucipta, S. Kimijima,K. Suzuki, J. Power Sources 2007, 174, 124
[11] R. Toonssen, N. Woudstra,A. H. M. Verkooijen, Reference System for a Power Plant Based on Biomass
Gasification and Sofc, European Fuel Cell Forum, 2008
[12] C.-X. Li, C.-J. Li,L.-J. Guo, Int. J. Hydrogen Energy doi:10.1016/j.ijhydene.2009.05.033,
[13] A. A. Peterson, F. Vogel, R. P. Lachance, M. Fröling, M. J. Antal,J. W. Tester, Energy Environ. Sci.
2008, 1, 32
[14] A. Kruse, J. Supercrit. Fluids 2009, 47, 391
[15] A. Kruse, Biofuels, Bioprod. Biorefin. 2008, 2, 415
[16] G. Brunner, J. Supercrit. Fluids 2009, 47, 373
[17] Y. J. Lu, L. J. Guo, C. M. Ji, X. M. Zhang, X. H. Hao,Q. H. Yan, Int. J. Hydrogen Energy 2006, 31, 822
[18] M. J. Antal, S. G. Allen, D. Schulman, X. Xu,R. J. Divilio, Industrial & Engineering Chemistry
Research 2000, 39, 4040
[19] J. P. Ouweltjes, P. V. Aravind, N. Woudstra,G. Rietveld, J. Fuel Cell Sci. Technol. 2006, 3, 495
[20] Cycle-Tempo, TU Delft, version: 5.0, 2006
[21] Aspen Plus, Aspen Techechnology Inc., version: 20.0.3595, 2006
[22] ECN, Phyllis, Database for Biomass and Waste, ECN, http://www.ecn.nl/phyllis/, 2009
[23] Y. Calzavara, C. Joussot-Dubien, G. Boissonnet,S. Sarrade, Energy Convers. Manage. 2005, 46, 615
[24] H. Tang,K. Kitagawa, Chem. Eng. J. 2005, 106, 261
[25] Y. Lu, L. Guo, X. Zhang,Q. Yan, Chem. Eng. J. 2007, 131, 233
[26] H. D. Baehr, Thermodynamik; Eine Einführung in Die Grundlagen Und Ihre Technischen
Anwendungen, Springer, Berlin, 1984,
Figure captions Fig. 1 flow sheet of super critical water gasification
Fig. 2 flow sheet of the solid oxide fuel cell gas turbine hybrid system
Fig. 3 exergy flow diagrams for the three different systems
Fig. 4 heat-temperature diagrams for units 11, 14 & 73 for the different systems
Page 9 of 16
Wiley-VCH
Fuel Cells
123456789101112131415161718192021222324252627282930313233343536373839404142434445464748495051525354555657585960

For Peer Review
Tables Table 1 composition mixture of cow and pig manure[22]
Component wt% daf mol% wet
C 47.4 8.83
H 6.7 7.43
O 35.3 2.47
N 4.2 0.34
S 0.8 0.05
Cl 1.5 0.10
Ash 0 2.31
H2O 0 78.48
LHV [kJ/kg] 19859 3960
Table 2 input values for hydrothermal gasification of the different systems
Unit Name Case 1 Case 2 Case 3
1 Source pout=1.01325, Tout=15,
φm=0.2778
pout=1.01325, Tout=15,
φm=0.2778
pout=1.01325, Tout=15,
φm=0.2778
2 Sink/Source pout=350, Tout=21.1 pout=350, Tout=21.1 pout=250, Tout=19.32
3 Heat exchanger ∆ph=6, ∆pl=6.1,
Tout,h=195
∆ph=6, ∆pl=6.1,
Tout,h=195
∆ph=5, ∆pl=5.1,
Tout,h=140
4 Heat exchanger ∆p=0 ∆p=0 ∆p=0
5 Gasifier ∆p1=0, Tin,2=400,
preact=343.9,
Treact=408.49,
pout,2=343.9,
Tout,2=408.49
∆p1=0, Tin,2=500,
preact=343.9, Treact=500,
pout,2=343.9, Tout,2=500
∆p1=0, Tin,2=600,
preact=343.9, Treact=600,
pout,2=343.9, Tout,2=600
6 Separator ∆p1=6, ∆p2=6, ∆T1=0,
∆T2=0
∆p1=6, ∆p2=6, ∆T1=0,
∆T2=0
∆p1=5, ∆p2=5, ∆T1=0,
∆T2=0
7 Sink/Source ∆p=178.9, ∆Hout=0,
Tout,est=187.5
∆p=178.9, ∆Hout=0,
Tout,est=187.5
∆p=80.9, ∆Hout=0,
Tout,est=150
8 Heat exchanger ∆ph=3, ∆pl=0.01,
Tout,h=25
∆ph=3, ∆pl=0.01,
Tout,h=25
∆ph=3, ∆pl=0.01,
Tout,h=25
9 Separator ∆p1=100, ∆p2=100,
∆T1=0, ∆T2=0
∆p1=100, ∆p2=100,
∆T1=0, ∆T2=0
∆p1=50, ∆p2=50, ∆T1=0,
∆T2=0
10 Sink/Source ∆p=43, ∆Hout=0 ∆p=43, ∆Hout=0 ∆p=93.1, ∆Hout=0
11 Heat exchanger ∆ph=0.001, ∆pl=0.1,
Tout,l=400
∆ph=0.001, ∆pl=0.1,
Tout,l=400
∆ph=0.001, ∆pl=0.1,
Tout,l=404
12 Node
13 Separator ∆p1=0.2, ∆p2=0.2,
∆T1=0, ∆T2=0
∆p1=0.2, ∆p2=0.2,
∆T1=0, ∆T2=0
∆p1=0.2, ∆p2=0.2,
∆T1=0, ∆T2=0
14 Heat exchanger ∆ph=0.01, ∆pl=0.042,
Tout,h=859
∆ph=0.001, ∆pl=0.042,
Tout,h=862.5
∆ph=0.001, ∆pl=0.1042,
Tout,l=835.5
61 Sink/Source
71 Separator p1=1.01325, p2=1.01325,
∆T1=24.4, ∆T2=24.4
p1=1.01325, p2=1.01325,
∆T1=24.4, ∆T2=24.4
p1=1.01325, p2=1.01325,
∆T1=24.4, ∆T2=24.4
72 Combustor pout=1.016, λ=1.3,
Treact=1000,
preact=1.01325
pout=1.016, λ=1.3,
Treact=1000,
preact=1.01325
pout=1.016, λ=1.3,
Treact=1000,
preact=1.01325
73 Heat exchanger ∆ph=0.001, ∆pl=0,
Tout,l=400
∆ph=0.001, ∆pl=0,
Tout,l=400
∆ph=0.001, ∆pl=0,
Tout,l=404
81 Sink/Source
91 Sink/Source
101 Sink/Source pout=1.01325, Tin=20,
Tout=15
pout=1.01325, Tin=20,
Tout=15
pout=1.01325, Tin=20,
Tout=15
201 Sink/Source pout=1.01325, Tout=15 pout=1.01325, Tout=15 pout=1.01325, Tout=15
202 Node ∆p=0 ∆p=0 ∆p=0
301 Sink/Source pout=6.8, Tout=15,
φm=0.0078
pout=6.8, Tout=15,
φm=0.005
pout=6.8, Tout=15,
φm=0.005
Page 10 of 16
Wiley-VCH
Fuel Cells
123456789101112131415161718192021222324252627282930313233343536373839404142434445464748495051525354555657585960
For Peer Review
Table 3 input for the SOFC-GT hybrid system coupled to the hydrothermal gasification
Unit Name All cases
15 Node ∆p=0
16 Fuel cell ∆pan=0.2, ∆pcat=0.2, Tin,an=900, Tin,cat=900, Tout=1000, pfc=6.5, Tfc=950, preact=6.5,
Treact=950, Uf=0.85, DCAC=0.97, Req=5e-5, i=2500
17 Node
18 Combustor ∆p=0.5, Treact=1000, preact=6.4
19 Turbine ηi=0.80
20 Heat exchanger ∆ph=0.001, ∆pl=0.2, ∆Th=30
21 Stack pin=1.01325
22 Node ∆p=0
23 Heat sink ∆p=0, Tout=110
252 Compressor PR=6.67, ηi=0.80
253 Node ∆p=0
254 Node
501 Compressor ηi=0.70
551 Compressor ηi=0.70
G Generator η=0.97
Table 4 chemical composition of the environment[26]
Component Molar fraction [%]
Ar 0.91
CO2 0.03
H2O 1.68
N2 76.78
O2 20.60
Table 5 composition in mole% of the fluid in different pipes of the system
Component Case 1 Case 2 Case 3
Pipe number (Figure 1) 10 11 16 10 11 16 10 11 16
Mass flow / kg s-1
0.26 0.02 0.03 0.26 0.03 0.03 0.26 0.02 0.03
Temperature / K 298 298 1132 298 298 1136 298 298 1109
Pressure / bar 150.0 50.0 6.6 150.0 50.0 6.6 150.0 100.0 6.6
H2 0.95 10.69 7.62 2.39 23.02 18.95 5.86 44.99 38.12
CH4 5.60 59.57 42.49 5.19 47.89 39.40 4.19 30.57 25.90
CO 0.02 0.06 0.04 0.03 0.26 0.22 0.15 1.17 0.99
CO2 4.79 25.07 17.88 5.10 24.92 20.51 5.79 20.18 17.10
H2S 0.07 0.17 0.00 0.07 0.17 0.00 0.07 0.12 0.00
HCl 0.09 0.06 0.00 0.09 0.05 0.00 0.09 0.04 0.00
N2 0.37 4.26 3.03 0.37 3.59 2.96 0.36 2.84 2.41
NH3 0.02 0.01 0.00 0.02 0.01 0.01 0.03 0.01 0.01
H2O 88.09 0.11 28.94 86.74 0.09 17.95 83.46 0.08 15.46
Table 6 separation factors for the two flashes in the different systems
Case 1 Case 2 Case 3
Flash 1 Flash 2 Flash 1 Flash 2 Flash 1 Flash 2
Pressure / bar 50 1.01 50 1.01 100 1.01
Temperature / K 298 298 298 298 298 298
CH4 / mole% 15.17 0.68 12.84 0.72 19.04 0.44
CO / mole% 0.00 0.00 8.73 0.00 14.35 1.09
CO2 / mole% 58.26 6.52 53.83 6.66 61.36 4.48
H2 / mole% 10.72 0.24 8.86 0.34 14.83 0.22
H2O / mole% 99.99 99.86 99.99 99.87 99.99 99.80
H2S / mole% 78.93 17.52 75.95 17.87 79.93 12.55
HCl / mole% 95.00 75.00 95.00 75.00 95.00 75.00
N2 / mole% 9.33 0.71 7.79 0.00 12.53 0.00
NH3 / mole% 97.90 74.54 97.32 75.23 97.66 66.40
Page 11 of 16
Wiley-VCH
Fuel Cells
123456789101112131415161718192021222324252627282930313233343536373839404142434445464748495051525354555657585960

For Peer Review
Table 7 results of the SOFC/GT for the different cases
Case 1 Case 2 Case 3
Air input / kg s-1
0.31 0.33 0.37
Cell voltage / V 0.816 0.821 0.810
Active cell area / m2 180.4 185.3 176.5
Anode recycle ratio / % 19.8 18.8 29.0
Cathode recycle ratio / % 53.7 54.7 60.6
Turbine inlet temperature / K 1462 1458 1414
Turbine outlet temperature / K 1084 1079 1042
Pressure ratio 6.7 6.7 6.7
Table 8 overview of the performance of the different systems
Case 1 Case 2 Case 3
Energy / kW Exergy / kW Energy / kW Exergy / kW Energy / kW Exergy /kW
Fuel input 830.72 841.85 830.72 841.85 830.72 841.85
Delivered power
Fuel cell 356.94 356.94 368.88 368.88 346.58 346.58
Generator 87.63 87.63 92.81 92.81 94.58 94.58
Gross power 444.57 444.57 461.68 461.68 441.16 441.16
Auxiliary power consumption
Aux power 25.00 25.00 25.80 25.80 23.90 23.90
Delivered power
Net power 419.57 419.57 435.88 435.88 417.26 417.26
Total power 543.78 473.55 556.20 487.00 575.01 487.31
Efficiencies
Gross el. eff. / % 53.52 52.81 55.58 54.84 53.11 52.40
Net el. eff. / % 50.51 49.84 52.47 51.78 50.23 49.57
Table 9 the units included in the different system sections as indicated in Fig. 3
System section Unit number in Fig. 1 or Fig. 2
Gasifier 2, 3, 4, 5, 6, 7, 8, 9, 10, 71, 72, 101, 202
Cleaning 11, 12, 13, 14, 73
Fuel cell (FC) 15, 16, 17, 253, 254, 501, 551
Gas turbine (GT) 18, 19, 20, 22, 23, 252
Page 12 of 16
Wiley-VCH
Fuel Cells
123456789101112131415161718192021222324252627282930313233343536373839404142434445464748495051525354555657585960

For Peer Review
Fig. 1 flow sheet of super critical water gasification 77x39mm (600 x 600 DPI)
Page 13 of 16
Wiley-VCH
Fuel Cells
123456789101112131415161718192021222324252627282930313233343536373839404142434445464748495051525354555657585960
For Peer Review
Fig. 2 flow sheet of the solid oxide fuel cell gas turbine hybrid system 96x61mm (600 x 600 DPI)
Page 14 of 16
Wiley-VCH
Fuel Cells
123456789101112131415161718192021222324252627282930313233343536373839404142434445464748495051525354555657585960

For Peer Review
Fig. 3 exergy flow diagrams for the three different systems 49x15mm (600 x 600 DPI)
Page 15 of 16
Wiley-VCH
Fuel Cells
123456789101112131415161718192021222324252627282930313233343536373839404142434445464748495051525354555657585960
For Peer Review
Fig. 4 heat-temperature diagrams for units 11, 14 & 73 for the different systems 36x8mm (600 x 600 DPI)
Page 16 of 16
Wiley-VCH
Fuel Cells
123456789101112131415161718192021222324252627282930313233343536373839404142434445464748495051525354555657585960