Procedural Sedation in the Emergency Department Deon Stoltz.

SERVICE DELIVERY INDICATORS
System health at the frontlines:
Using SDI Data to analyze
education quality in Sub-
Saharan Africa
Deon Filmer
World Bank
Making Systems Work: A Global
Conference on Education Systems
Sydney, March 1, 2016

SDI Findings in Kenya … NTV Reporting

What’s the problem? Extremely low performance
SACMEQ Math 2007: Proportions of Grade 6 students scoring at “Pre-,
Emergent and Basic Numeracy”, “Beginning”, “Competent” and “Skilled”
levels
-100
-80
-60
-40
-20
0
20
40
60
80
100
Mathematically skilled, Concrete and Abstract problem solving (Levels 6,7,8)
Competent (Level 5)
Beginning numeracy (Level 4)
Pre, Emergent and Basic numeracy (Levels 1,2,3)

What’s the problem? Extremely low performance
PASEC Math 2014: Proportions of Late Primary students scoring at “Level
1 and Below” levels
-100
-80
-60
-40
-20
0
20
40
60
80
100
Level 1 and below Level 2 Level 3

How much does money matter?
Primary math test scores vs. public
education spending
Malawi Primary School Leaving Exam
(PSLE) pass rate vs. per-student spending
Source: Bruns, Filmer and Patrinos 2011.
-20
-15
-10
-5
0
5
10
15
20
-20 -10 0 10 20No
rmal
ize
d p
rim
ary
test
sco
re
(co
ntr
oll
ing
for
GD
P p
er
cap
ita)
Spending on primary (controlling for GDP per capita)
Normalized primary test score (controlling for GDP per capita)
Predicted Normalized test score
0
0.2
0.4
0.6
0.8
1
6.5 7.5 8.5 9.5
Pri
mar
y Sc
ho
ol L
eavi
ng
Exam
Pas
s R
ate
Per student spending (log)

Service Delivery Indicators Surveys
9
• School and health facility surveys to understand what happens inside the service delivery units
• Nationally representative sample, also disaggregated by rural/urban and by public/private
• Consistent methodology for comparable data across countries and repeatedevery 2-3 yrs
• Implementation by national research institutes
SDI Pipeline
SDI Implemented
KENYA
TANZANIA
MOZAMBIQUE
NIGERIA
UGANDATOGO
SENEGAL
NIGERMALI
DRC

Service Delivery Indicators Surveys
10
• Implemented in 7 countries -- representing the service delivery experience of roughly 350 million people
• Pipeline for 2015/16
• Publicly launched in 4 countries (+2 pilots); 2 more currently being planned SDI Pipeline
SDI Implemented
KENYA
TANZANIA
MOZAMBIQUE
NIGERIA
UGANDATOGO
SENEGAL
NIGERMALI
DRC

11
What does SDI measure?
What providers know What providers do What providers have to work with

Results Chain and Data Sources
12
Quality of
Policies &
Institutions
Quantity and
Quality Services
Delivered
Learning
Outcomes
+
SACMEC,
PASEC,
TIMSS,
Uwezo,
Beekunko
Service Delivery Indicators
SABER
(Policy, Legal and Institutional
Framework)
EMIS
Inputs
Quality of
Policy
Implementation
SDI Surveys
13
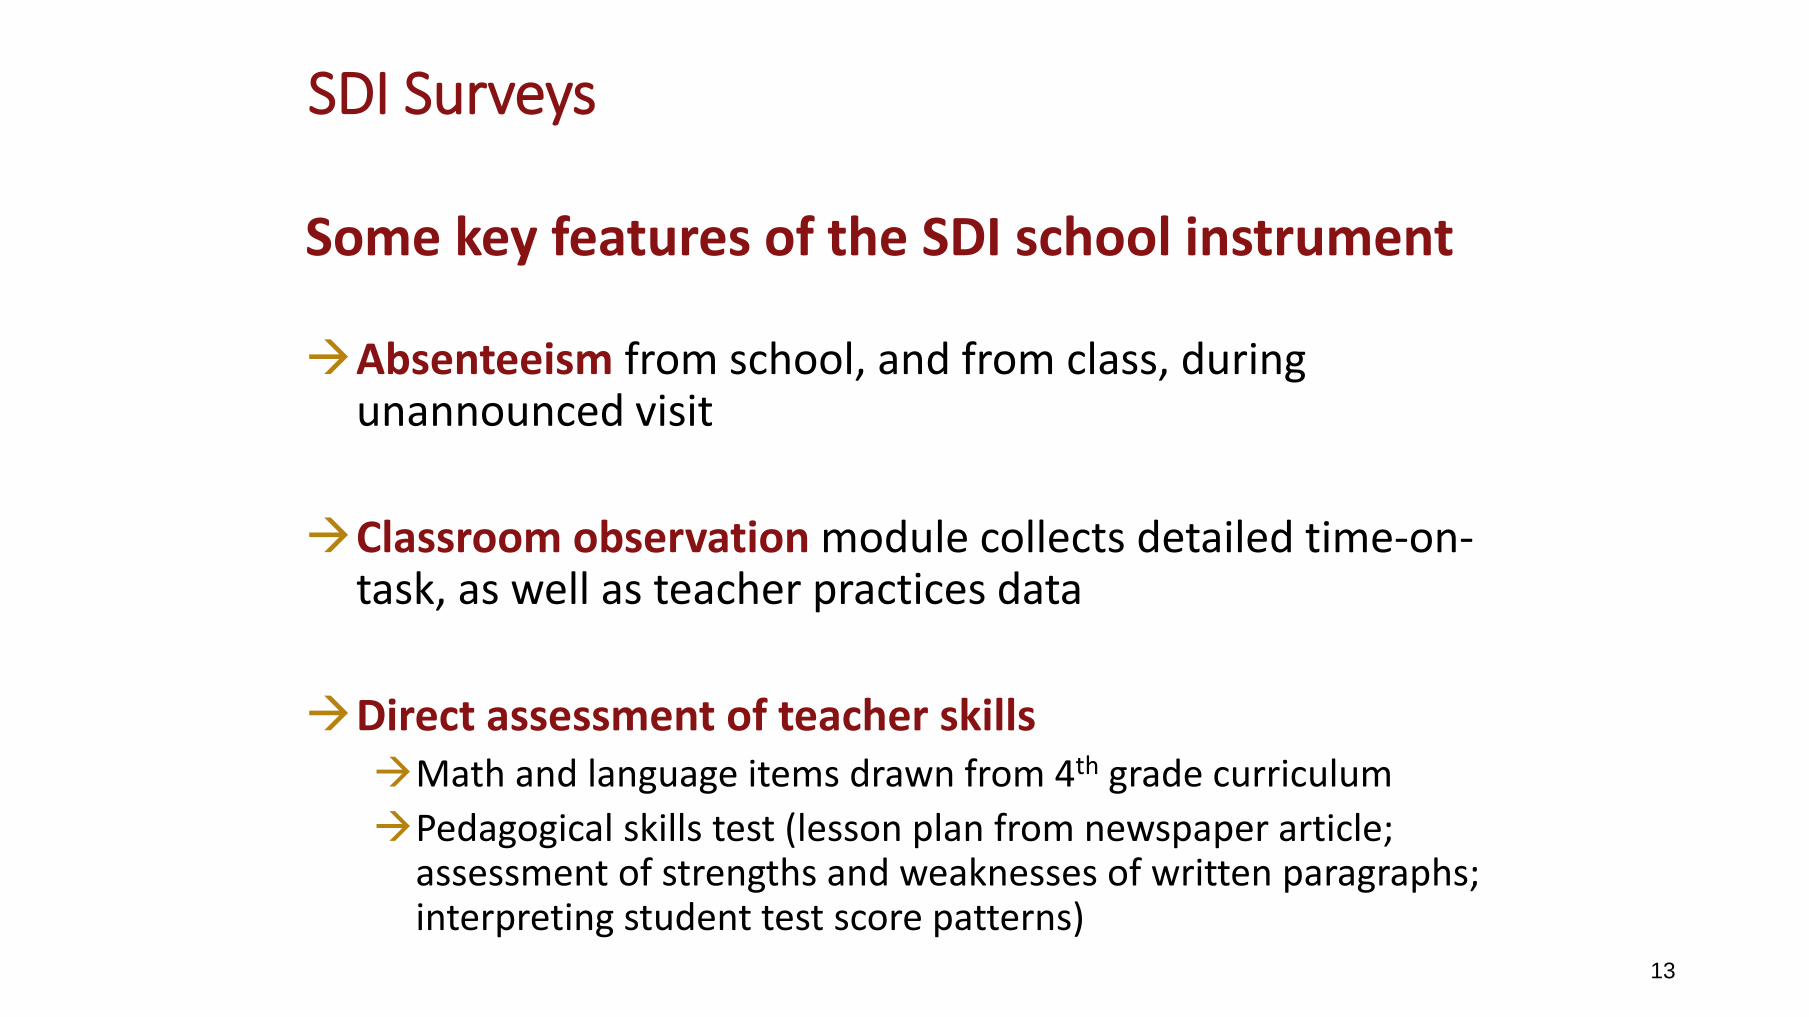
Some key features of the SDI school instrument
Absenteeism from school, and from class, during unannounced visit
Classroom observation module collects detailed time-on-task, as well as teacher practices data
Direct assessment of teacher skillsMath and language items drawn from 4th grade curriculum
Pedagogical skills test (lesson plan from newspaper article; assessment of strengths and weaknesses of written paragraphs; interpreting student test score patterns)

SDI Findings: Absenteeism
42.1
56.2
47.3
22.8
29.0
53.0
46.7
39.3
56.9
20.1
44.8
15.2 16.9 18.0
23.0
15.3
22.6
29.9
0
10
20
30
40
50
60
Ab
sen
ce r
ate
(pe
rce
nt)
Classroom absence rate School absence rate
* Nigeria is 4 States

Contributors to low teaching:
Kenya: Average teacher absence and time spent teaching (in hours:minutes)
On average, remaining teaching time per day is approximately 2h 25mins, less than half
of the schedule time. The main source of leakage is due to teachers in schools but
absent from classrooms.
5:41
0:53
1:31
0:52
2:25
0:00
1:00
2:00
3:00
4:00
5:00
6:00
Scheduledteaching time
Absent fromschool
In school butabsent from class
In class but notteaching
Teaching
Tim
e (H
ou
rs:M
inu
tes)

SDI Findings: Time spent teaching
5:31
4:17
5:31
4:44 4:365:12
5:545:28
7:13
2:53
1:41
2:30
3:10 3:15
2:04
2:573:15
2:56
0:00
1:00
2:00
3:00
4:00
5:00
6:00
7:00
8:00D
aily
tea
chin
g/l
earn
ing
tim
e (h
ou
rs:m
inu
tes)
Scheduled teaching time Time spent teaching per day
* Nigeria is 4 States

Percent of time officially allocated to schooling; when a teacher is present at school; and spent in teaching and learning activities
0
20
40
60
80
100
Pe
rce
nt
Official time Presence time Time on task
Lost teaching time

Time spent learning in Mozambique
What are students doing when teachers are on task?
Pupil learning time, 38%
Pupil in class, not paying
attention, 5%
Pupil absence, 56%

SDI Findings: Teacher skills in public schools
Average SDI
Kenya2012
Mozambique2014
Nigeria*2013
Tanzania2014
Togo2013
Uganda2013
Minimum knowledge(At least 80% in language and mathematics)
12.7 34.8 0.3 2.4 15.6 0.9 10.1
Average test score(language, mathematics, and pedagogy); “Full marks” is 100.
42.0 55.6 26.9 30.5 46.6 33.9 43.3
* Nigeria is 4 States

Heterogeneity in teacher test scores
Distribution of test scores
in Mozambique
Sensitivity of “Minimum
Knowledge” to cutoff score
in Tanzania
0
0.1
0.2
0.3
0.4
0.5
0.6
0.7
0.8
0.9
1
0102030405060708090100
Pro
po
rtio
n o
f te
ach
ers
Score for Minimum Knowledge (%)
English Maths Pedagogy
Average Portuguese
PedagogyMath

Private versus public schools
15
17
15
23
30
11
67
16
14
0
5
10
15
20
25
30
35
Absence from school (%)
Public Private
47
23
47
39
57
29
10
42
28
41
0
10
20
30
40
50
60
Absence from Class (%)
Public Private
3:44
4:23 4:19
3:43
4:27
2:30
3:102:57
3:15
2:56
0:00
1:00
2:00
3:00
4:00
5:00
Time teaching (hours:minutes)
Private Public
53
8
21
3
15
35
2
16
1
10
0
10
20
30
40
50
60
Minimum knowledge (%)
Private Public
* Nigeria is 4 States

• Trying to get more out of the data …recognizing the cross-sectional nature of the data
Service Delivery matters for learning outcomes
22

Service Delivery Quality Matters:
23
89
61
8481
52
87
28
6
38
67
28
37
78
46
52
75
41
58
KE Read NG Read UG Read KE Math NG Math UG Math
Stu
de
nt Te
st
Sco
re
Best Schools
In top deciles of teacher presence, and subject knowledge, and in bottom decileof pupil/teacher ratio
Average schools
In 45th-55th percentile of teacher presence, and subject knowledge, and pupil/teacher ratio
Worst Schools
In bottom deciles of teacher presence, and subject knowledge, and in top ventileof pupil/teacher ratio.
Within country differences: learning outcomes between a country’s best and worst schools differ by as much as 60 points
(sd=34) (sd=34) (sd=35)
Kenya Nigeria Uganda

24
89
61
8481
52
87
28
6
38
67
28
37
78
46
52
75
41
58
0
10
20
30
40
50
60
70
80
90
KE Read NG Read UG Read KE Math NG Math UG Math
Stu
dent Test S
core
(sd=20)
Best Schools
In top deciles of teacher presence, and subject knowledge, and in bottom decile of pupil/teacher ratio
Average schools
In 45th-55th percentile of teacher presence, and subject knowledge, and pupil/teacher ratio
Worst Schools
In bottom deciles of teacher presence, and subject knowledge, and in top ventile of pupil/teacher ratio.
Service Delivery Quality Matters:
Between country differences: learning outcomes in Nigeria’s best are worse than the outcomes in Kenya's worst schools
(sd=19) (sd=21)
Kenya Nigeria Uganda

• Trying to get more out of the data …recognizing the cross-sectional nature of the data
What happens in the classroom matters for learning outcomes
25
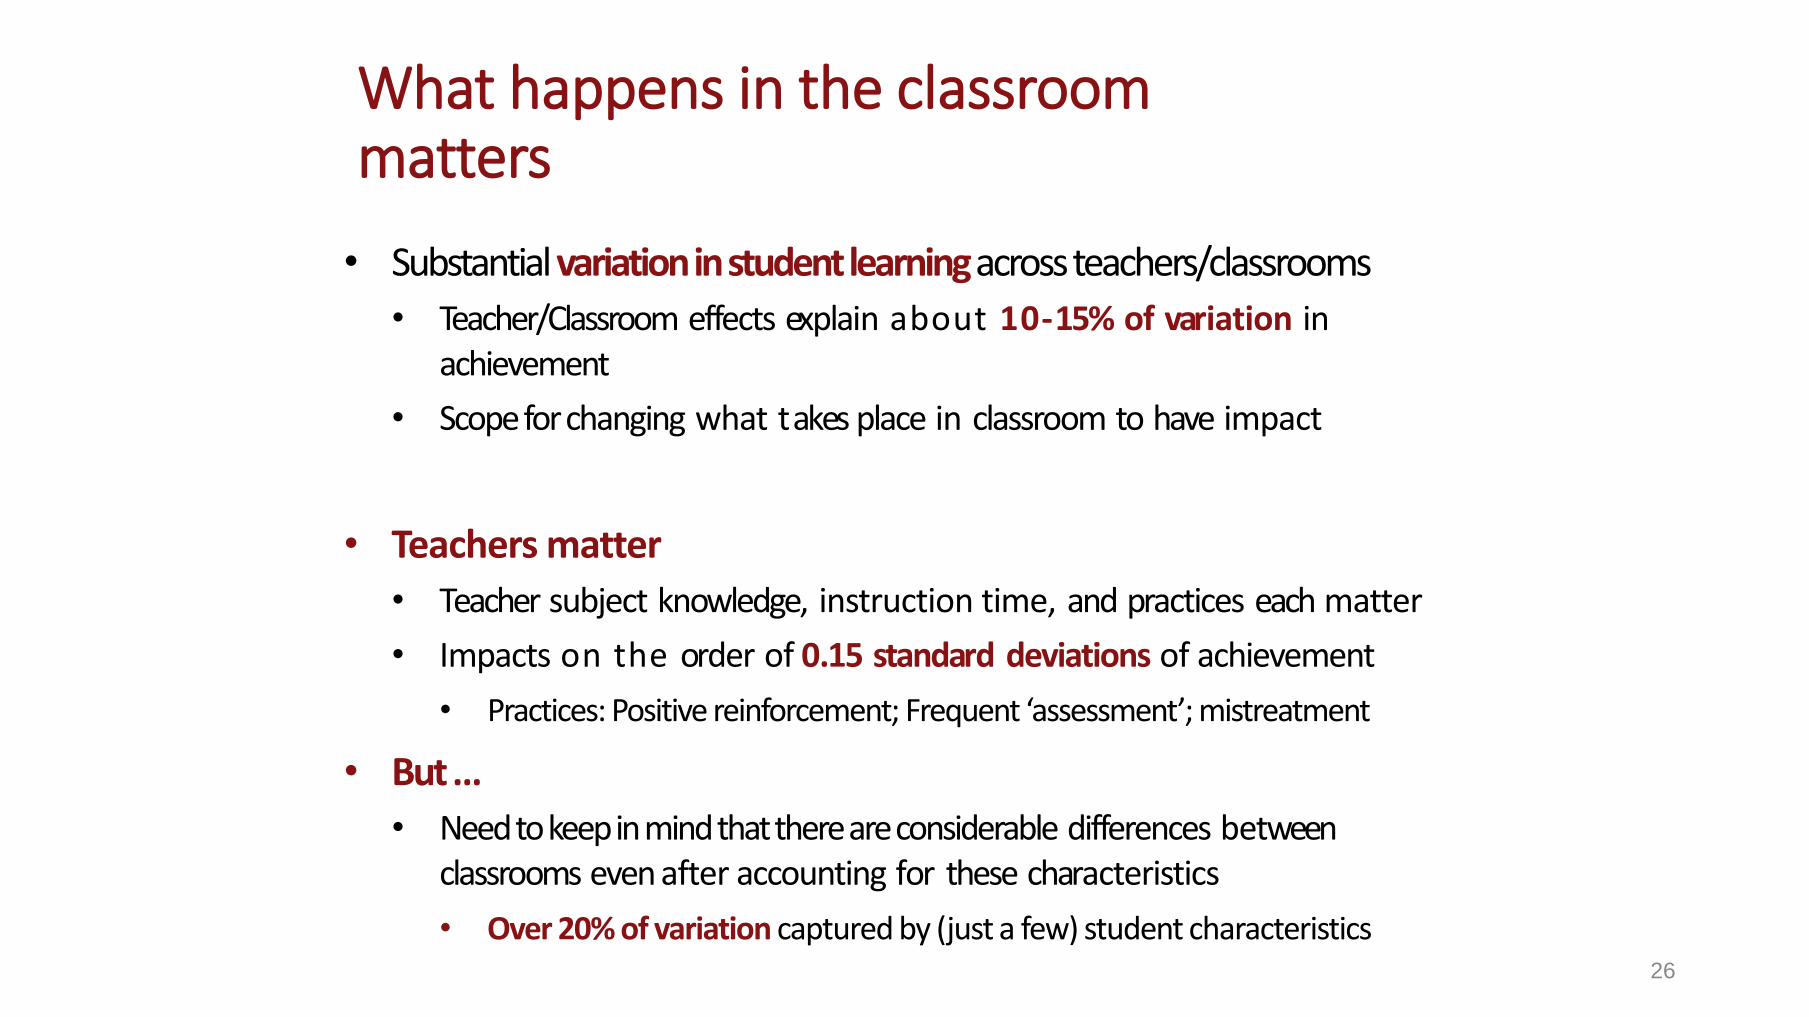
What happens in the classroom matters
• Substantial variation in student learning across teachers/classrooms
• Teacher/Classroom effects explain about 10-15% of variation inachievement
• Scope for changing what takes place in classroom to have impact
• Teachers matter
• Teacher subject knowledge, instruction time, and practices each matter
• Impacts on the order of 0.15 standard deviations of achievement
• Practices: Positive reinforcement; Frequent ‘assessment’; mistreatment
• But …
• Need to keep in mind that there are considerable differences betweenclassrooms even after accounting for these characteristics
• Over 20% of variation captured by (just a few) student characteristics26

Using SDI Data
Not just a research/technical exercise
Moving students up in within the existing distribution of test scores is only one part of the challenge
An important part of SDI is injecting data into national debate—to help foster change that could move the entire distribution up

28http://www.economist.com/news/middle-east-and-africa/21596981-paid-private-
schools-are-better-value-money-free-sort-classroom http://www.bbc.com/news/business-25304848
http://www.newvision.co.ug/news/655416-teacher-absenteeism-pupils-best-placed-to-
fight-vice.html
http://www.independent.co.ug/news/news-analysis/8993-why-
ugandan-pupils-dont-learn
http://www.ippmedia.com/frontend/?l=65875

29
Tanzania• 2011: SDI results were presented at a Cabinet retreat: Minister of Education starts doing
unannounced visits to schools and confirms SDI’s findings
• Feeds into environment of national reflection on need for reform (informed by UWEZO results; pass rates from primary school levers exam)
• April 2013: Presidential initiatives use data as diagnostics during planning for major reforms:
Reform Compact and Big Results Now!
• June 2014: SDI indicators feed into and use to track performance of Government of Tanzania and World Bank/ project valued $122 million.

0:00
1:00
2:00
3:00
4:00
Dai
ly t
each
ing
/lea
rnin
g ti
me
(h
ou
rs:m
inu
tes)
SDI 2010 SDI 2014
Service Delivery Quality can change
Improvements in Tanzania
• In teachers’ effort… • … which led to more teaching time
23%
53%
36%
68%
20%
50%
14%
47%
14%
45%
14%
47%
Sch
oo
l ab
sen
ce
Cla
ssro
om
ab
sen
ce
Sch
oo
l ab
sen
ce
Cla
ssro
om
ab
sen
ce
Sch
oo
l ab
sen
ce
Cla
ssro
om
ab
sen
ce
Tanzania Urban Rural
SDI 2010 SDI 2014

Leadership and
Governance
Information
Service Delivery
Health/
Education
Workforce
Materials
Financing
Key services
Infrastructure availability
Provider knowledge
Pupil Teacher Ratio
Financial management
Facility records
Financial management tools
Staff size per facilityAbsence rate
Teacher training
Equipment availability
Textbooks
User fees
Gov. expenditures reaching facility
Delays in salaries
Community/donor financing
Management and supervision
Community participation
Financial accountability
31
SDI surveys collect more than just the
indicators …

Reasons for Absence
Kenya Mozambique Nigeria Togo Uganda
Sick 15 31 22 11 18
Maternity 5 8 12 1 4
In training 5 4 14 1 2
Other approved absence 59 29 27 18 30
Pick up salary 2 12 5 1 2
On strike 2 0 6 34 1
Not approved 5 8 8 18 26
Other /DK 9 10 5 18 16
32

Thank you