
System Dynamics and the Electric Power Industry
29
System Dynamics and the Electric Power Industry Andrew Ford a Jay Wright Forrester Prize Lecture, 1996 Abstract System dynamics has been used extensively to aid in resource planning in the electric power industry. The many applications constitute a major body of work that has proven useful to large and small power companies as well as to government agencies at the local, state and federal level. The work has been performed by utility analysts, government planners, consultants and academics. One of my recent publications on electric power was honored with the 1996 Jay Wright Forrester Award. This article documents the major points in my award address to the 1996 International System Dynamics Conference. It summarizes the impressive body of work that system dynamics practitioners have accumulated over the past several decades. It gives my interpretation of the important and unique features of the system dynamics approach. I argue also that we have contributed to useful change in the electric power industry. © 1997 by John Wiley & Sons, Ltd. Syst. Dyn. Rev. 13, 57–85, 1997 (No. of Figures: 9 No. of Tables: 4 No. of Refs: 54) Introduction, purpose and acknowledgments This article tells a story of electric power in the U.S.A. It is organized chronologically starting with the birth of the industry in the 1880s. I will explain the main historical developments that gave rise to a capital intensive, price regulated power sector in the United States. I will pay particular attention to the difficult “energy crisis” years of the 1970s. I will explain how the industry survived the difficult years, and I will summarize some of the factors behind the current interest in deregulation. This article was prepared for the System Dynamics Review with several goals in mind. First, I wish to carry on the useful tradition established by Khalid Saeed (1996) in providing a written documentation of the Jay Wright Forrester Award Lecture. Next, I would like to provide a gateway to an impressive body of work for system dynamicists interested in energy. Finally, and most importantly, I wish to share my reflections on why system dynamics practitioners have been successful in this industry. I will argue that our success has arisen primarily from the power of system dynamics to help us “see the feedback” at work in the system. This feature, more than any other feature, has allowed system dynamics practitioners to make a useful and unique contribution to the industry. The Jay Wright Forrester Award is truly an important honor. I want to thank Professor John Sterman and his colleagues on the award committee for honoring my work on electric power. And I especially wish to thank Professor Jay Forrester and a Program in Environmental Science and Regional Planning, Washington State University, Pullman, WA 99164-4430, U.S.A. Andrew Ford is associate professor of environmental science and regional planning at Washington State University. He was formerly a staff member of the Energy Systems and Policy Group, Los Alamos National Laboratory, and associate professor of systems management at the University of Southern California. At WSU, he teaches system dynamics modeling with an emphasis on environmental issues in the West. System Dynamics Review Vol. 13, No. 1, (Spring 1997): 57–85 Received November 1996 © 1997 by John Wiley & Sons, Ltd. CCC 0883-7066/97/010057–29 $17.50 Accepted November 1996 57
Transcript of System Dynamics and the Electric Power Industry

System Dynamics and the Electric Power Industry
Andrew Forda
Jay Wright Forrester Prize Lecture, 1996
Abstract
System dynamics has been used extensively to aid in resource planning in the electric powerindustry. The many applications constitute a major body of work that has proven useful tolarge and small power companies as well as to government agencies at the local, state andfederal level. The work has been performed by utility analysts, government planners,consultants and academics. One of my recent publications on electric power was honoredwith the 1996 Jay Wright Forrester Award. This article documents the major points in myaward address to the 1996 International System Dynamics Conference. It summarizes theimpressive body of work that system dynamics practitioners have accumulated over the pastseveral decades. It gives my interpretation of the important and unique features of the systemdynamics approach. I argue also that we have contributed to useful change in the electricpower industry. © 1997 by John Wiley & Sons, Ltd. Syst. Dyn. Rev. 13, 57–85, 1997
(No. of Figures: 9 No. of Tables: 4 No. of Refs: 54)
Introduction, purpose and acknowledgments
This article tells a story of electric power in the U.S.A. It is organizedchronologically starting with the birth of the industry in the 1880s. I will explainthe main historical developments that gave rise to a capital intensive, priceregulated power sector in the United States. I will pay particular attention to thedifficult “energy crisis” years of the 1970s. I will explain how the industry survivedthe difficult years, and I will summarize some of the factors behind the currentinterest in deregulation.
This article was prepared for the System Dynamics Review with several goals inmind. First, I wish to carry on the useful tradition established by Khalid Saeed(1996) in providing a written documentation of the Jay Wright Forrester AwardLecture. Next, I would like to provide a gateway to an impressive body of work forsystem dynamicists interested in energy. Finally, and most importantly, I wish toshare my reflections on why system dynamics practitioners have been successful inthis industry. I will argue that our success has arisen primarily from the power ofsystem dynamics to help us “see the feedback” at work in the system. This feature,more than any other feature, has allowed system dynamics practitioners to make auseful and unique contribution to the industry.
The Jay Wright Forrester Award is truly an important honor. I want to thankProfessor John Sterman and his colleagues on the award committee for honoring mywork on electric power. And I especially wish to thank Professor Jay Forrester and
aProgram in Environmental Science and Regional Planning, Washington State University, Pullman, WA99164-4430, U.S.A.
Andrew Ford isassociate professor ofenvironmental scienceand regional planningat Washington StateUniversity. He wasformerly a staffmember of the EnergySystems and PolicyGroup, Los AlamosNational Laboratory,and associateprofessor of systemsmanagement at theUniversity ofSouthern California.At WSU, he teachessystem dynamicsmodeling with anemphasis onenvironmental issuesin the West.
System Dynamics Review Vol. 13, No. 1, (Spring 1997): 57–85 Received November 1996© 1997 by John Wiley & Sons, Ltd. CCC 0883-7066/97/010057–29 $17.50 Accepted November 1996
57

his colleagues from MIT for developing the methodology of system dynamicswhich made my work on electric power possible.
System dynamics applications to electric power
Table 1 lists 33 publications on the applications of system dynamics to electricpower.1 The table begins with the national energy modeling project, which hasbeen led by Roger Naill and his colleagues from The AES Corporation in Arlington,Virginia. Naill became interested in the energy problem with his masters researchon the exploration and production of natural gas. His thesis was completed in 1972,the year before the 1973 oil embargo. Naill published his natural gas results inToward Global Equilibrium (Naill 1973). He then expanded the model to includeoil, coal and other fuels. The models were national in scope and designed tosimulate policies that would aid the U.S.A. to reduce its dependence on foreign oil.Naill moved to the newly formed Department of Energy in the late 1970s. Heorganized the Office of Analytical Services to provide model-based support on USenergy policy. His team provided analytical support on a wide variety of energyissues during the difficult years of the 1970s, throughout the 1980s and into the1990s. His twin articles in the System Dynamics Review provide an excellentdescription of the model and its use at the Department of Energy.
Energy 2020, the second model listed in Table 1, is similar in design to thenational model used at the Department of Energy. Energy 2020 was developed byGeorge Backus and Jeff Amlin to deliver a multi-fuel model into the hands ofindividual energy companies and state agencies. The model has been used bydozens of governmental agencies across the United States and Canada, and themodel is now in use in several countries in Europe. The best descriptions appear inthe proceedings of the Energy 2020 users conferences listed in Table 1.
Table 1 gives four references on the Conservation Policy Analysis Model (CPAM)and the Resource Policy Screening Model (RPSM), two models used by resourceplanners at the Bonneville Power Administration. I developed these models withthe help of Jay Geinzer and Roger Naill from The AES Corporation. The best generaldescription appears in the April 1987 issue of Energy Policy. The OperationsResearch article is noteworthy for its description of uncertainties in the Northwestpower system.2
Three articles on electric cars and their impacts on the electric utility companyare listed next in Table 1. This research used system dynamics to simulateautomobile purchase decisions by consumers (i.e., gasoline cars or electric cars?).The important feature of the model was the integration of vehicle choice with amodel of the power company. The model was used to argue against utility
58 System Dynamics Review Volume 13 Number 1 Spring 1997

Table 1. Systemdynamics applicationsto electric power
The national model (Fossil2, Ideas)Naill, Managing the Energy Transition, Ballinger, 1977Naill and Backus, Technology Review, July 1977Naill et al. System Dynamics Review, Winter 1992Naill, System Dynamics Review, Summer 1992The AES Corp, An Overview of the Ideas Model, Oct 1993
Individual companies and state agencies (Energy 2020)Backus and Amlin, Proceedings of the 1985 System Dynamics ConferenceSystematic Solutions Inc., Introduction to Energy 2020, Jan 1988Central Maine Power Company, The Energy 2020 Users Conference, June 1989
The Pacific Northwest Hydroelectric System (CPAM, RPSM)Ford, Bull and Naill, Energy Policy, April 1987Ford and Bull, System Dynamics Review, Winter 1989Ford and Geinzer, Energy Policy, May 1990Ford, Operations Research, July 1990
Electric cars and the electric utilityFord, Energy Policy, 1994Ford, System Dynamics Review, Spring 1995Ford, Public Utilities Fortnightly, April 1996a
Privatization (UK) and deregulation (USA)Bunn and Larsen, Energy Policy, May 1992Bunn, Larsen and Vlahos, Journal of the Operational Research Society, 1993Lyneis et al., Proceedings of the 1994 System Dynamics ConferenceBunn and Larsen, editors, Systems Modelling for Energy Policy, 1996Amlin and Backus, Utility Models for the New Competitive Electric Markets, 1996
System dynamics models at forums or workshopsEPRI Report on Utility Corporate Models (UMF-2), Oct 1981Los Alamos Report on Utility Regulatory-Financial Models, June 1983Stanford Report on Coal in Transition (EMF-2), Sept 1978Stanford Report on Elasticity of Energy Demand (EMF-4), Aug 1980Stanford Report on Markets for Energy Efficiency (EMF-13), Sept 1996Stanford Forum on Privatisation and Deregulation, in progress
Emerging areas (electricity & water)Aslam and Saeed, Electric Power in Pakistan, The 1995 ConferenceWang et al., Infrastructure in China, The 1995 ConferenceDyner and Bunn, Electric Power in Colombia, The 1996 ConferenceSunaryo et al., Watershed Management in Java, The 1996 ConferenceBarton and Pumandu, Water Utility Planning in Australia, The 1996 ConferenceFord, Water Uses on the Snake River, System Dynamics Review, 1996bShawwash and Russell, Water Management in Jordan, The 1996 Conference
sponsored financial incentive programs to promote electric vehicle sales. In myopinion, a better policy is a state run feebate program to promote the sale of any orall of the cleaner vehicles.
Ford: System Dynamics and the Electric Power Industry 59

Table 1 notes that the privatization of the government owned power industry inthe U.K. and the deregulation of the privately owned power industry in the U.S.A.have been the subject of systems dynamics investigations by Derek Bunn and ErikLarsen, by James Lyneis and by Jeff Amlin and George Backus. I will return to thereasons for the growing interest in deregulation later in the article.
The forum and workshop reports listed in Table 1 serve as a gateway to some ofthe “gray literature.” These reports are not as readily available as the journalarticles, but they often provide a richer and more practical account of the keyfeatures of the models. The reports from the Stanford University energy modelingforum are especially useful. They describe models used in situations where anenergy topic has been the focus of several modeling efforts. The forum conceptmakes good sense in light of Greenberger’s (1976) description of the many obstaclesto the informative use of models in the political process. Greenberger reviewed avariety of modeling approaches (including system dynamics) and a variety of casestudies where models had been misused. The review led him to propose “thedevelopment of a new breed of researcher/pragmatist — the model analyzer — ahighly skilled professional and astute practitioner of the art and science of third-party model analysis” (Greenberger et al. 1976, 339). The Stanford forum is a logicaland useful response to his proposal.
The final entries in Table 1 list system dynamics applications to electric powerplanning and water resource planning that have emerged in recent years. In severalcases, these models focus on a major river system where hydro-electric develop-ment and irrigated agricultural development have led to unexpected problems. I’llspeak to the importance of this emerging area at the conclusion of the article.
The body of work summarized in Table 1 is an impressive record of application,especially since the majority of the research was not initiated until the mid 1970s.To interpret properly this work, it is useful to review the history of electric powerin the U.S.A.
Electric power in the early years
Figure 1 shows a historical time line starting with the “birth” of the industry in1882 and concluding with the growing interest in deregulation in the 1990s. Table2 provides more details on the early years.3 One of the most importantdevelopments occurred in the 1880s during the debate over electric transmission .4
The debate is sometimes called the AC/DC debate. In technical terms it was adebate over AC (alternating current) transmission versus DC (direct current)transmission. In personal terms, it was a debate between the giants of the industry.
60 System Dynamics Review Volume 13 Number 1 Spring 1997
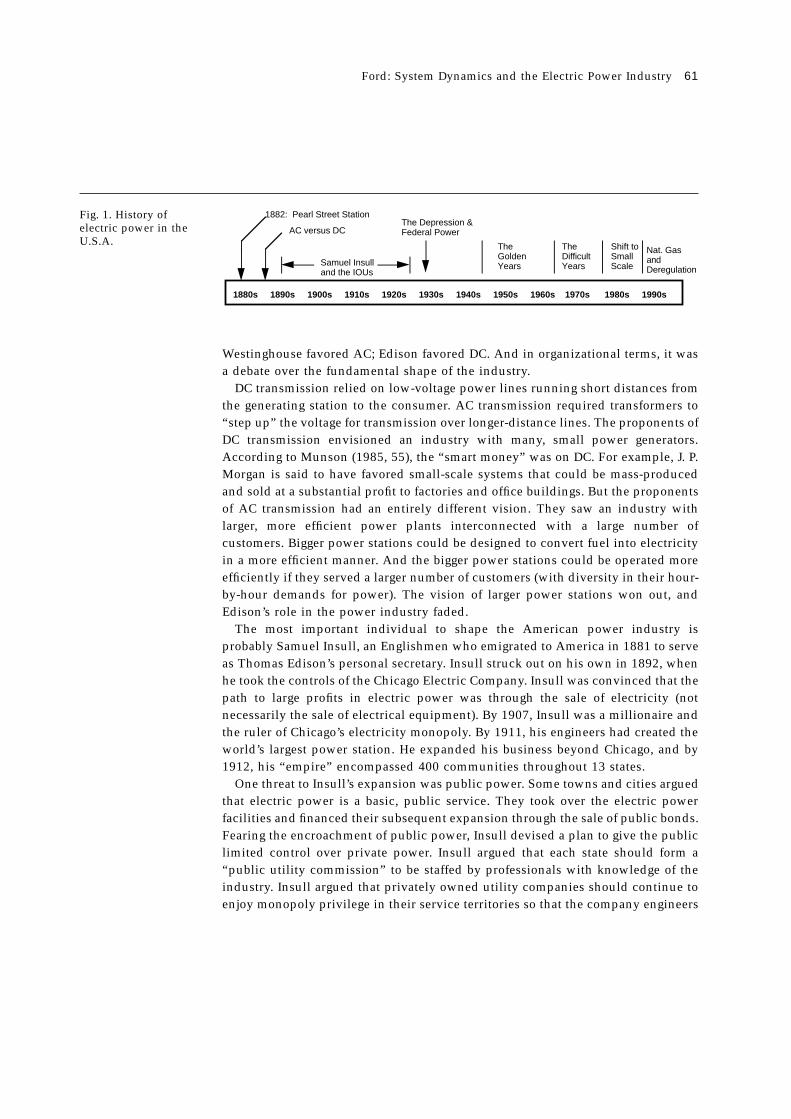
Fig. 1. History ofelectric power in theU.S.A. Shift to
SmallScale
TheDifficultYears
1880s 1890s 1900s 1910s 1920s 1930s 1940s 1950s 1960s 1970s 1980s 1990s
1882: Pearl Street Station
AC versus DC
Samuel Insull and the IOUs
The Depression &Federal Power
TheGoldenYears
Nat. GasandDeregulation
Westinghouse favored AC; Edison favored DC. And in organizational terms, it wasa debate over the fundamental shape of the industry.
DC transmission relied on low-voltage power lines running short distances fromthe generating station to the consumer. AC transmission required transformers to“step up” the voltage for transmission over longer-distance lines. The proponents ofDC transmission envisioned an industry with many, small power generators.According to Munson (1985, 55), the “smart money” was on DC. For example, J. P.Morgan is said to have favored small-scale systems that could be mass-producedand sold at a substantial profit to factories and office buildings. But the proponentsof AC transmission had an entirely different vision. They saw an industry withlarger, more efficient power plants interconnected with a large number ofcustomers. Bigger power stations could be designed to convert fuel into electricityin a more efficient manner. And the bigger power stations could be operated moreefficiently if they served a larger number of customers (with diversity in their hour-by-hour demands for power). The vision of larger power stations won out, andEdison’s role in the power industry faded.
The most important individual to shape the American power industry isprobably Samuel Insull, an Englishmen who emigrated to America in 1881 to serveas Thomas Edison’s personal secretary. Insull struck out on his own in 1892, whenhe took the controls of the Chicago Electric Company. Insull was convinced that thepath to large profits in electric power was through the sale of electricity (notnecessarily the sale of electrical equipment). By 1907, Insull was a millionaire andthe ruler of Chicago’s electricity monopoly. By 1911, his engineers had created theworld’s largest power station. He expanded his business beyond Chicago, and by1912, his “empire” encompassed 400 communities throughout 13 states.
One threat to Insull’s expansion was public power. Some towns and cities arguedthat electric power is a basic, public service. They took over the electric powerfacilities and financed their subsequent expansion through the sale of public bonds.Fearing the encroachment of public power, Insull devised a plan to give the publiclimited control over private power. Insull argued that each state should form a“public utility commission” to be staffed by professionals with knowledge of theindustry. Insull argued that privately owned utility companies should continue toenjoy monopoly privilege in their service territories so that the company engineers
Ford: System Dynamics and the Electric Power Industry 61

Table 2. History ofelectric power in theU.S.A.: the first eightdecades
1882 Pearl Street At 3:00 p.m.on Sept. 4, 1882, the “jumbo generator” at Station Pearl Street Station begins to spin. The electricity is
transmitted by DC lines to the Wall Street office of J. P.Morgan and to the editorial room of the New York Times.
1880s AC William Stanley invents the AC transformer to “step up”transmission to high-voltage transmission over longer lines.
George Westinghouse installs AC systems.
1880s AC versus The first major battle over the scale of power generation DC pits Westinghouse versus Edison. Edison (and J. P. Morgan)
favor small, mass-produced generators with DCtransmission. Westinghouse favors larger stations with AClines to a larger group of customers. Despite thecontroversy over the safety of AC, Westinghouse prevails.
1890s–1920s Samuel Insull builds a monopoly power company in Chicago. TheInsull organization of the private power industry in the U.S. isand the established. Monopoly privilege is given to promoteIOUs investment in large-scale generation. The electric rates are
subject to regulation by state commissions, which are toguarantee a fair return on investment. The companiesbecome known as Investor Owned Utilities or IOUs.
1930s–1940s Franklin The federal government invests in hydro-electric generationDelano in the Tennessee Valley and on the Columbia River. FederalRoosevelt financing permits large-scale hydro projects with multiple
uses. Aluminium smelters appear to fill the need for alarge-scale consumer of cheap power. But private powerfrom IOUs building mainly thermal generating units is therule for most of the U.S.A.
1940s–1960s Golden years Three decades of steady growth in demand and steadyimprovements in the $/kW cost and efficiency of larger andlarger power generation appear to confirm the value ofInsull’s organizational model. The period culminates withthe construction of extremely large coal plans (i.e.,3,000 MW). The industry also invests in nuclear powerstations using the light-water reactor technology. Somepower stations are so large that companies from severalstates must combine to finance construction.
could pursue economies of scale. But he argued that abuses of monopoly privilegecould be controlled by the state commissions. The commissions’ purpose was tooversee the electric rates charged by the power companies. Rates were to be fixedby the state commissions to allow the power company to recover its costs and toearn a reasonable profit. Utilities, for their part, would commit themselves tobuilding the power stations needed to serve the customers within their serviceterritory.
62 System Dynamics Review Volume 13 Number 1 Spring 1997

Fig. 2. Comparison oflarge and small powerplants
The golden years
Insull’s plan allowed privately owned power companies to grow and flourish in theU.S.A. The private companies became known as IOUs or investor-owned utilities.Today, the IOUs account for roughly 80% of electric power in the United States, abusiness with close to $1 trillion in assets (Electric Power Research Institute1996).
Insull’s plan set the stage for tremendous growth in the industry. The demand forelectric energy grew at around 7%/year, doubling the need for electricity everydecade. To keep pace with the rapidly growing demand, the IOUs turned to largerand larger power stations. Company engineers were successful in designing biggerand better power stations during the “golden years” of the 1940s, 1950s and 1960s.Each new wave of power stations allowed the retirement of older, less efficientpower stations. Regulatory commissions found themselves reviewing electric ratesthat were always sufficient. That is, the current rates, multiplied by currentelectricity sales, always generated the necessary revenues to pay this year’s billsand finance next year’s construction. Electric rates remained relatively constant (innominal dollars) over many decades as company engineers succeeded with biggerand better power plants. By the end of the golden years, power plants were comingon line at the immense size of 3,000 MW shown in Figure 2.
Ford: System Dynamics and the Electric Power Industry 63

The difficult years
The golden years came to an end in the 1970s. Industry engineers could no longerdeliver reductions in capital cost with larger power plants,5 and environmentalregulations were driving up the cost of fossil-fueled power stations. The Arab oilembargo of 1973 signaled the beginning of the “energy crisis,” and the 1970switnessed two major increases in oil prices. Higher oil prices translated into higherprices for coal and natural gas, so annual fuel bills rose dramatically. But the biggestproblem was the huge rate of inflation. By the end of the decade, the nation wasexperiencing “double digit” inflation, and utilities were hard hit by an even higherescalation in construction labor costs. Power plants were taking much longer tobuild, and their costs were much higher than in the golden years. Utilities foundthemselves with declining internal funds to help pay for construction. When theyturned to the Wall Street, they were confronted by unusually high costs of capital.6
The financial problems were painfully evident from the following headlines in thebusiness press:
Utilities: Weak Point in the Energy Future
Utilities Need Help — Now!
Con Edison: Archetype of the ailing utility
Electric industry cutback could result in blackouts
Faced with serious financial problems, some utility companies cut back on theconstruction of new power stations thought to be needed to serve future demand.Industry experts feared that the long, successful history of “keeping the lights on”was about to be broken.7 These problems are summarized in Table 3, whichcontinues the historical summary from the previous table.
Figures 3 and 4 use a stock and flow diagram to show the change in the financialsituation during the 1970s. Figure 3 shows numerical values representative of the“golden years.” The input variable is the capacity needed now, which is at 10 GW.8
The utility has 10 GW of installed capacity and another 4 GW of capacity underconstruction. If the construction lead time were around five years, the utilityplanners would look five years into the future to obtain the forecast of future need.Figure 3 shows this forecast at 14 GW based on the 7% annual growth that wascommon in the golden years. Figure 3 shows the utility with the needed 4 GWunder construction. A simple indicator of the financial challenge is to compare theconstruction work in progress with the book assets of the company. With newpower plants costing less than the older power plants, this utility would face the
64 System Dynamics Review Volume 13 Number 1 Spring 1997
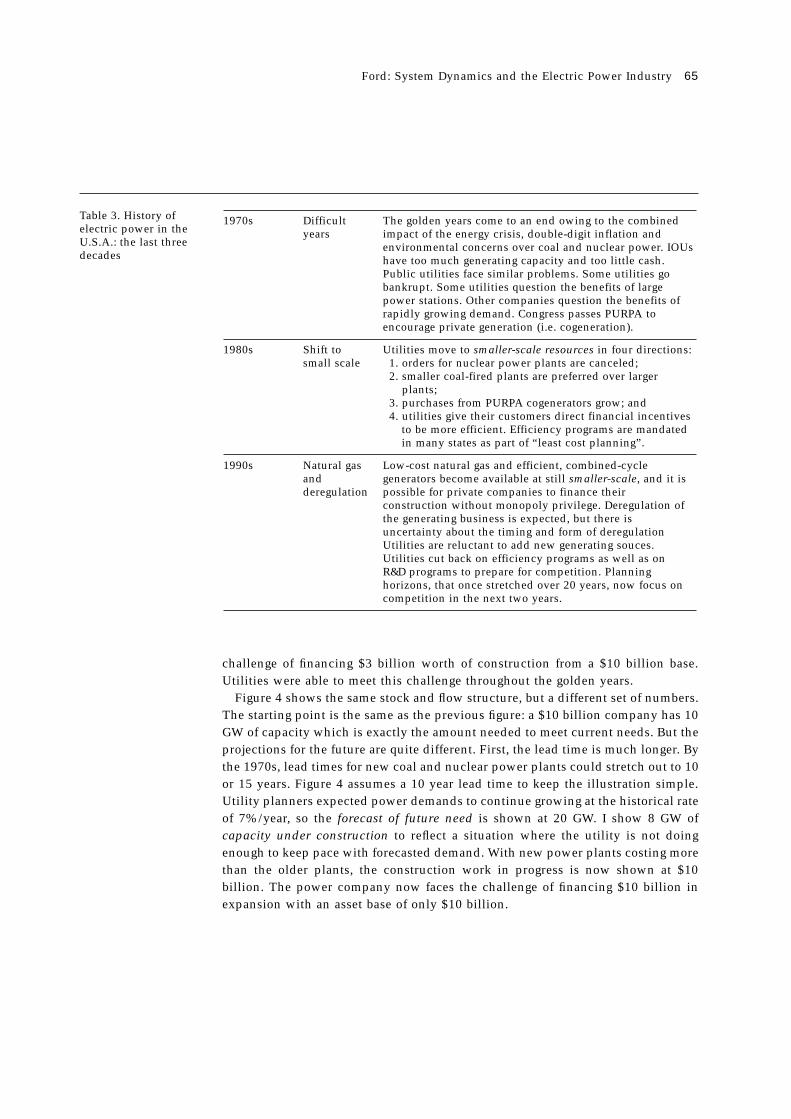
Table 3. History ofelectric power in theU.S.A.: the last threedecades
1970s Difficult The golden years come to an end owing to the combined years impact of the energy crisis, double-digit inflation and
environmental concerns over coal and nuclear power. IOUshave too much generating capacity and too little cash.Public utilities face similar problems. Some utilities gobankrupt. Some utilities question the benefits of largepower stations. Other companies question the benefits ofrapidly growing demand. Congress passes PURPA toencourage private generation (i.e. cogeneration).
1980s Shift to Utilities move to smaller-scale resources in four directions:small scale 1. orders for nuclear power plants are canceled;
2. smaller coal-fired plants are preferred over largerplants;
3. purchases from PURPA cogenerators grow; and4. utilities give their customers direct financial incentives
to be more efficient. Efficiency programs are mandatedin many states as part of “least cost planning”.
1990s Natural gas Low-cost natural gas and efficient, combined-cycle and generators become available at still smaller-scale, and it isderegulation possible for private companies to finance their
construction without monopoly privilege. Deregulation ofthe generating business is expected, but there isuncertainty about the timing and form of deregulationUtilities are reluctant to add new generating souces.Utilities cut back on efficiency programs as well as onR&D programs to prepare for competition. Planninghorizons, that once stretched over 20 years, now focus oncompetition in the next two years.
challenge of financing $3 billion worth of construction from a $10 billion base.Utilities were able to meet this challenge throughout the golden years.
Figure 4 shows the same stock and flow structure, but a different set of numbers.The starting point is the same as the previous figure: a $10 billion company has 10GW of capacity which is exactly the amount needed to meet current needs. But theprojections for the future are quite different. First, the lead time is much longer. Bythe 1970s, lead times for new coal and nuclear power plants could stretch out to 10or 15 years. Figure 4 assumes a 10 year lead time to keep the illustration simple.Utility planners expected power demands to continue growing at the historical rateof 7%/year, so the forecast of future need is shown at 20 GW. I show 8 GW ofcapacity under construction to reflect a situation where the utility is not doingenough to keep pace with forecasted demand. With new power plants costing morethan the older plants, the construction work in progress is now shown at $10billion. The power company now faces the challenge of financing $10 billion inexpansion with an asset base of only $10 billion.
Ford: System Dynamics and the Electric Power Industry 65

Fig. 3. The financialchallenge during the“Golden Years”
5years
14 GW
10 GWforecastof future
need capacityneeded
now
0.2 GW/yr1 GW/yr 0.8 GW/yr
4 GW
$ 3 billion
10 GW
$10 billion
$1 billion/GW$.75 billion/GW
currentcost of
capacity
embeddedcost of
capacity
assetsconst
work inprogress
retirement rate?O2@@@h
W2@0M?e?@@6K?e7<h?I46X?@?he?I/X@?hfN1@?hfJ53Lhe?W.YV/X?h?7H??N1?h?3L??J5?h?V/XW.Y?heN17Hhf?@3Lhf?@V/K??O2@6XfJ5?V4@@0M?I/K??O.Y
?V4@@0Y?
on line rateinitiation rate?O2@@@h
W2@0M?e?@@6K?e7<h?I46X?@?he?I/X@?hfN1@?hfJ53Lhe?W.YV/X?h?7H??N1?h?3L??J5?h?V/XW.Y?heN17Hhf?@3Lhf?@V/K??O2@6XfJ5?V4@@0M?I/K??O.Y
?V4@@0Y?
capacityunder
constructioninstalledcapacity
Forecasting Process:
The three fold increase in the financial challenge shown in Figures 3 and 4 shedslight on the dire news headlines listed previously. I should emphasize that theseheadlines were not necessarily exaggerating the problem. Indeed, the financingrequirements of the electric utility industry were so staggering, that one expertestimated that IOUs could require one-third of all new equity available each year tothe US business sector (Hass et al. 1974, 85).
The IOUs, the regulators and the death spiral
Faced with the challenge shown in Figure 4, the IOU executives turned to theregulators for help. They argued that they had kept their part of the “regulatorybargain” by expanding capacity decade after decade to serve the growing demandfor power. They asked the regulators to now “do their part” and raise the electricrates. The IOUs argued that higher rates were needed to cover increased operating
66 System Dynamics Review Volume 13 Number 1 Spring 1997

Fig. 4. The financialchallenge during the“Difficult Years”
10years
20 GW10 GW
forecastof future
need capacityneeded
now
0.2 GW/yr1 GW/yr 1 GW/yr
$10 billion
8 GW 10 GW
$10 billion
$1 billion/GW$1.25 billion/GW
currentcost of
capacity
embeddedcost of
capacity
assetsconst
work inprogress
retirement rateon line rateinitiation rate capacityunder
constructioninstalledcapacity
Forecasting Process:
costs and to help the company build its financial ratios to a sufficiently attractivelevel to regain the confidence of the financial community.
The regulators responded by implementing several regulatory changes to raisethe electric rates. (“Fuel clause” adjustments, for example, were implemented toautomate the changes in electric rates due to changes in the price of fossil fuels.)But the regulators were not sure that meeting all the IOUs’ requests for rateincreases would solve the problem. They asked about the likely consequence oflarge rate increases. Would not the higher rates depress the sale of electricity? Andcould lower electricity sales reduce the utility revenues? If this were to happen, theutility might return to the regulator for yet another rate increase. This vicious circleappeared in headlines as follows:9
Ford: System Dynamics and the Electric Power Industry 67

The Vicious Circle that Utilities Can’t Seem to Break:new plants are forcing rate increases —further cutting the growth in demand
The Electricity Curve Ball:declining demand and increasing rates
Figure 5 portrays the vicious circle, along with other feedback loops at work inthe system. This diagram is taken from a system dynamics study of the planningproblems of a hypothetical IOU. The study used computer simulation to portray theIOU’s problems under a wide variety of circumstances.10 Like many complexmodels, the IOU model contained hundreds of feedback loops. But the three loopsin Figure 5 stood out as most influential.
The “death spiral” in Figure 5 involves the electric rates and the consumers’reaction to the rates. The indicated price stands for the price of electricity thatregulators would normally allow to let the utility generate the allowed revenues.The actual price follows the indicated price after a delay for regulatory review. Ifthe actual price were to increase, one would expect a decline in electricityconsumption after a delay for consumers to react. Lower electricity consumptioncould then lead to an increase in the indicated price, an increase in the actual priceand further declines in electricity consumption.
The outer loop in Figure 5 shows a negative feedback loop. Starting with anincrease in the actual price, we would expect a decline in electricity consumption,a reduced forecast of capacity needs, reduced capacity initiations, reducedcapacity, a lower rate base, a reduced revenue target, a reduction in the indicatedprice, and a reduction in the actual price. Figure 5 labels this loop the “delayeddemand control loop” because its controlling influence is felt only after:
• a regulator’s delay to adjust prices,• a consumer’s delay to adjust electricity consumption,• a forecaster’s delay to adjust forecasts based on new trends; and finally• a construction delay for new generating capacity to come on line.
The third loop in Figure 5 is the construction loop. This is a goal-oriented, negativefeedback loop to represent the company’s desire to bring installed capacity intobalance with required capacity. This third loop includes only one delay, but thedelay can be quite long if the utility is building large coal or nuclear powerplants.
The spiral study revealed that utilities could find themselves in a difficult“downward spiral.” Their situation was especially difficult if their customers
68 System Dynamics Review Volume 13 Number 1 Spring 1997

Fig. 5. Key feedbackloops in the utilitysystem
reacted quickly and strongly to changes in the electric rate while they were stuckwith long lead time power plants under construction. Simply waiting for regulatorsto grant the requested rate increases would not necessarily solve their problems. Welearned that the utility could take steps on its own to soften the impact of the “deathspiral.” The best way to improve their situation was to shorten the length of theconstruction delay. This could be done by shifting investments from long lead timegeneration technologies (i.e., nuclear plants or large coal plants) to short lead timetechnologies (i.e., small coal plants, geothermal stations or wind machines). Wealso learned that the debilitating effects of the “death spiral” would be greatlyreduced if the IOU were expanding its system to keep pace with slow growth (i.e.,1–2 %/year) rather than the rapid growth of the “golden years.” Slower growth ratescould be achieved by utility conservation programs that would actively encouragetheir customers to invest in more efficient energy equipment.
1980s: the shift to small scale
The 1980s was a decade in which utilities shifted emphasis from large powerstations with long lead times to smaller, shorter lead time resources. Table 3 notesthat the move to smaller scale was manifest in:
• the cancellation of nuclear plants;• a shift to smaller coal plants;
Ford: System Dynamics and the Electric Power Industry 69

• an increase in cogeneration; and• an increase in utility conservation programs.
Nuclear power stations were ordered in great number in the 1960s and early 1970s.They were especially popular with coastal utilities far removed from the nation’scoal fields. These utilities invested in light water reactor stations because of aperceived advantage in total life cycle cost. But the high capital cost and long leadtimes made nuclear reactors one of the least attractive choices for the 1980s. Ordersfor new reactors fell to zero, and many plants were canceled part way through theirconstruction intervals. The cancellations occurred in both private and publicpower.11
Large coal-fired power plants also fell out of favor in the 1980s. The trend towardextremely large coal plants had led to the 3,000 MW example shown in Figure 2.But the long lead time and high capital costs made the super-large power stationsa poor choice for the 1980s. The 500 MW variety shown in Figure 2 became muchmore attractive for utilities facing major uncertainties in demand growth.
Cogeneration resources were also popular in the 1980s. Encouraged by thepassage of the Public Utility Regulatory Policy Act (PURPA) of 1978, privatecompanies invested in small scale machinery to produce both steam and electricenergy. These companies were able to sell their “extra electricity” back to the powerutility at a guaranteed rate. Cogeneration is attractive because the combinedgeneration of steam and electricity makes more efficient use of fossil fuels.Cogeneration purchases were also viewed as especially attractive to IOUs (and theirregulators) facing the problems of the “death spiral.”
The fourth and most dramatic shift in the 1980s took the form of increasedemphasis on conservation. Utilities no longer viewed a rapid growth in demand asdesirable for the company. They began to pay attention to how their customers usedelectric energy, and they discovered that electric energy was being consumed in ahighly inefficient manner. If their customers could be encouraged to use electricitymore efficiently, the pace of demand growth could be slowed, and utilities couldreduce the risks of carrying long lead time construction projects to completion.
Figure 6 dramatizes the northwest utilities’ commitment to conservation. Itshows the northwest wrapped in a thick blanket of insulation. Northwest utilitieswent from home to home to encourage their customers to take advantage of cost-effective measures like insulation. Utilities provided audits, loans and directfinancial incentives to encourage their customers to use energy more efficiently.These programs would have been inconceivable during the golden years. Indeed, itis probably hard for any manager to appreciate why a private company wouldencourage its customers to use less of its product. But, to their credit, utilitymanagers and regulators saw the wisdom in encouraging efficiency. They had
70 System Dynamics Review Volume 13 Number 1 Spring 1997

Fig. 6. Wrapping thenorthwest with cost-effective conservation.Reprinted withpermission. Source:Bonneville PowerAdministration
learned that it made good business sense to help customers plug the leaks in theirhouses. Helping to plug the leaks was much less risky than investing in long leadtime power plants.
The Bonneville model
I interrupt the historical review to provide a quick glimpse inside one of the modelsfrom Table 1. My purpose is to provide a few details to allow readers to appreciatethe difference between the system dynamics approach and the more commonapproach used by utility companies. I select the Bonneville conservation model fordiscussion, but readers should know that my main observations apply to allutilities, not just to Bonneville.
The Bonneville Power Administration was created in the 1930s when the federalgovernment invested in hydro-electric development on the Columbia River.Bonneville’s job is to market the electric power from federal resources in thenorthwest. Like many utilities, Bonneville encountered some serious difficulties inthe 1970s. Like many utilities, Bonneville too saw the wisdom of shifting to smallscale resources in the 1980s. Bonneville became a national leader in conservationprograms with the creation of a separate Office of Conservation in 1983. This Officeturned to system dynamics to provide analytical support for policy issues regardingthe magnitude, mix and timing of conservation programs.
Ford: System Dynamics and the Electric Power Industry 71

Fig. 7. Design of theConservation PolicyAnalysis Model
Figure 7 shows the sectoral design of “The Regional Model,” the first of severalmodels constructed for Bonneville. The diagram depicts five separate “sectors” tokeep track of electricity demand, capacity expansion planning, book keeping,system operations and the setting of electricity rates. The model was originallyconstructed in DYNAMO, and it will be appreciated that each “sector” is simply agroup of DYNAMO equations devoted to a different part of the system and that theinformation feedback loops will be automatically closed when the entire collectionof equations are simulated on the computer.The system operation sector is shown in Figure 8 to give a taste for some of themodeling details. Figure 8 shows a four-step procedure to calculate the annualoperating costs for the three groups of utilities in the northwest. Starting at the topof Figure 8, the sector conducts a regional comparison of the loads and resources.12
This comparison reveals the best way to balance the supply and demand for electricenergy for the entire region. In this illustration, the system would be balanced bythe sale of secondary energy to utilities outside the region (the shaded box at the topof Figure 8). The regional comparison yields “operating rules” that all utilities willfollow. In this example, utilities will run nuclear and coal plants at full availability,but oil- and gas-fired plants will remain idle. The separate balancing of loads andresources reveals that neither the IOUs nor the public utilities can satisfy theirdemands unless they place loads on Bonneville. Bonneville’s operations areportrayed at the bottom of Figure 8. Bonneville meets the loads from the directservice industries and, the loads from retail utilities, as well as having some extraenergy left over to sell on the secondary market.
72 System Dynamics Review Volume 13 Number 1 Spring 1997
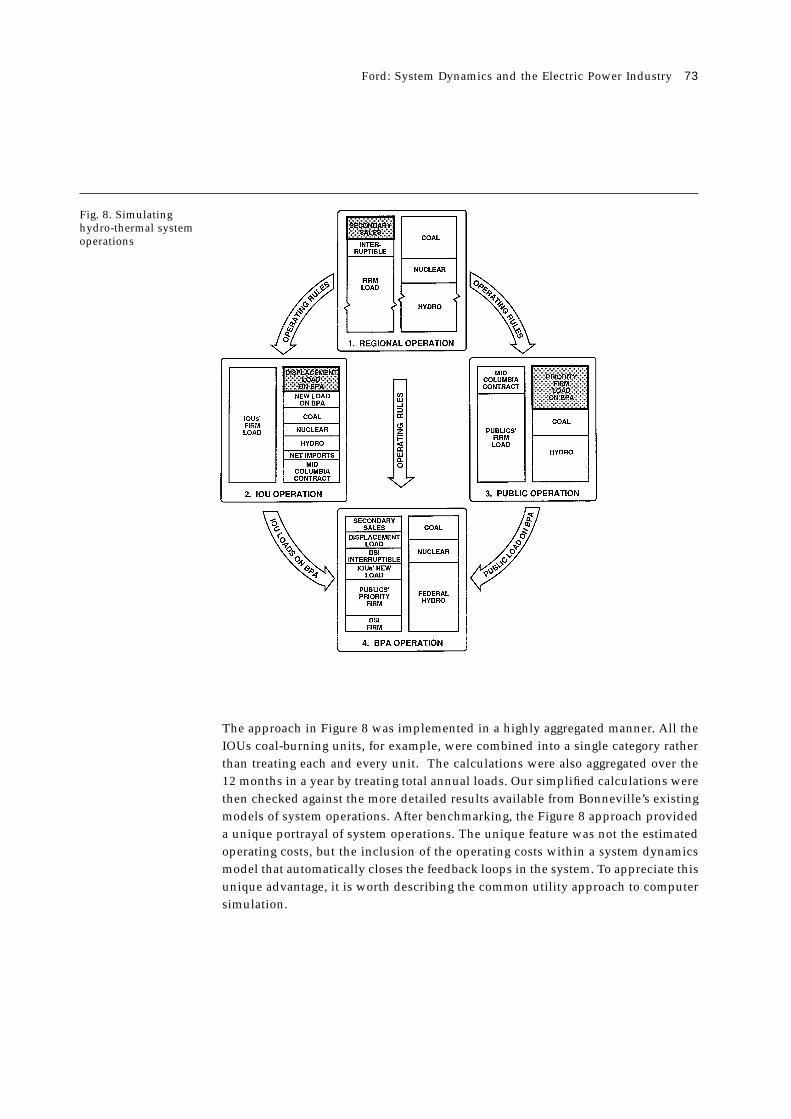
Fig. 8. Simulatinghydro-thermal systemoperations
The approach in Figure 8 was implemented in a highly aggregated manner. All theIOUs coal-burning units, for example, were combined into a single category ratherthan treating each and every unit. The calculations were also aggregated over the12 months in a year by treating total annual loads. Our simplified calculations werethen checked against the more detailed results available from Bonneville’s existingmodels of system operations. After benchmarking, the Figure 8 approach provideda unique portrayal of system operations. The unique feature was not the estimatedoperating costs, but the inclusion of the operating costs within a system dynamicsmodel that automatically closes the feedback loops in the system. To appreciate thisunique advantage, it is worth describing the common utility approach to computersimulation.
Ford: System Dynamics and the Electric Power Industry 73
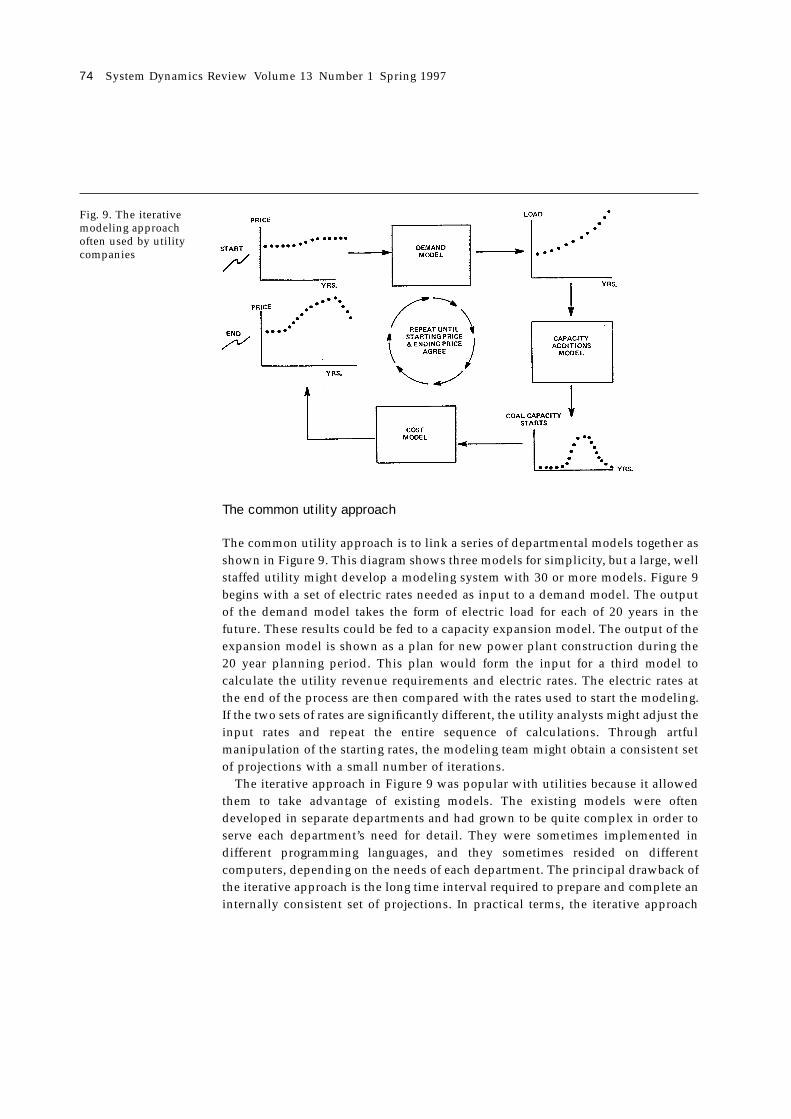
Fig. 9. The iterativemodeling approachoften used by utilitycompanies
The common utility approach
The common utility approach is to link a series of departmental models together asshown in Figure 9. This diagram shows three models for simplicity, but a large, wellstaffed utility might develop a modeling system with 30 or more models. Figure 9begins with a set of electric rates needed as input to a demand model. The outputof the demand model takes the form of electric load for each of 20 years in thefuture. These results could be fed to a capacity expansion model. The output of theexpansion model is shown as a plan for new power plant construction during the20 year planning period. This plan would form the input for a third model tocalculate the utility revenue requirements and electric rates. The electric rates atthe end of the process are then compared with the rates used to start the modeling.If the two sets of rates are significantly different, the utility analysts might adjust theinput rates and repeat the entire sequence of calculations. Through artfulmanipulation of the starting rates, the modeling team might obtain a consistent setof projections with a small number of iterations.
The iterative approach in Figure 9 was popular with utilities because it allowedthem to take advantage of existing models. The existing models were oftendeveloped in separate departments and had grown to be quite complex in order toserve each department’s need for detail. They were sometimes implemented indifferent programming languages, and they sometimes resided on differentcomputers, depending on the needs of each department. The principal drawback ofthe iterative approach is the long time interval required to prepare and complete aninternally consistent set of projections. In practical terms, the iterative approach
74 System Dynamics Review Volume 13 Number 1 Spring 1997

seldom resulted in a consistent set of projections.13 The more common approachwas simply to ignore the inconsistencies that arose from the lack of informationfeedback within the system.
Single-company models
Faced with the problems in Figure 9, some utilities developed a single computermodel to cover all aspects of the company. The models were frequently developedby outside consultants who had established their credibility with one of thedepartmental models. The single models were designed with a single programminglanguage and to reside on a single computer. They were successful in reducing thetime interval required to obtain a comprehensive projection, but the commonutility models were not successful in simulating the information feedback at workin the system. In a forum with 12 corporate models convened by the Electric PowerResearch Institute, for example, all but one of the models ignored the price feedbackloop shown in Figure 5 (Electric Power Research Institute 1981). And in aworkshop with 13 models of utility regulatory-financial problems, all but two of themodels ignored the price feedback loop shown in Figure 5 (Ford and Mann 1982).In both of these workshops, the exceptional models were system dynamicsmodels.
The first workshop was conducted in 1981 to compare “corporate models.” Theforum members agreed that the top-priority issue needing modeling support wasutility conservation programs. Each modeling team agreed to a common collectionof assumptions about inflation, economic growth, fuel prices, etc. Then each teamadopted a common description of a conservation program. Each team performed avariety of computer studies to show the simulated impact of the conservationprograms. The modeling results were arranged side-by-side to allow a broadcomparison. Each model’s results were labeled by letters (i.e., A, B, C) to preserveanonymity, but I can report that “Model D” was the system dynamics model. Theforum team compared the simulations with an eye toward general conclusionsabout modeling approaches. They were not out to label one result as “right” andanother as “wrong.” Rather, they wanted to learn if the differences in underlyingapproach would lead to qualitatively different findings. Their findings areespecially noteworthy to system dynamics practitioners because of the prominenceof “Model D”, the only system dynamics model at the forum. Remember that theforum members were especially well informed on corporate planning issues andcomputer simulation models. Also, remember that many of the modeling teams hadcommitted company resources to approaches other than system dynamics. Given
Ford: System Dynamics and the Electric Power Industry 75

the unusual qualifications and position of the members, their observations areworth repeating in detail:
Model D consistently displayed startlingly different and counterintuitive patterns ofbehavior — so much so that it quickly became the focal point of the Working Group’sefforts to compare model capabilities ... Model D was found to be less detailed,contain fewer equations (by far), and cost less to develop and run than the detailedmodels ... From this information alone, it might have been concluded that Model Dwas likely to be “inferior” to the larger models ... By the time the group hadcompleted a very probing assessment of Model D, a number of important changes inthe thinking of the group had occurred ... The underlying bases for the dynamicfeatures were highly intuitive, but were also likely to cause more rapid response anda greater degree of instability (i. e. large price elasticities reduced demand whichlowered revenues and led to a spiraling decline in financial performance) ... Overall,what initially could have been dismissed as an interesting but unsuccessfulexperiment in small model building came to be viewed as a potentially useful andpowerful corporate modeling tool.
I consider the forum report to be one of the most resounding endorsements ofsystem dynamics, and, of course, the report is a resounding endorsement of theteam from Florida Power and Light Company and Pugh Roberts Associates thatdeveloped Model D.14
The Florida team joined a dozen other utility modeling groups in a workshopconducted at the Los Alamos National Laboratory in 1982. The modelers assembledto review different approaches to simulating the financial problems that plaguedIOUs at the end of the 1970s. The number one issue was “regulatory reform,” ageneral term for a variety of proposals to improve utilities’ cash flow through higherrates or lower taxes. Thirteen models were represented, but only two of the modelsclosed the feedback loops shown in Figure 5. One was the Florida model; thesecond was my model of the “death spiral.” The workshop provided an opportunityto compare model designs and the modeling environments. The conventional view(from the 11 models without feedback) was that price feedback could be distractingto top management. Several of the most experienced modelers argued that utilitycompanies invested considerable time and expense arriving at their best demandforecast. The conventional view was that price feedback could confuse topmanagement because each new simulation might show a different pattern ofdemand growth. The conventional modelers also argued that closing the pricefeedback loop required them to specify the price elasticity of demand. Withuncertainties in the price elasticity, they suggested that closing the loop would bespeculative rather than informative. The Florida Power and Light team respondedto this criticism by acknowledging the importance of delivering a credible forecastto various commissions but they argued that they could turn to conventionalforecasting techniques to meet this need. They argued that they had an entirely
76 System Dynamics Review Volume 13 Number 1 Spring 1997

different goal in mind for the system dynamics model — their goal was to generateinsights, not numbers.
Personal reflections on system dynamics and electric power
The impressive body of work in Table 1 raises interesting questions about systemdynamics and electric power. Did any of us make a difference in the world? Anddid the system dynamics approach give us the power to make a difference? Ormight we conclude that system dynamics is simply a convenient tool in the handsof a lot of bright people?
My experiences in energy have convinced me that system dynamics is muchmore than a convenient modeling tool. I am convinced that system dynamics hasled the investigators listed in Table 1 to focus on the key feedback loops in theenergy system. Our training leads us to first “see the feedback” in our minds. Ourability to translate our mental models into computer simulation models allows usto test our ideas through computer simulation. My experiences with energyindustry modeling convinced me that the ability to simulate the informationfeedback in the system is a truly unique feature of the system dynamics approach.In the case of the electric power industry, the ability to simulate the interplay of thefeedback loops in Figure 5 proved to be an important and unique feature of systemdynamics.
But did we make a difference in the world? I have posed this question to manyof the investigators listed in Table 1, and I have asked myself if any of my ownstudies have led to concrete changes in the industry. The collective response to thisquestion is initially disappointing. None of us can point to a major piece oflegislation or a major investment project that was shifted in a useful directionbecause of one of our studies. But I believe that our contributions will not bemeasured in large, dramatic “victories.” Rather, we all contribute in a number ofsmall ways to gradually shift opinions in a useful direction. When the work inTable 1 is judged in this manner, I believe we can all take some credit forcontributing to useful change in the electric power industry. I believe thefundamental contribution of system dynamics has been to add a unique voice to themany voices calling for a shift to small scale resources in the 1980s.15 I believe theindustry shift to smaller coal plants, cogeneration and conservation was extremelybeneficial to the power companies, their stock holders and their customers. I alsobelieve the shift to small scale benefited the environment as well.
The 1990s: natural gas and deregulation
I turn now to the final decade in my historical account of electric power. Table 3
Ford: System Dynamics and the Electric Power Industry 77

Table 4. Northwestutilities’ marginalgenerating resourcesin the 1990s
Marginal early 1990s: late 1990s: Changegenerating coal gasifier & natural gas firedresource for combined cycle combined cyclethe Northwest combustion turbine
Typical size 420 MW 228 MW 46% smaller
Lead time 7 years 4 years 43% shorter
Capital cost 2,520 $/kW 684 $/kW 73% lower
Availability 80% 92% 15% larger
Efficiency 36% 47% 30% greater
Levelized cost 60 mills/kWh 30 mills/kWh 50% lower
Sulfur dioxide 0.04 tons/GWh 0.02 tons/GWh 50% smaller
Nitrogen oxides 0.50 tons/GWh 0.07 tons/GWh 85% smaller
Carbon dioxide 985 tons/GWh 497 tons/GWh 50% smaller
noted that the 1990s are dominated by the debate over deregulation. Industryleaders are now reexamining the organizational model established by Samuel Insullat the start of the century. They are challenging the basic assumption that a utilityneeds monopoly privilege to invest in electric power generation. Table 4 will helpus understand why these questions have been raised in the 1990s.
Table 4 lists the marginal generating resource appearing in the 1991 and 1996plans of the Northwest Power Planning Council (1996). These resources are calledupon after the region’s utilities have “used up” a variety of other resources such asconservation and small scale hydro. In the early 1990s, the marginal resource wasa combined cycle generating plant that would burn natural gas from a coalgasification unit. The typical unit would be 420 MW in size, take seven years tobuild, and cost the utility $2,520 per kW. The levelized cost of the electric energyis a life cycle measure of the combined costs of capital and fuel. Table 4 reports the1991 resource at 60 mills (6 cents) per kWh of energy delivered to the transmissionsystem.
Table 4 shows a major change in just five years. By 1996, the marginal resourcehad changed to a combined cycle combustion turbine that would burn natural gasdirectly.16 The typical unit would be only 228 MW in size, would take only fouryears to build, and would cost only $684 per kW. The levelized cost would fall toonly 30 mills/kWh. The gas-fired generator would be smaller, faster and cheaper;Table 4 shows that it would be cleaner as well.
When thinking about the need for monopoly privilege and state regulation, themost startling feature of Table 4 is the dramatic change in construction costs in justfive years. At $2,520 per kW, the 420 MW coal gasification facility would cost over$1 billion. But the typical 228 MW gas turbine would cost a little over $150 million.The proponents of deregulation are arguing that private companies should be able
78 System Dynamics Review Volume 13 Number 1 Spring 1997

to finance a $150 million investment without the need for monopoly privilege.They argue that now is the time to eliminate monopolies and state regulation ofelectricity generation. And many believe that deregulation is inevitable. They saythat the real debate is over the timing and extent of deregulation. Table 1 noted thatsystem dynamics models have been used in the debate over deregulation. The mostextensive work has been completed at the London Business School by Derek Bunnand Erik Larsen. Their work focuses on the shift from government owned power toa private power market in the UK.17
Water and power: an emerging area
System dynamics was first used in water resource planning in Hamilton’s (1969)study of river basin development. Table 1 showed a body of work on waterresources emerging in the 1990s. The examples include system dynamicsapplications in Pakistan, China, Colombia, Indonesia, Australia and Jordan. It isencouraging to see these many applications because water problems appear to be aserious challenge around the world. The severity of the problems is evident fromthe following comments from officials of the United Nations and World Bank:
Stressing that 1 billion people lacked adequate clean water supplies, UN officials onWednesday expressed fear that a war over water could erupt in the next 50 years.Water issues may be a contributing factor to breaking peace, like oil was in the pastsaid one UN official. A World Bank official blamed inefficient irrigation. He notedthat 80% of water is used for irrigation purposes in developing countries, but 45% ofit doesn’t even reach the plants. The World Bank official estimated that around $800billion would be needed to finance water investments in the developing countriesover the next decade. Lewiston Morning Tribune, June 6, 1996
My own research has shifted to water resource management in recent years. I liveand teach in the northwest, where huge rivers dominate the region. Listening to thedebates over competing visions for the rivers, I cannot help but “see the feedback”in the system. Further, my initial encounters with water resources modeling suggestthat the key feedback loops are left out of many of the conventional models. Finally,I cannot help but notice that debates over water use in the western United States arefrequently conducted in a hostile and adversarial manner.
I believe system dynamics can be put to good use in water resources, especiallywhere key feedback loops cross boundaries between disciplines. Where antagonistsare inclined to use models as “intellectual weapons” in water battles, systemdynamics practitioners can contribute with “management flight simulators” topromote group learning. My first effort in this direction was a group learning modelof the Snake River (Ford 1996b).
Ford: System Dynamics and the Electric Power Industry 79

Summary and conclusion
System dynamics practitioners have accumulated an impressive record of applica-tions in the electric power industry. System dynamics has given us a uniquecapability to “see the feedback” at work in the power system. Our work hascontributed to useful change in the power industry, and we are building a record onwater resource systems.
However, my main conclusion applies to all system dynamicists, not just thosestudying water or power. If you “see the feedback” at work in you own field, systemdynamics will give you the opportunity to contribute in a unique manner. May yourcontributions lead to better understanding and to a better world.
Acknowledgments
Much of the research described in this article grew out of a Dartmouth Collegeproject to apply system dynamics to the U.S. energy problem. Our Dartmouth yearswere an exciting period as students. We all benefited by learning system dynamicsfrom two exceptional teachers — Professor Dennis Meadows and ProfessorDonella Meadows.
Dartmouth graduates have helped each other in a variety of projects sincegraduation. I wish to acknowledge those Dartmouth graduates that have workedwith me on several major projects. They include Roger Naill, John Stanley-Miller,George Backus, Jay Geinzer, and Pat Barton.
My own understanding of electric power increased substantially when I had theopportunity to join the Corporate Planning Department of the Pacific Gas andElectric Company on a sabbatical. I wish to thank Mason Willrich for inviting meto PG&E for the sabbatical.
My work on electric power has been supported by government agencies at thelocal, state and federal level, and the work has been supported by public andprivate power companies. I appreciate the guidance from each of the projectmanagers, especially the ideas and support from Mike Bull, who guided our workfor the Bonneville Power Administration.
Notes
1. The 33 publications are not meant as an exhaustive list of system dynamics work onelectric power. Additional examples include Zepeda’s (1975) analysis of capacityexpansion cycles in the U.K. electric system and Rego’s analysis of the capacityexpansion in Argentina (Coyle 1996). The list does not cover the many examples ofsystem dynamics applications to energy problems in general. Examples include
80 System Dynamics Review Volume 13 Number 1 Spring 1997

interfuel substitution in Europe (Moxnes 1990), petroleum resource estimation inthe U.S.A. (Davidsen et al. 1990) and growth in an oil-dependent economy inIndonesia (Arif and Saeed 1989).
2. The Operations Research article was selected by the Jay Wright Forrester Awardcommittee. It describes the iterative use of a system dynamics model to portray thelong-term uncertainties in the electric system. We used formal statistical techniquesto limit the number of simulations required to obtain estimates of the toleranceintervals on model output. We used a FORTRAN program (Hypersens) originallydeveloped by Mike McKay at the Los Alamos National Laboratory and laterenhanced by George Backus for use with system dynamics models, many of ourcalculations could be conducted more easily today with Vensim (Arthur andEberlein 1996).
Our confidence intervals showed how uncertainties in both the demand forelectricity and the price of electricity would grow over time. We showed how theuncertainties are “shared” by the utilities in the northwest region. (The analysis wasparticularly important to the Bonneville Power Administration because it explainedhow Bonneville could end up with an unusually large share of the uncertainty.)Finally, and most importantly, the article described conservation programs thatBonneville might support in order to reduce the long-term uncertainties on theirsystem.
3. My historical review is taken from several sources, but primarily from Munson(1985).
4. It is extremely difficult to store electricity, so power companies must transmit theelectricity simultaneously from the generating stations to the customers. Customerdemands for electric power can vary greatly from hour to hour, so companies mustmaintain sufficient generating capacity and transmission equipment to meet thepeak demand for power.
5. For more information on power plant size, see the Los Alamos study of smaller coal-fired plants in the west (Ford 1980).
6. The cost of capital was high because of the high rate of inflation and because utilitycash flow was declining. The headlines on the financial problems are documentedin my doctoral thesis (Ford 1975).
7. Except for some difficult years immediately after the conclusion of World War II, theelectric power industry has been quite successful in expanding generating capacityto keep pace with the demand for power.
8. Electric power is measured in kW, MW and GW with 1,000 kW in a MW and 1,000MW in a GW. The peak demand for power on some of the nation’s largest utilitiescan be over 10 GW. Construction costs may amount to $1,000 per kW or $1 billionper GW.
9. The vicious circle headline is taken from Business Week, May 23, 1983. The articleincluded an example of a New York utility with a large nuclear plant underconstruction. The utility expected its rates to “soar 45% in three years” if the plantwere to come on line as planned. The “curve ball” headline is from the High CountryNews, February 18, 1983.
10. The “spiral” study is described by Ford and Youngblood (1983). Prices aremeasured in Figure 5 in mills/kWh. There are 1,000 mills in a $. A kWh is theelectric energy delivered by 1 kW of power in an hour.
Ford: System Dynamics and the Electric Power Industry 81

11. See “Pulling the Nuclear Plug,” Time, February 13, 1984 and “A Nuclear FiascoShakes the Bond Market,” Fortune, February 22, 1982.
12. The northwest electric system is dominated by hydro-electric generation. Thesystem usually has plenty of capacity, but it is constrained by the amount of energy.So, the bar charts in Figure 8 represent electric energy. The shaded boxes stand forthe “balancing” energy. Figure 8 does not show a shaded box for Bonneville becausethe federal portion of the system is automatically balanced when everyone followsthe “rules of operation.”
13. In scenarios with relatively constant electric rates, the iterative approach mightyield consistent results in the first iteration. However, utilities faced scenarios withlarge and rapid changes in electric rates in the difficult years of the 1970s.
14. Further information on the Florida Power and Light Model is given in the workshopreports (Electric Power Research Institute 1981; Ford and Mann 1982). See Geraghtyand Lyneis (1982) for a description of the advantages of the feedback approach.
15. One of the most important and provocative voices calling for the shift to small scaleis Amory Lovins (1985), director of research at the Rocky Mountain Institute.
16. Gas turbines have emerged as the most attractive resources in many parts of thecountry, not just the northwest. High efficiency and cheap natural gas are keyfactors. The Northwest Power Planning Council (1996, 5–5) reports that natural gasis selling for $1.60 per million BTUs in 1995, far below the peak value of $3.60which occurred ten years earlier.
17. Excellent descriptions of the rapidly changing situation in the UK power industryare given by Bunn (1994) and Newbery (1995).
References
AES Corporation. 1993. An Overview of the Ideas Model. 1001 North 19th Street,Arlington, VA 22209
Amlin, J. and G. Backus. 1996. Utility Models for the New Competitive Electric Markets.Systematic Solutions, Inc., 534 E. Dayton-Yellow Springs Road, Fairborn, Ohio45324.
Amlin, J., G. Backus and R. Heeb. 1988. Introduction to Energy 2020. SystematicSolutions Inc., Vandalia, OH 45377.
Arthur, W. and R. Eberlein. 1996. Sensitivity Simulations. Proceedings of the 1996International System Dynamics Conference, Cambridge, MA.
Arif, M. T. and K. Saeed. 1989. Sustaining Economic Growth with a NonrenewableNatural Resource: The Case of Oil-Dependent Indonesia. System Dynamics Review,5(1): 17–34.
Aslam, J. and K. Saeed. 1995. Electricity Conservation in Domestic Sector of Pakistan: ASystem Dynamics Approach.Proceedings of the 1995 International System DynamicsConference, Tokyo, Japan.
Backus, G. and J. Amlin. 1985. Combined Multidimensional Simulation Language,Database Manager and Sensitivity Confidence Analysis Package for System DynamicsModeling. Proceedings of the 1985 International System Dynamics Conference,Keystone, CO.
Barton, J. and M. Pumandu. 1996. A Policy Model for a Retail Water Company in
82 System Dynamics Review Volume 13 Number 1 Spring 1997

Australia. Proceedings of the 1996 International System Dynamics Conference,Cambridge, MA.
Bunn, D. 1994. Evaluating the Effects of Privatizing Electricity. The 1993 BlackettMemorial Lecture, Journal of the Operational Research Society, 45(4): 367–375.
Bunn, D. and E. Larsen. 1992. Sensitivity of Reserve Margin to Factors InfluencingInvestment Behaviour in the Electricity Market of England & Wales. Energy Policy,May.
Bunn, D. and E. Larsen, ed. 1996. Systems Modelling for Energy Policy. Chichester: JohnWiley & Sons.
Bunn D., E. Larsen and K. Vlahos. 1993. Complementary Modelling Approaches forAnalyzing Several Effects of Privatization on Electricity Investment. Journal of theOperational Research Society 44(10): 957–971.
Central Maine Power Company. 1989. The 1989 Energy 2020 Users’ Conference.Portland, Maine.
Coyle, R. G. 1996. System Dynamics Modelling, A Practical Approach. London:Chapman and Hall.
Davidsen, P., J. Sterman and G. Richardson. 1990. A Petroleum Life Cycle Model for theUnited States with Endogenous Technology, Exploration, Recovery and Demand.System Dynamics Review, 6(1): 66–93.
Dyner, I. and D. Bunn. 1996. Development of a Systems Simulation Platform to AnalyzeMarket Liberalization and Integrated Energy Conservation Policies in Colombia.Proceedings of the 1996 International System Dynamics Conference, Cambridge,MA.
Electric Power Research Institute. 1981. Case Study Comparison of Utility CorporateModels. Report EA-2065. Palo Alto, CA 94304.
Electric Power Research Institute. 1996. Balancing Risk and Return in an UncertainFuture. A product summary from Power Markets and Resource ManagementDivision. Palo Alto, CA 94304.
Ford A. 1975. A Dynamic Model of the United States Electric Utility Industry. ReportDSD-28 of the Research Program on Technology and Public Policy, Thayer School ofEngineering, Dartmouth College, Hanover, NH 03755.
Ford A. 1980. A New Look at Small Power Plants. Environment, 22(2): 25–33.Ford A. 1990. Estimating the Impact of Efficiency Standards on the Uncertainty of the
Northwest Electric System. Operations Research, 38(4): 580–597.Ford A. 1994. Electric Vehicles and the Electric Utility Company. Energy Policy, 22(7):
555–570.Ford A. 1995. Simulating the Controllability of Feebates. System Dynamics Review,
11(1): 3–29.Ford A. 1996a. Electric Vehicles: The Case for and Against Incentives. Public Utilities
Fortnightly, 15 April.Ford A. 1996b. Testing the Snake River Explorer. System Dynamics Review, 12(4):
305–329.Ford A. and M. Bull. 1989. Using System Dynamics for Conservation Policy Analysis in
the Pacific Northwest. System Dynamics Review, 5(1): 1–16.Ford A., M. Bull and R. Naill. 1987. Bonneville’s Conservation Policy Analysis Models.
Energy Policy, 109–124.Ford A. and J. Geinzer. 1990. Adding Uncertainty to Least Cost Planning. Energy Policy,
331–339.
Ford: System Dynamics and the Electric Power Industry 83

Ford, A. and G. Mann. 1982. Summary of the Workshop on Regulatory-Financial Modelsof the US Electric Utility Industry. Los Alamos National Laboratory Report LA-9815-C.
Ford A. and A. Youngblood. 1983. Simulating the Spiral of Impossibility in the ElectricUtility Industry. Energy Policy, 19–38.
Geraghty D. and J. Lyneis. 1982. Feedback Loops: The Effects of External Agents onUtility Performance. Public Utilities Fortnightly, 2 September.
Greenberger, M., M. Crenson and B. Crissey. 1976. Models in the Policy Process: PublicDecision Making in the Computer Era, Russell Sage Foundation, New York, NY.
Hamilton, H. R. 1969. Systems Simulation for Regional Analysis: An Application toRiver Basin Planning. Cambridge, MA: MIT Press.
Hass, J., E. Mitchell and B. Stone. 1974. Financing the Energy Industry. BallingerPublishing Company, Cambridge, MA.
Lovins, A. 1985. Saving Gigabucks with Negawatts. Public Utilities Fortnightly, 21March.
Lyneis, J., C. Bespolka and B. Tucker. 1994. Planning for a Competitive Environment —The Prospects for America’s Electricity Utilities. Proceedings of the 1994 Inter-national System Dynamics Conference, University of Stirling, Scotland.
Moxnes, E. 1990. Interfuel Substitution in OECD-European Electricity Production.System Dynamics Review, 6(1): 44–65.
Munson, R. 1985. The Power Makers. Emmaus, PA: Rodale Press.Naill, R. 1973. The Discovery Life Cycle of a Finite Resources: A Case Study of US
Natural Gas. Toward Global Equilibrium, ed. D. Meadows and D. Meadows. Wright-Allen Press.
Naill, R. 1977. Managing the Energy Transition. Ballinger Publishing Company,Cambridge, MA.
Naill, R. 1992. A System Dynamics Model for National Energy Policy Planning. SystemDynamics Review, 8(1): 1–19.
Naill, R. and G. Backus. 1977. Evaluating the National Energy Plan. Technology Review,July/August, 51–55.
Naill, R., S. Belanger, A. Klinger and E. Petersen. 1982. An Analysis of the CostEffectiveness of US Energy Policies to Mitigate Global Warming. System DynamicsReview. 8(2): 111–128.
Newbery, D. 1995. Power Markets and Market Power. The Energy Journal, 16(3):39-66.
Northwest Power Planning Council. 1996. Northwest Power in Transition. NPPC, 851SW Sixth Avenue, Suite 1100, Portland, OR 97204.
Saeed, K. 1996. Sustainable Development: Old Conundrums, New Discords. SystemDynamics Review, 12(1): 59–80.
Shawwash, Z. and D. Russell. 1996. Use of System Dynamics for Managing Water inJordan. Proceedings of the 1996 International System Dynamics Conference,Cambridge, MA.
Stanford. 1978. Coal in Transition. Stanford University Energy Modeling Forum. EMFReport 2.
Stanford. 1980. Aggregate Elasticity of Energy Demand. Stanford University EnergyModeling Forum. EMF Report 4.
Stanford. 1996. Markets for Energy Efficiency. Stanford University Energy ModelingForum. EMF Report 13.
84 System Dynamics Review Volume 13 Number 1 Spring 1997

Stanford. 1996. A Competitive Electricity Industry. Stanford University EnergyModeling Forum. EMF Report 15, forthcoming.
Sunaryo, P., T. Adibroto, H. Budiarto, and E. Maksum. 1996. “Application of SystemDynamics on Watershed Management in Java Island, Indonesia,” Proceedings of the1996 International System Dynamics Conference, Cambridge, Massachusetts, July1996.
Wang, Q., B. Xu, G. Yang and J. Yang. 1995. Coordinated Development of Infrastructurein a Regional Economy. Proceedings of the 1995 International System DynamicsConference, Tokyo, Japan.
Zepeda. E. 1975. The Capacity Expansion Process in the Electricity Supply Industry.Dynamica (previously published by the University of Bradford System DynamicsResearch Group).
Ford: System Dynamics and the Electric Power Industry 85