
Syst. Biol. 56(3):485-495,2007 DOI: 10.1080 ...aracnologia.macn.gov.ar/st/biblio/Goloboff and Pol...
11
Syst. Biol. 56(3):485-495,2007 Copyright © Society of Systematic Biologists ISSN: 1063-5157 print / 1076-836X online DOI: 10.1080/10635150701431905 On Divide-and-Conquer Strategies for Parsimony Analysis of Large Data Sets: Rec-I-DCM3 versus TNT PABLO A. GOLOBOFF 1 AND DIEGO POL 2 1 CONICET, Instituto Superior de Entomologia, Instituto Miguel Lillo, Miguel Lillo 205, San Miguel de Tucumdn 4000, Tucumdn, Argentina; E-mail: [email protected] 2 CONICET, Museo Paleontoldgico Egidio Feruglio, Av. Fontana 140, Trelew 9100, Chubut, Argentina; E-mail: [email protected] Abstract.—Roshan et al. recently described a "divide-and-conquer" technique for parsimony analysis of large data sets, Rec-I-DCM3, and stated that it compares very favorably to results using the program TNT. Their technique is based on selecting subsets of taxa to create reduced data sets or subproblems, finding most-parsimonious trees for each reduced data set, recombining all parts together, and then performing global TBR swapping on the combined tree. Here, we contrast this approach to sectorial searches, a divide-and-conquer algorithm implemented in TNT. This algorithm also uses a guide tree to create subproblems, with the first-pass state sets of the nodes that join the selected sectors with the rest of the topology; this allows exact length calculations for the entire topology (that is, any solution N steps shorter than the original, for the reduced subproblem, must also be N steps shorter for the entire topology). We show here that, for sectors of similar size analyzed with the same search algorithms, subdividing data sets with sectorial searches produces better results than subdividing with Rec-I-DCM3. Roshan et al.'s claim that Rec-I-DCM3 outperforms the techniques in TNT was caused by a poor experimental design and algorithmic settings used for the runs in TNT. In particular, for finding trees at or very close to the minimum known length of the analyzed data sets, TNT clearly outperforms Rec-I-DCM3. Finally, we show that the performance of Rec-I-DCM3 is bound by the efficiency of TBR implementation for the complete data set, as this method behaves (after some number of iterations) as a technique for cyclic perturbations and improvements more than as a divide-and-conquer strategy. [DCM3; heuristics; large data sets; sectorial search; TNT] Advancements in nucleotide sequencing technology have produced a dramatic increase in the amount of com- parative data suitable for phylogenetic analyses during recent years. This has resulted in phylogenetic data sets with hundreds or thousands of organisms, the earliest example of which is Chase et al.'s (1993) now classic data set of 500 rbcL sequences. Inclusive phylogenetic data sets have been increasingly common in the last few years (e.g., Kallersjo et al., 1998; Soltis et al., 1998; Tehler et al., 2003; Hibbett et al., 2005; McMahon and Sanderson, 2006), demonstrating the interest in large-scale phyloge- netic analyses among systematists and in attempting to understand relationships between the major branches in the Tree of Life (Cracraft and Donoghue, 2003). These large phylogenetic data sets exceeded the ca- pabilities of analytical methods of the 1980s and early 1990s, and therefore parsimony analysis of this kind of large data sets had been considered basically intractable. This situation stimulated research in algorithms and implementations capable of conducting efficient parsi- mony analysis of large data sets. Early contributions along these lines of research have introduced methods that provide speedups of about 30 to 100 times (Nixon, 1999; Goloboff, 1999) over preexisting methods of parsi- mony analysis; these methods were implemented in the computer program TNT, written by the senior author and collaborators (Goloboff et al., 2003), and available at http: / / www.zmuc.dk/public/phylogeny. Rec-I-DCM3 is a method of heuristic tree search re- cently introduced by Roshan et al. (2004) within the framework of parsimony phylogenetic analysis. This method was developed with the aim of increasing the capabilities of current heuristic tree search analyses and belongs to a family of methods introduced in phylogeny reconstruction by Huson et al. (1999a, 1999b): the disk covering methods or DCMs. Recently, several works claim that Rec-I-DCM3 allows analysis of much larger data sets than ever before (Roshan, 2004, Roshan et al., 2004, followed by Du et al., 2005a; Dotsenko et al., 2006; Smith and Williams, 2006; Warnow, 2005; Williams and Smith, 2005; Williams et al., 2006;). Roshan (2004) and Roshan et al. (2004) compare the performance of Rec-I- DCM3 with the "default technique" of TNT and claim that "Rec-I-DCM3 convincingly outperforms TNT—the best implemented MP heuristic—often by orders of mag- nitude" (Roshan et al., 2004:99). In this paper, we reexamine the relative performance of TNT and Rec-I-DCM3 using the two largest bench- mark data sets analyzed in the original study, contrast- ing the divide-and-conquer strategy of Rec-I-DCM3 to sectorial searches (the divide-and-conquer technique im- plemented in TNT; Goloboff, 1999). First, we will briefly introduce and compare (in Back- ground; readers familiar with the procedures may want to skip this section) the algorithms used in TNT and Rec-I-DCM3, followed by a brief discussion (under Pre- vious Comparisons) of the problems with the experimen- tal setup used by Roshan et al. for their original (2004) comparisons. Then, a more efficient use of TNT algo- rithms is described and the two largest data sets used by Roshan et al. (2004) are reanalyzed (under Comparison of Rec-I-DCM3 and TNT). Finally, a discussion on some characteristics of Rec-I-DCM3 performance, and related problems and prospects, is presented. The following abbreviations are used throughout the text: CSS, constrained sectorial search (where sectors are selected by reference to polytomies in a constraint tree); DFT, tree-drifting; DCM, disk covering method; DS11K, benchmark data set of 11,361 bacterial sequences; DS14K, benchmark data set of 13,921 bacterial sequences; HTU, 485
Transcript of Syst. Biol. 56(3):485-495,2007 DOI: 10.1080 ...aracnologia.macn.gov.ar/st/biblio/Goloboff and Pol...

Syst. Biol. 56(3):485-495,2007Copyright © Society of Systematic BiologistsISSN: 1063-5157 print / 1076-836X onlineDOI: 10.1080/10635150701431905
On Divide-and-Conquer Strategies for Parsimony Analysis of Large Data Sets:Rec-I-DCM3 versus TNT
PABLO A. GOLOBOFF1 AND DIEGO POL2
1 CONICET, Instituto Superior de Entomologia, Instituto Miguel Lillo, Miguel Lillo 205, San Miguel de Tucumdn 4000, Tucumdn, Argentina;E-mail: [email protected]
2CONICET, Museo Paleontoldgico Egidio Feruglio, Av. Fontana 140, Trelew 9100, Chubut, Argentina; E-mail: [email protected]
Abstract.—Roshan et al. recently described a "divide-and-conquer" technique for parsimony analysis of large data sets,Rec-I-DCM3, and stated that it compares very favorably to results using the program TNT. Their technique is based onselecting subsets of taxa to create reduced data sets or subproblems, finding most-parsimonious trees for each reduced dataset, recombining all parts together, and then performing global TBR swapping on the combined tree. Here, we contrast thisapproach to sectorial searches, a divide-and-conquer algorithm implemented in TNT. This algorithm also uses a guide treeto create subproblems, with the first-pass state sets of the nodes that join the selected sectors with the rest of the topology; thisallows exact length calculations for the entire topology (that is, any solution N steps shorter than the original, for the reducedsubproblem, must also be N steps shorter for the entire topology). We show here that, for sectors of similar size analyzedwith the same search algorithms, subdividing data sets with sectorial searches produces better results than subdividing withRec-I-DCM3. Roshan et al.'s claim that Rec-I-DCM3 outperforms the techniques in TNT was caused by a poor experimentaldesign and algorithmic settings used for the runs in TNT. In particular, for finding trees at or very close to the minimumknown length of the analyzed data sets, TNT clearly outperforms Rec-I-DCM3. Finally, we show that the performance ofRec-I-DCM3 is bound by the efficiency of TBR implementation for the complete data set, as this method behaves (after somenumber of iterations) as a technique for cyclic perturbations and improvements more than as a divide-and-conquer strategy.[DCM3; heuristics; large data sets; sectorial search; TNT]
Advancements in nucleotide sequencing technologyhave produced a dramatic increase in the amount of com-parative data suitable for phylogenetic analyses duringrecent years. This has resulted in phylogenetic data setswith hundreds or thousands of organisms, the earliestexample of which is Chase et al.'s (1993) now classicdata set of 500 rbcL sequences. Inclusive phylogeneticdata sets have been increasingly common in the last fewyears (e.g., Kallersjo et al., 1998; Soltis et al., 1998; Tehleret al., 2003; Hibbett et al., 2005; McMahon and Sanderson,2006), demonstrating the interest in large-scale phyloge-netic analyses among systematists and in attempting tounderstand relationships between the major branches inthe Tree of Life (Cracraft and Donoghue, 2003).
These large phylogenetic data sets exceeded the ca-pabilities of analytical methods of the 1980s and early1990s, and therefore parsimony analysis of this kind oflarge data sets had been considered basically intractable.This situation stimulated research in algorithms andimplementations capable of conducting efficient parsi-mony analysis of large data sets. Early contributionsalong these lines of research have introduced methodsthat provide speedups of about 30 to 100 times (Nixon,1999; Goloboff, 1999) over preexisting methods of parsi-mony analysis; these methods were implemented in thecomputer program TNT, written by the senior authorand collaborators (Goloboff et al., 2003), and available athttp: / / www.zmuc.dk/public/phylogeny.
Rec-I-DCM3 is a method of heuristic tree search re-cently introduced by Roshan et al. (2004) within theframework of parsimony phylogenetic analysis. Thismethod was developed with the aim of increasing thecapabilities of current heuristic tree search analyses andbelongs to a family of methods introduced in phylogenyreconstruction by Huson et al. (1999a, 1999b): the disk
covering methods or DCMs. Recently, several worksclaim that Rec-I-DCM3 allows analysis of much largerdata sets than ever before (Roshan, 2004, Roshan et al.,2004, followed by Du et al., 2005a; Dotsenko et al., 2006;Smith and Williams, 2006; Warnow, 2005; Williams andSmith, 2005; Williams et al., 2006;). Roshan (2004) andRoshan et al. (2004) compare the performance of Rec-I-DCM3 with the "default technique" of TNT and claimthat "Rec-I-DCM3 convincingly outperforms TNT—thebest implemented MP heuristic—often by orders of mag-nitude" (Roshan et al., 2004:99).
In this paper, we reexamine the relative performanceof TNT and Rec-I-DCM3 using the two largest bench-mark data sets analyzed in the original study, contrast-ing the divide-and-conquer strategy of Rec-I-DCM3 tosectorial searches (the divide-and-conquer technique im-plemented in TNT; Goloboff, 1999).
First, we will briefly introduce and compare (in Back-ground; readers familiar with the procedures may wantto skip this section) the algorithms used in TNT andRec-I-DCM3, followed by a brief discussion (under Pre-vious Comparisons) of the problems with the experimen-tal setup used by Roshan et al. for their original (2004)comparisons. Then, a more efficient use of TNT algo-rithms is described and the two largest data sets used byRoshan et al. (2004) are reanalyzed (under Comparisonof Rec-I-DCM3 and TNT). Finally, a discussion on somecharacteristics of Rec-I-DCM3 performance, and relatedproblems and prospects, is presented.
The following abbreviations are used throughout thetext: CSS, constrained sectorial search (where sectors areselected by reference to polytomies in a constraint tree);DFT, tree-drifting; DCM, disk covering method; DS11K,benchmark data set of 11,361 bacterial sequences; DS14K,benchmark data set of 13,921 bacterial sequences; HTU,
485

486 SYSTEMATIC BIOLOGY VOL. 56
hypothetical taxonomic unit (in the present paper, thestate set resulting from the first-pass of the optimiza-tion); MKL, minimum known length for a given dataset; RAS, Wagner tree obtained with a randomized addi-tion sequence; RAT, ratchet; RSS, random sectorial search(where sectors are selected at random); SS, sectorialsearch; TF, tree fusing (sometimes also used as a verb);XSS, exclusive sectorial search (where nonoverlappingsectors are selected so that their size is as uniform as pos-sible, and they cover the entire tree). Following Roshan(2004) and Roshan et al. (2004), Rec-I-DCM3(X) standsfor method of analysis X, boosted with Rec-I-DCM3 (i.e.,method X used to analyze subproblems); analogously,SS(x) stands for method X used to analyze subproblemsin a sectorial search.
BACKGROUND
Algorithms in TNT
As recognized in recent reviews (Hovenkamp, 2004;Giribet, 2005; Meier and Ali, 2005), one of the mainqualities of TNT is the availability of fast heuristictree searches. TBR branch swapping uses improvedprogramming techniques in TNT; for the two bench-mark data sets analyzed here, the difference in speedwith competing software is quite drammatic: PAUP*(Swofford, 1998) takes about 300 times longer than TNTto complete TBR in the case of DS11K and about 900times longer in the case of DS14K (note that the dif-ference in speed with TNT is much less in smallerdata sets). As discussed below, the efficiency of TBRin large trees is key to the success of Rec-I-DCM3. Inaddition to fast TBR algorithms, TNT also implementsthe tree search algorithms proposed by Goloboff (1999)and Nixon (1999). These algorithms consist of two dif-ferent types: algorithms that improve preexisting trees(SS, DFT, RAT) and an algorithm that takes sets oftrees and mixes them, producing combined trees (TF).All these algorithms are combined in TNT in what iscalled a "driven search." We provide a brief overviewbelow.
Sectorial search.—This algorithm (see Fig. 1) is the mostrelevant for the purpose of this paper, given that it isa divide-and-conquer approach, just like Rec-I-DCM3.SS consists of dividing a tree in "sectors" and creatingreduced data sets based on them. A sector comprises amonophyletic group, with some of the internal nodeswithin the group possibly replacing all the terminal taxadescended from them. Each sector is analyzed separatelyand the new configuration of the sector is regrafted onthe original tree if a better solution is found. The sectorscan be chosen at random (RSS) or based on a set of con-straints calculated automatically (CSS). A third type ofsector selection (XSS, implemented in TNT during 2004)selects large sectors of even size, which cover the entiretree but do not overlap. Regardless of how the sectorsare chosen, the creation of the reduced data set is thesame. SS creates reduced data sets in which the OTUsare the terminal taxa included in the sector and the HTUsthat join the chosen sector with the rest of the tree. The
Sectorial Search("combosearch" script)
Rec-I-DCM3(several perl scripts)
create starting treeby RAS +TBR
create starting treeby RAS +TBR
create 4 to 8 non-overlappingreduced data sets, usingHTU'S of current tree (T)
perform globalTBR, producing
treeT
analyze reduced dataset(s) with xmult
command, fuse withprevious results
Acreate overlapping reduceddata sets, maximum size 1/4,with subsets of terminal taxa,using current tree T as guide
perform globalTBR, producing
treeT
analyze reduced dataset(s) with xmult
command, fuse withprevious results
FIGURE 1. General organization of sectorial searches and Rec-I-DCM3. Both sectorial searches and Rec-I-DCM3 have a similar struc-ture, with the only important difference being in how the reducedsubproblems are created (by means of firstpass HTUs, in the case ofsectorial searches, and selecting disjoint but overlapping subsets ofterminals, in the case of Rec-I-DCM3).
scorings of the HTUs in the reduced data set are repre-sented by the first-pass state sets obtained during opti-mization of the tree. Obtaining the scorings for the mostbasal node of the sector requires rerooting the tree beforeperforming the optimization, such that the basal nodebecomes sister of the sector. When a reduced data set iscreated in this way, finding a solution N steps shorterthan the original subtree topology automatically impliesa solution that is N steps shorter for the entire data set.This critical characteristic of SS stems from consideringthe scorings of the internal nodes (first-pass states) thatjoin the chosen subtree with the rest of the tree and al-lows regrafting only those changes that actually improvethe optimality of the entire tree. A replacement that im-proves tree score in a sector may also imply that otherparts of the tree can now be changed to further improvescore, and thus SS uses periodic rounds of global TBR (seeGoloboff, 1999). In the implementation provided by TNT,several parameters can be modified, including the sizeand number of the sectors to be chosen and the type ofsearch to be done for each sector (including the possibil-ity of recursively subdividing the sector with additionalSS).
Drifting and ratchet.—These algorithms use cycles ofTBR swapping (on a single tree), alternating betweenperturbation and search phases. As implemented in TNT,the perturbation phase consists of either accepting sub-optimal rearrangements with a probability that dependson the tree-score difference (DFT) or accepting the rear-rangements that match or improve tree score for a ran-domly modified set of character weights (RAT).
Tree fusion.—This algorithm evaluates exchangesbetween two trees for all subtrees with identical compo-sition, accepting those that improve the score; if the first-pass state sets (and local costs) have been calculated foreach subtree, the score resulting from an exchange can becalculated quickly visiting only the nodes in the path be-tween the exchange point and the root (Goloboff, 1999).

2007 GOLOBOFF AND POL—ON DIVIDE AND CONQUER STRATEGIES 487
If the trees to input to TF are suboptimal trees obtainedindependently (e.g., from different starting points), TFproduces score improvements almost immediately.
Driven search.—The main conclusion of early tests ofthese algorithms (Goloboff, 1999) was that optimal treesfor data sets of 500-854 taxa were quickly found when TFwas applied to trees resulting from the other algorithms.In order to find the minimum known length (MKL) in theshortest amount of time, a "driven search" seeks to mini-mize the number of trees obtained in independent repli-cates (i.e., RASs, followed by TBR, SS, and DFT/RAT)that are input to TF. Thus, the trees produced by the firstfew replicates are submitted to TF; if these trees fail toproduce trees of MKL, some additional replications aredone, submitting the new set of trees to TF. This strat-egy is implemented in TNT (as a driven search, or as anoption of the xmult command) and creates trees by RAS,followed by TBR, SS, and optionally DFT or RAT. Withthe default settings, the xmult command will perform fiveRAS, followed by SS (no DFT or RAT), TF those five trees,and stop; only if the user has requested that the searchcontinue until a given score is found and TF on the firstfive trees fails to produce such a score is a new series ofreplicates started (which will be subsequently used forTF). In addition to this basic flow control, TNT allowsdefining a stopping rule by the number of independenthits to MKL, or until the consensus is stabilized, or muchmore specific routines through its scripting language.
Background on Rec-I-DCM3
Rec-I-DCM3 is the latest and most successful versionof DCMs. The method was published by Roshan et al.(2004) but originally developed in Roshan's Ph.D. dis-sertation (Roshan, 2004). This procedure (see Fig. 1) isbased on the recursive and iterative application of theDCM3 decomposition, selecting subsets of terminal taxabased on a given tree topology (i.e., "guide tree"). Each ofthese subsets of terminal taxa is used to create reduceddata sets (subproblems); if the first subdivision of thedata set produces subproblems that are too large, themethod is recursively applied to the large subproblems,until they are below a (user-specified) maximum size.Based on empirical tests of performance, Roshan (2004)concluded that large data sets should be divided in sub-problems no larger than 25% or 12.5% the total number oftaxa. Each of the subproblems is submitted to a programfor parsimony analysis (Roshan [2004] tried both PAUP*and TNT). The method of analysis employed for solv-ing the subproblems is referred to as the "base method."After the subproblems are solved, the Rec-I-DCM3 pro-gram collects the trees resulting from PAUP* or TNTand combines them using a strict consensus supertreemethod (see Huson et al., 1999a, 1999b). The resultingsupertree normally contains multiple polytomies. At thispoint, the polytomous tree is randomly resolved (i.e.,dichotomized) and submitted to TBR-branch swapping(again, using either PAUP* or TNT). We refer to this keystep of Rec-I-DCM3 as the global TBR (Roshan et al.[2004] omitted mentioning the global TBR phase, only
stating that a "random resolution, to obtain a binary tree"is applied to the polytomized supertree; Roshan's thesis(2004:152) and the Rec-I-DCM3 software make it clearthat this phase is part of the method). After global TBRconcludes, the first iteration of Rec-I-DCM3 is finished,and the resulting tree is used as the starting point (guidetree) of the next iteration.
Differences between Sectorial Searches and DCM3
At first, it might seem that DCM3 is simply equivalentto SS. The two methods, however, differ in one criticalaspect. The subproblems in DCM3 are created by select-ing (partly disjoint) sets of terminal taxa and, therefore,finding a better solution for the subproblem does not nec-essarily imply that the solution will improve the score ofthe entire tree (i.e., considering all the taxa). Addition-ally, if conflicting solutions are found for the differentsubproblems, merging the solutions together will createa tree with polytomies that are randomly dichotomized(i.e., not resolved in their optimal resolution). It is forthese two reasons that the round of global TBR swap-ping is needed after recombining the solutions for thesubproblems: the tree resulting from the recombinationis usually longer, not shorter. Without global TBR, Rec-I-DCM3 produces very poor results.
As described above, SS divides the tree intosubproblems formed by sectors of the tree consideringfirst-pass state sets for internal nodes. This ensures thatfinding an improved score for the subproblem resultsin a better score for the entire tree. This simply fol-lows from the algorithms for Fitch/Farris optimization(Farris, 1970; Fitch, 1971), which work by first assign-ing preliminary state sets in a down pass. Using thosesame state sets to represent the ancestral nodes for somegroups will produce length evaluations identical to thoseof a Fitch/Farris optimization, for any rearrangement ofthe relationships between those groups (as long as a con-stant number of steps, corresponding to the steps occur-ing within the groups, is added). Therefore, SS differsfrom DCM3 in that improved scores for the entire treeare generally found even without global TBR (althoughglobal TBR may, of course, further improve tree scores).
The original implementation of SS analyzed relativelysmall sectors with simple algorithms, such as six DFT cy-cles or six RAS+TBR (depending on the number of nodespresent in the sector). This early implementation of SS istherefore different from Rec-I-DCM3, which can selectsectors comprising large numbers of terminals, and an-alyzes each of those with rather exhaustive algorithms(i.e., the xmult command of TNT, which uses severalRAS, SS, and TF), possibly giving an advantage to Rec-I-DCM3.
Those SS settings work efficiently for data sets below1000 taxa, but for larger data sets it becomes necessaryto create very large sectors to cover significant portionsof the tree, and (as anticipated by Goloboff, 1999:420)these in turn have to be analyzed with algorithms appro-priate for their size. In order to expand the capabilitiesof SS, the scripting interface of TNT has been modified

488 SYSTEMATIC BIOLOGY VOL. 56
(during 2004-2005) for allowing full control of the searchalgorithms used to resolve each sector. The use of thesemodifications is discussed below (under Materials andMethods).
PREVIOUS COMPARISONS
The only published comparisons between the perfor-mance of TNT and Rec-I-DCM3 have been conductedby Roshan (2004) and Roshan et al. (2004). These stud-ies compared the results obtained by both procedures inthe analysis of 10 large data sets, ranging from approx-imately 1300 to 14,000 taxa. The performance of Rec-I-DCM3 was compared with that of TNT "with defaultsettings" on five runs that extended for 24 h. The basicresult of these comparisons was that TNT never matchedthe score found by Rec-I-DCM3. Furthermore, some ofthe TNT runs were extended over six more days, whichled Roshan et al. (2004) to conclude that Rec-I-DCM3 wasable to reach a given score much faster than TNT "withdefault settings." The largest difference was obtained inthe largest data sets, in which the score found by theweek-long TNT run was found between 10 and 50 timesfaster by Rec-I-DCM3.
The higher performance of Rec-I-DCM3 over TNT ledRoshan (2004) to suggest that "a DCM3-based divideand conquer strategy is more effective than the one usedin TNT-default" (i.e., sectorial search). Given the keydifferences between DCM3 decomposition and SS de-scribed above, this seems an unlikely explanation of thedifference in performance. Unfortunately, the publishedstudies did not specify what was meant by runningTNT "with default settings." Being fully interactive, TNTdoes not have a "default" heuristic search. Roshan (per-sonal communication) indicated that the xmult commandwas repeated many times (via a loop TNT command,changing the random seed). Running this routine TNTeffectively produces, as previously reported by Roshanet al., much poorer results than obtained with Rec-I-DCM3 (see Figs. 2,3).
This strategy, however, is an extremely poor use ofthe algorithms implemented in TNT. As explained above(and in the documentation of TNT), the xmult command,unless otherwise specified, will conduct only five repli-cates of RAS+TBR+SS (with no DFT/RAT), TF the treesobtained by these replicates, and stop. As is clear in theoriginal publication of these algorithms (Goloboff, 1999;see also Goloboff, 2000), the success of combining thesesearch strategies lies in repeatedly inputting to TF grad-ually increasing sets of trees (resulting from independentreplicates of RAS+TBR+SS, and DFT or RAT). Thus, therepeated TF process will gradually produce better andbetter trees. Roshan et al.'s routine, however, preventsthis from happening, since it discards previous resultsevery time a new xmult run is begun from scratch (Fig.2). Whether or not a given instance of xmult reaches alow score is independent of the scores obtained in previ-ous instances. TF is used, every time, to fuse the new setof trees obtained by RAS+TBR+SS but ignoring all thetrees obtained in previous replicates and rounds of TF.
272900 n
0 3 6 9 12 15 18 21 24
Time (hrs)
FIGURE 2. Tree score trajectories of TNT searches conducted as inRoshan et al. (2004) for the data set DS-11K (11,361 taxa). Gray linesrepresent the successive improvements in tree length found during asingle execution of the xmult command. The starting point of each lineis marked with a cross and the final tree obtained after TF is indicatedwith a solid circle (tree that is subsequently discarded). The thick blackline indicates cumulative scores (i.e., the best score found in all previouscycles), equivalent to the "TNTdefault" curve presented in the studyof Roshan et al. (2004).
TNT would have performed much better if the previ-ous trees, instead of being discarded, were fused to thenew trees obtained (i.e., if the trees in the solid circles ofFig. 2 are pooled and submited to TF). When the repeatedfusing procedure is introduced in the settings for runningTNT, its performance differs much less markedly fromthat of Rec-I-DCM3 (Fig. 3), although their relative supe-riority becomes data set dependent (data not shown).
Regarding the extended TNT runs that Roshan et al.(2004) continued for a week, it must be emphasizedthat they are not particularly meaningful or informative,
272150
272130
272070
272050
0 3 6 9 12 15 18 21 24
Time (hrs)
FIGURE 3. Tree score trajectories for the data set DS-11K (11,361taxa). Scores for TNT search conducted as in Roshan et al. (black line, asingle run), for TNT performing repeated fusing of the trees obtainedin different replicates (light gray line, average of 10 runs), and for Rec-I-DCM3 (dark gray line; maximum subproblem size 30%, using "xmult";and "tfuse"; to analyze each subproblem, average of 10 runs).

2007 GOLOBOFF AND POL—ON DIVIDE AND CONQUER STRATEGIES 489
since the results obtained from them systematicallythrew away trees that were excellent input candidates forTF and would have gradually improved the best score.Note, for instance, the flattening (Fig. 3) of the TNT runwith Roshan's procedure (black line) as opposed to theTNT run with repeated TF that kept improving the score(light gray line) as new trees obtained from additionalexecutions of the xmult command were fused with thosepreviously obtained.
Finally, we must note that the importance of repeatedTF was clear in the original publication of these algo-rithms (Goloboff, 1999), and that conducting the repeatedTF procedure shown in Figure 3 does not imply elabo-rate scripts or obscure command options (the xmultloopscript [see Materials and Methods] was used here to pro-duce those runs; alternatively, executing the command"xmult = replications 12 target 1" would suffice to ob-tain similar results). Although Roshan et al. did not userepeated TF for the TNT runs, they in fact used it for theanalyses of the subproblems in their Rec-I-DCM3 scripts.
The simple and more reasonable settings for TNT dis-cussed above usually work as well as Rec-I-DCM3 forsome data sets, although for others (e.g., the 13,921 taxondata set tested by Roshan and collaborators) there is stilla significant difference in favor of Rec-I-DCM3. In thefollowing sections, we discuss better settings for con-ducting efficient heuristic tree searches in TNT using itsscripting language and the same set of basic algorithms(e.g., TBR, SS, DFT, TF).
COMPARISON OF REC-I-DCM3AND SECTORIAL SEARCHES
Materials and Methods
Data sets.—We focus our comparisons on the twolargest data sets used by Roshan (2004) and Roshanet al. (2004), because in their runs these are the datasets for which TNT performed the poorest, in compar-ison to Rec-I-DCM3. These data sets have 11,361 and13,921 taxa, respectively, and were downloaded fromhttp://www.cs.njit.edu/usman/software/recidcm3. Werefer to these data sets as DS-11K, and DS-14K, respec-tively. Having only 1360 sites, both data sets are verypoorly structured and are probably of not much interestbesides their utility for benchmarking search algorithms.MKL for these data sets was obtained with TNT runningalone: for DS-11K, 272,007 steps (73 steps shorter than re-ported by Roshan, 2004), and for DS-14K, 240,860 steps(118 steps shorter than reported by Roshan, 2004). Treeswith those scores can be obtained from the first author onrequest. These scores may not be truly optimal, as theywere found only once. Roshan et al. reported a 50-foldspeed difference between Rec-I-DCM3 and TNT for an-other, smaller data set with about 7000 taxa, but this dataset is not publicly available and we have not been ableto test it.
Platform.—All the runs reported here for both TNT andRec-I-DCM3 were done on single-processor 3-GHz Pen-tium IV machines, with 1-Gb RAM, running under SuseLinux 9.1. All the analyses conducted here were run on
dedicated processors on which no other jobs were run atthe same time.
TNT analyses.—The new analyses conducted onTNT v. 1.0 (November 2005) were performed usingtwo scripts, publicly available at http://www.zmuc.dk/public/phylogeny/TNT/scripts. One of the scripts(xmultloop.run) includes the simple example of repeatedTF discussed above (Fig. 3), the other (combosearch.run)implements a more elaborate strategy developed to bet-ter analyze extremely large data sets (such as DS-11K andDS-14K). The latter script makes use of some of the mod-ifications implemented to SS in TNT mentioned above,including the selection of large sectors that can be an-alyzed using any tree search command. We must notethat this particular implementation of SS (although notyet available in TNT when Roshan et al. [2004] conductedtheir analyses) does not involve any algorithms differentfrom the ones described by Goloboff (1999).
The script used is structured as shown in Fig. 1; thegeneral organization of the script is similar to that ofRec-I-DCM3, highlighting the similarity between SS andRec-I-DCM3 (the only significant difference being howthe subproblems are created). Both Rec-I-DCM3 and SSused the xmult command (with identical parameters) toanalyze subproblems, so that this is a direct comparisonof Rec-I-DCM3(xmuit) versus SS(xmuit). The basic idea in thescript is to repeatedly divide the tree in large nonover-lapping sectors that cover the entire tree (with XSS) andto do a relatively exhaustive search on each sector.
This script requires three search parameters to be spec-ified by the user. The first two parameters are a minimumand a maximum number of sectors in which the tree willbe divided. A random number is selected between theselimits in each of the iterations of the tree search (so thatlimits between sectors vary with iterations). The thirdparameter is the minimum decrease in steps in a givenround (or MSD, see below). In this script, each sector isanalyzed with the xmult command with default param-eters (using two rounds of fusing after the multiple RASfor each sector), except for subproblems above 750 taxa,in which the SS search performed by xmult subdividesthe sector being analyzed into subsectors (with XSS; thissubdivision is performed three consecutive times, start-ing with subsector sizes of 200 nodes and ending withsubsectors of 80). After the xmult command is executed,TF merges the previous solution of the sector with thenew one (ensuring the new solution will be no worse thanthe previous one). Once the new resolutions are obtainedfor all the sectors, a round of global TBR is applied to theentire tree. This process is repeated as long as the num-ber of steps saved by analysis of the large sectors equalsor exceeds the minimum step difference, MSD (specifiedby the user as the third parameter for the script). Whenthree rounds of this process fail to match or exceed theminimum step difference MSD, the process of sectorialimprovements is interrupted (i.e., the cycle shown in theflowchart of Fig. 1 is broken), the trees obtained in pre-vious rounds (if any) are pooled with the new tree andsubjected to TF, and then a new round of the entire scriptis restarted.

490 SYSTEMATIC BIOLOGY VOL. 56
For restarting these successive rounds, the script al-lows either (a) starting a new build (which takes a longtime, initially, but eventually may contribute more di-verse trees to use for subsequent TF), or (b) trying to es-cape local optima by resolving large sectors of the tree asdescribed above, but ignoring the previous resolution. Inthe runs reported here we have used option (b), which infact may be convenient for extremely poorly structureddata sets, such as DS-14K, because then the trees sub-mitted to TF tend to share more groups (and then theexchange of subgroups is more extensive). The script is atext file (240 lines) that can be easily modified by the userto suit particular needs or to explore more sophisticatedstrategies.
Rec-I-DCM3 analyses.—The binaries and Perl scriptspresented by Roshan et al. (2004), publicly availableat http: / /www.es.njit.edu/usman/software/recidcm3,were used for the Rec-I-DCM3 runs. For solving eachsubproblem, Roshan's original scripts call TNT to exe-cute the xmult command with default options (i.e., to dofive replicates as specified in the previous section). Thesescripts use TF to fuse the new resolution of the subprob-lem with the previous one, thus ensuring that the resolu-tion of the subproblem returned by TNT is, for the subsetof terminals, not worse than the previous one. Roshan'sscripts with the original subproblem tree search settingswere used for the Rec-I-DCM3 runs shown in Figure 3(using maximum subproblem size equal to 30% the totalnumber of taxa), as well as those shown in Figures 8 and9.
In order to provide comparable performance curves onthe divide-and-conquer methods of DCM3 and SS, thePerl scripts to analyze the subproblems created by Rec-I-DCM3 were modified. Each of the DCM3 subproblemswas analyzed (in TNT) with the same tree search com-mands described above for the sectorial searches in theTNT script and the maximum subproblem size was setto 25% the total number of taxa (the size recommendedby Roshan [2004]). All other settings of the original Rec-I-DCM3 were left unaltered (including the global TBRsearch conducted at the end of each iteration, and TFwith previous resolution at the end). These settings wereemployed for the runs shown in Figures 4 through 7.
All the Rec-I-DCM3 analyses on the DS-K11 andDS-K14 data sets were conducted again in order toprovide comparable results, specially given the differ-ences in software and hardware between our studyand the studies by Roshan (2004) and Roshan et al.(2004). Software differences are due to the version ofTNT used here, which has been further improved since2004. For large data sets, TBR branch swapping isnow, due to code improvements, about two times fasterthan in early 2004. These improvements include fasterTBR swapping on optimal or near-optimal trees, fasterhandling of constraints when finding better trees un-der TBR (this strongly affects autoconstrained xmultsearches), and faster transition to a better tree dur-ing TBR. The last two affect specially the initial stagesof TBR swapping, when better trees are found veryoften.
The hardware used here is also faster. Roshan et al.used processors of 1.5-GHz or less, whereas we use 3-GHz processors. Therefore, our Rec-I-DCM3 runs per-form much better than in Roshan (2004). For each of thedata sets, the best score out oi: the five 24-h runs reportedby Roshan (2004) is matched (on average) by our Rec-I-DCM3 runs in 6 h or less. Thus, every 24 h of Rec-I-DCM3runtime in the present paper is actually equivalent to ap-proximately 4 days with the settings of Roshan (2004). Duet al. (2005a) and Dotsenko et al. (2006) give results fora parallel Rec-I-DCM3, but their reported best scores at24 h are worse than the best scores reported by Roshan(2004) and much worse than the average score obtainedhere for Rec-I-DCM3.
Unless stated otherwise, the analyses were repeated10 times (both for TNT and Rec-I-DCM3) in order totake into account the variability of results. The entire setof runs reported here took a total of approximately 6months of CPU time.
Results
When the divide-and-conquer strategy of TNT de-scribed above is used to improve upon trees obtained bya single RAS+TBR+SS, the results obtained in the anal-yses of the data sets DS-11K and DS-K14 clearly outper-form those of Rec-I-DCM3 (Figs. 4 and 5). Recall that forthese comparisons, the Rec-[-DCM3 subproblems wereanalyzed (in TNT) with the same search commands usedfor the sectors divided by SS in TNT. Therefore, the onlyimportant difference between the TNT and Rec-I-DCM3runs was in how the subproblems were created: by se-lecting HTUs, in the case of SS, and by selecting subsetsof terminal taxa in the case of Rec-I-DCM3. For both datasets, after 50 h, the score of the best Rec-I-DCM3 run wasworse than the average TNT score, and the score of theworst TNT run was better than the average Rec-I-DCM3
272100 i
272080
5 272060 -
a>CD
H 272040 -
272020 •272000
10 15 20 25 30
Time (hrs)
35 40 45 50
FIGURE 4. Analysis of data set DS-11K (11,361 taxa). Cumulativescores obtained by Rec-I-DCM3 (gray) and TNT (black). Thick curvesrepresent average scores (of 10 independent runs), and thin lines rep-resent minimum and maximum (the best and worst score of all theruns at any given point). For the TNT script the parameter values forthe min/max numbers of sectors were set to 4 and 8 and the minimumstep difference (MSD) was set to 10 (See Materials and Methods). Rec-I-DCM3 was run with the same search commands for subproblems anda maximum subproblem size of 25%.

2007 GOLOBOFF AND POL—ON DIVIDE AND CONQUER STRATEGIES 491
240980 •
240960 -
240940 -
S 240920 -
^ 240900 •
240880 •
240860
10 15 20 25 30
Time (hrs)
35 40 45 50
FIGURE 5. Analysis of data set DS-14K (13,921 taxa). Cumulativescores obtained by Rec-I-DCM3 (gray) and TNT (black). Thick curvesrepresent average scores (of 10 independent runs), and thin lines repre-sent minimum and maximum (the best and worst score of all the runsat any given point). For the TNT script the parameter values for themin/max numbers of sectors were set to 4 and 14 and the minimumstep difference was set to 5 (See Materials and Methods). Rec-I-DCM3was run with the same search commands for subproblems and a max-imum subproblem size of 25%.
score. In the case of DS-11K (Fig. 4), it takes TNT about4.5 h to better the average Rec-I-DCM3 score obtained at24 h (5.3 times faster) and about 5 h to better the aver-age Rec-I-DCM3 score obtained at 48 h (9.6 times). Notethat Figure 4 shows strictly comparable runs (using thesame commands to resolve subproblems and a subprob-lem size closer to recommended); the Rec-I-DCM3 runshown in Figure 3 (which used subproblems larger thanrecommended, of about 30% the total number of taxa)performed better, but even in that case TNT reaches thescore obtained by Rec-I-DCM3 at 24 h in only 8 h (3 timesfaster). In the case of DS-14K, it takes TNT 11 h to betterthe average Rec-I-DCM3 score obtained at 24 h (2.2 timesfaster) and 18 h to better the average Rec-I-DCM3 scoreobtained at 50 h (2.8 times faster).
In sum, in both the DS-11K and DS-14K data sets,TNT's own divide-and-conquer technique (SS) producesbetter results than the decomposition introduced withRec-I-DCM3 (applying the same search strategy for thesubproblems). This contradicts the main results of Rec-I-DCM3 comparisons published by Roshan et al. (2004)and echoed by several recent contributions (Williamsand Smith, 2005; Du et al., 2005a; Dotsenko et al., 2006;Williams et al., 2006). The precise speed difference be-tween these two methods is likely to be dependent onthe combination of the particular data set being analyzedand the specific parameter values for the tree search al-gorithms. Irrespective of these variations, however, it isclear from our results that the "dramatic speedup" re-ported by Roshan et al. (2004) and their conclusion thatRec-I-DCM3 "convincingly outperforms" the algorithmsimplemented in TNT were based on an extremely poordesign of the TNT runs.
DISCUSSION
As noted above, the fact that SS allows calculating treelengths exactly while analyzing subproblems is a key
advantage that distinguishes it from the Rec-I-DCM3 de-composition. The only exception to this can occur whenseveral SS subproblems are resolved independently atthe same time (although during our analyses it was ex-tremely rare that the tree combining all the improved res-olutions was longer than the original one). Even in thosecases a quick round of global TBR usually saves only afew additional steps (mostly during the initial cycles).In contrast, finding improved solutions for the subprob-lems in Rec-I-DCM3 normally leads to worsened, insteadof improved, global solutions, which require subsequentglobal TBR swapping. This has several negative implica-tions for the performance of Rec-I-DCM3.
Rec-I-DCM3 Is More "Ratchet" Than"Divide-and-Conquer"
The Rec-I-DCM3 graphs of Figures 3 through 5 aresimilar to those used by Roshan (2004) and Roshan et al.(2004), with the scores monotonically decreasing withtime, because they represent the cumulative best scoresof all the preceding Rec-I-DCM3 iterations. Cumulativescore curves (as shown for the TNT runs in Fig. 2) showonly partial information on the dynamics of an algorithmperformance. After some initial cycles, a given iterationof Rec-I-DCM3 ends up producing (after global TBR),about 50% of the time, a tree worse than the one resultingfrom the previous iteration (Fig. 6). After the first fewhours, the actual trajectory of Rec-I-DCM3 for DS-11K(Fig. 6a) is clearly not a decreasing one (in two cases thebest score was found within the first 15 h, and never againin the subsequent 35 h). In the case of DS-14K (Fig. 6b),the post-TBR trajectories decrease for a longer time thanin DS-11K, but that is only an effect of the larger size(and difficulty) of DS-14K; after more hours, the post-TBR trajectory also begins to oscillate around a givenscore (about 240,930 or 240,940 steps).
The oscillating nature of Rec-I-DCM3 runs is more evi-dent when a very good initial tree is taken as the startingpoint. We let Rec-I-DCM3 run for 520 h on the DS-14Kdata set (using an initial guide tree of 240,873 steps, foundby TNT), repeating this procedure 20 different timeswith different random seeds. The post-TBR trajectoriesquickly show a worsening of the trees obtained as moreiterations of Rec-I-DCM3 are completed (top curves ofFig. 7) and the starting tree score is never found again. Af-ter the first 5 h, the post-TBR trajectories oscillate around240,930 steps, showing no trend of improvement. Thisbehavior clearly contrasts with the divide-and-conquerSS algorithms of TNT, which quickly (2.5 h, on average)improve the score when the same tree is input as the ini-tial solution (bottom curves of Fig. 7; only best and worstof 10 TNT runs are shown there). The trees resulting fromthese ten TNT runs were subsequently subjected to TF,producing trees of the MKL for DS-14K: 240,860 steps.
Except for the first few iterations of Rec-I-DCM3 (whenthe tree is very far from optimal), dividing the tree insubproblems and merging the solutions into a supertreethat is randomly dichotomized creates a perturbationto the preceding topology, instead of an improvement.

492 SYSTEMATIC BIOLOGY VOL. 56
(a)272180-.
272160-
272140 -
272120-
272100 -
272080 -
272060 -
272040
241010-j
0 5 10 15 20 25 30 35 40 45 50
Time (hrs)
(b)241020-1
241000-
240980 -
240960 -
240940 -
240920 -
240900 •
24088010 15 20 25 30 35 40 45 50
Time (hrs)
FIGURE 6. Trajectory of tree scores obtained by Rec-I-DCM3. Treesearch for subproblems and maximum subproblem size as in Figures 4and 5 (see Materials and Methods). Each point of the curves representsthe tree score of the tree obtained at the end of a Rec-I-DCM3 iteration(after global TBR). (a) Three different runs for the data set DS-11K(11,361 taxa); the general trend (after the first few hours) is clearly notdecreasing (e.g., the runs that found the best score at about 89 h resultedin worse trees in the remaining 1516 h). (b) Three different runs for thedata set DS-14K (13,921 taxa). The gray and light gray lines show theirminimum scores found at 11 and 17 h (respectively) and never againin the remaining 33 or 39 h.
This perturbated topology is almost always less optimalthan the original one (see next section) but provides anew starting point for the global TBR swapping. Rec-I-DCM3, after some number of iterations, works as a sortof "ratchet" more than as a strict divide-and-conquer.The perturbation caused by selecting subsets of taxa isobviously a very strong one—possibly too strong, assuggested by the fact that starting from a good tree(240,873) quickly degrades it into trees 60 to 80 stepslonger. Instead of gradually improving the tree (whichTNT normally does through divide-and-conquer andTF), the oscillations in score of Rec-I-DCM3 get downto really low scores (e.g., MKL), in the case of DS-14K,with an extremely low frequency. This means that (onaverage) optimal or near-optimal trees will not be foundby Rec-I-DCM3 in difficult data sets, unless it is run for
rec-i-dcm3
TNT
0 3 6 9 12 15 18 21 24
Time (hrs)
FIGURE 7. Trajectory of tree scores starting from a near-optimalguide tree (240,873 steps) for the data set DS-14K (13,921 taxa). Subprob-lems of Rec-I-DCM3 analyzed using xmult with 3 replications ("xmult= repl 3"; instead of the default 5 to make the process faster; notethat more exhaustive search commands for the subproblems producesimilar results, with the only difference that each iteration takes longer)and maximum subproblem size equals to 25% the total number of taxa.Only 6 Rec-I-DCM3 curves shown here (each individual run indicatedwith a different type of line; note that other runs showed the sameoscillating pattern). The TNT curves show the best and worst scoretrajectories (out of 10 independent runs starring from that same tree)using the same search strategy as in Figure 5.
very extended periods of time. Even when Rec-I-DCM3had started from an exceptionally good tree, this neverhappened within 520 h (3 weeks).
The previous discussion also shows that the differencein performance between TNT and Rec-I-DCM3 increasesas the tree scores are closer to minimum length. The treesRec-I-DCM3 finds after 24 h are not especially good (forDS-14K, 50 to 60 steps above MKL), but Rec-I-DCM3finds those trees relatively fast: only two times slowerthan TNT. After 48 h, TNT finds (on average) trees 28steps above MKL, but Rec-I-DCM3 has a harder time get-ting down to this length, about 9 to 10 times slower thanTNT. Finally, the Rec-I-DCM3 runs starting from trees 13steps above MKL (i.e., 240,873 steps) never found a bet-ter tree in 520 h, which TNT does in an average time of2.5 h—well over 200 times faster than Rec-I-DCM3.
Rec-I-DCM3 Cannot Efficiently Break Trees into TooMany Parts
The previous section shows that Rec-I-DCM3 cannotbe strictly seen as a divide-and-conquer technique.Roshan et al. (2004) optimistically stated that, in the sizeof data sets that can be analyzed, "Rec-I-DCM3 bridgesat least one order [of magnitude], but may be capableof more—biological data sets with 100,000 alignedsequences do not yet exist!" They recognize that, fordoing so, it will be necessary to break the trees in morethan just a few pieces. But Roshan himself (2004) hadnoted that decomposing into numerous small subprob-lems produced inferior results, which would decreasethe performance for extremely large data sets. For thelargest data sets he tested (DS-11K and DS-14K), Roshan(2004) obtained the best scores using a subproblem sizeof 25% (that is, "reduced" subproblems of about 2800taxa).
2007 GOLOBOFF AND POL—ON DIVIDE AND CONQUER STRATEGIES 493
275000 -
274500 -
274000 -
273500 -
273000 -
272500 -
272000
smallmediumbig
4 5 6Time (hrs)
10
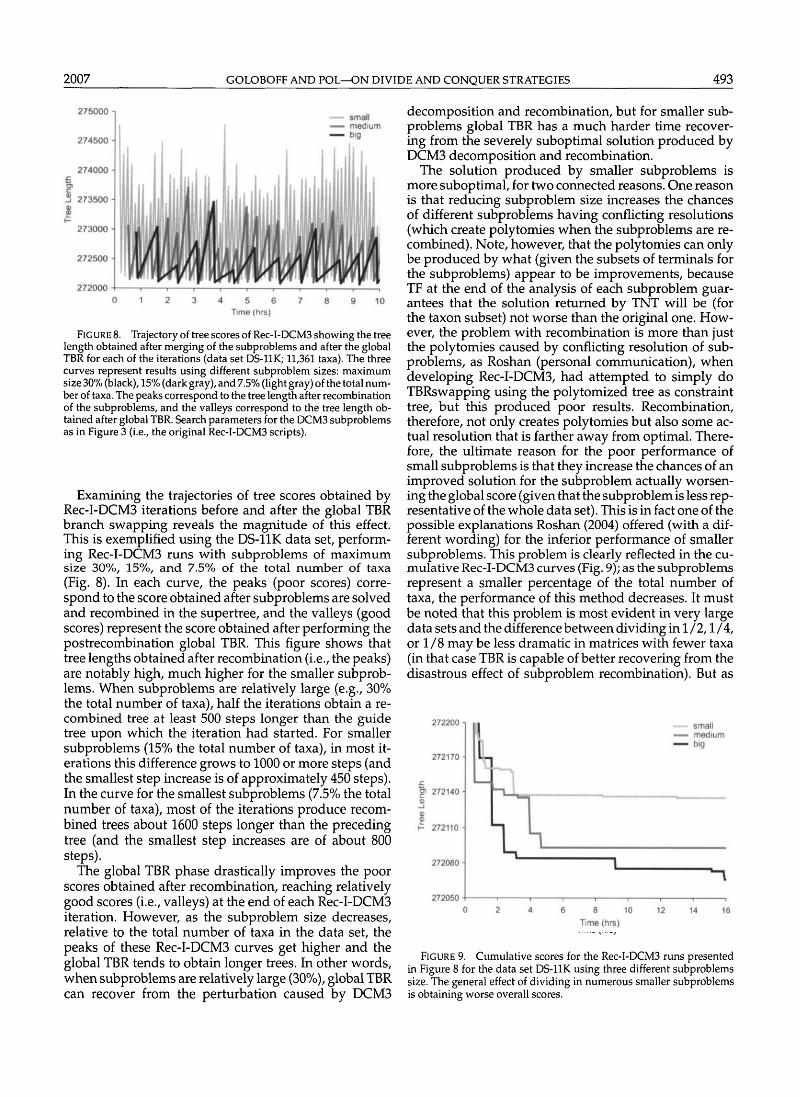
FIG URE 8. Trajectory of tree scores of Rec-I-DCM3 showing the treelength obtained after merging of the subproblems and after the globalTBR for each of the iterations (data set DS-11K; 11,361 taxa). The threecurves represent results using different subproblem sizes: maximumsize 30% (black), 15% (dark gray), and 7.5% (light gray) of the total num-ber of taxa. The peaks correspond to the tree length after recombinationof the subproblems, and the valleys correspond to the tree length ob-tained after global TBR. Search parameters for the DCM3 subproblemsas in Figure 3 (i.e., the original Rec-I-DCM3 scripts).
Examining the trajectories of tree scores obtained byRec-I-DCM3 iterations before and after the global TBRbranch swapping reveals the magnitude of this effect.This is exemplified using the DS-11K data set, perform-ing Rec-I-DCM3 runs with subproblems of maximumsize 30%, 15%, and 7.5% of the total number of taxa(Fig. 8). In each curve, the peaks (poor scores) corre-spond to the score obtained after subproblems are solvedand recombined in the supertree, and the valleys (goodscores) represent the score obtained after performing thepostrecombination global TBR. This figure shows thattree lengths obtained after recombination (i.e., the peaks)are notably high, much higher for the smaller subprob-lems. When subproblems are relatively large (e.g., 30%the total number of taxa), half the iterations obtain a re-combined tree at least 500 steps longer than the guidetree upon which the iteration had started. For smallersubproblems (15% the total number of taxa), in most it-erations this difference grows to 1000 or more steps (andthe smallest step increase is of approximately 450 steps).In the curve for the smallest subproblems (7.5% the totalnumber of taxa), most of the iterations produce recom-bined trees about 1600 steps longer than the precedingtree (and the smallest step increases are of about 800steps).
The global TBR phase drastically improves the poorscores obtained after recombination, reaching relativelygood scores (i.e., valleys) at the end of each Rec-I-DCM3iteration. However, as the subproblem size decreases,relative to the total number of taxa in the data set, thepeaks of these Rec-I-DCM3 curves get higher and theglobal TBR tends to obtain longer trees. In other words,when subproblems are relatively large (30%), global TBRcan recover from the perturbation caused by DGVI3
decomposition and recombination, but for smaller sub-problems global TBR has a much harder time recover-ing from the severely suboptimal solution produced byDCM3 decomposition and recombination.
The solution produced by smaller subproblems ismore suboptimal, for two connected reasons. One reasonis that reducing subproblem size increases the chancesof different subproblems having conflicting resolutions(which create polytomies when the subproblems are re-combined). Note, however, that the polytomies can onlybe produced by what (given the subsets of terminals forthe subproblems) appear to be improvements, becauseTF at the end of the analysis of each subproblem guar-antees that the solution returned by TNT will be (forthe taxon subset) not worse than the original one. How-ever, the problem with recombination is more than justthe polytomies caused by conflicting resolution of sub-problems, as Roshan (personal communication), whendeveloping Rec-I-DCM3, had attempted to simply doTBRswapping using the polytomized tree as constrainttree, but this produced poor results. Recombination,therefore, not only creates polytomies but also some ac-tual resolution that is farther away from optimal. There-fore, the ultimate reason for the poor performance ofsmall subproblems is that they increase the chances of animproved solution for the subproblem actually worsen-ing the global score (given that the subproblem is less rep-resentative of the whole data set). This is in fact one of thepossible explanations Roshan (2004) offered (with a dif-ferent wording) for the inferior performance of smallersubproblems. This problem is clearly reflected in the cu-mulative Rec-I-DCM3 curves (Fig. 9); as the subproblemsrepresent a smaller percentage of the total number oftaxa, the performance of this method decreases. It mustbe noted that this problem is most evident in very largedata sets and the difference between dividing in 1 /2,1 /4,or 1/8 may be less dramatic in matrices with fewer taxa(in that case TBR is capable of better recovering from thedisastrous effect of subproblem recombination). But as
272200 -\
272170 -
272140
272110 •
272080
272050
smallmediumbig
6 8 10 12 14Time (hrs)
16
FIGURE 9. Cumulative scores for the Rec-I-DCM3 runs presentedin Figure 8 for the data set DS-11K using three different subproblemssize. The general effect of dividing in numerous smaller subproblemsis obtaining worse overall scores.

494 SYSTEMATIC BIOLOGY VOL. 56
far as large data sets are concerned, this poses a seriousproblem for Rec-I-DCM3 analyses. In contrast, and byvirtue of using exact length calculations when analyzingsectors of the tree, SS poses no such limit on the numberof subproblems in which a tree can be broken.
In sum, the global TBR round is the phase of Rec-I-DCM3 in which the actual score improvement is made.Since this phase is simply performing TBR branch swap-ping on the entire tree, the performance of Rec-I-DCM3 isbound by the efficiency of TBR implementation for largetrees. This means that (unless one is willing to acceptstrongly suboptimal results) Rec-I-DCM3 can be appliedto very large data sets only with a TBR branch swapperas fast as the one in TNT. Roshan et al. (2004) write asif their method, by virtue of breaking down the com-putational complexity, could be used with PAUP* justas well as with TNT, which is plainly not true for theselarge data sets: using PAUP* to perform global TBR, nota single iteration of Rec-I-DCM3 could be completed in24 h.
CONCLUSIONS
Our experiments show that (contra Roshan et al.,2004) Rec-I-DCM3 does not provide any speedup rela-tive to the SS algorithms described by Goloboff (1999)and implemented in TNT. Furthermore, for parsimonyanalysis of the extremely large data sets tested here,Rec-I-DCM3(xmuit) is well below the performance ofSS(xmuit)- This results from the exact tree length calcu-lations possible for SS subproblems, suggesting thatRec-I-DCM3(x) is very likely to produce poorer resultsthan SS(x) for any search routine X.
Our experiments also show that (after some num-ber of cycles) Rec-I-DCM3 behaves more like a type ofratchet than as a true divide-and-conquer strategy (withthe decomposition in subproblems acting as a perturba-tion more than as a "conquest"). Its oscillating behaviorcauses optimal or near optimal scores to be found very in-frequently for difficult and large data sets (in comparisonwith tree search strategies implemented in TNT, whichallow steady and gradual improvements). Furthermore,the analysis of different subproblem sizes shows thatRec-I-DCM3 has serious limitations when the data setsare divided in many subproblems (which will be neededfor analyzing extremely large data sets).
On the positive side, Rec-I-DCM3 has two main advan-tages. First, the method is fairly simple and it does notrequire much programming effort. Second, selecting sub-sets of taxa can also provide an interesting perturbationto escape from local optima. If properly tuned and com-bined with other algorithms, this procedure may providea useful approach under some circumstances. For exam-ple, within the driven search strategy of TNT, instead ofperiodically beginning new random addition sequencesfrom scratch, perhaps a single round of Rec-I-DCM3 (or asimilar method) could quickly provide a sufficiently dif-ferent tree that is not as far from optimal as a Wagner tree.Rec-I-DCM3 also has the advantage that it is very gen-eral and can (in principle) be used to run analyses under
criteria other than parsimony without extensive modi-fications. For criteria like maximum likelihood (e.g., Duet al., 2005b) or for the analysis of unaligned sequences(e.g., Wheeler, 2005), where heuristic searches are com-putationally more expensive than in parsimony, and noimplementation of sectorial searches exists, Rec-I-DCM3may provide a real improvement.
ACKNOWLEDGMENTS
For encouragement, discussion, cind enlightenment over the years,PAG thanks James Carpenter, Kevin Nixon, and Steve Farris. The clus-ter used to make our runs was funded by NSF (AToL grant 0228699 toW. Wheeler). DP acknowledges funding from the Mathematical Bio-sciences Institute supported by NSF under Agreeement No. 112050.We also thank Bernard Moret for discussions on the subject and Us-man Roshan for discussion and useful comments on an early versionof the manuscript (despite his continued disagreement with some ofour conclusions). We thank editor Rod Page, associate editor OlivierGascuel, and several anonymous reviewers for their helpful commentsand advice on different versions of the manuscript. This paper was pre-sented (by PAG) at the symposium on "The problems of phylogeneticanalysis of large data sets" (December 12,2005) held in the Mathemati-cal Biosciences Institute (Ohio State University); we thank many of theparticipants for discussion and input.
REFERENCES
Chase, M., et al. 1993. Phylogenetics of seed plants: An analysis ofnucleotide sequences from the plastid gene rbcL. Ann. Mo. Bot. Gard.80:528-580.
Cracraft, J., and M. }. Donoghue. 2003. Assembling the Tree of Life.Oxford University Press, Oxford, UK.
Dotsenko, Y., C. Coarfa, L. Nakhleh, J. MellorCrummey, and U. W.Roshan. 2006. PRec-I-DCM3: A parallel framework for fast and ac-curate large-scale phylogeny reconstruction. Int. J. BioinformaticsRes. App. 2:407-419.
Du, Z., F. Lin, and U. W. Roshan. 2005a. Reconstruction of large phylo-genetic trees: A parallel approach. Comput. Biol. Chem. 29:273-280.
Du, Z., A. Stamatakis, F. Lin, U. W. Roshan, and L. Nakhleh. 2005b.Parallel divide-and-conquer phylogeny reconstruction by maximumlikelihood. Proceedings of the 20015 International Conference on HighPerformance Computing and Communications HPCC05. LectureNotes in Computer Science 3726:776-785.
Farris, J. S. 1970. Methods for computing Wagner Trees. Syst. Zool.19:83-92.
Fitch, W. 1971. Toward defining the course of evolution: Minimumchange for a specific tree topology. Syst. Zool. 20:406-416.
Giribet, G. 2005. A review of "TNT: Tree Analysis Using New Technol-ogy." Syst Biol. 54:176-178.
Goloboff, P. A. 1999. Analyzing large data sets in reason-able times: Solutions for composite optima. Cladistics 15:415-428.
Goloboff, P. 2000. Techniques for analysis of large data sets. Pages 70-79in Techniques in molecular systetnatics and evolution (R. De Salle,W. Wheeler, and G. Giribet, eds.). Birkhauser Verlag, Basel.
Goloboff, P. A., J. S. Farris, and K. C. Nixon. 2003. T.N.T.: Tree analy-sis using new technology. Version 1.0. Program and documentation,available at http://www.zmuc.dk/public/Phylogeny/TNT.
Hibbett, D. S., R. H. Nilsson, M. Snyder, M. Fonseca,}. Constanzo, andM. Shonfeld. 2005. Automated phylogenetic taxonomy: An exam-ple in Homobasidiomycetes (mushroom forming fungi). Syst. Biol.54:660-668.
Hovenkamp, P. 2004. Review of T.N.T.—Tree Analysis Using New Tech-nology, Version 1.0, by P. Goloboff, J. S. Farris, and K. Nixon. Cladis-tics 20:378.
Huson, D., S. Nettles, and T. Warnow. 1999a. Diskcovering, a fast con-verging method for phylogenetic tree reconstruction. J. Comput. Biol.6:369-386.
Huson, D., L. Vawter, and T. Warnow. 1999b. Solving large scalephylogenetic problems using DCM2. Proceedings 7th International

2007 GOLOBOFF AND POL—ON DIVIDE AND CONQUER STRATEGIES 495
Conference on Intelligent Systems for Molecular Biology (ISMB'99):118-129.
Kallersjo, M., J. S. Farris, M. W. Chase, B. Bremer, M. F. Fay, C.J. Humphries, G. Petersen, O. Seberg, and K. Bremer. 1998. Si-multaneous parsimony jackknife analysis of 2538 rbcL DNA se-quences reveals support for major clades of green plants, landplants, seed plants and flowering plants. Plant Syst. Evol. 213:259-287.
McMahon, M., and M. Sanderson. 2006. Phylogenetic supermatrix anal-ysis of GenBank sequences from 2228 papilionoid legumes. Syst. Biol.55:818-836.
Meier, R., and F. B. Ali. 2005. The newest kid on the parsimony block:TNT (Tree analysis using new technology). Syst. Entomol. 30:179.
Nixon, K. C. 1999. The parsimony ratchet, a new method for rapidparsimony analysis. Cladistics 15:407-414.
Roshan, U. W. 2004. Algorithmic techniques for improving the speedand accuracy of phylogenetic methods. Ph.D. dissertation, Univer-sity of Texas, 229 pp.
Roshan, U. W., B. M. E. Moret, T. L. Williams, and T. Warnow. 2004.Rec-I-DCM3: A fast algorithmic technique for reconstructing largephylogenetic trees. Proceedings 3rd IEEE Computational SystemsBioinformatics Conference (CSB 2004):98-109.
Smith, M. L., and T. L. Williams. 2006. Phylospaces: Reconstructingevolutionary trees in tuple space. Fifth IEEE International Work-shop on High Performance Computational Biology (HiCOMB '06):18.
Soltis, D. E., P. S. Soltis, M. E. Mort, M. W Chase, V. Savolainen, S. B.Hoot, and C. M. Morton. 1998. Inferring complex phylogenies using
parsimony: An empirical approach using three large DNA data setsfor angiosperms. Syst. Biol. 47:324.
Swofford, D. 1998. PAUP*: Phylogenetic analysis using parsimony(*and other methods). Version 4.0. Sinauer Associates, Sunderland,Massachusetts.
Tehler, A., D. P. Little, and J. S. Farris. 2003. The full-length phyloge-netic tree from 1551 ribosomal sequences of chitinous fungi, Fungi*.Mycol. Res. 107:901-916.
Warnow, T. 2005. Disk covering methods: improving the accuracy andspeed of large scale phylogenetic analyses. Chapter 21, pp. 1-24 inHandbook of computational biology (S. Aluru, ed.). Chapmann &Hall, CRC Computer and Information Science Series.
Williams, T. L., D. A. Bader, M. Yan, and B. M. E. Moret. 2006. High-performance phylogeny reconstruction under maximum parsimony.Pages 369-394 in Parallel computing for bioinformatics and com-putational biology: Models, enabling technologies and case studies(A.Y. Zomaya, ed.). John Wiley & Sons, New York.
Williams, T. L., and M. L. Smith. 2005. Cooperative Rec-I-DCM3: A pop-ulation based approach for reconstructing phylogenies. 2005 IEEESymposium on Computational Intelligence in Bioinformatics andComputational Biology (CIBCB '05):18.
Wheeler, W. C. 2005. Alignment, dynamic homology, and optimization.Pages 71-80 in Parsimony, phylogeny, and genomics (V. A. Alberted.). Oxford University Press, Oxford, UK.
First submitted 15 November 2006; reviews returned 23 January 2007;final acceptance 9 March 2007
Associate Editor: Rod Page


![Rethinking Marxism Volume 4 Issue 2 1991 [Doi 10.1080%2F08935699108657965] Milberg, William -- Marxism, Poststructuralism, And the Discourse of Economists](https://static.fdocuments.us/doc/165x107/577cda4c1a28ab9e78a54d1d/rethinking-marxism-volume-4-issue-2-1991-doi-1010802f08935699108657965.jpg)


![Inquiry (Taylor & Francis) Volume 3 Issue 1 1960 [Doi 10.1080%2F00201746008601302] Hintikka, K. Jaakko J. -- Aristotle's Different Possibilities](https://static.fdocuments.us/doc/165x107/577cce241a28ab9e788d6d24/inquiry-taylor-francis-volume-3-issue-1-1960-doi-1010802f00201746008601302.jpg)

