Synthetic Spotlight SAR Image Generation to Improve ... 2006 Annual Conference Reno, Nevada May 1-5,...
12
ASPRS 2006 Annual Conference Reno, Nevada May 1-5, 2006 SYNTHETIC SPOTLIGHT SAR IMAGE GENERATION TO IMPROVE GEOPOSITIONING ACCURACY Craig Rodarmel, Senior Scientist, Photogrammetry Henry Theiss, Chief Scientist, Photogrammetry Integrity Applications Incorporated 5180 Parkstone Drive, Suite 260 Chantilly, VA 20151 [email protected] [email protected] Todd Johanesen, Chief Scientist Advanced Capabilities Development Division National Geospatial-Intelligence Agency 12300 Sunrise Valley Drive Mail Stop P-78 Reston, VA 20191 [email protected] ABSTRACT Many applications require the ability to use airborne sensor data to perform accurate geopositioning. Synthetic Aperture Radar’s (SAR) ability to image from long distances and in poor weather makes it advantageous for such geopositioning. However, the ability to accurately position using SAR data is reliant on having accurate sensor support data (sensor position, velocity, etc…). This paper examines the ability to use synthetic spotlight SAR images to refine and improve the SAR support data and therefore improve the positioning accuracy. It begins by reviewing the methods used to generate the synthetic image from a high resolution terrain information (HRTI) digital elevation model (DEM). It describes how the algorithms account for the unique image layover and shadowing characteristics of spotlight SAR images. It also describes the calculation of backscatter values and performance of SAR single ray intersections with the terrain surface. Sample SAR images generated from a DEM are presented for comparison to actual SAR data of the same area. The goal is to use the HRTI as a control source. The actual SAR image will be registered to the synthetic SAR, which is generated from the HRTI, and the results of this registration will be used to refine the sensor support data for the actual image. The refined support data will in turn provide improved geo-positioning accuracy. Although further research is required, the results of these methods to date are promising for future utility. INTRODUCTION In recent years, the reliance on airborne remotely sensed data has grown substantially. In the past remotely sensed data was often only used to identify items of interest. However, current applications not only require the ability to identify points of interest in the airborne data, but also require the ability to perform accurate geopositioning on a given point. These applications must generate horizontal (latitude, longitude) and possibly vertical (elevation) coordinates for a given location in a very short timeframe. Synthetic Aperture Radar’s (SAR) ability to image from long distances and in poor weather make it advantageous for many time critical applications. However, for geopositioning applications the ability to accurately position using SAR data is reliant on the availability of accurate sensor support data such as sensor position and velocity. Unfortunately not all SAR systems provide the fidelity of support data necessary for precise geopositioning. Thus there is a need for a method that refines the image support data to allow the time sensitive information collected with SAR sensors to be used in geopositioning applications. As interest in other types of remotely sensed data has increased, so has the interest in elevation data. The development of systems such as Interferometric Synthetic Aperture Radar (IFSAR) and Light Detection and Ranging (LIDAR) along with advancements in the ability to extract elevation data using conventional photogrammetric methods has allowed the collection of Digital Elevation Models (DEM) over much of the earth. With advancements in technology, the spatial resolution of these systems is always increasing and the accuracy of
Transcript of Synthetic Spotlight SAR Image Generation to Improve ... 2006 Annual Conference Reno, Nevada May 1-5,...

ASPRS 2006 Annual Conference Reno, Nevada May 1-5, 2006
SYNTHETIC SPOTLIGHT SAR IMAGE GENERATION TO IMPROVE GEOPOSITIONING ACCURACY
Craig Rodarmel, Senior Scientist, Photogrammetry
Henry Theiss, Chief Scientist, Photogrammetry Integrity Applications Incorporated
5180 Parkstone Drive, Suite 260 Chantilly, VA 20151
[email protected] [email protected]
Todd Johanesen, Chief Scientist
Advanced Capabilities Development Division National Geospatial-Intelligence Agency
12300 Sunrise Valley Drive Mail Stop P-78 Reston, VA 20191
[email protected] ABSTRACT Many applications require the ability to use airborne sensor data to perform accurate geopositioning. Synthetic Aperture Radar’s (SAR) ability to image from long distances and in poor weather makes it advantageous for such geopositioning. However, the ability to accurately position using SAR data is reliant on having accurate sensor support data (sensor position, velocity, etc…). This paper examines the ability to use synthetic spotlight SAR images to refine and improve the SAR support data and therefore improve the positioning accuracy. It begins by reviewing the methods used to generate the synthetic image from a high resolution terrain information (HRTI) digital elevation model (DEM). It describes how the algorithms account for the unique image layover and shadowing characteristics of spotlight SAR images. It also describes the calculation of backscatter values and performance of SAR single ray intersections with the terrain surface. Sample SAR images generated from a DEM are presented for comparison to actual SAR data of the same area. The goal is to use the HRTI as a control source. The actual SAR image will be registered to the synthetic SAR, which is generated from the HRTI, and the results of this registration will be used to refine the sensor support data for the actual image. The refined support data will in turn provide improved geo-positioning accuracy. Although further research is required, the results of these methods to date are promising for future utility.
INTRODUCTION
In recent years, the reliance on airborne remotely sensed data has grown substantially. In the past remotely sensed data was often only used to identify items of interest. However, current applications not only require the ability to identify points of interest in the airborne data, but also require the ability to perform accurate geopositioning on a given point. These applications must generate horizontal (latitude, longitude) and possibly vertical (elevation) coordinates for a given location in a very short timeframe. Synthetic Aperture Radar’s (SAR) ability to image from long distances and in poor weather make it advantageous for many time critical applications. However, for geopositioning applications the ability to accurately position using SAR data is reliant on the availability of accurate sensor support data such as sensor position and velocity. Unfortunately not all SAR systems provide the fidelity of support data necessary for precise geopositioning. Thus there is a need for a method that refines the image support data to allow the time sensitive information collected with SAR sensors to be used in geopositioning applications.
As interest in other types of remotely sensed data has increased, so has the interest in elevation data. The development of systems such as Interferometric Synthetic Aperture Radar (IFSAR) and Light Detection and Ranging (LIDAR) along with advancements in the ability to extract elevation data using conventional photogrammetric methods has allowed the collection of Digital Elevation Models (DEM) over much of the earth. With advancements in technology, the spatial resolution of these systems is always increasing and the accuracy of
ASPRS 2006 Annual Conference Reno, Nevada May 1-5, 2006
the data is improving. DEMs have been used for many years to support photogrammetric and geopositioning applications. In particular, they have been used to support image-to-ground and ground-to-image transformations to allow precise geopositioning from a single image. However, with the increase in resolution and accuracy it may be possible to not only use High Resolution Terrain Information (HRTI)* data for traditional photogrammetric processing, but to also use the data as horizontal control.
This paper proposes the use of HRTI data as one possible method to overcome the shortcomings associated with the support data of some SAR imagery. In particular, this paper will focus on the characteristics associated with spotlight SAR imagery. A method is proposed to create a synthetic spotlight SAR image. By registering an airborne SAR image to the synthetic SAR image generated from HRTI data, both datasets can be used to their full potential. The user gets the timely, high-resolution data associated with spotlight SAR imagery with improved geo-positioning accuracy. Overview of the Proposed Method
The goal of the geopositioning referred to in this paper is to be able to select any pixel in a SAR image and to determine accurate 3-D coordinates for the location of that point in space by using a single ray intersection with the terrain surface defined by a DEM. The problem, as described above, is that the support data currently associated with some SAR spotlight imagery is not accurate enough to perform this geopositioning. This section will provide a brief overview of the proposed method that would allow HRTI data to be used to refine the sensor support data and therefore improve the geopositioning accuracy.
This method requires several pieces of information as inputs. First, it requires High Resolution Terrain Information over the area of interest. However, the poor support data implies that the exact area of interest is not well known, so the DEM must be larger than the area of interest. Second, it requires the airborne SAR imagery. In order for this method to remain generic, it must be able to handle imagery from any viewing geometry. Third, the support data for the image is necessary. Even though it may have poor accuracy, the support data associated with the image is required as an initial approximation.
Once the required input data is available, the algorithms will use the support data to determine the extent of the image’s ground footprint on the HRTI data. Based on the support data and the incidence angle with respect to the HRTI, an intensity value will be calculated for each pixel. The support data will also be used to determine the illumination direction of the image. This information will be used in conjunction with the HRTI data to determine where shadows occur on the image. All of these tools will be used to generate a synthetic spotlight SAR image based on the support data of the actual image.
After the synthetic SAR image is formed, the SAR image will be registered to the synthetic image. Because the synthetic image will provide intensities, layover, and shadow with characteristics similar to the actual image, this registration process can be automated. Once corresponding points and/or features on the airborne SAR image have been tied to the synthetic image, the values of the airborne image support data will be refined through a resection procedure. It is believed that an automated, iterative process can be developed to cycle through the steps of reading the support data, generating a synthetic image, tying the airborne image to the synthetic image, refining the airborne image support data and then repeating the entire process until some threshold is met and the airborne support data is considered to be accurate.
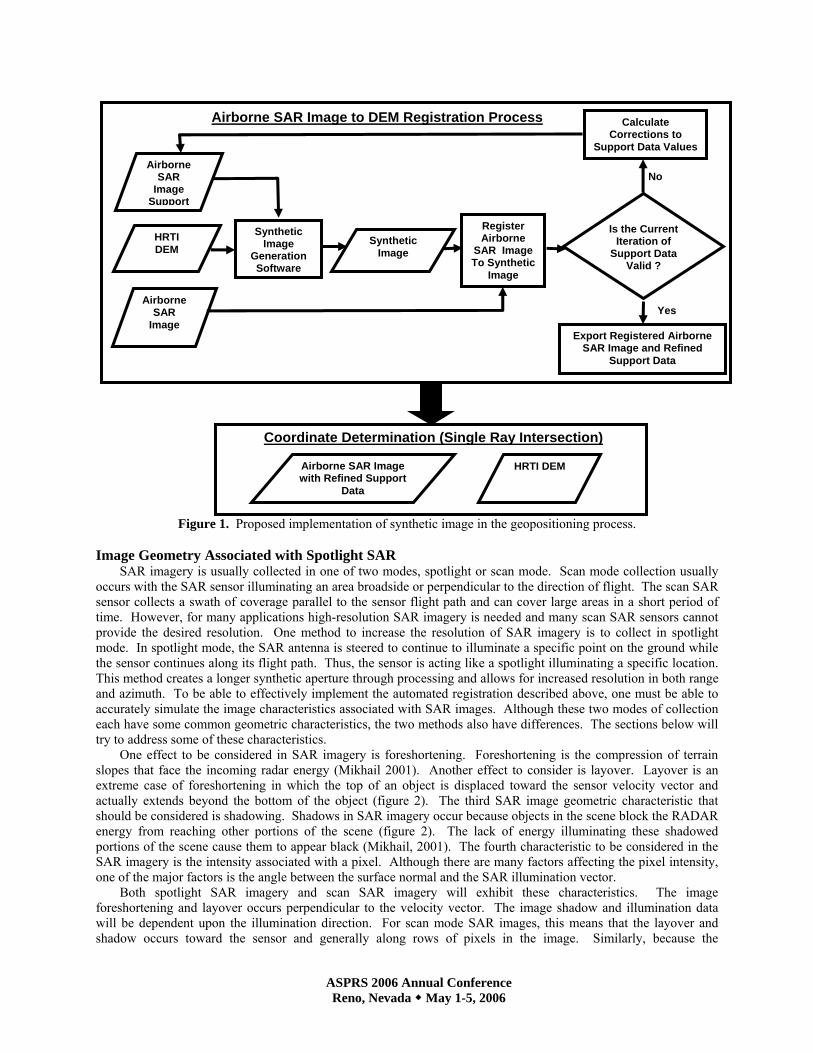
The flow diagram below (figure 1) illustrates the conceptual implementation of synthetic SAR image generation in the geopositioning process and provides the complete flow from image collection to coordinate determination. However, to date, the registration and support data refinement has not been implemented. The focus has been on the generation of the synthetic image. Therefore the remainder of this paper will focus on the generation of the synthetic image
* DEMs with very high spatial resolution and accuracies are often referred to as High Resolution Terrain Information (HRTI)
ASPRS 2006 Annual Conference Reno, Nevada May 1-5, 2006
Figure 1. Proposed implementation of synthetic image in the geopositioning process.
Image Geometry Associated with Spotlight SAR
SAR imagery is usually collected in one of two modes, spotlight or scan mode. Scan mode collection usually occurs with the SAR sensor illuminating an area broadside or perpendicular to the direction of flight. The scan SAR sensor collects a swath of coverage parallel to the sensor flight path and can cover large areas in a short period of time. However, for many applications high-resolution SAR imagery is needed and many scan SAR sensors cannot provide the desired resolution. One method to increase the resolution of SAR imagery is to collect in spotlight mode. In spotlight mode, the SAR antenna is steered to continue to illuminate a specific point on the ground while the sensor continues along its flight path. Thus, the sensor is acting like a spotlight illuminating a specific location. This method creates a longer synthetic aperture through processing and allows for increased resolution in both range and azimuth. To be able to effectively implement the automated registration described above, one must be able to accurately simulate the image characteristics associated with SAR images. Although these two modes of collection each have some common geometric characteristics, the two methods also have differences. The sections below will try to address some of these characteristics.
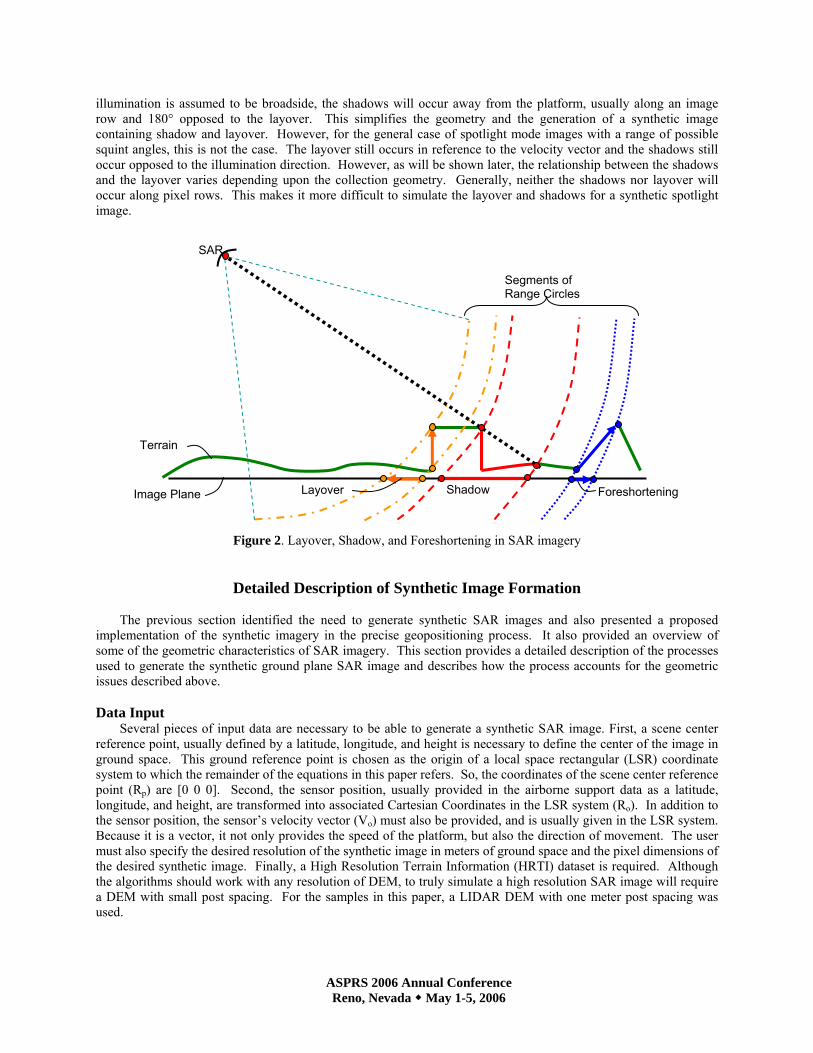
One effect to be considered in SAR imagery is foreshortening. Foreshortening is the compression of terrain slopes that face the incoming radar energy (Mikhail 2001). Another effect to consider is layover. Layover is an extreme case of foreshortening in which the top of an object is displaced toward the sensor velocity vector and actually extends beyond the bottom of the object (figure 2). The third SAR image geometric characteristic that should be considered is shadowing. Shadows in SAR imagery occur because objects in the scene block the RADAR energy from reaching other portions of the scene (figure 2). The lack of energy illuminating these shadowed portions of the scene cause them to appear black (Mikhail, 2001). The fourth characteristic to be considered in the SAR imagery is the intensity associated with a pixel. Although there are many factors affecting the pixel intensity, one of the major factors is the angle between the surface normal and the SAR illumination vector.
Both spotlight SAR imagery and scan SAR imagery will exhibit these characteristics. The image foreshortening and layover occurs perpendicular to the velocity vector. The image shadow and illumination data will be dependent upon the illumination direction. For scan mode SAR images, this means that the layover and shadow occurs toward the sensor and generally along rows of pixels in the image. Similarly, because the
Synthetic Image
Generation Software
Airborne SAR
Image
Airborne SAR
Image Support
HRTI DEM
Synthetic Image
Calculate Corrections to
Support Data Values
Register Airborne
SAR Image To Synthetic
Image
Is the Current Iteration of
Support Data Valid ?
No
Export Registered Airborne SAR Image and Refined
Support Data
Yes
Airborne SAR Image to DEM Registration Process
Airborne SAR Image with Refined Support
Data
HRTI DEM
Coordinate Determination (Single Ray Intersection)
ASPRS 2006 Annual Conference Reno, Nevada May 1-5, 2006
illumination is assumed to be broadside, the shadows will occur away from the platform, usually along an image row and 180° opposed to the layover. This simplifies the geometry and the generation of a synthetic image containing shadow and layover. However, for the general case of spotlight mode images with a range of possible squint angles, this is not the case. The layover still occurs in reference to the velocity vector and the shadows still occur opposed to the illumination direction. However, as will be shown later, the relationship between the shadows and the layover varies depending upon the collection geometry. Generally, neither the shadows nor layover will occur along pixel rows. This makes it more difficult to simulate the layover and shadows for a synthetic spotlight image.
Figure 2. Layover, Shadow, and Foreshortening in SAR imagery
Detailed Description of Synthetic Image Formation
The previous section identified the need to generate synthetic SAR images and also presented a proposed implementation of the synthetic imagery in the precise geopositioning process. It also provided an overview of some of the geometric characteristics of SAR imagery. This section provides a detailed description of the processes used to generate the synthetic ground plane SAR image and describes how the process accounts for the geometric issues described above.
Data Input
Several pieces of input data are necessary to be able to generate a synthetic SAR image. First, a scene center reference point, usually defined by a latitude, longitude, and height is necessary to define the center of the image in ground space. This ground reference point is chosen as the origin of a local space rectangular (LSR) coordinate system to which the remainder of the equations in this paper refers. So, the coordinates of the scene center reference point (Rp) are [0 0 0]. Second, the sensor position, usually provided in the airborne support data as a latitude, longitude, and height, are transformed into associated Cartesian Coordinates in the LSR system (Ro). In addition to the sensor position, the sensor’s velocity vector (Vo) must also be provided, and is usually given in the LSR system. Because it is a vector, it not only provides the speed of the platform, but also the direction of movement. The user must also specify the desired resolution of the synthetic image in meters of ground space and the pixel dimensions of the desired synthetic image. Finally, a High Resolution Terrain Information (HRTI) dataset is required. Although the algorithms should work with any resolution of DEM, to truly simulate a high resolution SAR image will require a DEM with small post spacing. For the samples in this paper, a LIDAR DEM with one meter post spacing was used.
Foreshortening
SAR
Image Plane
Segments of Range Circles
Terrain
Shadow Layover

ASPRS 2006 Annual Conference Reno, Nevada May 1-5, 2006
Spotlight SAR Image-to-Ground Transformation The generation of a synthetic SAR image relies heavily on the ability to perform a spotlight SAR image-to-
ground intersection. For a given image pixel and a given height, this calculation determines the coordinate of the imaged ground point. The procedure calculates a range and Doppler value for a given pixel (figure 3) and then sets up condition equations based on range, Doppler, and desired height. A Newton Iteration method is then used to solve for the coordinates of the imaged ground point:
First, compute the unit vectors that define the ground plane of the spotlight SAR image:
[ ]100=fpz ; )()(
opfp
opfpfp RRz
RRzy
−×−×
= ; fpfpfp zyx ×=
Next, use the local image line and sample
coordinates (l,s) and the pixel size (IPR), to calculate the ground vector from the LSR origin to the pixel of interest in the ground plane:
[ ] pfpfpfp RIPRsIPRl
zyxG +⎥⎥⎥
⎦
⎤
⎢⎢⎢
⎣
⎡=
0**
*
Compute the range and Doppler associated with
the pixel by:
oRGRange −= ; ( )
o
oo
RGRGV
Doppler−
−•=
Use the components of G as the initial approximation of the ground point (R). Then calculate the directional
unit vector (Ru) from the sensor to the current ground point
[ ]TZYXR =
o
ou RR
RRR−−=
Set up a Newton Iteration as follows:
⎥⎥⎥⎥
⎦
⎤
⎢⎢⎢⎢
⎣
⎡
−−
•−−
−•−
−−
•−−
−−−
=
100
*** 000
o
uuzoz
o
uuyoy
o
uuxox
uzuyux
RRRVRV
RRRVRV
RRRVRV
RRR
B ;
( )( )
( ) ⎥⎥⎥⎥⎥
⎦
⎤
⎢⎢⎢⎢⎢
⎣
⎡
−
⎟⎟⎠
⎞⎜⎜⎝
⎛−
−−•
−−
=
heightZ
DopplerRR
RRVRangeRR
fo
oo
o
; where height is the desired height of the intersection.
fBRtosCorrection 1−=Δ=
Vo
Ro
Rp
xfpyfp
Circle of intersection G
Doppler Cone Angle
Range
Figure 3. Defining the Ground Plane.
ASPRS 2006 Annual Conference Reno, Nevada May 1-5, 2006
Use an iterative process to correct R until Δ meets a predetermined threshold. The values of R when the
threshold is met, provide the X, Y, and Z coordinates of the point imaged at the given height.
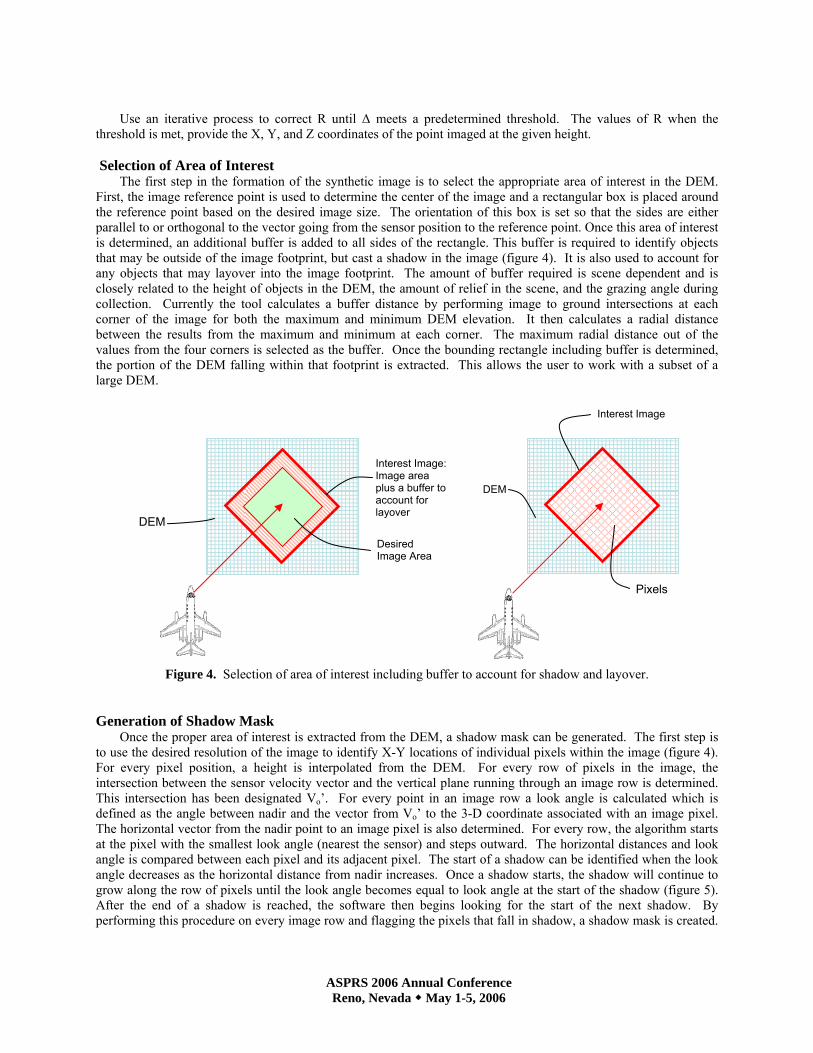
Selection of Area of Interest The first step in the formation of the synthetic image is to select the appropriate area of interest in the DEM.
First, the image reference point is used to determine the center of the image and a rectangular box is placed around the reference point based on the desired image size. The orientation of this box is set so that the sides are either parallel to or orthogonal to the vector going from the sensor position to the reference point. Once this area of interest is determined, an additional buffer is added to all sides of the rectangle. This buffer is required to identify objects that may be outside of the image footprint, but cast a shadow in the image (figure 4). It is also used to account for any objects that may layover into the image footprint. The amount of buffer required is scene dependent and is closely related to the height of objects in the DEM, the amount of relief in the scene, and the grazing angle during collection. Currently the tool calculates a buffer distance by performing image to ground intersections at each corner of the image for both the maximum and minimum DEM elevation. It then calculates a radial distance between the results from the maximum and minimum at each corner. The maximum radial distance out of the values from the four corners is selected as the buffer. Once the bounding rectangle including buffer is determined, the portion of the DEM falling within that footprint is extracted. This allows the user to work with a subset of a large DEM.
Figure 4. Selection of area of interest including buffer to account for shadow and layover.
Generation of Shadow Mask Once the proper area of interest is extracted from the DEM, a shadow mask can be generated. The first step is
to use the desired resolution of the image to identify X-Y locations of individual pixels within the image (figure 4). For every pixel position, a height is interpolated from the DEM. For every row of pixels in the image, the intersection between the sensor velocity vector and the vertical plane running through an image row is determined. This intersection has been designated Vo’. For every point in an image row a look angle is calculated which is defined as the angle between nadir and the vector from Vo’ to the 3-D coordinate associated with an image pixel. The horizontal vector from the nadir point to an image pixel is also determined. For every row, the algorithm starts at the pixel with the smallest look angle (nearest the sensor) and steps outward. The horizontal distances and look angle is compared between each pixel and its adjacent pixel. The start of a shadow can be identified when the look angle decreases as the horizontal distance from nadir increases. Once a shadow starts, the shadow will continue to grow along the row of pixels until the look angle becomes equal to look angle at the start of the shadow (figure 5). After the end of a shadow is reached, the software then begins looking for the start of the next shadow. By performing this procedure on every image row and flagging the pixels that fall in shadow, a shadow mask is created.
Interest Image: Image area plus a buffer to account for layover
Desired Image Area
DEM
Interest Image
Pixels
DEM

ASPRS 2006 Annual Conference Reno, Nevada May 1-5, 2006
The shadow mask based on image pixels is then used to flag points in the DEM as shadow. Once a point is flagged as shadow, its contribution to the backscatter calculation to be described later will be zero.
Figure 5. RADAR Shadow Generation. Calculate Vo’ and then for every image row, determine areas of shadow.
Calculation of Backscatter
After an area of interest is selected and shadow areas are identified, a backscatter or intensity value must be determined for each pixel. This involves first computing the range and the Doppler values. Next, a SAR single ray intersection must be performed (figure 6). Then, for points where the range-Doppler circle intersects the DEM, a local incidence angle is calculated. Finally, these local incidence angles are used to calculate a backscatter value for each pixel. These steps are described in detail below.
First, for every pixel in the image compute the range, Doppler, and unit velocity vector
oRGRange −= ; ( )
o
oo
RGRGV
Doppler−
−•= ;
o
o
VV
v =ˆ
Compute the valid portion of the circle of intersection by performing image-to-ground transformations at both
the minimum and maximum elevations within the DEM to define the extreme points Rmin and Rmax. For each specific range and Doppler combination, compute the center point (Rc) and radius of the circle of intersection.
( )vRRvRR opoc ˆ)(*ˆ •−+= ; cRRRadius −= max
Calculate the unit vectors from Rc to Rmax and Rc to Rmin to describe the vectors to the extreme points and then
calculate the angle (α) between the vectors.
c
c
RRRR
a−−
=max
maxˆ ; c
c
RRRR
b−−
=min
minˆ ; )ˆˆ(acos ba •=α
Step through the valid points of the circle of intersection, varying the angle δ, which is measured from a to the
current range vector (A), to calculate a point on the range-Doppler circle (RDEM).
⎥⎥⎥
⎦
⎤
⎢⎢⎢
⎣
⎡
−⎥⎥⎥
⎦
⎤
⎢⎢⎢
⎣
⎡=
−
)cos()cos(
0
ˆˆˆ 1
δαδ
bav
A and ARR cDEM +=
Vo’:{x,y,z}
Look Angle 1
Distance 1
Look Angle 2
Distance 2
Vo’:{x,y,z}
Distance 1
Look Angle 2 = Look Angle 1
Distance 2
Shadow
Start of Shadow
End of Shadow
Velocity Vector
Vo’:Intersection of projected image row with velocity vector

ASPRS 2006 Annual Conference Reno, Nevada May 1-5, 2006
SAR Illumination ( r )
Local Incidence Angle (θ)
Surface Normal
DEM Surface
Figure 7. Local Incidence Angle
ˆ
For every step, evaluate the elevation of the DEM at that X,Y location. If the DEM Z is within a certain threshold of the Z from RDEM, then consider it a valid intersection.
Figure 6. SAR Single Ray Intersection.
For each point of intersection compute the DEM normal vector (n) by fitting a surface to the nearest DEM points. Next, compute the SAR illumination vector (r) at the point of intersection. Use these two vectors to then calculate the local incidence angle (θ), which in turn is used to calculate a backscatter value (figure 7). For an image point, thus for a specific range and Doppler, the backscatter from all of the points of intersection with the DEM are summed to generate the intensity value for a pixel. This creates some interesting effects such as bright building edges.
( )
DEMo
DEMo
RRRR
r−−
=ˆ
( )
⎟⎟⎠
⎞⎜⎜⎝
⎛ •=n
nrˆ
ˆˆacosθ
During the literature search associated with this project, several formulas were identified to calculate a SAR backscatter value based on local incidence angle. Although many of the formulas were similar, they all had minor variations. All of the formulas investigated seemed to exhibit the characteristic of being very steep at low incidence angles and then flattening out. We chose to use a modified version of the Muhleman backscatter model (Liu, 2004) as follows:
If the incident angle < 65° then the backscatter (σ) is computed by:
( ) ( ) 2.1cossin/cos 33 =+= MwhereMM θθθσ
Velocity Vector
Rc Radius Circle of intersection
Minimum Elev. of DEM
Max. Elev. of DEM
Rc
Segment of Circle of intersection
DEM
Rp
Ro
a
b
A
αδ
RDEM
^
^
RMax
RMin
ASPRS 2006 Annual Conference Reno, Nevada May 1-5, 2006
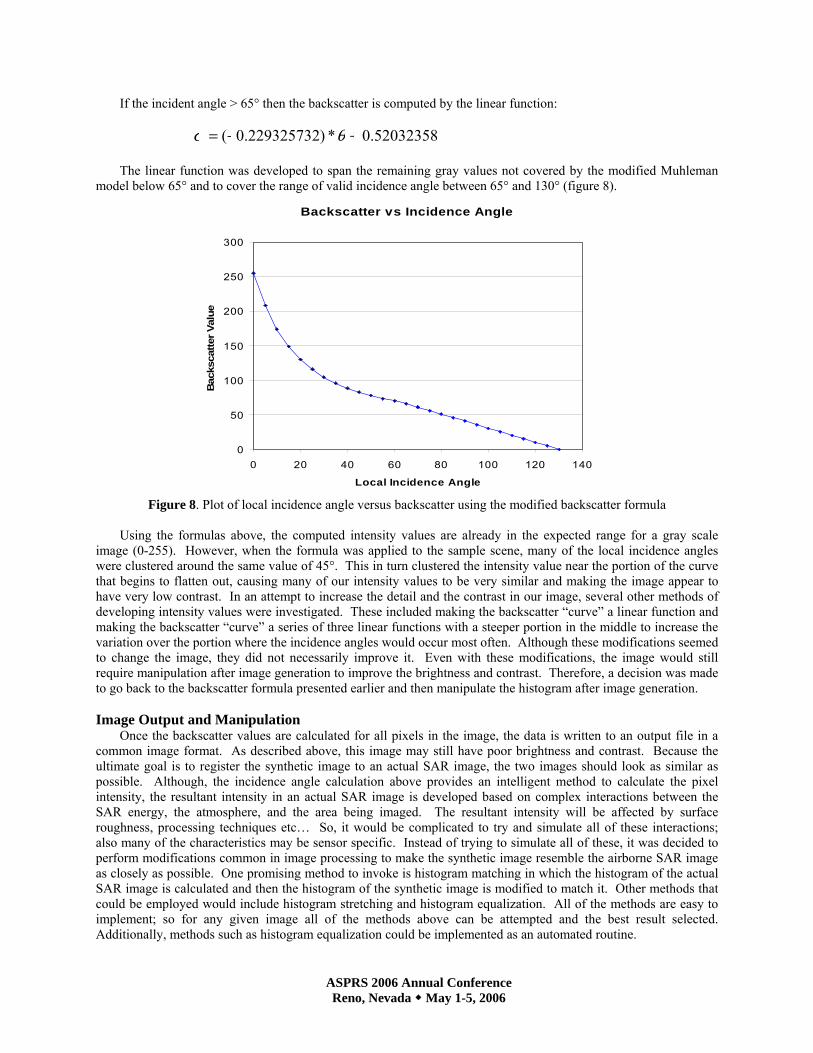
If the incident angle > 65° then the backscatter is computed by the linear function:
52032358.0*)229325732.0( +−= θσ
The linear function was developed to span the remaining gray values not covered by the modified Muhleman model below 65° and to cover the range of valid incidence angle between 65° and 130° (figure 8).
Backscatter vs Incidence Angle
0
50
100
150
200
250
300
0 20 40 60 80 100 120 140
Local Incidence Angle
Bac
ksca
tter V
alue
Figure 8. Plot of local incidence angle versus backscatter using the modified backscatter formula
Using the formulas above, the computed intensity values are already in the expected range for a gray scale
image (0-255). However, when the formula was applied to the sample scene, many of the local incidence angles were clustered around the same value of 45°. This in turn clustered the intensity value near the portion of the curve that begins to flatten out, causing many of our intensity values to be very similar and making the image appear to have very low contrast. In an attempt to increase the detail and the contrast in our image, several other methods of developing intensity values were investigated. These included making the backscatter “curve” a linear function and making the backscatter “curve” a series of three linear functions with a steeper portion in the middle to increase the variation over the portion where the incidence angles would occur most often. Although these modifications seemed to change the image, they did not necessarily improve it. Even with these modifications, the image would still require manipulation after image generation to improve the brightness and contrast. Therefore, a decision was made to go back to the backscatter formula presented earlier and then manipulate the histogram after image generation. Image Output and Manipulation
Once the backscatter values are calculated for all pixels in the image, the data is written to an output file in a common image format. As described above, this image may still have poor brightness and contrast. Because the ultimate goal is to register the synthetic image to an actual SAR image, the two images should look as similar as possible. Although, the incidence angle calculation above provides an intelligent method to calculate the pixel intensity, the resultant intensity in an actual SAR image is developed based on complex interactions between the SAR energy, the atmosphere, and the area being imaged. The resultant intensity will be affected by surface roughness, processing techniques etc… So, it would be complicated to try and simulate all of these interactions; also many of the characteristics may be sensor specific. Instead of trying to simulate all of these, it was decided to perform modifications common in image processing to make the synthetic image resemble the airborne SAR image as closely as possible. One promising method to invoke is histogram matching in which the histogram of the actual SAR image is calculated and then the histogram of the synthetic image is modified to match it. Other methods that could be employed would include histogram stretching and histogram equalization. All of the methods are easy to implement; so for any given image all of the methods above can be attempted and the best result selected. Additionally, methods such as histogram equalization could be implemented as an automated routine.
ASPRS 2006 Annual Conference Reno, Nevada May 1-5, 2006
During the research performed for this project, a small amount of effort was invested into researching published articles about the measurement of surface roughness and surface texture. By using a measure of surface roughness, vegetation may be distinguishable from buildings and open ground. This roughness data could then be used to perform a classification on the individual posts of the DEM. Based on the results of the classification, different shadow and backscatter formulations could be applied to various parts of the image to help it better simulate the actual SAR image. At this point, only preliminary research was performed. Sample Output
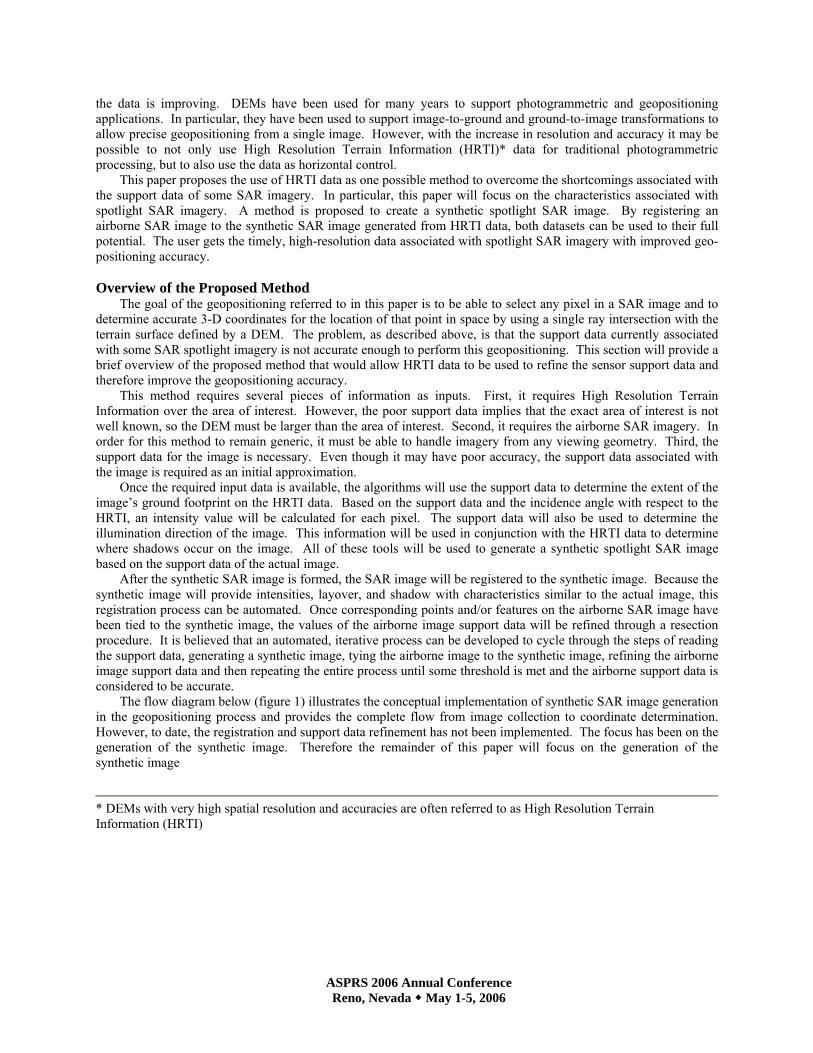
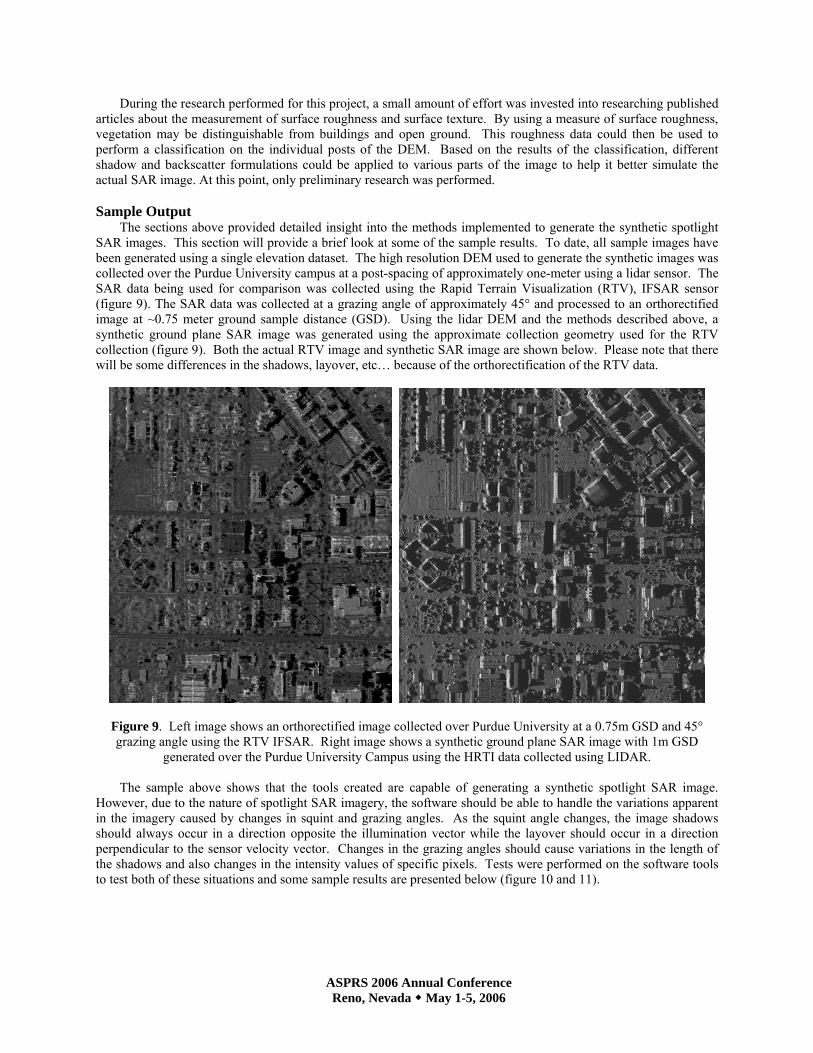
The sections above provided detailed insight into the methods implemented to generate the synthetic spotlight SAR images. This section will provide a brief look at some of the sample results. To date, all sample images have been generated using a single elevation dataset. The high resolution DEM used to generate the synthetic images was collected over the Purdue University campus at a post-spacing of approximately one-meter using a lidar sensor. The SAR data being used for comparison was collected using the Rapid Terrain Visualization (RTV), IFSAR sensor (figure 9). The SAR data was collected at a grazing angle of approximately 45° and processed to an orthorectified image at ~0.75 meter ground sample distance (GSD). Using the lidar DEM and the methods described above, a synthetic ground plane SAR image was generated using the approximate collection geometry used for the RTV collection (figure 9). Both the actual RTV image and synthetic SAR image are shown below. Please note that there will be some differences in the shadows, layover, etc… because of the orthorectification of the RTV data.
Figure 9. Left image shows an orthorectified image collected over Purdue University at a 0.75m GSD and 45° grazing angle using the RTV IFSAR. Right image shows a synthetic ground plane SAR image with 1m GSD
generated over the Purdue University Campus using the HRTI data collected using LIDAR.
The sample above shows that the tools created are capable of generating a synthetic spotlight SAR image. However, due to the nature of spotlight SAR imagery, the software should be able to handle the variations apparent in the imagery caused by changes in squint and grazing angles. As the squint angle changes, the image shadows should always occur in a direction opposite the illumination vector while the layover should occur in a direction perpendicular to the sensor velocity vector. Changes in the grazing angles should cause variations in the length of the shadows and also changes in the intensity values of specific pixels. Tests were performed on the software tools to test both of these situations and some sample results are presented below (figure 10 and 11).

ASPRS 2006 Annual Conference Reno, Nevada May 1-5, 2006
Figure 10. Sample image chips showing the results of varying the squint direction.
Figure 11. Sample image chips showing the results of varying the grazing angles.
CONCLUSIONS Future Work
To date, this project has provided a tool that can be used to generate a synthetic spotlight SAR image. However, to meet the ultimate goals of this project more work has to be performed. First, an attempt has to be made to register the synthetic SAR ground plane images to actual SAR ground plane images. Once the images can be registered, a study should be performed to determine if the data can really be used to improve the metadata of the SAR image. After the registration and subsequent improvement of the metadata are proven to be achievable, then more effort can be placed on refining the image generation code. However, to perform the work described above additional datasets will have to be obtained.
Summary
This paper has proposed a method to support precise geopositioning from airborne SAR imagery. The method involves generating synthetic SAR imagery from HRTI data that would provide a reference to which airborne SAR imagery could be registered. To date the work has focused on the generation of the synthetic image and these results appear promising. However, future work still needs to be performed to verify the fidelity of the synthetic image and to develop the registration techniques.
Right Broadside Look (30° Grazing Angle)
Right Broadside Look (50° Grazing Angle)
Northwest Look (35° Squint Angle) Northeast Look (35° Squint Angle)

ASPRS 2006 Annual Conference Reno, Nevada May 1-5, 2006
ACKNOWLEDGEMENTS
The authors acknowledge, with sincere thanks, the collaboration with colleague Jim Hogarty, also an employee of Integrity Applications Incorporated. Mr. Hogarty contributed significantly to the paper by sharing his knowledge gained from decades of experience with radar imaging.
REFERENCES Arai, K. (1991). GCP Acquisition Using Simulated SAR and Evaluation of GCP Matching Accuracy With Texture
Features. International Journal of Remote Sensing, 12(11): 2389-2397. Bolter, R., A. Pinz (1998). 3D Exploitation of SAR Images. MAVIRIC European Workshop, Kingston, UK, May
1998 Bolter, R. (2000). Reconstruction of Man-Made Objects from High Resolution SAR Images. Proceedings of IEEE
Aerospace Conference 2000, Big Sky, Montana, CD-ROM, Paper No. 6.0305. Kaupp, V., L. Bridges, M. Pisaruck, H. Macdonald, W. Waite (1983). Simulation of Spaceborne Stereo Radar
Imagery: Experimental Results. IEEE Transactions on Geoscience and Remote Sensing, GE-21(3). Kropatsch, W., D. Strobl (1990). The Generation of SAR Layover and Shadow Maps From Digital Elevation
Models. IEEE Transactions on Geoscience and Remote Sensing. January 1990, 28(1): 98-106. Liu, H., Z. Zhao, K. Jezek (2004). Correction of Positional Errors and Geometric Distortions in Topographic Maps
and DEMs Using a Rigorous SAR Simulation Technique. Photogrammetric Engineering & Remote Sensing, 70(9): 1031-1042.
Mikhail, E., J. Bethel, J. McGlone (2001). Introduction to Modern Photogrammetry. John Wiley and Sons, Inc., pp. 301-344.
Nasr, J., D. Vidal-Madjar (1991). Image Simulation of Geometric Targets for Spaceborne Synthetic Aperture Radar. IEEE Transactions on Geoscience and Remote Sensing, 29(6): 986-995.
Petit, D., F. Adragna (1999). A New Interferogram Simulator: 2SIR. Study of Coherence Losses for Tortured Reliefs. CEOS SAR Workshop. CEOS SAR Workshop, October 1999.