Synthesis, spectral and biological studies of nitrogen–sulphur donor macrocyclic ligands and their...
5
Spectrochimica Acta Part A 74 (2009) 370–374 Contents lists available at ScienceDirect Spectrochimica Acta Part A: Molecular and Biomolecular Spectroscopy journal homepage: www.elsevier.com/locate/saa Synthesis, spectral and biological studies of nitrogen–sulphur donor macrocyclic ligands and their transition metals complexes Shweta Verma a,1 , Sulekh Chandra a,∗ , Usha Dev b , Nidhi Joshi b a Department of Chemistry, Zakir Husain College (University of Delhi), J.L.N. Marg, New Delhi-110002, India b Plant Quarantine Division, National Bureau of Plant Genetic Resources, New Delhi-110012, India article info Article history: Received 20 September 2008 Received in revised form 19 May 2009 Accepted 8 June 2009 Keywords: Macrocyclic Complexes Spectroscopic Antifungal activity abstract Mn(II), Co(II), Ni(II) and Cu(II) complexes have been synthesized with 22 and 24 membered tetramide macrocyclic ligands viz; 1,9,12,20-tetraaza-2,8,13,19-tetraone-5,16-dithiacyclodocosane [L 1 ] and 1,9,13,21-tetraaza-2,8,14,20-tetraone-5,17-dithiacyclotetracosane [L 2 ] and characterized by elemen- tal analysis, molar conductance, magnetic susceptibility measurements, mass, IR, electronic EPR spectral studies and electrochemical properties. The molar conductance of all the complexes in DMSO solu- tion is corresponding to 1:2 electrolyte. Thus these complexes may be formulated as [M(L )]Cl 2 [where M = Mn(II), Co(II), Ni(II) and Cu(II) L =L 1 and L 2 ]. On the basis of spectral studies a distorted octahedral geometry has been assigned for all the complexes. The ligands and their complexes were also screened in vitro against two pathogenic fungi (F. moniliformae and R. solani) to assess their growth inhibiting potential. © 2009 Elsevier B.V. All rights reserved. 1. Introduction Transition metal macrocyclic complexes are of great significance in synthesis due to the presence of several potential donor atoms in macrocycles, their flexibility and ability to coordinate with metal ions [1]. Biologically active macrocycles resemble to many natu- ral systems such as prophyrin and cobalamines [2]. Such chelating molecules are also important because they are capable of furnishing an environment of controlled geometry and ligand field strength [3]. Structural factors such as ligand rigidity, the type of donor atoms and their disposition have shown to play significant roles to determine the binding features of macrocyclic toward metal ion [4,5]. Macrocyclic complexes are thermodynamically more stable and more selective metal ion chelates than open chain analogues [6]. These facts have led to a large amount of research is involv- ing in such systems [7]. Aza type ligands are very promising to be used as antifertile, antibacterial, antifungal and for other biolog- ical properties [8–10]. Transition metal complexes have received much attention because they are used as catalyst in oxidation and epoxidation processes [11–13]. In the present paper we report the synthesis, spectro- scopic characterization and biological screening of Mn(II), ∗ Corresponding author. Tel.: +91 9811226273; fax: +91 11 23215 906. E-mail addresses: shweta [email protected] (S. Verma), schandra [email protected] (S. Chandra). 1 Department of Chemistry, Columbia University, New York, NY-10027, USA. Co(II), Ni(II), and Cu(II) complexes with 22 and 24 membered tetramide macrocyclic ligands viz; 1,9,12,20-tetraaza-2,8,13,19- tetraone-5,16-dithiacyclodocosane [L 1 ] and 1,9,13,21-tetraaza- 2,8,14,20-tetraone-5,17-dithiacyclotetracosane [L 2 ](Fig. 1). 2. Experimental All the chemicals used were of analytical grade, and were used as received. All solvents used were of standard/spectroscopic grade. 2.1. Synthesis of ligands (L 1 and L 2 ) A hot ethanolic solution (20 mL) of 3,3 thiodipropionic acid (3.58 g, 0.02 mol), and a hot ethanolic solution (20 mL) of ethylene- diamine (1.2 mL, 0.02 mol for L 1 ) or 1,3 diaminopropane (1.48mL, 0.02 mol for L 2 ) were mixed slowly with constant stirring. The mix- ture was refluxed at 85 ◦ C(±5) for 14h in presence of few drops of concentrated HCl (pH ∼ =3–4). On cooling, a solid yellow precipitate was formed, which was filtered, washed with cold EtOH, and dried under vacuum over P 4 O 10 . 2.2. Synthesis of complexes A hot ethanolic solution of the corresponding ligands (0.001 mol) and hot ethanolic solution (20 mL) of corresponding metal salts (0.001 mol) were mixed together with constant stirring. The mixture was refluxed for 4 h at 80–85 ◦ C. On cooling a coloured complex was formed. It was filtered, washed with cold EtOH and dried under vacuum over P 4 O 10 . 1386-1425/$ – see front matter © 2009 Elsevier B.V. All rights reserved. doi:10.1016/j.saa.2009.06.029
-
Upload
shweta-verma -
Category
Documents
-
view
214 -
download
0
Transcript of Synthesis, spectral and biological studies of nitrogen–sulphur donor macrocyclic ligands and their...
Sm
Sa
b
a
ARRA
KMCSA
1
iiirma[at[a[iuime
s
s
1d
Spectrochimica Acta Part A 74 (2009) 370–374
Contents lists available at ScienceDirect
Spectrochimica Acta Part A: Molecular andBiomolecular Spectroscopy
journa l homepage: www.e lsev ier .com/ locate /saa
ynthesis, spectral and biological studies of nitrogen–sulphur donoracrocyclic ligands and their transition metals complexes
hweta Verma a,1, Sulekh Chandra a,∗, Usha Dev b, Nidhi Joshi b
Department of Chemistry, Zakir Husain College (University of Delhi), J.L.N. Marg, New Delhi-110002, IndiaPlant Quarantine Division, National Bureau of Plant Genetic Resources, New Delhi-110012, India
r t i c l e i n f o
rticle history:eceived 20 September 2008eceived in revised form 19 May 2009ccepted 8 June 2009
a b s t r a c t
Mn(II), Co(II), Ni(II) and Cu(II) complexes have been synthesized with 22 and 24 memberedtetramide macrocyclic ligands viz; 1,9,12,20-tetraaza-2,8,13,19-tetraone-5,16-dithiacyclodocosane [L1]and 1,9,13,21-tetraaza-2,8,14,20-tetraone-5,17-dithiacyclotetracosane [L2] and characterized by elemen-
eywords:acrocyclic
omplexespectroscopicntifungal activity
tal analysis, molar conductance, magnetic susceptibility measurements, mass, IR, electronic EPR spectralstudies and electrochemical properties. The molar conductance of all the complexes in DMSO solu-tion is corresponding to 1:2 electrolyte. Thus these complexes may be formulated as [M(L′)]Cl2 [whereM = Mn(II), Co(II), Ni(II) and Cu(II) L′ = L1 and L2]. On the basis of spectral studies a distorted octahedralgeometry has been assigned for all the complexes. The ligands and their complexes were also screenedin vitro against two pathogenic fungi (F. moniliformae and R. solani) to assess their growth inhibiting
potential.. Introduction
Transition metal macrocyclic complexes are of great significancen synthesis due to the presence of several potential donor atomsn macrocycles, their flexibility and ability to coordinate with metalons [1]. Biologically active macrocycles resemble to many natu-al systems such as prophyrin and cobalamines [2]. Such chelating
olecules are also important because they are capable of furnishingn environment of controlled geometry and ligand field strength3]. Structural factors such as ligand rigidity, the type of donortoms and their disposition have shown to play significant roleso determine the binding features of macrocyclic toward metal ion4,5]. Macrocyclic complexes are thermodynamically more stablend more selective metal ion chelates than open chain analogues6]. These facts have led to a large amount of research is involv-ng in such systems [7]. Aza type ligands are very promising to besed as antifertile, antibacterial, antifungal and for other biolog-
cal properties [8–10]. Transition metal complexes have received
uch attention because they are used as catalyst in oxidation andpoxidation processes [11–13].In the present paper we report the synthesis, spectro-
copic characterization and biological screening of Mn(II),
∗ Corresponding author. Tel.: +91 9811226273; fax: +91 11 23215 906.E-mail addresses: shweta [email protected] (S. Verma),
chandra [email protected] (S. Chandra).1 Department of Chemistry, Columbia University, New York, NY-10027, USA.
386-1425/$ – see front matter © 2009 Elsevier B.V. All rights reserved.oi:10.1016/j.saa.2009.06.029
© 2009 Elsevier B.V. All rights reserved.
Co(II), Ni(II), and Cu(II) complexes with 22 and 24 memberedtetramide macrocyclic ligands viz; 1,9,12,20-tetraaza-2,8,13,19-tetraone-5,16-dithiacyclodocosane [L1] and 1,9,13,21-tetraaza-2,8,14,20-tetraone-5,17-dithiacyclotetracosane [L2] (Fig. 1).
2. Experimental
All the chemicals used were of analytical grade, and were usedas received. All solvents used were of standard/spectroscopic grade.
2.1. Synthesis of ligands (L1 and L2)
A hot ethanolic solution (20 mL) of 3,3′ thiodipropionic acid(3.58 g, 0.02 mol), and a hot ethanolic solution (20 mL) of ethylene-diamine (1.2 mL, 0.02 mol for L1) or 1,3 diaminopropane (1.48 mL,0.02 mol for L2) were mixed slowly with constant stirring. The mix-ture was refluxed at 85 ◦C (±5) for 14 h in presence of few drops ofconcentrated HCl (pH∼=3–4). On cooling, a solid yellow precipitatewas formed, which was filtered, washed with cold EtOH, and driedunder vacuum over P4O10.
2.2. Synthesis of complexes
A hot ethanolic solution of the corresponding ligands
(0.001 mol) and hot ethanolic solution (20 mL) of correspondingmetal salts (0.001 mol) were mixed together with constant stirring.The mixture was refluxed for 4 h at 80–85 ◦C. On cooling a colouredcomplex was formed. It was filtered, washed with cold EtOH anddried under vacuum over P4O10.
S. Verma et al. / Spectrochimica Acta Part A 74 (2009) 370–374 371
2
actE3srEpCo
3
3
pr
TM
C
LC
LC
[C
[C
[C
[C
[C
[C
[C
[C
Fig. 1. Structure of ligands.
.3. Physical measurements
The C, H and N were analysed on Carlo-Ebra 1106 elementalnalyzer. Molar conductance was measured on a ELICO(CM82T)onductivity bridge. Magnetic susceptibility was measured at roomemperature on a Gouy balance using CuSO4·5H2O as a calibrant.lectron impact mass spectra were recorded on JEOL, JMS, DX-03 mass spectrometer. IR spectra (KBr) were recorded on a FT-IRpectrum BX-II spectrophotometer. The electronic spectra wereecorded in DMSO on Shimadzu UV mini-1240 spectrophotometer.PR spectra of the complexes were recorded as polycrystalline sam-les and in the DMSO solution, at liquid nitrogen temperature foro(II) and at room temperature for the Mn(II) and Cu(II) complexesn an E4-EPR spectrometer using DPPH as a g-marker.
. Results and discussion
.1. Ligand
The EI mass spectra of free ligands L1 and L2 confirm the pro-osed formula by showing a peak at 400 and 428 amu (Fig. 2),espectively. Which are corresponding to the macrocyclic moiety
able 1olar conductance and elemental analysis data of the complexes.
ompounds and empirical fomula Molar conductance (�−1 cm2 mol−1) Colou
1 – Yellow16H24N4O4S2
2 – Yellow18H28N4O4S2
Mn(L1)]Cl2 245 White16H24N4O4S2Cl2Mn
Mn (L2)]Cl2 255 White18H28N4O4S2Cl2Mn
Co (L1)]Cl2 234 Pink16H24N4O4S2Cl2Co
Co (L2)]Cl2 198 Pink18H28N4O4S2Cl2Co
Ni (L1)]Cl2 212 Green16H24N4O4S2Cl2Ni
Ni (L2)]Cl2 245 Shiny18H28N4O4S2Cl2Ni Green
Cu (L1)]Cl2 224 Green16H24N4O4S2Cl2Cu
Cu (L2)]Cl2 218 Shiny18H28N4O4S2Cl2Cu Green
Fig. 2. Mass spectra of ligands (a) L1 and (b) L2.
[C16H24N4O4S2] and [C18H28N4O4S2]. IR spectra of the ligands donot show any band corresponding to either free primary diamineor hydroxyl groups [14]. It indicates the complete condensationof the amino group with the keto group [15]. In IR spectra of the
free ligands four new bands appeared in the region 1636–1645(m),1552–1580(s), 1382–1386(m) and 692–725(w) cm−1 correspond-ing to amide I [�(C O)], amide II [�(C–N) + �(N–H)], amide III [�(N–H)]and amide IV [�(C O)], respectively [16]. A broad band in the regionr Yield (%) Elemental analysis data found (calculated) (%)
M C H N S
72 – 39.45 5.84 14.86 16.56(48.0) (6.0) (14.0) (16.0)
75 – 49.86 6.23 12.86 15.16(50.46) (6.54) (13.08) (14.95)
57 10.08 36.12 5.26 10.52 12.56(10.47) (36.50) (4.57) (10.66) (12.19)
53 9.08 38.12 5.26 10.52 10.12(9.94) (39.05) (5.06) (10.12) (11.57)
62 11.22 36.45 4.84 9.86 12.16(11.15) (36.29) (4.53) (10.5) (12.09)
66 10.64 37.89 5.86 10.16 12.02(10.59) (38.77) (5.02) (10.5) (11.49)
58 11.18 36.45 4.72 10.20 12.32(11.14) (36.28) (4.51) (10.2) (12.08)
57 11.08 37.12 5.26 10.52 12.56(10.57) (38.76) (5.01) (10.04) (11.48)
52 12.01 36.72 4.23 9.65 12.15(11.91) (36.02) (4.50) (10.50) (12.0)
59 11.86 37.84 5.22 9.74 10.96(11.31) (38.50) (4.99) (9.98) (11.04)

372 S. Verma et al. / Spectrochimica Acta Part A 74 (2009) 370–374
Table 2Important infrared spectral bands (cm−1) of the compounds.
Compounds Amide I [�(C O)] Amide II [�(C–N) + �(N–H)] Amide III [�(N–H)] Amide IV [�(C O)] [�(N–H)] �(M–N) �(M–S)
L1 1636 1552 1382 692 3278 – –L2 1645 1580 1386 725 3296 – –[Mn(L1)]Cl2 1635 1545 1372 690 3254 265 372[Mn(L2)]Cl2 1642 1562 1370 724 3272 272 370[Co(L1)]Cl2 1635 1545 1370 691 3255 512 382[Co(L2)]Cl2 1642 1562 1381 725 3276 518 392[Ni (L1)]Cl2 1636 1540 1372 692 3252 482 380[Ni (L2)]Cl 1645 1566 1375 724 3284 494 386[ 8[ 7
3s
3
hmpfLbiios
4
5topp(2(t(t
sbgdct5
TE
C
[[[[[[[[
plexes lie in the range 2.72–2.86 BM corresponding to two unpairedelectrons (Table 3). The electronic spectra of the Ni(II) com-plexes display three absorption bands in the range 10,184–10,196(ε = 52–53 L mol−1 cm−1), 18,620–18,624 (ε = 85–92 L mol−1 cm−1)and 20,372–21,470 cm−1 (ε = 142–155 L mol−1 cm−1). These bands
2
Cu (L1)]Cl2 1644 1538 136Cu (L2)]Cl2 1644 1568 137
278–3296 cm−1 may be assigned due to �(N–H) vibrations of theecondary amino group [17,18].
.2. Complexes
On the basis of elemental analysis, the complexes were found toave the composition as shown in Table 1. The molar conductanceeasurements of the complexes in DMSO indicate that all the com-
lexes are 1:2 electrolyte in nature. Thus these complexes may beormulated as [M(L′)]Cl2 [where M = Mn(II), Co(II), Ni(II) and Cu(II)′ = L1 and L2]. On complexation positions of �(N–H), (amide II and III)ands are shifted toward lower side. Some new bands are appeared
n the region 265–554 and 370–394 cm−1 which are correspond-ng to [�(M–N)] and [�(M–S)] bands, this indicates that the nitrogenf –NH group and the thione sulphur participate as a coordinatingites, thus it is implied that ligands are hexadentate (Table 2) [19].
. Manganese(II) complexes
Manganese(II) complexes show magnetic moment 5.88–.96 BM at room temperature corresponding to five unpaired elec-rons (Table 3). The EI mass spectra of the manganese complexf ligand L1 confirms the mononuclear complex by showing aeak at 455 amu (Fig. 3). Electronic spectra of the complexes dis-lay four weak absorption bands in the region 13,415–14,694ε = 38–40 L mol−1 cm−1), 22,550–23,124 (ε = 41–43 L mol−1cm−1),9,345–29,731 (ε = 66–73 L mol−1 cm−1) and 37,572–38,128 cm−1
ε = 129–133 L mol−1cm−1) (Table 3). These bands may be assignedo 6A1g → 4T1g (4G), 6A1g → 4Eg, 4A1g (4G) (10B + 5C), 6A1g → 4E2g4D) (17B + 5C) and 6A1g → 4T1g (4P) (7B + 7C) transitions, respec-ively [20].
EPR spectra of the complexes were recorded as polycrystallineample and in DMSO solution. The polycrystalline samples give oneroad isotropic signal centered at approximately the free electron-value (go = 2.0023). The broadening of the spectrum probably is
ue to spin relaxation (Fig. 4a) [21]. In DMSO solution the Mn(II)omplexes give an EPR spectra containing six lines arising dueo hyperfine interaction between the unpaired electrons with the5Mn nucleus (I = 5/2). The nuclear magnetic quantum number, MIable 3lectronic spectral data of the complexes.
omplexes Spectral bands (cm−1) εmax (L mol−1 cm−1) �eff (BM)
Mn(L1)]Cl2 14,694, 22,550, 29,345, 37,572 38, 41, 66, 129 5.88Mn(L2)]Cl2 13,415, 23,124, 29,731, 38,128 40, 43, 73, 133 5.96Co(L1)]Cl2 11,212, 14,705, 18,647, 33,360 72, 81, 90,139 4.87Co(L2)]Cl2 11,398, 14,792, 18,690, 32,672 73, 89, 94, 141 4.90Ni (L1)]Cl2 10,184, 18,620, 21,470 52, 85, 142 2.72Ni (L2)]Cl2 10,196, 18,624, 20,372 53, 92, 155 2.86Cu (L1)]Cl2 10,172, 18,522, 30,864 49, 62, 150 1.88Cu (L2)]Cl2 10,224, 18,621, 30,395 50, 74, 155 1.91
691 3258 554 394725 3280 532 388
corresponding to these lines are −5/2, −3/2, −1/2, +1/2, +3/2, and+5/2 from low to high field [22].
The parameters B and C were calculated from the second andthird transitions because these transitions are free from the crystalfield splitting and depends on B and C parameters (Table 5) [23].
5. Cobalt(II) complexes
At room temperature the magnetic moments of the cobalt(II)complexes lie in the range 4.87–4.90 BM corresponding tothe three unpaired electrons. The electronic spectra of thecobalt(II) complexes exhibit absorption in the region 11,212–11,398(ε = 72–73 L mol−1 cm−1), 14,705–14,792 (ε = 81–89 L mol−1 cm−1),18,647–18,690 (ε = 90–94 L mol−1 cm−1) and 33,360–32,672 cm−1
(139–141 L mol−1 cm−1). These bands may be assigned to the tran-sitions 4T1g (F) → 4T2g (F) (�1), 4T2g → 4A2g (�2), 4T1g (F) → 4T2g (P)(�3), respectively, and fourth band may be due to charge transfer[24].
The EPR spectra of cobalt(II) complexes were recorded as poly-crystalline samples and in the DMSO solution at liquid nitrogentemperature (LNT). The g-values were found to be almost the samein both cases in polycrystalline samples as well as in the solution(Fig. 4b) (Table 4). The large deviation in g values, the EPR spec-tra, from the spin only value (g-2.0023) is due to large angularmomentum contribution [25].
6. Nickel(II) complexes
At room temperature the magnetic moments of nickel(II) com-
Fig. 3. Mass spectra of Mn[(L1)]Cl2 complex.
S. Verma et al. / Spectrochimica Acta Part A 74 (2009) 370–374 373
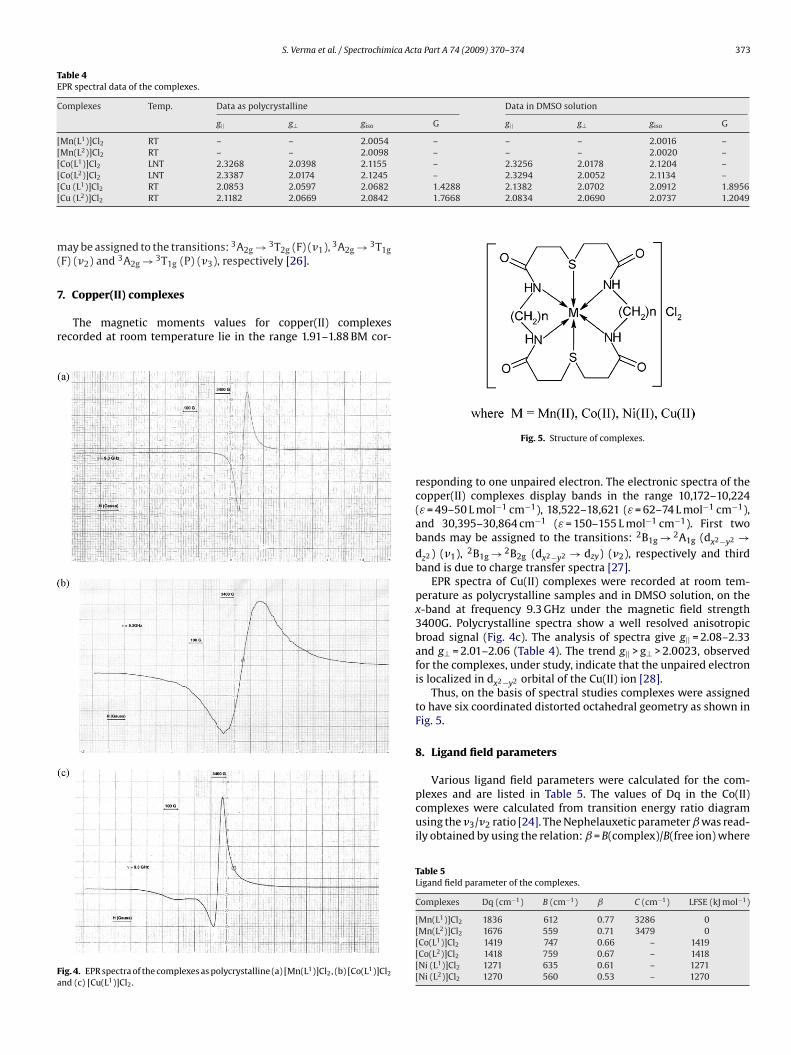
Table 4EPR spectral data of the complexes.
Complexes Temp. Data as polycrystalline Data in DMSO solution
g|| g⊥ giso G g|| g⊥ giso G
[Mn(L1)]Cl2 RT – – 2.0054 – – – 2.0016 –[Mn(L2)]Cl2 RT – – 2.0098 – – – 2.0020 –[Co(L1)]Cl2 LNT 2.3268 2.0398 2.1155 – 2.3256 2.0178 2.1204 –[Co(L2)]Cl LNT 2.3387 2.0174 2.1245 – 2.3294 2.0052 2.1134 –[ 1.4288 2.1382 2.0702 2.0912 1.8956[ 1.7668 2.0834 2.0690 2.0737 1.2049
m(
7
r
Fa
2
Cu (L1)]Cl2 RT 2.0853 2.0597 2.0682Cu (L2)]Cl2 RT 2.1182 2.0669 2.0842
ay be assigned to the transitions: 3A2g → 3T2g (F) (�1), 3A2g → 3T1gF) (�2) and 3A2g → 3T1g (P) (�3), respectively [26].
. Copper(II) complexes
The magnetic moments values for copper(II) complexesecorded at room temperature lie in the range 1.91–1.88 BM cor-
ig. 4. EPR spectra of the complexes as polycrystalline (a) [Mn(L1)]Cl2, (b) [Co(L1)]Cl2
nd (c) [Cu(L1)]Cl2.
Fig. 5. Structure of complexes.
responding to one unpaired electron. The electronic spectra of thecopper(II) complexes display bands in the range 10,172–10,224(ε = 49–50 L mol−1 cm−1), 18,522–18,621 (ε = 62–74 L mol−1 cm−1),and 30,395–30,864 cm−1 (ε = 150–155 L mol−1 cm−1). First twobands may be assigned to the transitions: 2B1g → 2A1g (dx2−y2 →dz2 ) (�1), 2B1g → 2B2g (dx2−y2 → dzy) (�2), respectively and thirdband is due to charge transfer spectra [27].
EPR spectra of Cu(II) complexes were recorded at room tem-perature as polycrystalline samples and in DMSO solution, on thex-band at frequency 9.3 GHz under the magnetic field strength3400G. Polycrystalline spectra show a well resolved anisotropicbroad signal (Fig. 4c). The analysis of spectra give g|| = 2.08–2.33and g⊥ = 2.01–2.06 (Table 4). The trend g|| > g⊥ > 2.0023, observedfor the complexes, under study, indicate that the unpaired electronis localized in dx2−y2 orbital of the Cu(II) ion [28].
Thus, on the basis of spectral studies complexes were assignedto have six coordinated distorted octahedral geometry as shown inFig. 5.
8. Ligand field parameters
Various ligand field parameters were calculated for the com-
plexes and are listed in Table 5. The values of Dq in the Co(II)complexes were calculated from transition energy ratio diagramusing the �3/�2 ratio [24]. The Nephelauxetic parameter ˇ was read-ily obtained by using the relation: ˇ = B(complex)/B(free ion) whereTable 5Ligand field parameter of the complexes.
Complexes Dq (cm−1) B (cm−1) ˇ C (cm−1) LFSE (kJ mol−1)
[Mn(L1)]Cl2 1836 612 0.77 3286 0[Mn(L2)]Cl2 1676 559 0.71 3479 0[Co(L1)]Cl2 1419 747 0.66 – 1419[Co(L2)]Cl2 1418 759 0.67 – 1418[Ni (L1)]Cl2 1271 635 0.61 – 1271[Ni (L2)]Cl2 1270 560 0.53 – 1270
374 S. Verma et al. / Spectrochimica Act
Table 6Fungicidal screening data of compounds showing % growth inhibition at 250 and500 ppm concentrations after 8 days at 30 ± 2 ◦C.
Compounds Fusarium moniliformae Rhizoctonia solani
250 500 250 500
L1 62 74 64 76[Mn(L1)]Cl2 68 80 73 84[Co(L1)]Cl2 74 87 78 91[Ni (L1)]Cl2 64 68 71 77[Cu(L1)] Cl2 72 84 76 88L2 62 68 68 76[Mn(L2)]Cl2 72 84 86 88[ 2
[[S
BC(o
9
cwcacmc
1
iimfcl
[[[[
[[[
[
[[[[[
[[[[[27] Y.-H. Su, J. Liu, J. Li, X.-Z. Si, J. Mol. Struct. 837 (2007) 257–262.
Co(L )]Cl2 76 88 70 93Ni (L2)]Cl2 66 72 78 81Cu(L2)] Cl2 74 86 68 90tandard (Mancozeb) 78 94 82 96
(free ion) for Mn(II) is 786 cm−1, for Ni(II) is 1041 cm−1 and foro(II) is 1120 cm−1 [29]. The values of ˇ lies in the range of 0.53–0.77Table 5). These values indicate the appreciable covalent characterf metal ligand ‘�’ bond.
. Antifungal screening
In vitro antifungal activities of the ligands (L1 and L2) and theiromplexes were tested using food poison technique [30]. Test fungiere Fusarium moniliformae and Rhizoctonia solani. Solution of test
ompounds in distill water were mixed in PDA to give 1000, 750, 500nd 250 ppm concentrations, autoclaved at 100 ◦C and adequatelyooled. The percent inhibition was measured according to the for-ula C − T × 100/C where C and T are the radial diameter of the
olony in control and treatment, respectively.
0. Conclusion
The results have shown that complexes used for the exper-ment exhibited noble activities than the ligands towards the
nhibition of test fungi under the test conditions. MIC (mini-um inhibitory concentration) of test compounds against both theungi was 750 ppm at which 100% inhibition was observed. Theompounds have shown fungal inhibition in the following order:igand < Ni(II) < Cu(II) < Mn(II) < Co(II) (Table 6) [31].
[[[
[
a Part A 74 (2009) 370–374
Acknowledgements
The authors are thankful to the DRDO, New Delhi for financialassistance, and SAIF, IIT Bombay for recording EPR spectra. TheDirector (NBPGR, New Delhi), Dr. R. Khetrapal and Dr. P.C. Agar-wal (Plant Quarantine Division, NBPGR, New Delhi) for providingbiological screening facility.
References
[1] M. Salavati-Niasari, A. Amiri, Trans. Met. Chem. 30 (2005) 720–725.[2] S. Chandra, S. Sharma, J. Ind. Chem. Soc. 84 (2007) 223–226.[3] V.K. Sharma, S. Srivastava, Turk. J. Chem. 30 (2006) 755–767.[4] M. Salavati-Niasari, F. Davar, Inorg. Chem. Commun. 9 (2006) 304–309.[5] P.S. Pan, F.A. Curtius, C.L.I. Medina, L.A. Liotta, et al., Bioorg. Med. Chem. 14
(2006) 4731–4739.[6] G.A. Melson, Coordination Chemistry of Macrocyclic Compounds, Plenum Press,
New York, 1979.[7] F. Li, S. Wan, Z. Li, X. Xiong, L. Yang, X. Zhou, C. Wu, Curr. Med. Chem. 13 (2006)
711–727.[8] El.F.F. Dacunha, T.C. Ramalho, C.A. Taft, R.B. Dealencastro, Lett. Drug Des. Disc.
3 (2006) 17.[9] N. Raman, C. Thangaraja, Pol. J. Chem. 79 (2005) 123–134.10] R. Kumar, R. Singh, Russ. J. Coord. Chem. 32 (2006) 192–198.11] P.M. Reddy, A.V.S.S. Prasad, R. Vadde, Trans. Met. Chem. 32 (2007) 507–573.12] M. Salavati-Niasari, J. Mol. Cat. A 272 (2007) 207–212.13] N. Sengottuvelan, D. Saravanakumar, V. Narayanan, M. Kandaswamy, et al., Bull.
Chem. Soc. Jpn. 77 (2004) 1153–1159.14] S. Chandra, R. Gupta, N. Gupta, Spectrochim. Acta A 63 (2006) 587–593.15] S. Chandra, L.K. Gupta, J. Ind. Chem. Soc. 81 (2004) 739–744.16] K. Nakamoto, Infrared Spectra of Inorganic and Coordination Compounds, Wiley
Interscience, New York, 1970.17] P.S. Kalsi, Spectroscopy of Organic Compounds, 4th ed., New Age International
(P) Ltd., New Delhi, 1999.18] S. Chandra, R. Kumar, Spectrochim. Acta A 67 (2007) 188–195.19] S. Chandra, R. Kumar, Trans. Met. Chem. 29 (2004) 269–271.20] S. Chandra, S. Talwar, U. Sarkar, Inorg. Met. Org. Chem. 31 (1991) 131–142.21] R.C. Sharma, R.S. Sharma, V.K. Khar, J. Inst. Chem. (India) 68 (1996) 119–121.22] A.B.P. Lever, Inorganic Electronic Spectroscopy, 1st ed., Elsevier, Amsterdam,
1968.23] S. Chandra, L.K. Gupta, Spectrochim. Acta A 61 (2005) 2139–2144.24] S. Chandra, L.K. Gupta, Spectrochim. Acta A 61 (2005) 1181–1188.25] S. Chandra, L.K. Gupta, Trans. Met. Chem. 27 (2002) 329–332.26] S. Chandra, L.K. Gupta, Spectrochim. Acta A 60 (2004) 3079–3085.
28] S. Chandra, S. Gupta, J. Ind. Chem. Soc. 82 (2005) 1087–1090.29] S. Chandra, L.K. Gupta, Spectrochim. Acta A 65 (2006) 792–796.30] L. Nene, P.N. Thapiyal, Fungicides in Plant Disease Control, Oxford and Ibh Pub-
lishing House Co., New Delhi, India, 1979, p. 413.31] S. Chandra, L.K. Gupta, D. Jain, Spectrochim. Acta A 60 (2004) 2411–2417.


![Inorganica Chimica Acta€¦ · Two macrocyclic ligands complex with three cadmium atoms to form a helicate monomeric structure [Cd 3L 2(H 2O) 6(CH 3CN) 2] 6+, which extends to a](https://static.fdocuments.us/doc/165x107/6068e310f6622b44b16a381d/inorganica-chimica-acta-two-macrocyclic-ligands-complex-with-three-cadmium-atoms.jpg)