Synthesis of iron doped titanium dioxide by sol-gel method ... 27 06.pdf · Synthesis of iron doped...
10
Processing and Application of Ceramics 9 [1] (2015) 43–51 DOI: 10.2298/PAC1501043O Synthesis of iron doped titanium dioxide by sol-gel method for magnetic applications Karen Oganisian 1,* , Agnieszka Hreniak 2 , Andrzej Sikora 2 , Dominika Gaworska-Koniarek 2 , Agnieszka Iwan 2,* 1 Institute of Low Temperature and Structure Research, PAS, Okolna 2, 50-422 Wroclaw, Poland 2 Electrotechnical Institute, Division of Electrotechnology and Materials Science, M. Sklodowskiej-Curie 55/61 Street, 50-369 Wroclaw, Poland Received 19 January 2015; Received in revised form 2 March 2015; Received in revised form 24 March 2015; Accepted 27 March 2015 Abstract In this paper magnetic properties of six TiO 2 powders doped with 1, 5 and 10mol% Fe and prepared by sol-gel method in two different ways were analysed. The size of the obtained TiO 2 :Fe particles was in the range 200–350nm as it was confirmed by SEM and AFM techniques. The magnetization of nanopowders was measured as a function of temperature (1.8–300K) and applied magnetic field. The samples with low Fe content manifest superparamagnetic dependence of magnetization. Whereas, the other compounds exhibit the paramagnetic behaviour with the negative Curie temperature, that suggests the antiferromagnetic ordering. Mass susceptibility decreased with the increase of Fe content as an effect of reduction of the mobility and number of charge carriers. The measurements showed that magnetic properties are correlated much stronger with the synthesis method than with the grain size. Keywords: TiO 2 , Fe-doping, nanoparticles, AFM, magnetic properties I. Introduction Titanium dioxide has been widely studied and used in different applications such as a photocatalytic mate- rial for self-cleaning coatings, environmental purifiers, antifogging mirrors and many others [1,2]. Taking into the consideration the practical application of TiO 2 , a lot of work have been dedicated to obtain titanium diox- ide doped with different ions, such as Ag, Cu or Ni [1– 9]. Iron has also been used for synthesis of doped-TiO 2 [10–19]. Also, several methods have been developed to prepare Fe 2 O 3 -TiO 2 particles. For example, Liu et al. [18] prepared the Fe-doped TiO 2 nanorod clusters and monodispersed nanoparticles by a modified hydrother- mal and solvothermal method. Shi et al. [19] obtained Fe-La-TiO 2 photocatalysts by a sol-gel method. Some researchers have proposed doping TiO 2 with transition metals as a way to shift the absorption edge to longer wavelengths [10–19]. Moreover, an effort has been dedi- * Corresponding authors: tel: +48 713283061 e-mail: [email protected] (A. Iwan) e-mail: [email protected] (K. Oganisian) cated to doping TiO 2 with Fe(III) [11–13]. For example, Ranjit and Viswanathan [11] have indicated that Fe(III)- doped TiO 2 improves photocatalytic activity up to a cer- tain doping level (1.8 wt.%) of Fe(III). The main goal of this work was the investigation of the influence of the amount of Fe and synthesis method on the magnetic properties of TiO 2 powder as a func- tion of temperature (1.8–300K) and applied magnetic field. A special emphasize was put to investigate the ob- tained TiO 2 :Fe powders via AFM technique including magnetic force microscopy (MFM) method. II. Experimental 2.1. Synthesis Titania powders doped with 1, 5 and 10mol% Fe (TiO 2 :Fe x% where x = 1, 5 and 10) were obtained by using two methods of synthesis. In both cases compo- nents such as titanium(IV)-isopropoxide (TIPO) (99+% purchased from Alfa Aesar), ethanol, and distilled wa- ter were applied and stirred during 4 hours. Difference in both methods of synthesis was only the starting point 43
Transcript of Synthesis of iron doped titanium dioxide by sol-gel method ... 27 06.pdf · Synthesis of iron doped...

Processing and Application of Ceramics 9 [1] (2015) 43–51
DOI: 10.2298/PAC1501043O
Synthesis of iron doped titanium dioxide by sol-gel method formagnetic applications
Karen Oganisian1,∗, Agnieszka Hreniak2, Andrzej Sikora2, Dominika Gaworska-Koniarek2,Agnieszka Iwan2,∗
1Institute of Low Temperature and Structure Research, PAS, Okolna 2, 50-422 Wroclaw, Poland2Electrotechnical Institute, Division of Electrotechnology and Materials Science, M. Sklodowskiej-Curie 55/61
Street, 50-369 Wroclaw, Poland
Received 19 January 2015; Received in revised form 2 March 2015; Received in revised form 24 March 2015; Accepted27 March 2015
Abstract
In this paper magnetic properties of six TiO2 powders doped with 1, 5 and 10 mol% Fe and prepared bysol-gel method in two different ways were analysed. The size of the obtained TiO2:Fe particles was in therange 200–350 nm as it was confirmed by SEM and AFM techniques. The magnetization of nanopowderswas measured as a function of temperature (1.8–300 K) and applied magnetic field. The samples with low Fecontent manifest superparamagnetic dependence of magnetization. Whereas, the other compounds exhibit theparamagnetic behaviour with the negative Curie temperature, that suggests the antiferromagnetic ordering.Mass susceptibility decreased with the increase of Fe content as an effect of reduction of the mobility andnumber of charge carriers. The measurements showed that magnetic properties are correlated much strongerwith the synthesis method than with the grain size.
Keywords: TiO2, Fe-doping, nanoparticles, AFM, magnetic properties
I. Introduction
Titanium dioxide has been widely studied and usedin different applications such as a photocatalytic mate-rial for self-cleaning coatings, environmental purifiers,antifogging mirrors and many others [1,2]. Taking intothe consideration the practical application of TiO2, a lotof work have been dedicated to obtain titanium diox-ide doped with different ions, such as Ag, Cu or Ni [1–9]. Iron has also been used for synthesis of doped-TiO2[10–19]. Also, several methods have been developed toprepare Fe2O3-TiO2 particles. For example, Liu et al.
[18] prepared the Fe-doped TiO2 nanorod clusters andmonodispersed nanoparticles by a modified hydrother-mal and solvothermal method. Shi et al. [19] obtainedFe-La-TiO2 photocatalysts by a sol-gel method. Someresearchers have proposed doping TiO2 with transitionmetals as a way to shift the absorption edge to longerwavelengths [10–19]. Moreover, an effort has been dedi-
∗Corresponding authors: tel: +48 713283061e-mail: [email protected] (A. Iwan)e-mail: [email protected] (K. Oganisian)
cated to doping TiO2 with Fe(III) [11–13]. For example,Ranjit and Viswanathan [11] have indicated that Fe(III)-doped TiO2 improves photocatalytic activity up to a cer-tain doping level (1.8 wt.%) of Fe(III).
The main goal of this work was the investigation ofthe influence of the amount of Fe and synthesis methodon the magnetic properties of TiO2 powder as a func-tion of temperature (1.8–300 K) and applied magneticfield. A special emphasize was put to investigate the ob-tained TiO2:Fe powders via AFM technique includingmagnetic force microscopy (MFM) method.
II. Experimental
2.1. Synthesis
Titania powders doped with 1, 5 and 10 mol% Fe(TiO2:Fe x% where x = 1, 5 and 10) were obtained byusing two methods of synthesis. In both cases compo-nents such as titanium(IV)-isopropoxide (TIPO) (99+%purchased from Alfa Aesar), ethanol, and distilled wa-ter were applied and stirred during 4 hours. Differencein both methods of synthesis was only the starting point
43

K. Oganisian et al. / Processing and Application of Ceramics 9 [1] (2015) 43–51
of Fe(NO3)3×9 H2O addition to the mixture. In the firstmethod Fe(NO3)3 (purchased from POCh Gliwice) wasadded at the beginning of synthesis, while in the sec-ond case Fe(NO3)3 was added to sol mixture 2 hoursafter the beginning of synthesis and stirred for another2 hours. Details of the TiO2:Fe synthesis are presentedbelow.
The iron doped titania powders synthesized by thefirst method (TiO2:Fe x%-a, where x = 1, 5 and 10)were prepared by sol-gel method. Briefly, 4.5 ml oftitanium(IV)-isopropoxide (TIPO) dissolved in 21 mlof ethanol was mixed with 3.5 ml of distilled wa-ter and Fe(NO3)3 to obtain sol with the molar ratioFe(NO3)3/TIPO equal to 1%, 5% and 10%. The solu-tion was stirred in a plastic flask at room temperaturefor 4 h. During the stirring, the titanium dioxide powderwas formed and after filtering dried at room tempera-ture. The obtained TiO2:Fe x%-a powders were heatedat 500 °C for one hour.
The iron doped titania powders synthesized by thesecond method were abbreviated as TiO2:Fe x%-b(where x = 1, 5 and 10). Briefly, 4.5 ml of TIPO and21 ml of ethanol were mixed with 3.5 ml of distilledwater yielding a titania sol. The solution was stirredin a plastic flask at room temperature for 2 h. Then,
Fe(NO3)3 was added to the obtained sol (the molar ra-tio Fe(NO3)3/TIPO equal to 1%, 5%, 10%) and mixedfor another 2 h. During the stirring, titania particleswere formed and after filtering dried at room temper-ature. The TiO2:Fe x%-b powders were finally heated at500 °C for one hour.
Figure 1. X-ray pattern of pure TiO2 powderannealed at 500 °C
(a) (b) (c)
(d) (e) (f)
Figure 2. SEM micrographs of Fe doped titanium dioxide powders: a) TiO2:Fe 1%-a, b) TiO2: Fe 5%-a, c) TiO2:Fe 10%-a,d) TiO2:Fe 1%-b, e) TiO2:Fe 5%-b and f) TiO2:Fe 10%-b
44

K. Oganisian et al. / Processing and Application of Ceramics 9 [1] (2015) 43–51
(a) (b) (c)
(d) (e) (f)
Figure 3. AFM micrographs - topography: a) TiO2:Fe 1%-a, b) TiO2: Fe 5%-a, c) TiO2:Fe 10%-a andAFM micrographs - Sobel transform: d) TiO2:Fe 1%-a, e) TiO2:Fe 5%-a, f) TiO2:Fe 10%-a
2.2. AFM, SEM and XRD measurements
Atomic force microscopy (AFM) measurements wereperformed with Innova system from Bruker (formerlyVeeco) in air, at temperature 23 °C and humidity 35%RH. In order to perform the imaging of magnetic proper-ties of the investigated powders, such as the presence ofmagnetic domains, magnetic force microscopy (MFM)was used [20]. The measurements were performed usingMESP-LC probes from Bruker [21,22]. The liftmodeheight was set to 40 nm, in order to obtain selective de-tection of the long range magnetic forces.
In order to perform the AFM measurements of theprepared Fe doped TiO2 powders, the microscope glasswas used as the substrate. The surface of the glass wascovered with cyanoacrylate glue and left for few sec-onds for preliminary cure. A small quantity of the pow-der was carefully placed on the surface of the substrateand left for few minutes to cure the glue. Afterwards,the weakly attached grains of the powder were removedusing pressured air, in order to avoid them to stick tothe scanning tip. Such an approach allowed obtaining ofsmall agglomerates and single grains on the surface.
Scanning electron microscopy (SEM) studies wereperformed with a tungsten cathode Vega II SBH (TES-CAN) to examine the morphology of the prepared Fedoped TiO2 powders.
X-ray diffraction patterns were recorded using pow-
der on a Pulveraceous diffractometer Dron–2. Co radia-tion filtrated by Fe was applied.
2.3. Magnetic measurements
The magnetic measurements were performed usingthe 12 T SQUID magnetic properties measurement sys-tem by quantum design. The dependences of the mag-netization as a function of temperature and magnetiza-tion as a function of applied magnetic field were stud-ied. Measurements of the temperature dependence ofmagnetization were carried out in the wide temperaturerange (1.8–300 K) at 0.5 T magnetic field. The measure-ments were performed in two manners: zero field cooled(ZFC) and cooled field (CF) for the sample TiO2:Fe 1%and zero field cooled only for others samples. Cooledfield measurement was carried only once due to the sim-ilar results with the zero-cooled field measurement.
III. Results and discussion
3.1. Structural characterization
X-ray diffraction and scanning electron microscopy(SEM) were used to analyse the prepared TiO2 pow-ders. The X-ray spectrum of the TiO2 annealed at 500 °Cshows the diffraction pattern characteristic to anatasecrystalline phase (see Fig. 1). A major peak correspond-ing to 101 reflections of the anatase phase of TiO2 was
45

K. Oganisian et al. / Processing and Application of Ceramics 9 [1] (2015) 43–51
(a) (b) (c)
(d) (e) (f)
Figure 4. AFM micrographs - topography: a) TiO2:Fe 1%-b, b) TiO2: Fe 5%-b, c) TiO2:Fe 10%-b andAFM micrographs - Sobel transform: d) TiO2:Fe 1%-b, e) TiO2:Fe 5%-b, f) TiO2:Fe 10%-b
apparent at the angle of 29.45°. The X-ray results arein good agreement with other papers dedicated to TiO2[23].
The TiO2:Fe powders were investigated by SEMtechnique. Morphologies of TiO2:Fe revealed by SEMmicrographs are shown in Fig. 2. The TiO2:Fe samplesappeared as agglomerates of smaller particles. The sizeof the obtained TiO2:Fe particles is about 200–250 nmfor TiO2:Fe 1%-a and TiO2:Fe 5%-b and about 350 nmfor other powders, as it was confirmed by SEM.
Additionally the samples were measured with in-termittent contact mode by AFM. The AFM imagesof TiO2:Fe samples are presented in Figs. 3 and 4.The ranges of the diameter are as follows: 50–250 nmfor TiO2:Fe 1%-a, 25–150 nm for TiO2:Fe 1%-b, 10–100 nm for TiO2:Fe 5%-a, 20–180 nm for TiO2:Fe 5%-b, 5–250 nm for TiO2:Fe 10%-a and 5–200 nm forTiO2:Fe 10%-b sample. The diameter distribution is nothowever Gaussian. Two fractions are apparent: the smallone below 50 nm, and the large one above 100 nm. Theamount of small grains appears to be relatively small,but it is difficult to estimate quantitatively, as such asmall features may be hidden in the agglomerates andmaintain undetected by SEM or AFM. Mapping themagnetic properties of single grains using MFM al-lowed estimating the size of magnetic domains (see Fig.5). The obtained data enabled us to observe good corre-lation between grains and magnetic domains sizes. Ad-
ditionally, no multiple- domains grains were observed.It should be noted, that along with Fe level increase,the grains created larger agglomerates. As the magneticproperties are weaker for materials containing more Fecomponent (see Magnetic study section), one can argueif such a behaviour may be related to domination of theadhesion forces over repulsive magnetic forces presentbetween single magnetic domain grains. SPIP softwarewas used for the data processing and analysis [21].
3.2. Magnetic study
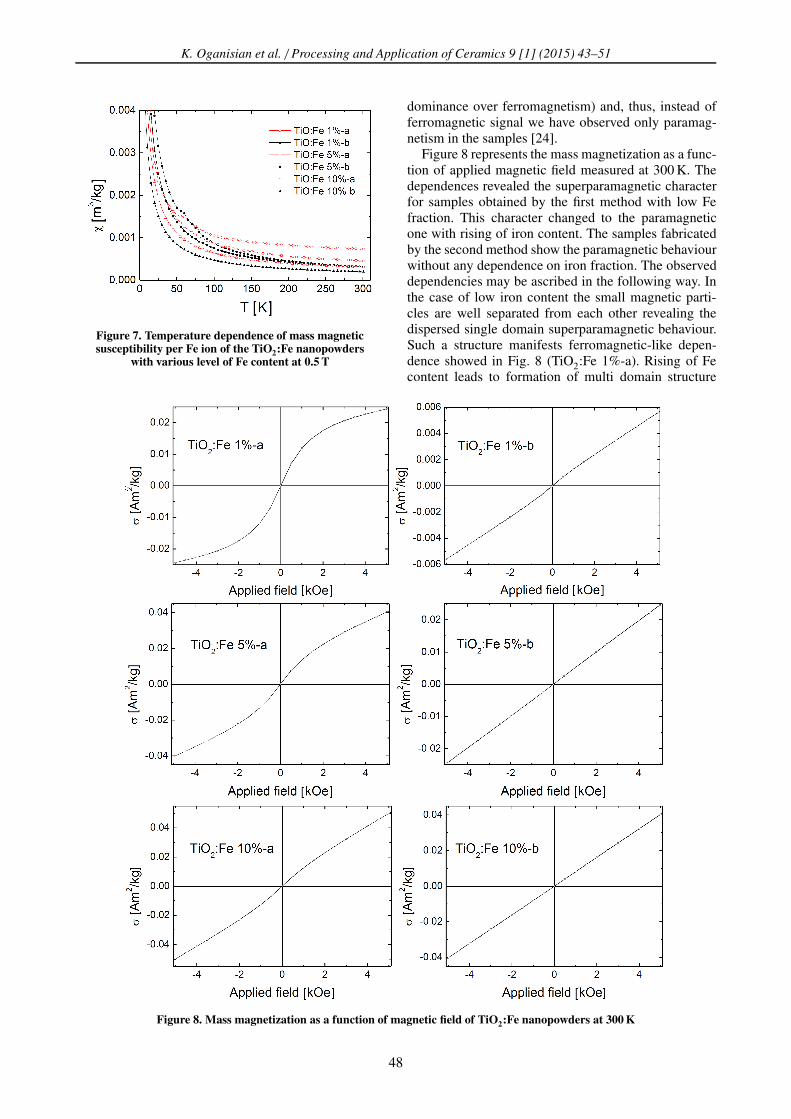
The results of temperature dependence of mass mag-netization for TiO2:Fe powders are presented in Fig.6. As seen, mass magnetization rises with Fe content.However, as it will be described below, mass suscepti-bility per Fe ion is decreasing with amount of iron (seeFig. 7).
The TiO2:Fe 1%-a and TiO2:Fe 1%-b samplesdemonstrate a peak at about 60 K which may relate witha superparamagnetic blocking temperature. Interpreta-tion of this effect required the additional investigationsof AC magnetization of these compounds. Other sam-ples show the conventional paramagnetic dependence inthe whole temperature range. One can suppose that thefraction of Fe and its oxides are too low and most of theFe ions are located on the lattice interior. They are likelyto undergo very week ferromagnetic exchange interac-tion (with paramagnetism or antiferromagnetism having
46

K. Oganisian et al. / Processing and Application of Ceramics 9 [1] (2015) 43–51
Figure 5. MFM of TiO2 powder with Fe 5%-a, as an example
Figure 6. Temperature dependence of mass magnetization of TiO2:Fe nanopowders measured at 0.5 T. For TiO2:Fe 1%-asample open circles correspond to the result obtained at zero field cooled; filled circles correspond to the data
obtained at field cooled measurements
47
K. Oganisian et al. / Processing and Application of Ceramics 9 [1] (2015) 43–51
Figure 7. Temperature dependence of mass magneticsusceptibility per Fe ion of the TiO2:Fe nanopowders
with various level of Fe content at 0.5 T
dominance over ferromagnetism) and, thus, instead offerromagnetic signal we have observed only paramag-netism in the samples [24].
Figure 8 represents the mass magnetization as a func-tion of applied magnetic field measured at 300 K. Thedependences revealed the superparamagnetic characterfor samples obtained by the first method with low Fefraction. This character changed to the paramagneticone with rising of iron content. The samples fabricatedby the second method show the paramagnetic behaviourwithout any dependence on iron fraction. The observeddependencies may be ascribed in the following way. Inthe case of low iron content the small magnetic parti-cles are well separated from each other revealing thedispersed single domain superparamagnetic behaviour.Such a structure manifests ferromagnetic-like depen-dence showed in Fig. 8 (TiO2:Fe 1%-a). Rising of Fecontent leads to formation of multi domain structure
Figure 8. Mass magnetization as a function of magnetic field of TiO2:Fe nanopowders at 300 K
48

K. Oganisian et al. / Processing and Application of Ceramics 9 [1] (2015) 43–51
Figure 9. Temperature dependence of the reciprocal massmagnetic susceptibility per Fe ion of the TiO2:Fe with
various level of Fe content
of iron reach particles. In this case magnetization hasa non-trivial dependence showing weak ferromagnetic-like and then paramagnetic-like character with rising ofapplied field.
All samples show the linear temperature dependenceof the reciprocal susceptibility at high temperatures (seeFig. 9). It is easy to see that reciprocal susceptibilityincreases due to the iron doping. Such unexpected be-haviour was observed in Fe and Ni doped TiO2 films[25]. The authors in Ref. [25] relate this feature to theremark of Wokano et al. [26] assuming that rising ofNi content leads to decreasing of carrier density and itsmobility.
The deviation from linearity appears when antifer-romagnetic interaction dominates at lower tempera-tures. Such a character of dependences indicates theparamagnetic behaviour of susceptibility with relativelylarge values of the Curie temperature. In such sys-tems, similarly as authors described in [23], param-agnetism appears because of the presence of isolatedFe3+ ions and the antiferromagnetic interaction mightoccur between Fe3+ dimmers or between Fe3+−Fe3+
(or Fe3+−O2−Fe3+) pair. Both of these contribute to-wards magnetization, while at high temperature the antialignment of the spins in Fe3+ pair is broken and allspins align randomly showing characteristic of param-agnetism.
Due to the paramagnetic behaviour of all curves, theCurie-Weiss law can be applied to obtain the generalmagnetic parameters. Table 1 contains the Curie tem-perature, θp, and effective magnetic moment, µef f , ofeach sample obtained from the Curie-Weiss law for lin-ear part of fitted curves (characteristics fitting on the de-pendences) presented in Fig. 9. Figure 9 shows the tem-perature dependence of the reciprocal magnetic suscep-tibility per Fe ion which was estimated using the valuesfrom Table 1.
The highest values of µef f correspond to the low-est Fe content. Moreover, these values for samples pre-pared by the first method are higher in comparison
Table 1. List of θp, and µeff for all samples obtained fromcurves showed in Fig. 9 (µeff taken at 300 K)
Sampleθp µef f µef f
[K] [J/T] [µB]TiO2:Fe 1%-a -582 1.38 · 10−24 0.149TiO2:Fe 5%-a -206 1.09 · 10−24 0.117
TiO2:Fe 10%-a -117 0.89 · 10−24 0.096TiO2:Fe 1%-b -21 0.90 · 10−24 0.097TiO2:Fe 5%-b -47 0.88 · 10−24 0.095TiO2:Fe 10%-b -75 0.72 · 10−24 0.078
with values of the nanopowders obtained by the secondmethod. The relatively high negative values of θp sug-gest the antiferromagnetic ordering in all samples ex-cept for the TiO2:Fe 1%-a and TiO2:Fe 1%-b sampleswhich have a peak at about 50 K that could be due toferromagnetic ordering in these compounds. Indepen-dently from nanopowders preparation method, the val-ues of effective magnetic moment per Fe ion are rathersmall in comparison to the value obtained within theRussell-Sounders coupling model, where µef f of Fe2+
is 4.54 · 10−23 J/T (if J = S ) or 6.21 · 10−23 J/T (ifJ = |L ± S |).
Figure 10 shows the θp and µef f as a function ofFe content for the samples obtained by both methods.Filled circles and squares correspond to the compoundsobtained by the first method; hollow symbols corre-spond to the nanopowders synthesized by the secondmethod.
Figure 10. θp and µeff as a function of Fe content for thesamples obtained by two methods. Red curves
correspond to the θp values (left axes); bluecurves correspond to the µeff (right axes)
As it can be seen, the samples obtained by the firstmethod manifest strong dependences of Curie tem-perature and magnetic moment on the Fe content. Atthe same time, the compounds obtained by the secondmethod show more moderate dependence. The θp ofsamples obtained by the first method rises with the Fecontent but the samples obtained by the second methodexhibit the decrease of θp on Fe concentration. How-ever, the compounds obtained by both methods mani-fest the reduction of µef f with the concentration of Feions simultaneously. Actually, this effect was expected
49

K. Oganisian et al. / Processing and Application of Ceramics 9 [1] (2015) 43–51
to be opposite at least for µef f due to the magnetic na-ture of iron. Probably, this effect appears due to the re-duction of mobility and number of charge carriers as aresult of magnetic doping. An answer to this questionrequires an additional investigation of Hall-effect. Also,it should be taken into account that the TiO2 has thediamagnetic nature thus some competition between fer-romagnetic and diamagnetic particles is achieved. It isinteresting that the highest discrepancy of values of θp
and µef f was achieved at lowest Fe content for samplesobtained by both methods. At the same time, this dif-ference was rather reduced at higher concentrations ofFe.
IV. Conclusions
In summary, the magnetization as a function of tem-perature and applied magnetic field of TiO2 nanopow-ders doped with 1, 5 and 10 mol% Fe and prepared bysol-gel method in two different ways has been measuredin the wide temperature and magnetic field range. Ex-cept for the low Fe fraction samples, all compoundsexhibit the paramagnetic behaviour with the negativeCurie temperature that suggests the antiferromagneticordering. The samples with 1 and 5 mol% of Fe re-vealed superparamagnetic dependence on applied fieldwith relatively low blocking temperature. Decreasingof mass susceptibility with the increasing of Fe con-tent can be interpreted as a result of reduction of themobility and number of charge carriers. The measure-ments showed that magnetic properties are more relatedto the nanopowders preparation method than to theirgrain size.
In order to better understand the influence of Fe ionson the magnetic properties of TiO2, the additional stud-ies of AC magnetization at low temperatures and Hall-effect are required.
Acknowledgement: The research was supported byWroclaw Research Centre EIT+ under the project “TheApplication of Nanotechnology in Advanced Materi-als” – NanoMat (POIG.01.01.02-002/08) financed fromthe European Regional Development Fund (OperationalProgramme Innovative Economy, 1.1.2). The authorsthank Dr. J. Warycha for SEM images of TiO2.
References
1. J. Ananpattarachai, P. Kajitvichyanukul, S. Seraphin,“Visible light absorption ability and photocatalyticoxidation activity of various interstitial N-dopedTiO2 prepared from different nitrogen dopants”, J.
Hazard. Mater., 168 (2009) 253–261.2. A. Fujishima, K. Hashimoto, T. Watanabe, TiO2
Photocatalysis: Fundamentals and Applications,BKC Inc., Tokyo, Japan, 1999.
3. Y. Zhang, Y. Chen, P. Westerhoff, J. Crittenden, “Im-pact of natural organic matter and divalent cations onthe stability of aqueous nanoparticles”, Water Res.,
43 (2009) 4249–4257.4. I. Ganesh, A.K. Gupta, P.P. Kumar, P.S. Chandra
Sekhar, K. Radha, G. Padmanabham, G. Sundarara-jan, “Preparation and characterization of Co-dopedTiO2 materials for solar light induced current andphotocatalytic applications”, Mater. Chem. Phys.,135 (2012) 220–234.
5. H-W. Wang, H-C. Lin, C-H. Kuo, Y-L. Cheng, Y-C.Yeh, “Synthesis and photocatalysis of mesoporousanatase TiO2 powders incorporated Ag nanoparti-cles”, J. Phys. Chem. Solids, 69 (2008) 633–636.
6. Y. Lai, Y. Chen, H. Zhuang, C. Lin, “A facile methodfor synthesis of Ag/TiO2 nanostructures”, Mater.
Lett., 62 (2008) 3688–3690.7. S.A. Amin, M. Pazouk, A. Hosseinnia, “Synthesis
of TiO2-Ag nanocomposite with sol-gel method andinvestigation of its antibacterial activity against E.coli”, Powder Technol., 196 (2009) 241–245.
8. X. S. Li, G. E. Fryxell, C. Wang, M. H. Engelhard,“The synthesis of Ag-doped mesoporous TiO2”, Mi-
cropor. Mesopor. Mater., 111 (2008) 639–642.9. Q-H. Wu, A. Fortunelli, G. Granozzi, “Preparation,
characterisation and structure of Ti and Al ultrathinoxide films on metals”, Int. Rev. Phys. Chem., 28
(2009) 517–576.10. M. Cernea, C. Valsangiacom, R. Trusca, F. Vasiliu,
“Synthesis of iron-doped anatase -TiO2 powders bya particulate sol-gel route”, J. Optoelectron. Adv.
Mater., 9 (2007) 2648–2652.11. K. Ranjit, B. Viswanathan, “Synthesis, characteri-
zation and photocatalytic properties of iron-dopedTiO2 catalysts”, J. Photochem. Photobiol. A: Chem.,108 (1997) 79–84.
12. M. Litter, J. Navio, “Photocatalytic properties ofiron-doped titania semiconductors”, J. Photochem.
Photobiol. A: Chem., 98 (1996) 171–181.13. N.J. Peill, M.R. Hoffmann, “Mathematical model of
a photocatalytic fiber- optic cable reactor for hetero-geneous photocatalysis”, Environ. Sci. Technol., 32
(1998) 398–404.14. N. Nasralla, M. Yeganeh, Y. Astuti, S. Piticharoen-
phuna, N. Shahtahmasebi, A. Kompany, M. Karim-ipour, B.G. Mendis, N.R.J. Poolton, L. Šiller, “Struc-tural and spectroscopic study of Fe-doped TiO2nanoparticles prepared by sol-gel method”, Sci. Iran-
ica F, 20 (2013) 1018.15. I. Ganesh, P.P. Kumar, A. K. Gupta, P.S.C. Sekhar, K.
Radha, G. Padmanabham, G. Sundararajan, “Prepa-ration and characterization of Fe-doped TiO2 pow-ders for solar light response and photocatalytic ap-plications”, Process. Appl. Ceram., 6 (2012) 21–36.
16. K.S. Yao, D.Y. Wang, J.J. Yan, L.Y. Yang, W.S.Chen, “Photocatalytic bactericidal effect of TiO2 thinfilm on plant pathogens”, Surf. Coat. Technol., 201
(2007) 6882–6885.17. T.C. Cheng, K.S. Yao, N. Yeh, C.I. Chang, H.C.
Hsu, Y.T. Chien, C.Y. Chang, “Visible light activatedbactericidal effect of TiO2/Fe3O4 magnetic particles
50

K. Oganisian et al. / Processing and Application of Ceramics 9 [1] (2015) 43–51
on fish pathogens”, Surf. Coat. Technol., 204 (2009)1141–1144.
18. Y. Lui, J.H. Wei, R. Xiong, C.X. Pan, J. Shi, “En-hanced visible light photocatalytic properties of Fe-doped TiO2 nanorod clusters and monodispersednanoparticles”, Appl. Surf. Sci., 257 (2011) 8121–8126.
19. Z. Shi, X. Zhang, S. Yao, “Preparation and photocat-alytic activity of TiO2 nanoparticles co-doped withFe and La”, Particuology, 9 (2011) 260–264.
20. S.F. Alvarado, “Understanding magnetic force mi-croscopy”, Exp. Techniques, 383 (1990) 373–383.
21. Probes and Accessories, Bruker Corporation, (2011)96-97.
22. S.S. Kamble, A. Sikora, S.T. Pawar, N.N. Maldar,L.P. Deshmukh, “Cobalt sulfide thin films: chemicalgrowth, reaction kinetics and microstructural analy-
sis”, J. Alloys Compd., 623 (2015) 466–472.23. M. Vijay, V. Selvarajan, K.P. Sreekumar, Y. Jiaguo,
L. Shengwei, “Characterization and visible lightphotocatalytic properties of nanocrystalline TiO2synthesized by reactive plasma processing”, Solar
Energy Mater. Solar Cells, 93 (2009) 1540–1549.24. B. Choudhury, R. Verma, A. Chodhury, “Oxygen
defect assisted paramagnetic to ferromagnetic con-version in Fe doped TiO2 nanoparticles”, RSC Ad-
vances, 4 (2014) 29314.25. N.H. Hong, J. Sakai, W. Prellier, “Distribution of
dopant in Fe:TiO2 and Ni:TiO2 thin films”, J. Magn.
Magn. Mater., 281 (2004) 347–352.26. T. Wakano, N. Fujimura, Y. Morinaga, N. Abe, A.
Ashida, T. Ito, “Magnetic and magneto-transportproperties of ZnO:Ni films”, Physica E, 10 (2001)260–264.
51


![Titanium dioxide and modified titanium dioxide by silver ...cdmf.org.br/wp-content/uploads/2019/02/Titanium-dioxide...zinc oxide [6,7], titanium dioxide [8,9], hydroxyapatite and chlorhexidine,](https://static.fdocuments.us/doc/165x107/60ff91e8d40a2e46c9475976/titanium-dioxide-and-modified-titanium-dioxide-by-silver-cdmforgbrwp-contentuploads201902titanium-dioxide.jpg)