Synthesis and surface photochemistry of graphitized carbon quantum dots
6
Synthesis and surface photochemistry of graphitized carbon quantum dots Yun Liu, Chun-yan Liu ⇑ , Zhi-ying Zhang Key Laboratory of Photochemical Conversion and Optoelectronic Materials, Beijing 100190, People’s Republic of China Technical Institute of Physics and Chemistry, Chinese Academy of Sciences, Beijing 100190, People’s Republic of China article info Article history: Received 26 September 2010 Accepted 20 January 2011 Available online 25 January 2011 Keywords: Carbon Quantum dot Photoluminescence Hydrothermal Surface passivation abstract Graphitized carbon quantum dots (CQDs) were synthesized by a simple hydrothermal process with cetyl- trimethylammonium bromide (CTAB) as the starting material and nitric acid as surface oxidant. The pho- toluminescent quantum yield (QY) of CQDs could be greatly enhanced through surface esterification with glycol. Based on the structure characterization, we proposed that the CQDs consisted of the stack of graphene sheets sized several nanometers and their excitation-dependent photoluminescence (PL) should be attributed to the n ? p transition of C@O bond of surface carboxylic groups. And the PL of CQDs was obviously enhanced by the esterification of carboxylic groups, possibly due to the increase of the molecular coplanarity or the rigidity. Ó 2011 Elsevier Inc. All rights reserved. 1. Introduction Luminescent II–VI and III–V semiconductor quantum dots have been widely studied and used in biomedicine, biological label and optoelectronic fields [1–4]. However, the intrinsic toxicity and environmental menace of heavy metals limited their practical applications [1–3]. Very recently, for the non-toxicity and photo- stability, much attention has been paid to developing novel ap- proaches to synthesize luminescent carbon based quantum dots [5–15]. Nonetheless, most of the methods about CQDs involved in the pyrolysis of certain organic molecules [5–8] or laser ablation [9,10], electrochemical oxidation [11–14] and vigorous chemical oxidation [15] of expensive carbon sources by complexes pro- cesses. Moreover, in most cases, the PL of CQDs was low with a few exceptions [8,10]. In the present work, we introduced a simple hydrothermal process to synthesize graphitized CQDs with carbo- hydrate CTAB as the starting material. By surface esterification with glycol, the passivated CQDs (PCQDs) exhibited high PL with a QY of 10%. In general, the fluorescent emission of CQDs showed the excita- tion-dependent nature [5–13,15], which was very different from II–VI and III–V semiconductor quantum dots. What is the reason for the PL of CQDs? Up to date, it is still not well understood [10,15]. In the present work, we detailed investigated the correla- tion between the surface structure and the photoluminescent properties of CQDs by several spectroscopic methods. The results revealed, the excitation-dependent PL of the CQDs might be due to the n ? p transition of C@O bond of surface carboxylic groups. The esterification reaction between carboxylic groups and glycol played a dominant role in the enhancement of the PL of the CQDs. 2. Materials and methods 2.1. Materials Sodium persulfate (Na 2 S 2 O 8 , A.R.), cetyltrimethylammonium bromide (CTAB, C.P.), hydrochloride acid (HCl, A.R., 36 wt%), nitric acid (HNO 3 , A.R., 65 wt%), polyethylene glycol 600 (PEG 600 , C.P., M av = 600) and anhydrous ethanol (A.R.) were purchased from Beijing Chemical Reagent Co. All the reagents were used as received without further purification. Deionized water was used in experiments. 2.2. Synthesis of luminescent CQDs 2.2.1. Carbonization of CTAB and surface oxidation of carbon products 3.25 g of Na 2 S 2 O 8 was thoroughly mixed with 30.0 ml of 4 mol/l HCl aqueous solution and then 25.1 ml of 0.1 mol/l CTAB aqueous solution was added. 30 ml of the mixed solution was transferred into 80 ml of Teflon-lined stainless steel autoclave and maintained at 210 °C for 36 h. After cooled to room temperature naturally, the obtained black product was filtered, washed repeatedly with deionized water, 0.1 mol/l HNO 3 ethanol solution, and ethanol. At last, the product was dried with infrared lamp in air. After refluxing 30 ml of 5 mol/l HNO 3 aqueous solution containing 0.15 g of the 0021-9797/$ - see front matter Ó 2011 Elsevier Inc. All rights reserved. doi:10.1016/j.jcis.2011.01.065 ⇑ Corresponding author. Address: Technical Institute of Physics and Chemistry, Chinese Academy of Sciences, No. 2 Beiyitiao Street, Zhongguancun, Haidian District, P.O. Box 2711-47#, Beijing 100190, People’s Republic of China. Fax: +86 10 82543573. E-mail address: [email protected] (C.-y. Liu). Journal of Colloid and Interface Science 356 (2011) 416–421 Contents lists available at ScienceDirect Journal of Colloid and Interface Science www.elsevier.com/locate/jcis
Transcript of Synthesis and surface photochemistry of graphitized carbon quantum dots

Journal of Colloid and Interface Science 356 (2011) 416–421
Contents lists available at ScienceDirect
Journal of Colloid and Interface Science
www.elsevier .com/locate / jc is
Synthesis and surface photochemistry of graphitized carbon quantum dots
Yun Liu, Chun-yan Liu ⇑, Zhi-ying ZhangKey Laboratory of Photochemical Conversion and Optoelectronic Materials, Beijing 100190, People’s Republic of ChinaTechnical Institute of Physics and Chemistry, Chinese Academy of Sciences, Beijing 100190, People’s Republic of China
a r t i c l e i n f o
Article history:Received 26 September 2010Accepted 20 January 2011Available online 25 January 2011
Keywords:CarbonQuantum dotPhotoluminescenceHydrothermalSurface passivation
0021-9797/$ - see front matter � 2011 Elsevier Inc. Adoi:10.1016/j.jcis.2011.01.065
⇑ Corresponding author. Address: Technical InstituChinese Academy of Sciences, No. 2 Beiyitiao StrDistrict, P.O. Box 2711-47#, Beijing 100190, People’s R82543573.
E-mail address: [email protected] (C.-y. Liu).
a b s t r a c t
Graphitized carbon quantum dots (CQDs) were synthesized by a simple hydrothermal process with cetyl-trimethylammonium bromide (CTAB) as the starting material and nitric acid as surface oxidant. The pho-toluminescent quantum yield (QY) of CQDs could be greatly enhanced through surface esterification withglycol. Based on the structure characterization, we proposed that the CQDs consisted of the stack ofgraphene sheets sized several nanometers and their excitation-dependent photoluminescence (PL)should be attributed to the n ? p� transition of C@O bond of surface carboxylic groups. And the PL ofCQDs was obviously enhanced by the esterification of carboxylic groups, possibly due to the increaseof the molecular coplanarity or the rigidity.
� 2011 Elsevier Inc. All rights reserved.
1. Introduction
Luminescent II–VI and III–V semiconductor quantum dots havebeen widely studied and used in biomedicine, biological label andoptoelectronic fields [1–4]. However, the intrinsic toxicity andenvironmental menace of heavy metals limited their practicalapplications [1–3]. Very recently, for the non-toxicity and photo-stability, much attention has been paid to developing novel ap-proaches to synthesize luminescent carbon based quantum dots[5–15]. Nonetheless, most of the methods about CQDs involvedin the pyrolysis of certain organic molecules [5–8] or laser ablation[9,10], electrochemical oxidation [11–14] and vigorous chemicaloxidation [15] of expensive carbon sources by complexes pro-cesses. Moreover, in most cases, the PL of CQDs was low with afew exceptions [8,10]. In the present work, we introduced a simplehydrothermal process to synthesize graphitized CQDs with carbo-hydrate CTAB as the starting material. By surface esterificationwith glycol, the passivated CQDs (PCQDs) exhibited high PL witha QY of �10%.
In general, the fluorescent emission of CQDs showed the excita-tion-dependent nature [5–13,15], which was very different fromII–VI and III–V semiconductor quantum dots. What is the reasonfor the PL of CQDs? Up to date, it is still not well understood[10,15]. In the present work, we detailed investigated the correla-tion between the surface structure and the photoluminescent
ll rights reserved.
te of Physics and Chemistry,eet, Zhongguancun, Haidianepublic of China. Fax: +86 10
properties of CQDs by several spectroscopic methods. The resultsrevealed, the excitation-dependent PL of the CQDs might be dueto the n ? p� transition of C@O bond of surface carboxylic groups.The esterification reaction between carboxylic groups and glycolplayed a dominant role in the enhancement of the PL of the CQDs.
2. Materials and methods
2.1. Materials
Sodium persulfate (Na2S2O8, A.R.), cetyltrimethylammoniumbromide (CTAB, C.P.), hydrochloride acid (HCl, A.R., 36 wt%), nitricacid (HNO3, A.R., 65 wt%), polyethylene glycol 600 (PEG600, C.P.,Mav = 600) and anhydrous ethanol (A.R.) were purchased fromBeijing Chemical Reagent Co. All the reagents were used asreceived without further purification. Deionized water was usedin experiments.
2.2. Synthesis of luminescent CQDs
2.2.1. Carbonization of CTAB and surface oxidation of carbon products3.25 g of Na2S2O8 was thoroughly mixed with 30.0 ml of 4 mol/l
HCl aqueous solution and then 25.1 ml of 0.1 mol/l CTAB aqueoussolution was added. 30 ml of the mixed solution was transferredinto 80 ml of Teflon-lined stainless steel autoclave and maintainedat �210 �C for 36 h. After cooled to room temperature naturally,the obtained black product was filtered, washed repeatedly withdeionized water, 0.1 mol/l HNO3 ethanol solution, and ethanol. Atlast, the product was dried with infrared lamp in air. After refluxing30 ml of 5 mol/l HNO3 aqueous solution containing 0.15 g of the

Y. Liu et al. / Journal of Colloid and Interface Science 356 (2011) 416–421 417
as-prepared carbon materials for 12 h, CQDs decorated with sur-face carboxylic and hydroxyl groups were obtained.
2.2.2. Preparation of PCQDsAfter centrifugation, 10 ml of supernatant was mixed with
10 ml of PEG600 and stirred at room temperature for several hours.Then, 4–5 h decompression distillation at the temperature lowerthan 50 �C was adopted to remove water in the PEG600/CQDs mixedsolution. After that, anhydrous ethanol was added into the system.Through open-distillation repeatedly, HNO3 was removed from thePEG600/CQDs mixed solution until the pH of the system was closeto neutral.
2.3. Characterization
X-ray diffraction (XRD) measurements were carried out using aRigaku DMax-RB X-ray diffractometer with the Cu Ka radiation(k = 1.5418 Å) operated at 40 kV and 40 mA with the scanningspeed of 0.1�/s and increment of 0.3. Transmission electron micros-copy (TEM) and high-resolution TEM (HRTEM) images were re-corded with Philips CM200/FEG microscope operating ataccelerating voltage of 200 kV. AFM images were recorded in airby tapping mode AFM on a Dimension 3100 with OMCLAC 160tip (TS-W2, silicon). The AFM sample was prepared by dropping di-lute solution of the PCQDs onto freshly cleaved mica flake anddried in air. The IR spectra were measured by the Hitachi Fouriertransform infrared (FT-IR) spectroscopy with the resolution of4 cm�1 and scan times of 49. IR samples were prepared by drop-ping the CQDs or PCQDs ethanol solutions on the surface of KBrwafers and then dried under illumination of infrared lamp. Fluores-cent spectra of CQDs were monitored with Hitachi F-4500 fluores-cence spectrophotometer and the corresponding QY was estimatedwith quinine sulfate (photoluminescent QY 54% in 0.5 mol/l sulfu-ric acid) as a reference [16]. Absorbance of the PCQDs solution at
Fig. 1. (A) The FT-IR spectrum of CQDs and (B) PL spectra of CQDs excited at 400 nm: Cspectra of PEG600 and PCQDs.
the excitation wavelength was kept smaller than 0.1 to avoid re-absorption. Graphite oxide (GO) was prepared by Hummer’s meth-od [17].
3. Results and discussion
The synthesis of luminescent CQDs involved two processes. Onewas hydrothermal treatment of CTAB in the presence of Na2S2O8
and HCl. TEM analysis and XRD pattern indicated that the hydro-thermal product of CTAB was the aggregates of small carbon grainssized hundreds of nanometers (Fig. S1) and was partially graphi-tized (Fig. S2). There were not any obvious bands correspondingto the stretching vibrations of CAH bond in the FT-IR spectrumof the carbon aggregates, implying the nearly full carbonizationof CTAB (Fig. S3).
Refluxing the carbon aggregates in HNO3 aqueous solutionintroduced hydroxyl and carboxylic groups on the surface of CQDs(Fig. 1A). With the help of these hydrophilic groups, CQDs could bevery stably dispersed in polar solvents such as water, ethanol andbutanol. However, the fluorescent emission of CQDs was very poor(Fig. 1B, curve a). Surface passivation is a general approach to im-prove the PL of semiconductor nanocrystals. In the present work,an esterification reaction between the carboxylic groups on thesurface of CQD and the hydroxyl groups of PEG600 was used to im-prove the PL of CQD. The IR band centered at 1749 cm�1 concludedthat the esterification reaction occurred actually between them(Fig. 1C). Simultaneously, the fluorescent emission of PCQDs wasgreatly enhanced (Fig. 1B, curve b). The photoluminescent QY ofthe PCQDs was about 9.8% excited at 340 nm with quinine sulfateas the reference [16], larger than most of report [5–7,9,11–15] andclose to that reported by Sun et al. [8]. It should be pointed out thatdifferent from the surface amidation (�72 h, 120 �C) generallyadopted [8,10], the esterification described here was more easyand timesaving. The full width at half maximum (FWHM) of the
QDs (a), PCQDs (b) and the excitation spectrum of the PCQDs (c) and (C) the FT-IR
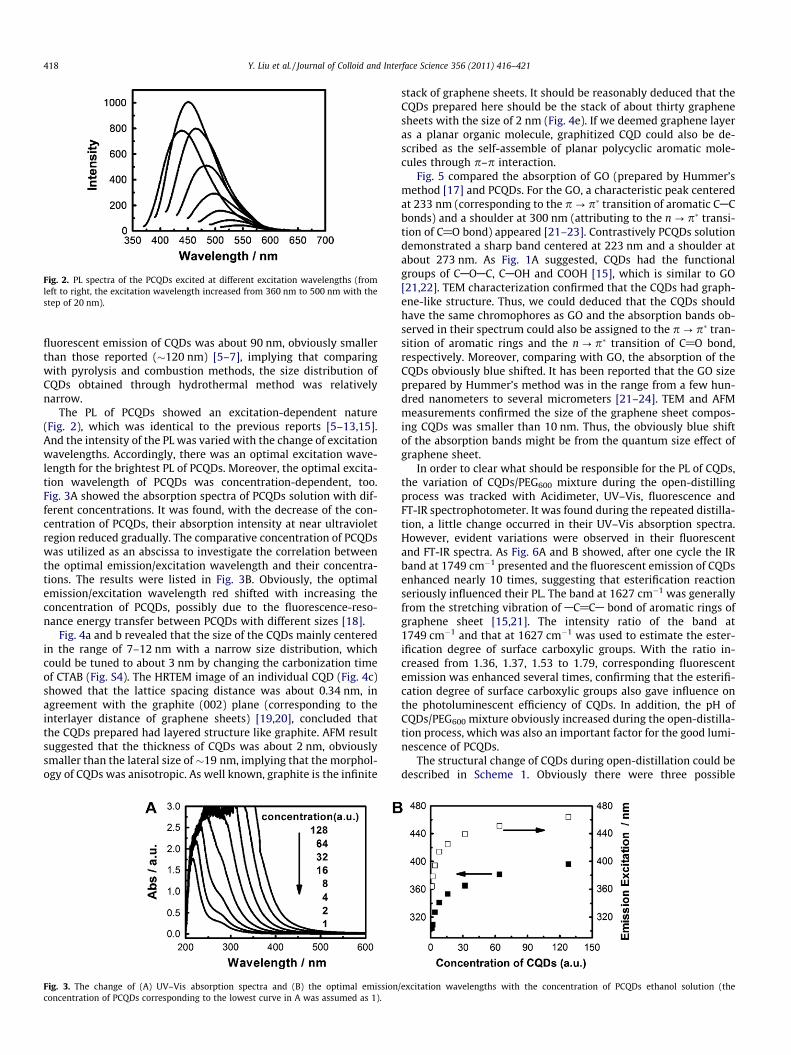
Fig. 2. PL spectra of the PCQDs excited at different excitation wavelengths (fromleft to right, the excitation wavelength increased from 360 nm to 500 nm with thestep of 20 nm).
418 Y. Liu et al. / Journal of Colloid and Interface Science 356 (2011) 416–421
fluorescent emission of CQDs was about 90 nm, obviously smallerthan those reported (�120 nm) [5–7], implying that comparingwith pyrolysis and combustion methods, the size distribution ofCQDs obtained through hydrothermal method was relativelynarrow.
The PL of PCQDs showed an excitation-dependent nature(Fig. 2), which was identical to the previous reports [5–13,15].And the intensity of the PL was varied with the change of excitationwavelengths. Accordingly, there was an optimal excitation wave-length for the brightest PL of PCQDs. Moreover, the optimal excita-tion wavelength of PCQDs was concentration-dependent, too.Fig. 3A showed the absorption spectra of PCQDs solution with dif-ferent concentrations. It was found, with the decrease of the con-centration of PCQDs, their absorption intensity at near ultravioletregion reduced gradually. The comparative concentration of PCQDswas utilized as an abscissa to investigate the correlation betweenthe optimal emission/excitation wavelength and their concentra-tions. The results were listed in Fig. 3B. Obviously, the optimalemission/excitation wavelength red shifted with increasing theconcentration of PCQDs, possibly due to the fluorescence-reso-nance energy transfer between PCQDs with different sizes [18].
Fig. 4a and b revealed that the size of the CQDs mainly centeredin the range of 7–12 nm with a narrow size distribution, whichcould be tuned to about 3 nm by changing the carbonization timeof CTAB (Fig. S4). The HRTEM image of an individual CQD (Fig. 4c)showed that the lattice spacing distance was about 0.34 nm, inagreement with the graphite (002) plane (corresponding to theinterlayer distance of graphene sheets) [19,20], concluded thatthe CQDs prepared had layered structure like graphite. AFM resultsuggested that the thickness of CQDs was about 2 nm, obviouslysmaller than the lateral size of�19 nm, implying that the morphol-ogy of CQDs was anisotropic. As well known, graphite is the infinite
Fig. 3. The change of (A) UV–Vis absorption spectra and (B) the optimal emissionconcentration of PCQDs corresponding to the lowest curve in A was assumed as 1).
stack of graphene sheets. It should be reasonably deduced that theCQDs prepared here should be the stack of about thirty graphenesheets with the size of 2 nm (Fig. 4e). If we deemed graphene layeras a planar organic molecule, graphitized CQD could also be de-scribed as the self-assemble of planar polycyclic aromatic mole-cules through p–p interaction.
Fig. 5 compared the absorption of GO (prepared by Hummer’smethod [17] and PCQDs. For the GO, a characteristic peak centeredat 233 nm (corresponding to the p ? p� transition of aromatic CACbonds) and a shoulder at 300 nm (attributing to the n ? p� transi-tion of C@O bond) appeared [21–23]. Contrastively PCQDs solutiondemonstrated a sharp band centered at 223 nm and a shoulder atabout 273 nm. As Fig. 1A suggested, CQDs had the functionalgroups of CAOAC, CAOH and COOH [15], which is similar to GO[21,22]. TEM characterization confirmed that the CQDs had graph-ene-like structure. Thus, we could deduced that the CQDs shouldhave the same chromophores as GO and the absorption bands ob-served in their spectrum could also be assigned to the p ? p� tran-sition of aromatic rings and the n ? p� transition of C@O bond,respectively. Moreover, comparing with GO, the absorption of theCQDs obviously blue shifted. It has been reported that the GO sizeprepared by Hummer’s method was in the range from a few hun-dred nanometers to several micrometers [21–24]. TEM and AFMmeasurements confirmed the size of the graphene sheet compos-ing CQDs was smaller than 10 nm. Thus, the obviously blue shiftof the absorption bands might be from the quantum size effect ofgraphene sheet.
In order to clear what should be responsible for the PL of CQDs,the variation of CQDs/PEG600 mixture during the open-distillingprocess was tracked with Acidimeter, UV–Vis, fluorescence andFT-IR spectrophotometer. It was found during the repeated distilla-tion, a little change occurred in their UV–Vis absorption spectra.However, evident variations were observed in their fluorescentand FT-IR spectra. As Fig. 6A and B showed, after one cycle the IRband at 1749 cm�1 presented and the fluorescent emission of CQDsenhanced nearly 10 times, suggesting that esterification reactionseriously influenced their PL. The band at 1627 cm�1 was generallyfrom the stretching vibration of AC@CA bond of aromatic rings ofgraphene sheet [15,21]. The intensity ratio of the band at1749 cm�1 and that at 1627 cm�1 was used to estimate the ester-ification degree of surface carboxylic groups. With the ratio in-creased from 1.36, 1.37, 1.53 to 1.79, corresponding fluorescentemission was enhanced several times, confirming that the esterifi-cation degree of surface carboxylic groups also gave influence onthe photoluminescent efficiency of CQDs. In addition, the pH ofCQDs/PEG600 mixture obviously increased during the open-distilla-tion process, which was also an important factor for the good lumi-nescence of PCQDs.
The structural change of CQDs during open-distillation could bedescribed in Scheme 1. Obviously there were three possible
/excitation wavelengths with the concentration of PCQDs ethanol solution (the

Fig. 4. TEM image (a), size distribution histogram (b); HRTEM image (c); AFM topography image (d) and the possible structure of the as-prepared PCQDs (e).
Fig. 5. UV–Vis spectra of the PCQDs ethanol solution and GO aqueous solution.
Y. Liu et al. / Journal of Colloid and Interface Science 356 (2011) 416–421 419
chromophores for the fluorescent emission of CQDs. They were thep ? p� transition of polycyclic aromatic rings of graphene, then ? p� transition of CAO bonds of hydroxy groups and then ? p� transition of C@O bond of carboxylic groups (Scheme 1D),respectively. What should be exactly responsible for the PL ofCQDs?
Fig. 2 displayed that the fluorescent emission of CQDs redshifted with increasing the excitation wavelength. This phenome-non is common observed in the molecule in which chromophorescombined through CAC single bond, which is directly recognizedby the PL of 2-phenylnaphthalene [25–27]. Holloway [25,26] con-cluded that in the ground electronic state of 2-phenylnaphthalenethere were different conformers marked by the angle variation be-tween the phenyl and naphthyl ring planes. Among the chromoph-ores of CQDs, only C@O bond of carboxylic group combined with

Fig. 6. Fluorescent spectra (A) and FT-IR absorption spectra (B) of the mixture of CQDs and PEG600 via open-distillation with different cycles: (a) before open-distillation, (b)one, (c) four; (d) five and (e) seven cycle.
Scheme 1. The graphic representation of the structural change of CQDs during the repeated distillation and the photophysical processes occurred in PCQDs: (A) the structureof the functionalized graphene layer composing CQDs, (B) the structure of the functionalized graphene layer composing PCQDs, (C) deprotonation of the functionalizedgraphene layer composing PCQDs and (D) possible photophysical processes of PCQD.
420 Y. Liu et al. / Journal of Colloid and Interface Science 356 (2011) 416–421
aromatic rings through CAC single bond (Scheme 1C). Thus, the PLof the CQDs observed here should be related to the n ? p� transi-tion of C@O bond of carboxylic groups. The PL enhancement ofthe CQDs induced by the esterification of surface carboxylic groupsfurther proved this presumption. This could be further explainedby the following effects. Comparing with carboxylic groups, estergroups have a larger steric effect, which benefited to increase thecoplanar degree of the C@O bond and aromatic rings and then in-crease their p–p interaction [27]. In general, n ? p� transition isspin-forbidden and p–p� transition is spin-allowed. Interaction be-tween aromatic rings and carboxylic groups benefits to the delocal-ization of p-electron and thus made the n ? p� transition of C@Obond became partially forbidden. Consequently, strong fluorescentemission appeared. On the other hand, esterification favored thedecrease of hydrogen bonding between carboxylic groups andthe solvent, limiting the transition through non-radiative process.
As noted above, the CQDs prepared in the present work was thestack of the functionalized graphene layers. Obviously, the numberand size as well as the functional groups linked to graphene layerswould give influence on the corresponding PL of CQDs. Generally,
the energy exciting p ? p� transition decreases with the increaseof the conjugated number of aromatic rings. It was reasonably de-duced that the quantum size effect of the PL of CQDs should be ob-served owing to the size change of graphene sheet. On the otherhand, the number of graphene layers possibly influenced the fluo-rescent efficiency as well as the photophysical process of CQDs. Inthe future, much attention should be focused on the research aboutthe influence of size and number of graphene layers on the PL ofCQDs and then realized the perfect control of their fluorescentemission.
We supposed the formation of carbon materials through hydro-thermal treatment of CTAB should be due to the vigorous oxidationof Na2S2O8 in acidic medium and high temperature. To prove thishypothesis, we conducted the following controlled experiments.Hydrothermal treatment of CTAB in the presence of Na2S2O8 re-sulted in a yellow solution whereas hydrothermal treatment ofCTAB in the presence of HCl produced colorless solution. This im-plied the importance of the coexistence of Na2S2O8 and HCl forthe formation of black carbon materials. In addition, synthetic tem-perature is also close related to the carbonization of CTAB. It was

Y. Liu et al. / Journal of Colloid and Interface Science 356 (2011) 416–421 421
found at the hydrothermal temperature lower than 200 �C, noblack carbon material was formed. This could be reasonably ex-plained by the strong oxidizing ability of Na2S2O8 in acidic mediumand high temperature. It has been reported that the oxidation po-tential of Na2S2O8 is 2.01 V in acidic medium, which could makethe paper and even paraffin wax carbonized at high temperature[28]. In our work, the hydrothermal temperature was 210 �C. Thus,Na2S2O8 could react with CTAB through oxidation–reduction pro-cess and then carbonizing material was obtained.
4. Conclusion
In the present work, graphitized CQDs with narrow size distri-bution were synthesized by the hydrothermal treatment of CTABat high temperature and then further surface oxidation withHNO3. Through esterification of their surface carboxylic groupswith glycol, PCQDs showed high QY of about 10%. Detailed investi-gations concluded that the excitation-dependent PL of PCQDs ob-served in our work should be attributed to the n ? p� transitionof the C@O bond of carboxylic groups. The surface esterificationand the enhancement on its degree benefited to the fluorescentemission of CQDs. Structure characterization suggested that graph-itized CQDs could be interpreted as the stack of numbered graph-ene layers with the size of several nanometers and decoratedcarbonyl groups on the fringe. Without doubt, the diameter andnumber of graphene layers would determine the morphology andsize of CQDs and consequently affect their PL. To precisely controlthe PL properties of CQDs, much attention should be paid to thecorrelation between the PL and the diameter and the number ofgraphene layers in future.
Acknowledgments
Authors thank the support of 973 Program (2007CB613304) andChinese Academy of Sciences.
Appendix A. Supplementary material
TEM image, XRD and FT-IR spectra of carbon materials synthe-sized through hydrothermal treatment of CTAB for 36 h; TEMimage of CQDs prepared from carbon materials which was synthe-sized by the hydrothermal treatment of CTAB for 18 h. Supplemen-
tary data associated with this article can be found, in the onlineversion, at doi:10.1016/j.jcis.2011.01.065.
References
[1] X. Michalet, F.F. Pinaud, L.A. Bentolila, J.M. Tsay, S. Doose, J.J. Li, G. Sundaresan,A.M. Wu, S.S. Gambhir, S. Weiss, Science 307 (2005) 538.
[2] Igor.L. Medintz, H. Tetsuoures, E. Goldman, H.N. Mattoussi, Nature Mater. 4(2005) 435.
[3] P. Alivisatos, Nature Biotechnol. 22 (2004) 47.[4] Y. Zhang, L. Mi, P.-N. Wang, S.-J. Lu, J.Y. Chen, J. Guo, W.-L. Yang, C.-C. Wang,
Small 4 (2008) 777.[5] H. Liu, T. Ye, C. Mao, Angew. Chem. Int. Ed. Engl. 46 (2007) 6473.[6] L. Tian, D. Ghosh, W. Chen, S. Pradhan, X. Chang, S. Chen, Chem. Mater. 21
(2009) 2803.[7] (a) A.B. Bourlinos, A. Stassinopoulos, D. Anglos, R. Zboril, M. Karakassides, E.P.
Giannelis, Small 4 (2008) 455;(b) A.B. Bourlinos, A. Stassinopoulos, D. Anglos, R. Zboril, M. Karakassides, E.P.Giannelis, Chem. Mater. 20 (2008) 4539.
[8] R.L. Liu, D.Q. Wu, S.H. Liu, K. Koynov, W. Knoll, Q. Li, Angew. Chem. Int. Ed. 48(2009) 4598.
[9] S.L. Hu, K.Y. Niu, J. Sun, J. Yang, N.Q. Zhao, X.W. Du, J. Mater. Chem. 19 (2009)484.
[10] Y.P. Sun, B. Zhou, Y. Lin, W. Wang, K.A.S. Fernando, P. Pathak, M.J. Meziani, B.A.Harruff, X. Wang, H. Wang, P.G. Luo, H. Yang, M.E. Kose, B. Chen, L.M. Veca, S.-Y. Xie, J. Am. Chem. Soc. 128 (2006) 7756.
[11] C. Zhou, R. Booker, R. Li, X. Zhou, T.-K. Sham, X. Sun, Z. Ding, J. Am. Chem. Soc.129 (2007) 744.
[12] L. Zheng, Y. Chi, Y. Dong, J. Lin, B. Wang, J. Am. Chem. Soc. 131 (2009)4564.
[13] J. Lu, J.X. Yang, J. Wang, A. Lim, S. Wang, K.P. Loh, Acs Nano 3 (2009) 2367.[14] Q.-L. Zhao, Z.-L. Zhang, B.-L. Huang, J. Peng, M. Zhang, D.W. Pang, Chem.
Commun. (2008) 5116.[15] D.Y. Pan, J.C. Zhang, Z. Li, M.H. Wu, Adv. Mater. 22 (2010) 734.[16] J.N. Demas, G.A. Crosby, J. Phys. Chem. 75 (1971) 991.[17] W.S. Hummers, R.E. Offeman, J. Am. Chem. Soc. 80 (1958) 1339.[18] O.I. Micic, K.M. Jones, A. Cahill, A.J. Nozik, J. Phys. Chem. B 102 (1998)
9791.[19] H.C. Schniepp, J.L. Li, M.J. McAllister, H. Sai, M. Herrera-Alonso, D.H. Adamson,
R.K. Prud’homme, R.K. Car, D.A. Saville, I.A. Aksay, J. Phys. Chem. B 110 (2006)8535.
[20] Z. Wang, F. Li, N.S. Ergang, A. Stein, Chem. Mater. 18 (2006) 5543.[21] J.I. Paredes, S. Villar-Rodil, A. Martínez-Alonso, J.M.D. Tascón, Langmuir 24
(2008) 10560.[22] Z. Zhu, R. Yang, M. You, X. Zhang, Y. Wu, W. Tan, Anal. Bioanal. Chem. 396
(2010) 73.[23] V. Subramanina, E.E. Wolf, P.V. Kamat, J. Phys. Chem. B 107 (2003) 7479.[24] P.V. Kamat, B. Patrick, J. Phys. Chem. 96 (1992) 6829.[25] H.E. Holloway, R.V. Nauman, J.H. Wharton, J. Phys. Chem. 72 (1968) 4468.[26] H.E. Holloway, R.V. Nauman, J.H. Wharton, J. Phys. Chem. 72 (1968) 4474.[27] G.Z. Chen, X.Z. Huang, Z.S. Zheng, J.G. Xu, Z.B. Wang, Analytic Chemistry of
Fluorescence, Science Press, Beijing, 1990.[28] Edited by Wuhan University and Jilin University, Inorganic Chemistry; China
Higher Education Press, Beijing, 1978, p. 74.