SYNTHESIS AND CHARACTERIZATION OF SOME...
42
Chapter-6 Simultaneous determination of Losartan Potassium, Atenolol and Hydrochlorothiazide in pharmaceutical preparations by stability- indicating ultra performance liquid chromatography ___________________________________________
Transcript of SYNTHESIS AND CHARACTERIZATION OF SOME...

Chapter-6
Simultaneous determination of Losartan Potassium, Atenolol and Hydrochlorothiazide in pharmaceutical preparations by stability-indicating ultra performance liquid chromatography
___________________________________________

6.1 Introduction of Losartan potassium, Atenolol and
Hydrochlorathiazide and survey of analytical methods
Losartan is an angiotensin II receptor (type AT1) antagonist. Losartan
prevents the constriction (narrowing) of blood vessels (veins and arteries).
Losartan is a non-peptide molecule, is chemically described as 2-butyl-4-
chloro-1-[p-(o-1H-tetrazol-5-ylphenyl)benzyl]imidazole-5-methanol mono
potassium salt. Losartan potassium is a white to off-white free-flowing
crystalline powder with a molecular weight of 461.01. It is freely soluble
in water, soluble in alcohols, and slightly soluble in common organic
solvents, such as acetonitrile and methyl ethyl ketone. It is available as
tablets for oral administration containing 25 mg, 50 mg and 100 mg of
Losartan potassium. The empirical formula of Losartan potassium is
C22H22ClKN6O.
Atenolol is in a class of drugs called beta-blockers. Beta-blockers
affect the heart and circulatory system (arteries and veins). Atenolol is
used to lower blood pressure, lower heart rate, reduce chest pain
(angina) and to reduce the risk of recurrent heart attacks. It is chemically
described as 4-[2-hydroxy-3-[(1-methylethyl)amino]propoxy]
benzeneacetamide. It is freely soluble in 1N HCl and less soluble in
chloroform. Atenolol is available as 25, 50 and 100 mg tablets for oral
administration. The empirical formula of Atenolol is C14H22N2O3. The
molecular weight of Atenolol is 266.
Hydrochlorothiazide is a thiazide diuretic. It decreases the amount of
fluid in the body by increasing the amount of salt and water lost in the
urine. Hydrochlorothiazide is used to lower blood pressure and to
decrease edema (swelling), it is chemically described as 6-chloro-3,4-
dihydro-2H-1,2,4-benzothiadiazine-7-sulfonamide 1,1-dioxide. It is a
white, or practically white, crystalline powder which is slightly soluble in
water, but freely soluble in sodium hydroxide solution. It is supplied as
12.5 mg capsules for oral use. The empirical formula of
Hydrochlorothiazide is C7H8ClN3O4S2. The molecular weight of
Hydrochlorothiazide is 297.94.
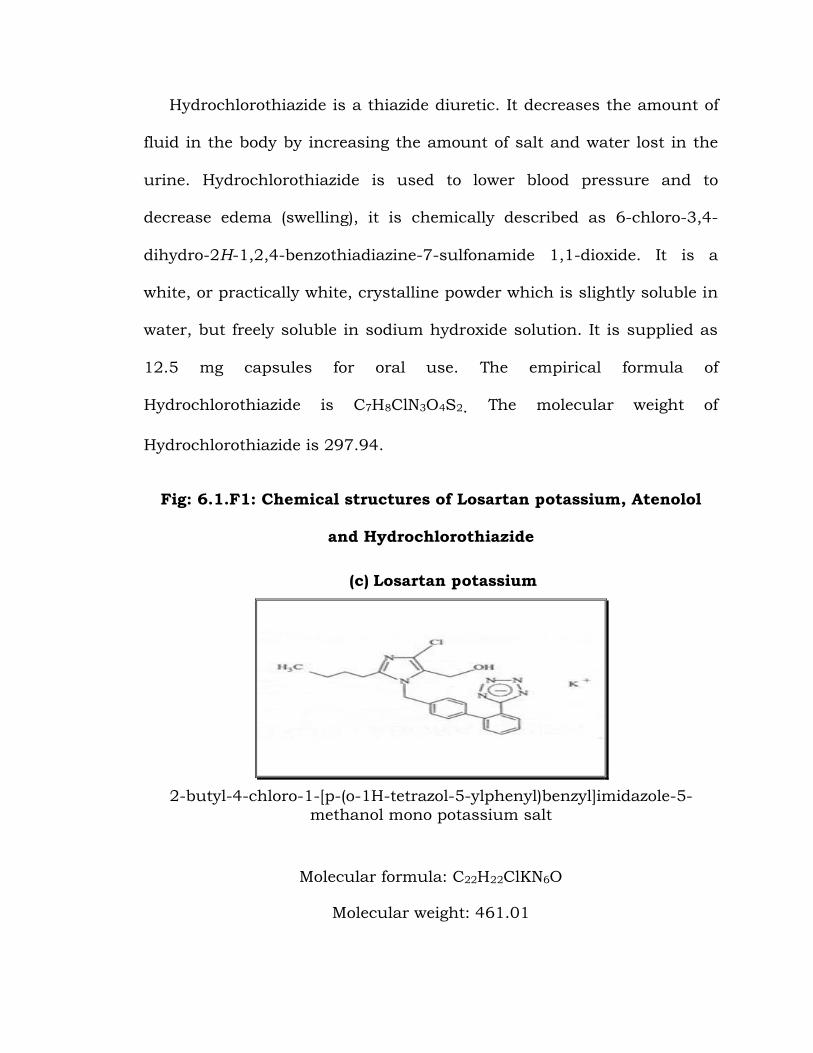
Fig: 6.1.F1: Chemical structures of Losartan potassium, Atenolol
and Hydrochlorothiazide
(c) Losartan potassium
2-butyl-4-chloro-1-[p-(o-1H-tetrazol-5-ylphenyl)benzyl]imidazole-5-
methanol mono potassium salt
Molecular formula: C22H22ClKN6O
Molecular weight: 461.01
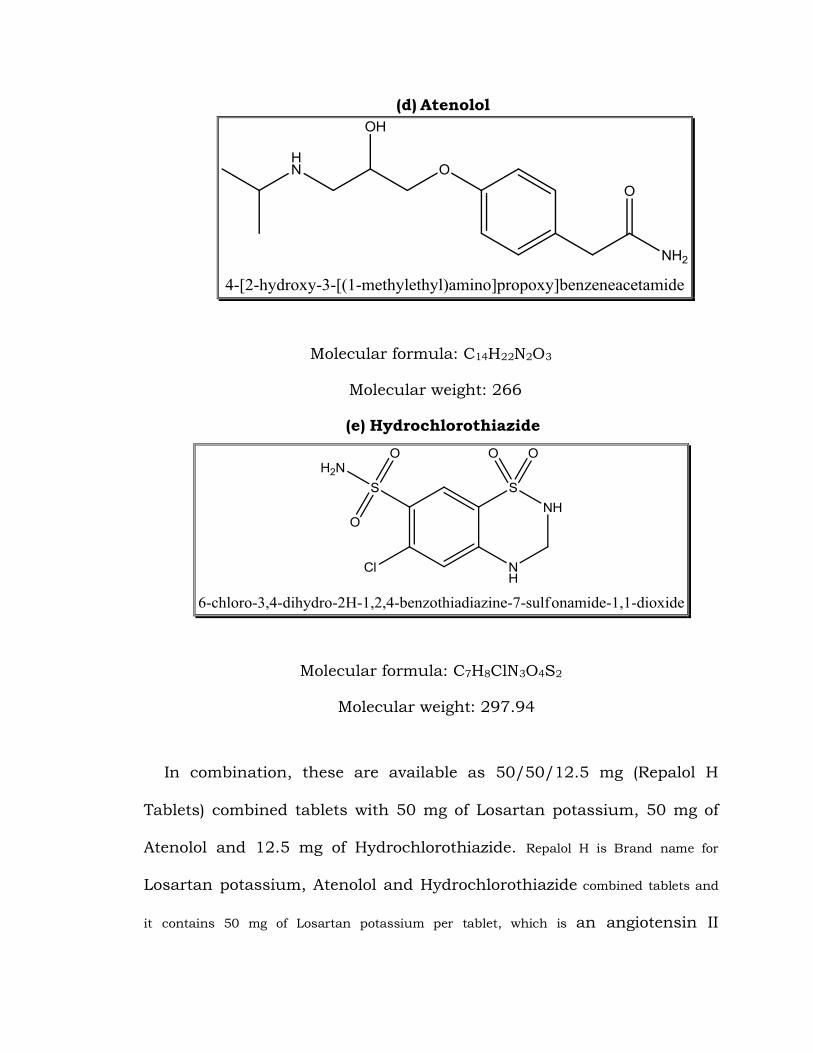
(d) Atenolol
Molecular formula: C14H22N2O3
Molecular weight: 266
(e) Hydrochlorothiazide
Molecular formula: C7H8ClN3O4S2
Molecular weight: 297.94
In combination, these are available as 50/50/12.5 mg (Repalol H
Tablets) combined tablets with 50 mg of Losartan potassium, 50 mg of
Atenolol and 12.5 mg of Hydrochlorothiazide. Repalol H is Brand name for
Losartan potassium, Atenolol and Hydrochlorothiazide combined tablets and
it contains 50 mg of Losartan potassium per tablet, which is an angiotensin II
receptor (type AT1) antagonist, plus 50 mg of Atenolol as a beta-blockers plus
12.5 mg of Hydrochlorothiazide as a thiazide
diuretic.
Literature survey reveals that a wide variety of spectrophotometric
and chromatographic methods [1-6] were reported for determination
Losartan potassium in pharmaceutical preparations in combination with
other drugs. Spectrophotometric and chromatographic methods have
been reported for determination of Atenolol , in combination with other
drugs, in bulk and pharmaceutical preparations [7-10]. A variety of
methods have been used for determination of Hydrochlorothiazide [11-
17]. An HPTLC method has been reported for simultaneous quantitative
determination of Losartan potassium, Atenolol and Hydrochlorothiazide
in combined tablets [18]. So far no liquid chromatography method has
been reported for simultaneous quantitative determination of Losartan
potassium, Atenolol and Hydrochlorothiazide in the combined dosage
forms.
The aim of the present study was to develop a suitable stability-
indicating LC assay method for simultaneous determination of Losartan
potassium, Atenolol and Hydrochlorothiazide in combined dosage forms.
In this chapter we described a stability indicating ultra performance
liquid chromatographic (UPLC) method for the simultaneous
determination of Losartan potassium, Atenolol and Hydrochlorothiazide
in combined dosage forms along with analytical method validation as per
ICH guidelines.
6.2 Development of a new stability-indicating UPLC method for
simultaneous determination of Losartan potassium, Atenolol, and
Hydrochlorothiazide in combined dosage forms
6.2.1 Materials
Repolol H tablets (contains 50 mg of Losartan potassium, 50 mg of
Atenolol, 12.5 mg of Hydrochlorothiazide) were purchased from Sun
pharmaceutical industries Ltd, India and standards of Losartan
potassium, Atenolol and Hydrochlorothiazide were supplied by Dr.
Reddy’s laboratories limited, Hyderabad, India. The HPLC grade
acetonitrile, analytical grade triethyl amine and ortho phosphoric acid
were purchased from Merck, Germany. Water was prepared by using
Millipore Milli.Q Plus water purification instrument.
6.2.2 Instrumentation and Chromatographic Conditions
The UPLC system used consists of a binary solvent manager, a
sample manager and a UV detector. Zorbax C-18, 50 mm x 4.6 mm i.d
with 1.8 µm particles column was used as stationary phase. Mobile
phase contains a mixture of water: acetonitrile: triethyl amine: ortho
phosphoric acid (60:40:0.1:0.1, v/v/v/v), respectively. The mobile phase
was pumped at 0.7 mL min-1. The eluents were monitored at 225 nm.
The injection volume for samples and standards was 5 µL.

6.2.3 Sample preparation
A standard solution containing 500 µg mL-1 of Losartan potassium,
500 µg mL-1 of Atenolol and 125 µg mL-1 of Hydrochlorothiazide were
prepared by dissolving in diluent (mixture of acetonitrile: water (40:60,
v/v)). Working solutions of 50 µg mL-1 of Losartan potassium, 50 µg mL-1
of Atenolol, 12.5 µg mL-1 of Hydrochlorothiazide were prepared from
above stock solution in mobile phase for assay determination.
6.2.4 Preparation of Tablets Sample Solution
Twenty Repalol H tablets (contains 50 mg of Losartan potassium, 50
mg of Atenolol, 12.5 mg of Hydrochlorothiazide) were weighed and
transferred into a clean and dry mortar, grinded well. Then an equivalent
to 50 mg of Losartan potassium (50 mg of Losartan potassium, 50 mg of
Atenolol, 12.5 mg of Hydrochlorothiazide) was transferred to a 100 mL
volumetric flask, 70 mL of diluents was added and sonicated for 15 min
and diluted to 100 ml (0.5 mg mL-1 of Losartan potassium, 0.5 mg mL-1of
Atenolol, 0.125 mg mL-1 of Hydrochlorothiazide). About 5 ml of supernant
solution was taken and diluted to 50 mL with mobile phase. This was
filtered using 0.45 µ (Nylon 66- membrane) filter.
6.2.5 Generation of stress samples
One lot of Repolol H tablets were selected for stress testing. From the
ICH Stability guideline: “stress testing is likely to be carried out on a
single batch”. Different kinds of stress degradation conditions (like heat,
humidity, acid, base, oxidative and light) were performed on one lot of
Losartan potassium, Atenolol and Hydrochlorothiazide tablets based on
the guidance available from ICH Stability Guideline (Q1AR2). The details
of the stress conditions applied are as follows:
a) Acid hydrolysis: Drug solution in 0.1N HCl at 70° C for 4 h.
b) Base hydrolysis: Drug solution in 0.1N NaOH at 70°C for 4 h.
c) Study in Neutral solution: Drug solution dissolved in water was heated
at 70°C for 3 h
d) Oxidative stress: Drug solution in 5% hydrogen peroxide at room
temperature for 4 h.
e) Thermal stress: Tablets were subjected to dry heat at 80°C for 24 h.
f) Photolytic degradation: The photo degradation was carried out by
exposing the Losartan potassium, Atenolol and Hydrochlorothiazide
tablets samples in solid state to light providing an overall illumination of
not less than 1.2 million lux hours and an integrated near ultraviolet
energy of not less than 200 W h/m2.
6.3 Method development and optimization of chromatographic
conditions
Forced degradation studies were performed to develop a stability
indicating UPLC method for the simultaneous quantitative determination
of Losartan potassium, Atenolol and Hydrochlorothiazide in combined
pharmaceutical dosage forms. Stressed samples obtained during forced
degradation studies were utilized in the UPLC method development.

6.3.1 Selection of wavelength
All the three drugs Losartan potassium, Atenolol and
Hydrochlorothiazide spectrums were collected using Water PDA system.
All the three drugs were having UV maxima at around 225 nm (Fig:
6.2.F1). Hence detection at 225 nm was selected for method development
purpose.
Fig: 6.3.F1: Typical UV spectrums of Losartan potassium, Atenolol
and Hydrochlorothiazide.
Wavelength (nm)
6.3.2 Column Selection
Three different C18 (Inertsil ODS-4 50X2.1 mm, 2 microns, Aquity
BEH C18, 50 x 2.1 mm; 1.7 microns and Zorbax C-18, 50 x 4.6 mm, 1.8
microns) Columns, 2 different C8 Columns (Inertsil C8-4 50X2.1 mm, 2
microns and Aquity BEH C8, 50 x 2.1 mm; 1.7 microns and Zorbax SB-
CN, 50 x 4.6 mm, 1.8 microns) were used for method development. The
stationary phase was found to be a great influence on the retention time,
resolution and peak shape.
The main target of the chromatographic method is to get the
separation for closely eluting degradation products, mainly the
degradation product at 1.26 RRT (with respect to Atenolol), which is
eluting between Atenolol and Hydrochlorothiazide. When Aquity BEH
C18, 50 x 2.1 mm; 1.7 microns, Zorbax C-18, 50 x 4.6 mm, 1.8 microns
and Inertsil ODS-4 50X2.1 mm, 2 microns columns were used in initial
experiment with water: Acetonitrile, triethylamine and orthophosphoric
acid in the ratio 60: 40: 0.1: 0.1 (v/v/v/v), as mobile phase and 0.7 ml
min-1 as flow rate. For Inertsil and Aquity BEH columns, the separation
of 1.26 RRT degradation product was poor from Atenolol and
Hydrochlorothiazide.
For Zorbax C-18, 50 x 4.6 mm, 1.8 microns column, the tailing of all
three drugs Losartan, Atenolol and Hydrochlorothiazide was less than
1.2, resolution between these three drugs Losartan, Atenolol and
Hydrochlorothiazide was more than 3 and the separation of degradation
product at RRT 1.26 (with respect to Atenolol) was found to be good (USP
resolution was more than 2.0). Hence Zorbax C-18, 50 x 4.6 mm, 1.8
microns column was chosen for further method development. On the

other hand, when Zorbax SB-CN, 50 x 4.6 mm, 1.8 microns column was
used, the anylyte Atenolol was eluted in void.
Table 6.3.T1: Experimental results on different stationary phases
Column USP Tailing
of Losartan
USP Tailing of
Atenolol
USP Tailing of
Hydrochloro
thiazide
USP resolution
betwwen
Atenolol and 1.26
degradant
Inertisil ODS-4 (50 x 2.1 mm) with 2 µm
particles
1.3 1.2 1.3 < 1.0
Aquity BEH C18 (50
x 2.1 mm) with 1.7 µm particles
1.3 1.2 1.1 < 1.0
Zorbax SB-CN (50 x
4.6 mm) with 1.8 µm particles
1.3 * 1.2
Atenolol peak
is eluted in
void
Inertisil C8 (50 x 2.1
mm) with 2 µm
particles
1.2 1.3 1.2 < 1.0
Aquity BEH C8 (50
x 2.1 mm) with 1.7
µm particles
1.2 1.2 1.1 < 1.0
Zorbax C-18 (50 x 4.6 mm) with 1.8
µm particles
1.1 1.2 1.1 > 2.0
* Atenolol was eluted in void
6.3.3 Effect of Organic solvent
When methanol was used as a solvent in the mobile phase (water:
methanol: triethylamine: ortho phosphoric acid in the ratio 60: 40: 0.1:

0.1 (v/v/v/v)) the retention time of Losartan is around 5 min due to the
interaction of Losartan with column and the tailing factor for Losartan
and Atenolol is also high (>1.4). To improve the retention time of
Losartan, the strength of solvent was increased by replacing methanol
with acetonitrile. Different mixtures of water and acetonitrile were
applied to improve the retention time and symmetry of the drugs
Losartan, Atenolol and Hydrochlorothiazide . When acetonitrile content
was high (water: Acetonitrile: triethylamine: ortho phosphoric acid in the
ratio 40: 60: 0.1: 0.1 (v/v/v/v)), the resolution between Atenolol and
degradation product at 1.26 RRT was poor (<1.0).
When the acetonitrile content was decreased to 30%, the RT of
Losartan was about 5.5 min. When water: Acetonitrile: triethylamine:
ortho phosphoric acid in the ratio 40: 60: 0.1: 0.1 (v/v/v/v) was used as
the mobile phase, the separation and retention times of Losartan,
Atenolol and Hydrochlorothiazide were satisfactory (Resolution was more
than 3, symmetry of Losartan, Atenolol and Hydrochlorothiazide peaks
was less than 1.2 and Retention time of Losartan, Atenolol and
Hydrochlorothiazide peaks were 2.3, 0.6 and 0.9 min, respectively.
6.3.4 Effect of pH
The method was optimized to separate major degradation products
formed under varies stress conditions. Losartan potassium (pKa = 4.9) is
acetic compound where as Atenolol (pKa = 9.4) and Hydrochlorothiazide
(pKa = 7.9, 9.2) are basic compounds. The main target of the
chromatographic method was to get the separation for closely eluting
degradation products, mainly for the degradation product at 0.76 min,
which was eluting very closely to the Atenolol. At lower pH (pH 2.0)
Losartan was retaining in column for longer time (4.5 min) and also
tailing of Atenolol was more (1.6). At higher pH 7.0, the resolution
between Atenolol and Hydrochlorothiazide peaks was poor. Hence to
have a better separation and symmetry of the three drugs and also to
reduce the retention of Losartan, triethyl amine and ortho phosphoric
were added to mobile phase containing water and acetonitrile in the ratio
60: 40 (v/v). The resulting pH of the mobile phase was about 3.5. Hence
water: acetonitrile, triethylamine and ortho phosphoric acid in the ratio
60: 40: 0.1: 0.1 (v/v/v/v) was used as mobile phase.
6.3.5 Optimized chromatographic conditions for the simultaneous
determination of Losartan potassium, Atenolol and
Hydrochlorothiazide
Column: Zorbax C-18 (50 X 4.6 mm,
with 1.8 µm particle size
Mobile phase: Water: acetonitrile, triethylamine and ortho
phosphoric acid in the ratio 60: 40: 0.1: 0.1
(v/v/v/v)
Flow rate: 0.7 ml min-1
Column temperature: 25 °C
Wavelength: 225 nm

Injection volume: 5 µL
Run time: 3 min
Diluent: Acetonitrile: water (40:60, v/v)
Retention time: Losartan is about 2.3 min, Atenolol is about
0.6 min and Hydrochlorothiazide is about 0.9
min
The interference from excipients Starch, lactose anhydrous, colloidal
silicon dioxide, polyethylene glycol and opadry blue was also checked by
injecting sample solutions of excipients. There was no interference of
excipients with Losartan, Atenolol and Hydrochlorothiazide peaks.
6.4 Degradation behavior:
UPLC studies on Losartan potassium, Atenolol and
Hydrochlorothiazide tablets under different stress conditions suggested
the following degradation behavior.
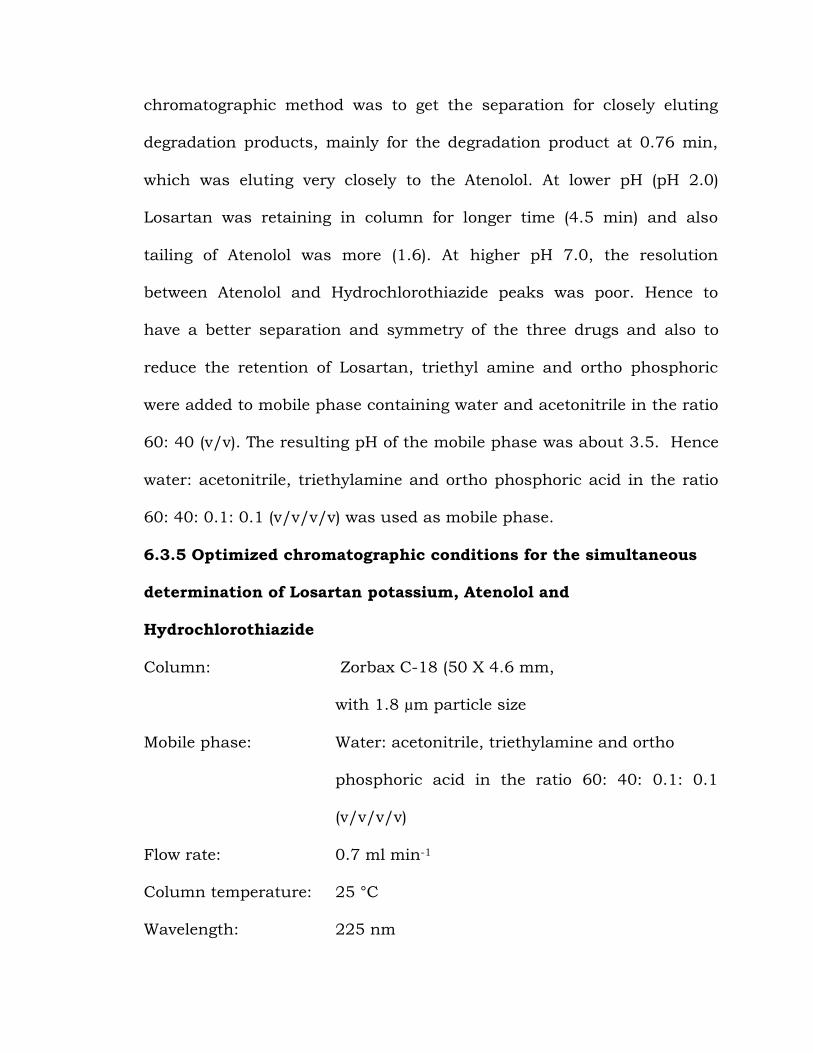
6.4.1 Degradation in acidic solution
Losartan potassium, Atenolol and Hydrochlorothiazide drugs were
exposed to 0.1 N HCl at room temperature for 48 h. In 1 N HCl at room
temperature after 48 h, no major degradation was observed. When more
stressed condition was applied (0.1N HCl, 4 hours reflux at 70°C), no
degradation of the drugs was observed (Fig: 6.4.F1 (a) to Fig: 6.4.F1 (d)).
The drugs were stable to acidic condition.
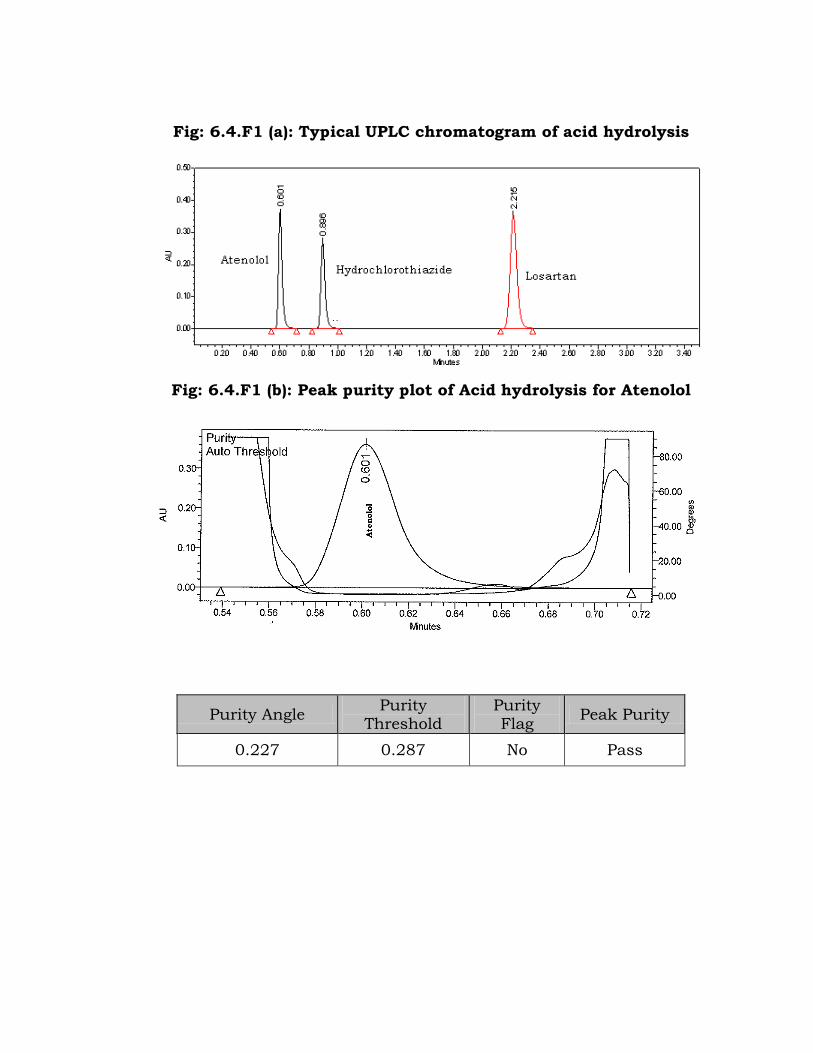
Fig: 6.4.F1 (a): Typical UPLC chromatogram of acid hydrolysis
Fig: 6.4.F1 (b): Peak purity plot of Acid hydrolysis for Atenolol
Purity Angle Purity
Threshold Purity Flag
Peak Purity
0.227 0.287 No Pass
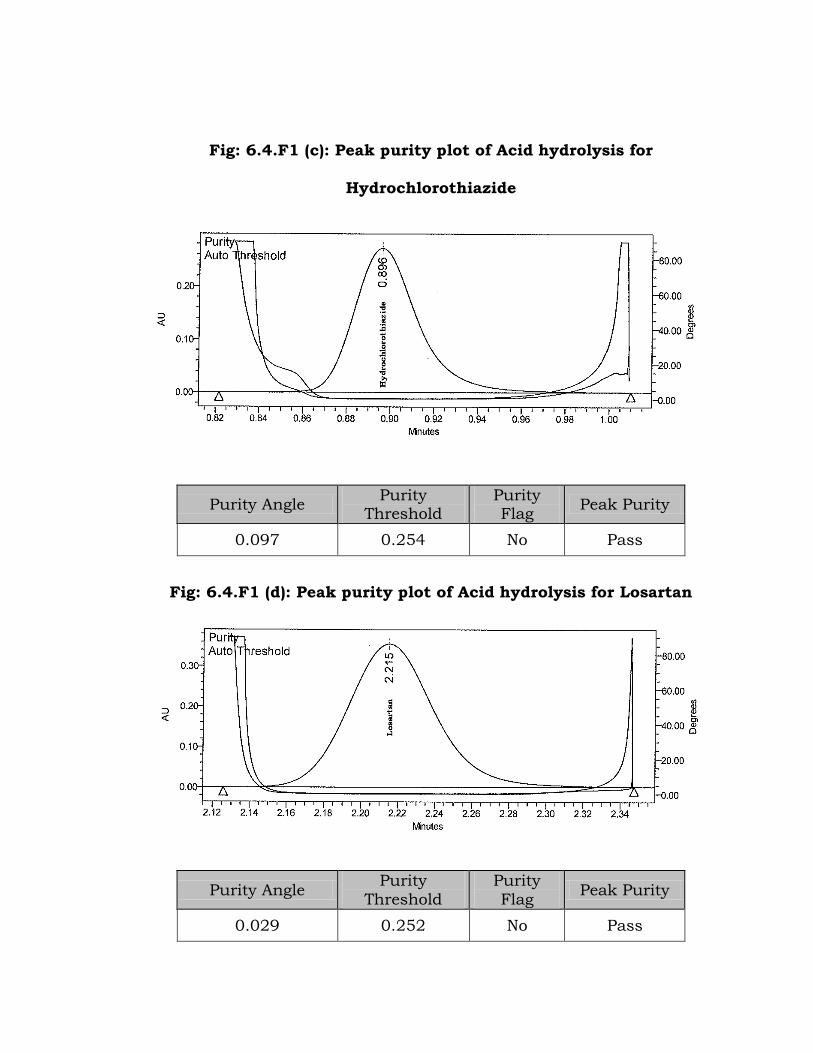
Fig: 6.4.F1 (c): Peak purity plot of Acid hydrolysis for
Hydrochlorothiazide
Purity Angle Purity
Threshold Purity Flag
Peak Purity
0.097 0.254 No Pass
Fig: 6.4.F1 (d): Peak purity plot of Acid hydrolysis for Losartan
Purity Angle Purity
Threshold
Purity
Flag Peak Purity
0.029 0.252 No Pass
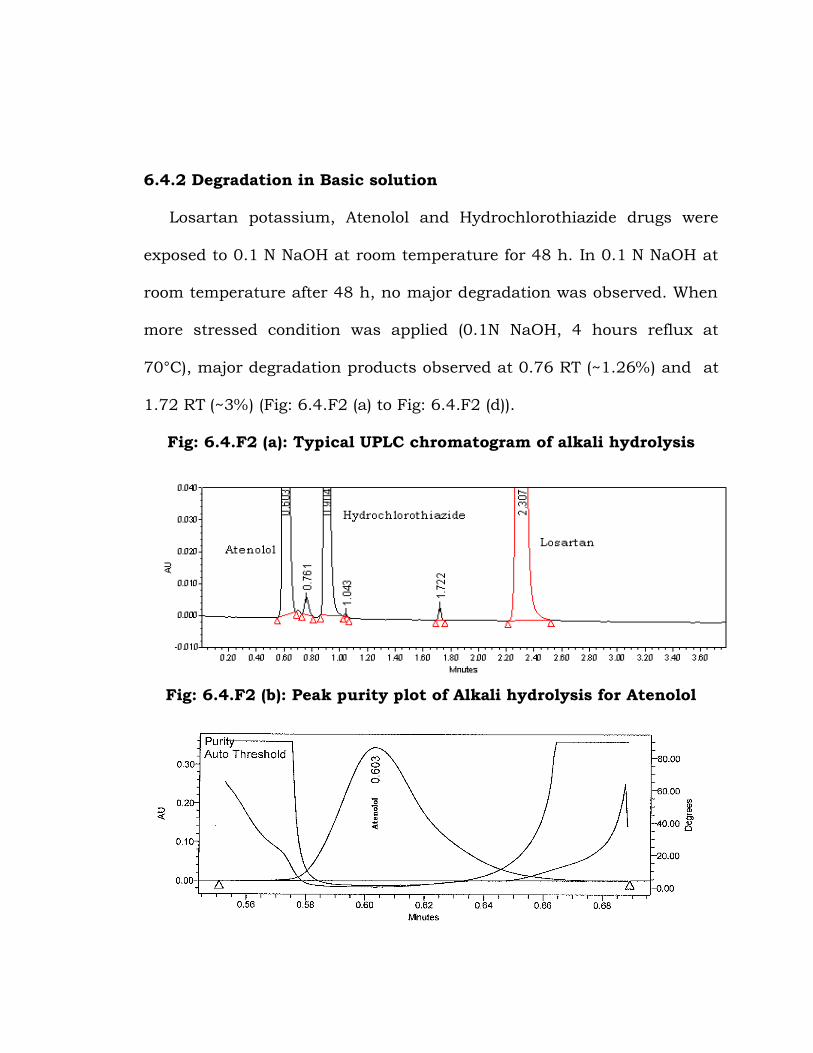
6.4.2 Degradation in Basic solution
Losartan potassium, Atenolol and Hydrochlorothiazide drugs were
exposed to 0.1 N NaOH at room temperature for 48 h. In 0.1 N NaOH at
room temperature after 48 h, no major degradation was observed. When
more stressed condition was applied (0.1N NaOH, 4 hours reflux at
70°C), major degradation products observed at 0.76 RT (~1.26%) and at
1.72 RT (~3%) (Fig: 6.4.F2 (a) to Fig: 6.4.F2 (d)).
Fig: 6.4.F2 (a): Typical UPLC chromatogram of alkali hydrolysis
Fig: 6.4.F2 (b): Peak purity plot of Alkali hydrolysis for Atenolol
Purity Angle Purity
Threshold
Purity
Flag Peak Purity
0.924 1.544 No pass
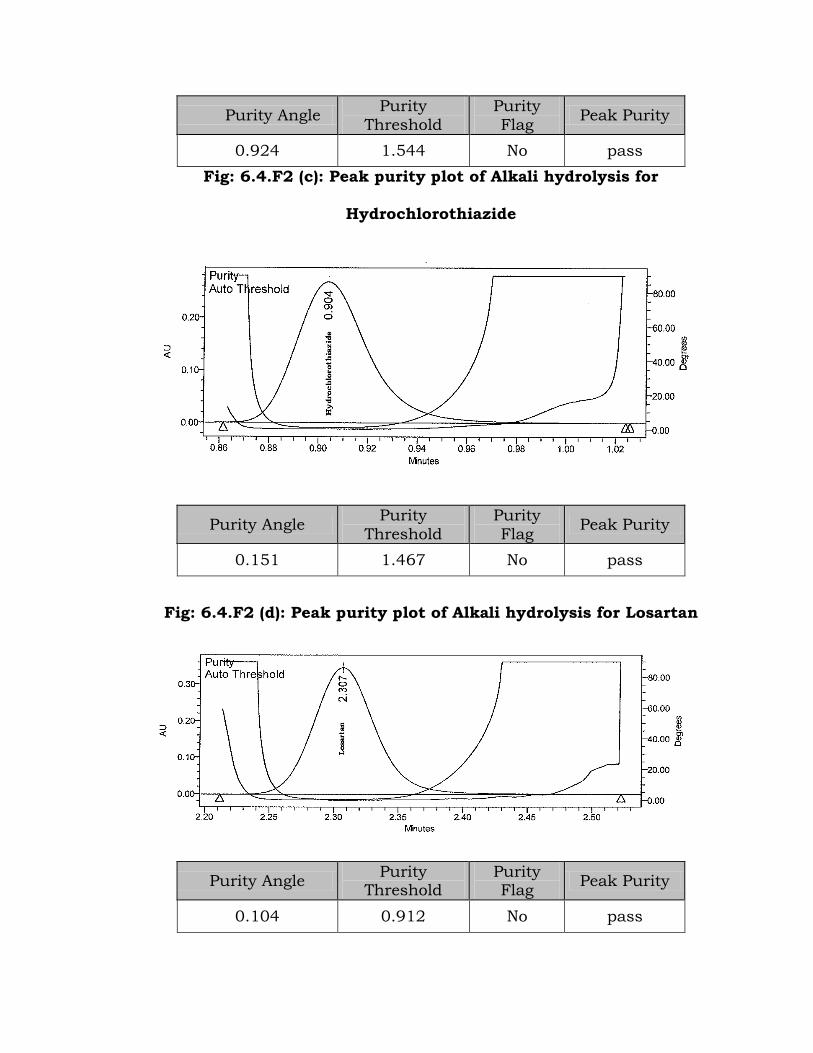
Fig: 6.4.F2 (c): Peak purity plot of Alkali hydrolysis for
Hydrochlorothiazide
Purity Angle Purity
Threshold
Purity
Flag Peak Purity
0.151 1.467 No pass
Fig: 6.4.F2 (d): Peak purity plot of Alkali hydrolysis for Losartan
Purity Angle Purity
Threshold Purity Flag
Peak Purity
0.104 0.912 No pass
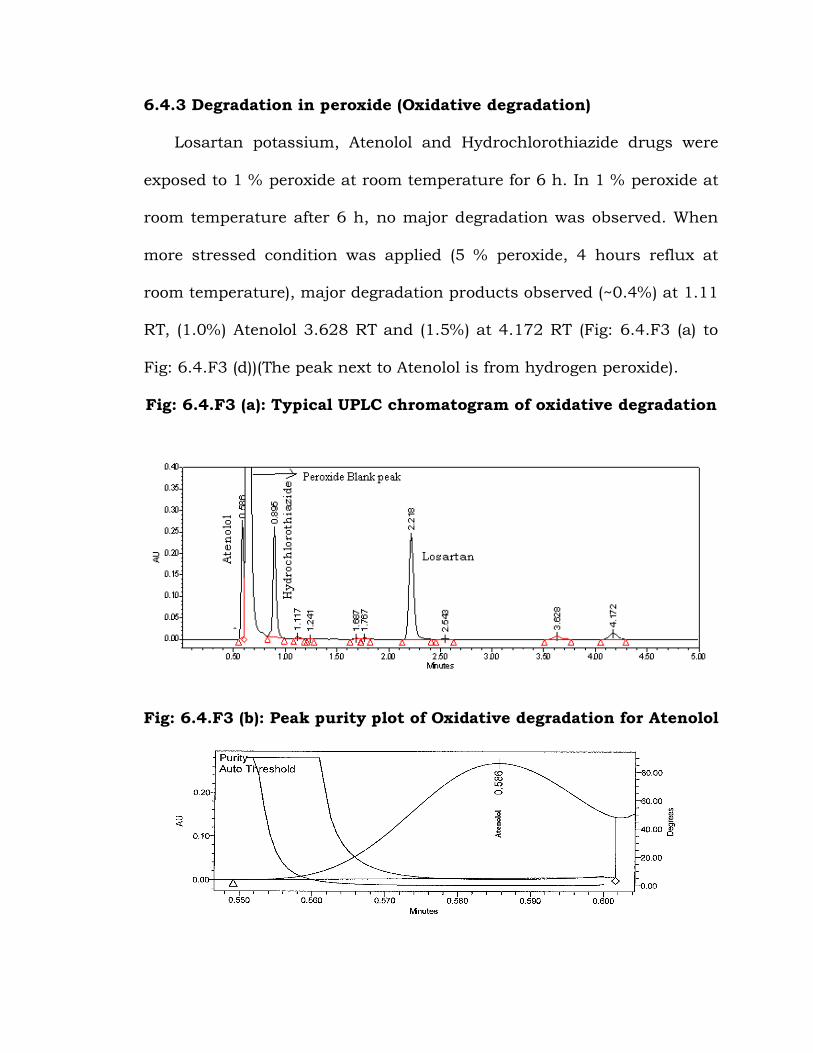
6.4.3 Degradation in peroxide (Oxidative degradation)
Losartan potassium, Atenolol and Hydrochlorothiazide drugs were
exposed to 1 % peroxide at room temperature for 6 h. In 1 % peroxide at
room temperature after 6 h, no major degradation was observed. When
more stressed condition was applied (5 % peroxide, 4 hours reflux at
room temperature), major degradation products observed (~0.4%) at 1.11
RT, (1.0%) Atenolol 3.628 RT and (1.5%) at 4.172 RT (Fig: 6.4.F3 (a) to
Fig: 6.4.F3 (d))(The peak next to Atenolol is from hydrogen peroxide).
Fig: 6.4.F3 (a): Typical UPLC chromatogram of oxidative degradation
Fig: 6.4.F3 (b): Peak purity plot of Oxidative degradation for Atenolol
Purity Angle Purity
Threshold
Purity
Flag Peak Purity
0.231 4.653 No pass
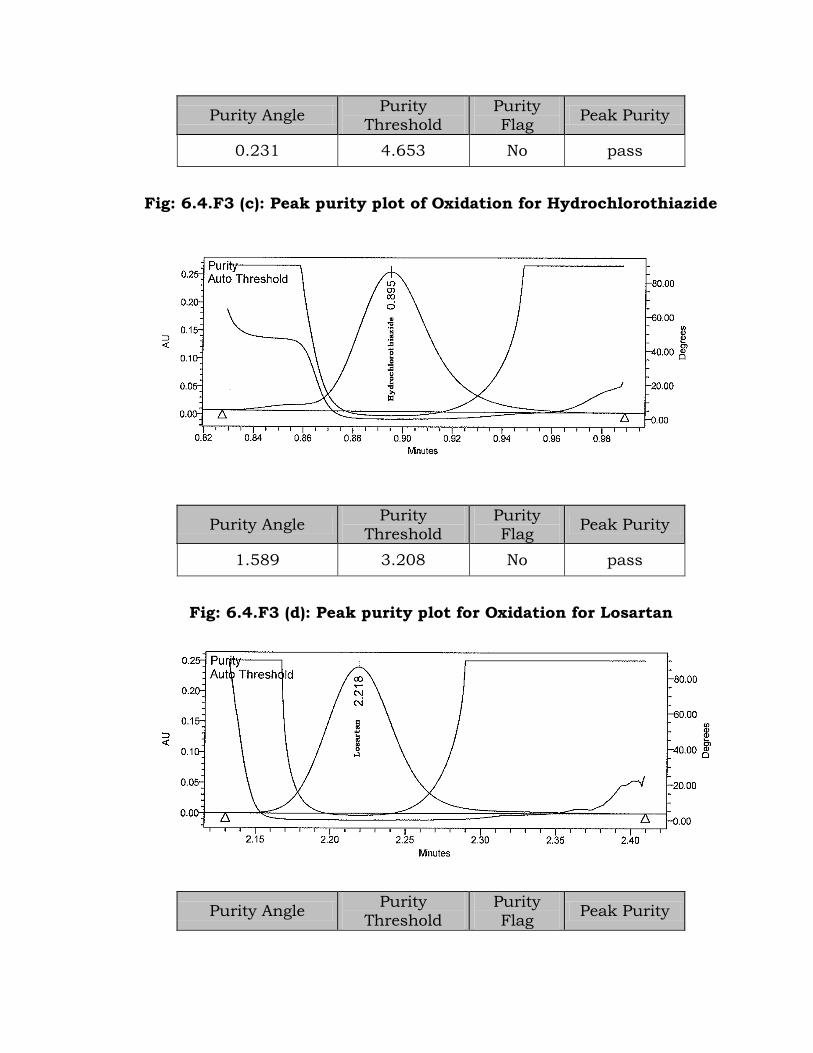
Fig: 6.4.F3 (c): Peak purity plot of Oxidation for Hydrochlorothiazide
Purity Angle Purity
Threshold
Purity
Flag Peak Purity
1.589 3.208 No pass
Fig: 6.4.F3 (d): Peak purity plot for Oxidation for Losartan
Purity Angle Purity
Threshold
Purity
Flag Peak Purity

0.088 4.417 No pass
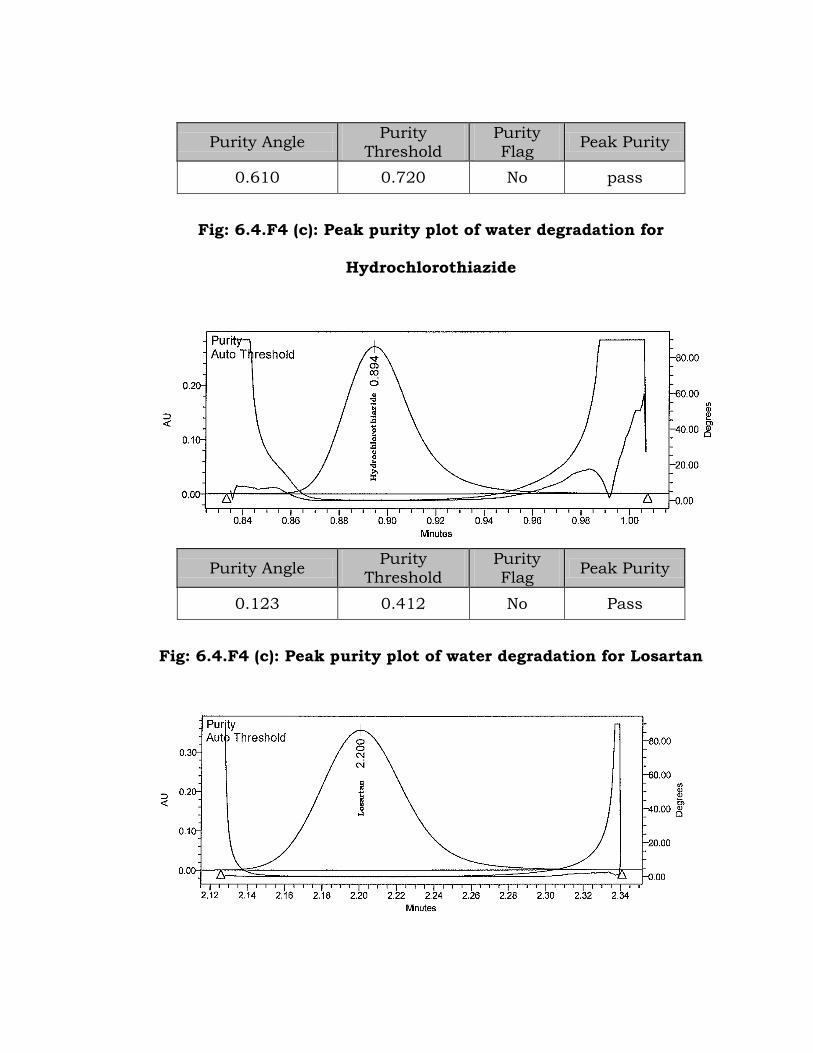
6.4.4 Degradation in Neutral (Water) solution
No major degradation products were observed after 48 h at room
temperature. When more stressed condition was applied (3 hours reflux
at 70 ºC), minor degradation product observed (~1.1%) at 0.74 RT (Fig:
6.4.F4 (a) to Fig: 6.4.F4 (d)).
Fig: 6.4.F4 (a): Typical UPLC chromatogram of Water degradation
Fig: 6.4.F4 (b): Peak purity plot of water degradation for Atenolol
Purity Angle Purity
Threshold
Purity
Flag Peak Purity
0.610 0.720 No pass
Fig: 6.4.F4 (c): Peak purity plot of water degradation for
Hydrochlorothiazide
Purity Angle Purity
Threshold
Purity
Flag Peak Purity
0.123 0.412 No Pass
Fig: 6.4.F4 (c): Peak purity plot of water degradation for Losartan
Purity Angle Purity
Threshold
Purity
Flag Peak Purity
0.023 0.263 No Pass
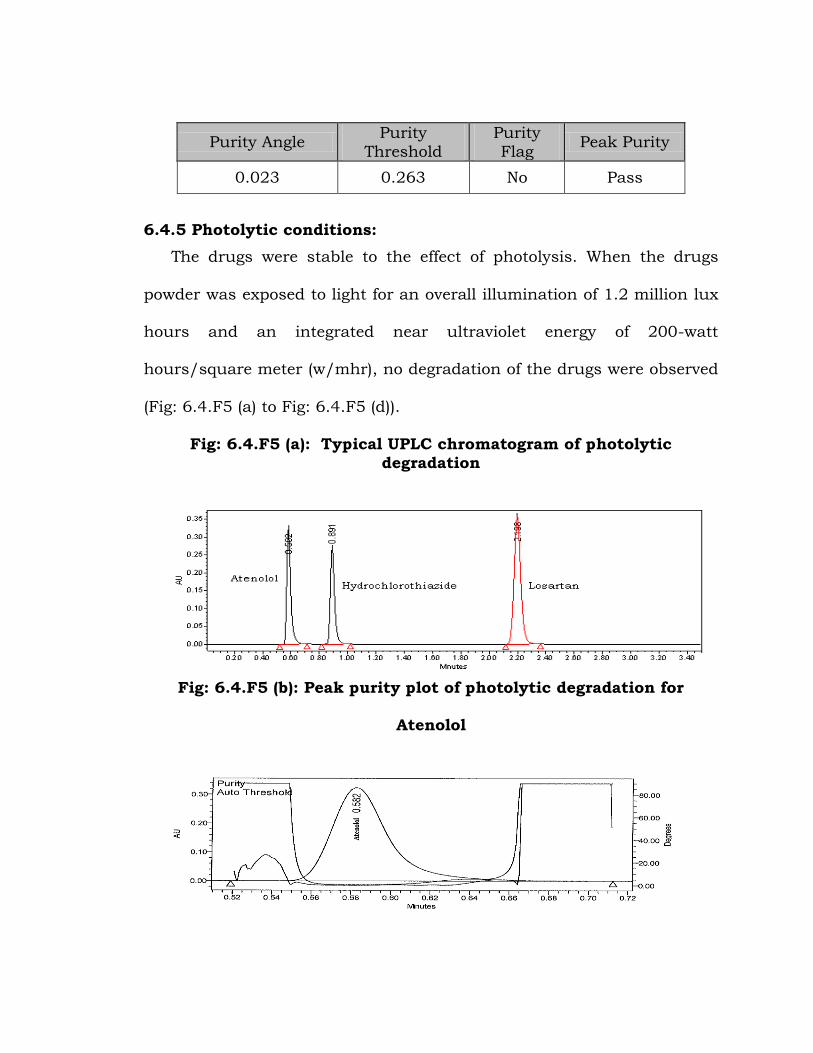
6.4.5 Photolytic conditions:
The drugs were stable to the effect of photolysis. When the drugs
powder was exposed to light for an overall illumination of 1.2 million lux
hours and an integrated near ultraviolet energy of 200-watt
hours/square meter (w/mhr), no degradation of the drugs were observed
(Fig: 6.4.F5 (a) to Fig: 6.4.F5 (d)).
Fig: 6.4.F5 (a): Typical UPLC chromatogram of photolytic
degradation
Fig: 6.4.F5 (b): Peak purity plot of photolytic degradation for
Atenolol
Purity Angle Purity
Threshold
Purity
Flag Peak Purity
0.413 0.743 No Pass
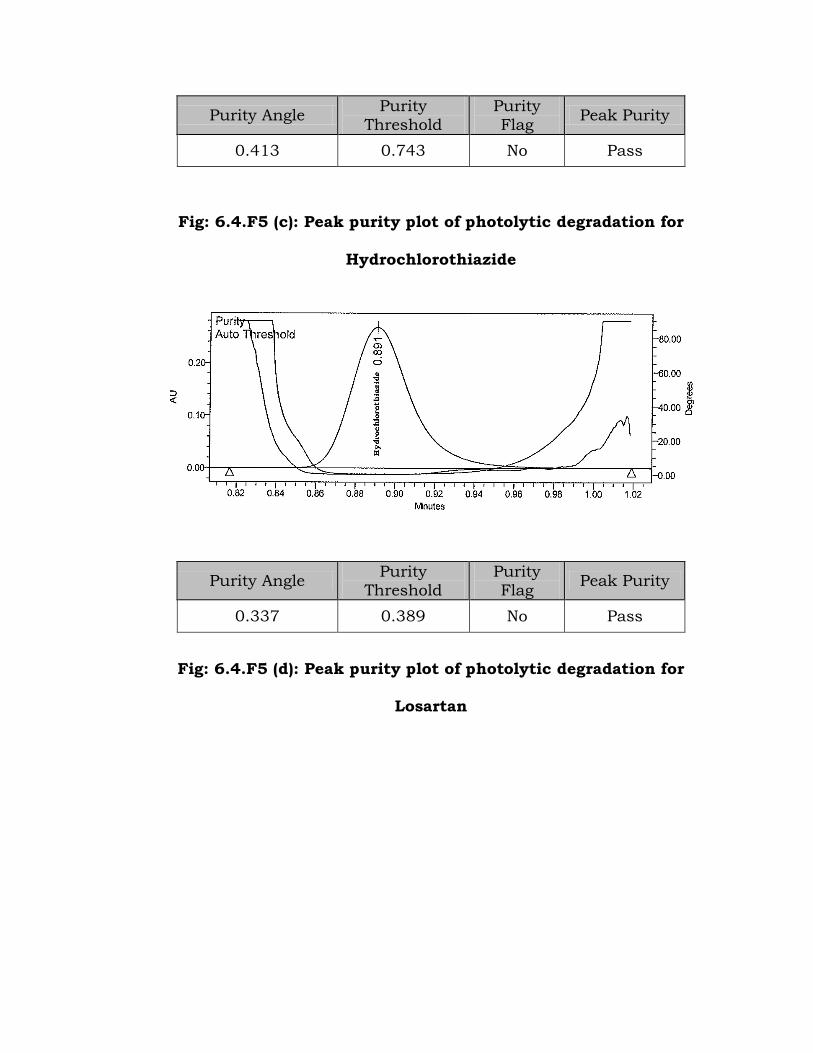
Fig: 6.4.F5 (c): Peak purity plot of photolytic degradation for
Hydrochlorothiazide
Purity Angle Purity
Threshold
Purity
Flag Peak Purity
0.337 0.389 No Pass
Fig: 6.4.F5 (d): Peak purity plot of photolytic degradation for
Losartan
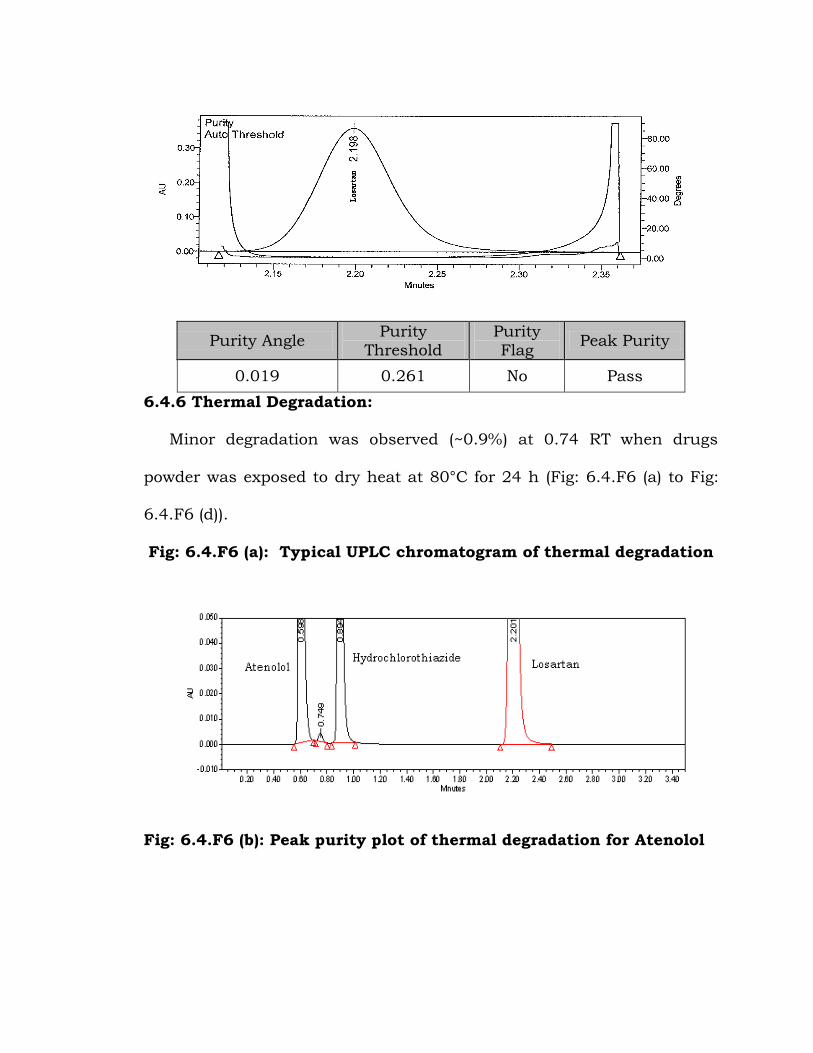
Purity Angle Purity
Threshold
Purity
Flag Peak Purity
0.019 0.261 No Pass
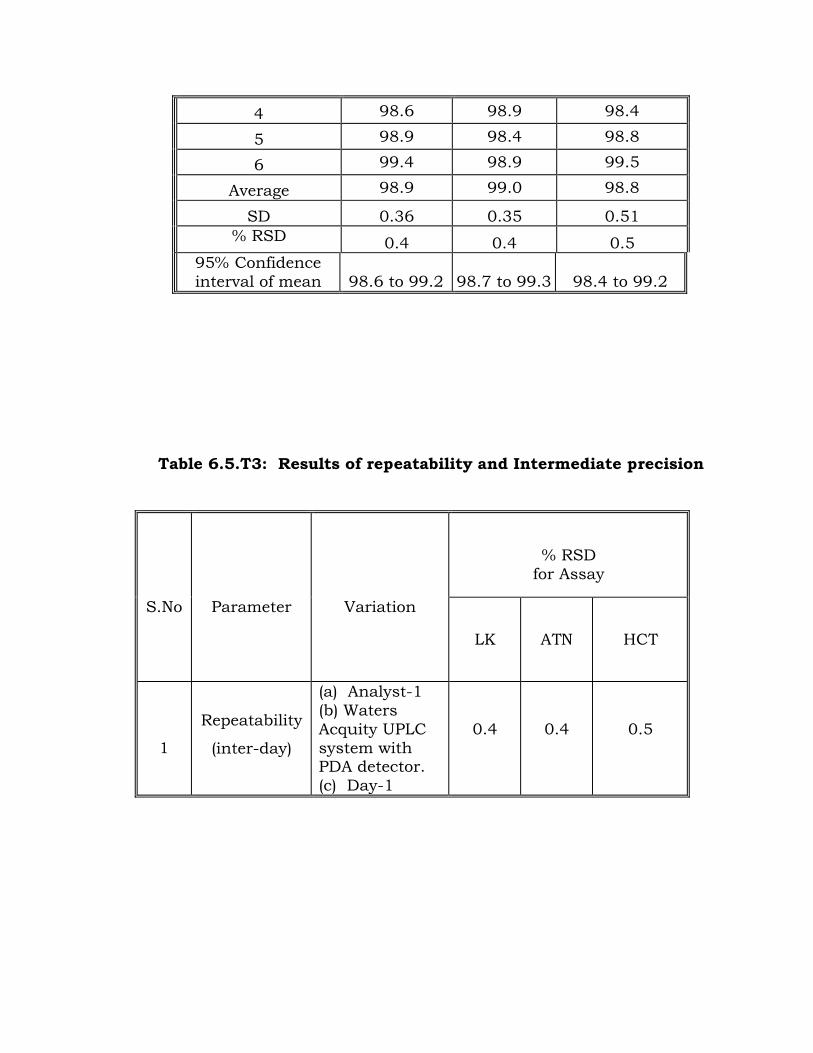
6.4.6 Thermal Degradation:
Minor degradation was observed (~0.9%) at 0.74 RT when drugs
powder was exposed to dry heat at 80°C for 24 h (Fig: 6.4.F6 (a) to Fig:
6.4.F6 (d)).
Fig: 6.4.F6 (a): Typical UPLC chromatogram of thermal degradation
Fig: 6.4.F6 (b): Peak purity plot of thermal degradation for Atenolol

Purity Angle Purity
Threshold
Purity
Flag Peak Purity
0.540 0.637 No Pass
Fig: 6.4.F6 (c): Peak purity plot of thermal degradation for
Hydrochlorothiazide
Purity Angle Purity
Threshold
Purity
Flag Peak Purity
0.091 0.381 No pass
Fig: 6.4.F6 (d): Peak purity plot of thermal degradation for Losartan

Purity Angle Purity
Threshold
Purity
Flag Peak Purity
0.026 0.267 No pass
Peak purity test performed for the Losartan, Atenolol and
Hydrochlorothiazide peaks using photodiode array (PDA) detector, data
confirmed the purity of the peaks for all the stressed samples.
6.5 Analytical method Validation, results and discussion
The developed and optimized UPLC method was taken up for method
validation. The analytical method validation was carried out in
accordance with ICH guidelines [19-21].
6.5.1 System Suitability Test
Standard containing Losartan potassium, Atenolol and
Hydrochlorothiazide was injected into UPLC system for 5 times and the
system suitability results were tabulated in Table 6.5.T1.
Table 6.5.T1: System Suitability results

Compound
(n=5)
USP Tailing
factor (T) USP Resolution
% RSD for 5
replicate injections
Atenolol
1.2 - 0.5%
Hydrochloro
thiazide
1.1 5.7 0.2%
Losartan 1.2 19.8 0.2%
n = Number of determinations
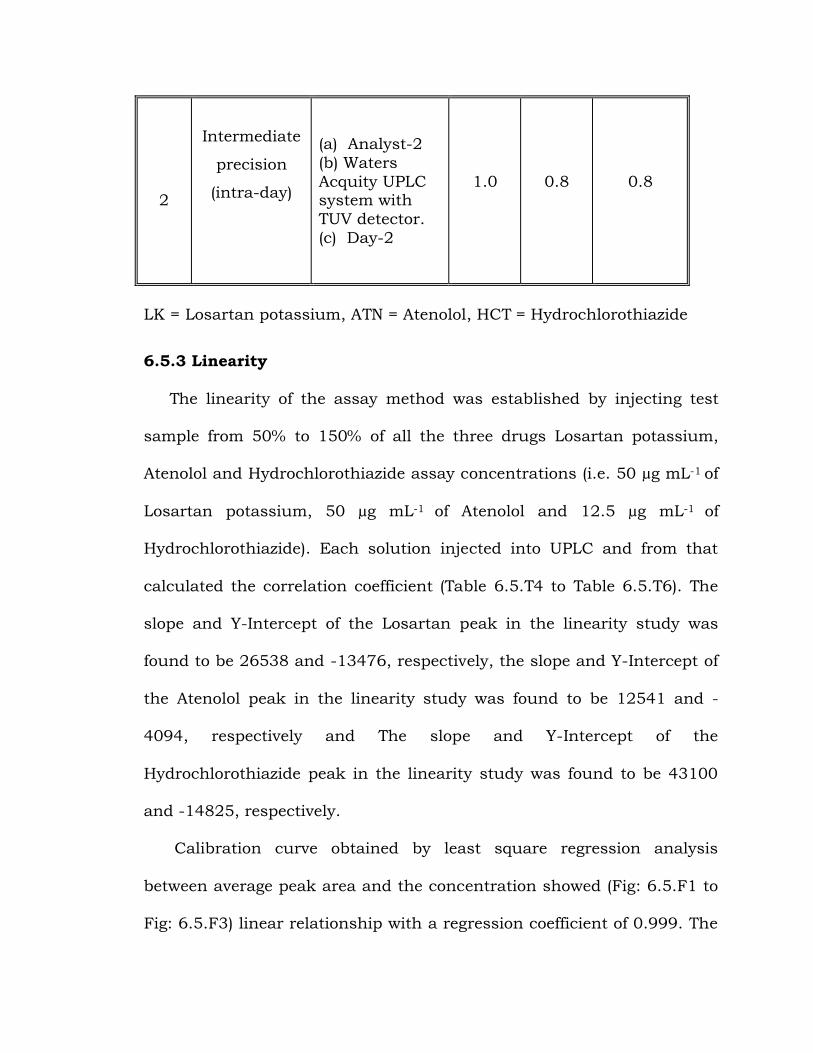
6.5.2 Precision
Assay method precision study was evaluated by carrying out six
independent assays of Losartan potassium, Atenolol and
Hydrochlorothiazide test sample against qualified reference standards
and RSD of six consecutive assays was 0.4%, 0.4% and 0.5% for
Losartan potassium, Atenolol and Hydrochlorothiazide respectively for
repeatability (Table 6.5.T2) and 1.0%, 0.8% and 0.8% for Losartan
potassium, Atenolol and Hydrochlorothiazide respectively for
intermediate precision (Table 6.5.T3). Results showed insignificant
variation in measured response, which demonstrated that the method
was repeatable with RSDs below 1.0 %.
Table 6.5.T2: Precision results of the assay method (Repeatability)
Preparation
% Assay
Losartan
potassium Atenolol
Hydrochlorothia
zide
1 99.2 99.4 99.3
2 98.5 99.1 98.1
3 98.8 99.1 98.8
4 98.6 98.9 98.4
5 98.9 98.4 98.8
6 99.4 98.9 99.5
Average 98.9 99.0 98.8
SD 0.36 0.35 0.51
% RSD 0.4 0.4 0.5
95% Confidence
interval of mean 98.6 to 99.2 98.7 to 99.3 98.4 to 99.2
Table 6.5.T3: Results of repeatability and Intermediate precision
S.No
Parameter
Variation
% RSD
for Assay
LK ATN HCT
1
Repeatability
(inter-day)
(a) Analyst-1
(b) Waters
Acquity UPLC
system with PDA detector.
(c) Day-1
0.4 0.4 0.5
2
Intermediate
precision
(intra-day)
(a) Analyst-2
(b) Waters
Acquity UPLC system with
TUV detector.
(c) Day-2
1.0 0.8 0.8
LK = Losartan potassium, ATN = Atenolol, HCT = Hydrochlorothiazide
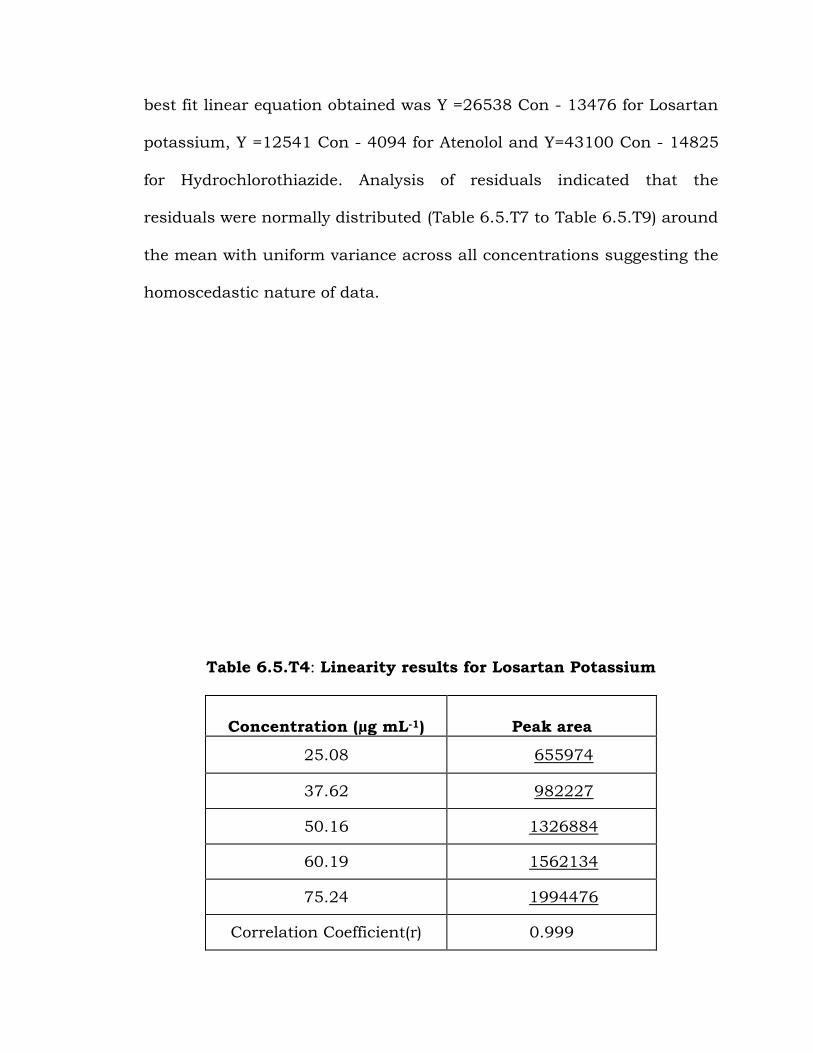
6.5.3 Linearity
The linearity of the assay method was established by injecting test
sample from 50% to 150% of all the three drugs Losartan potassium,
Atenolol and Hydrochlorothiazide assay concentrations (i.e. 50 µg mL-1 of
Losartan potassium, 50 µg mL-1 of Atenolol and 12.5 µg mL-1 of
Hydrochlorothiazide). Each solution injected into UPLC and from that
calculated the correlation coefficient (Table 6.5.T4 to Table 6.5.T6). The
slope and Y-Intercept of the Losartan peak in the linearity study was
found to be 26538 and -13476, respectively, the slope and Y-Intercept of
the Atenolol peak in the linearity study was found to be 12541 and -
4094, respectively and The slope and Y-Intercept of the
Hydrochlorothiazide peak in the linearity study was found to be 43100
and -14825, respectively.
Calibration curve obtained by least square regression analysis
between average peak area and the concentration showed (Fig: 6.5.F1 to
Fig: 6.5.F3) linear relationship with a regression coefficient of 0.999. The
best fit linear equation obtained was Y =26538 Con - 13476 for Losartan
potassium, Y =12541 Con - 4094 for Atenolol and Y=43100 Con - 14825
for Hydrochlorothiazide. Analysis of residuals indicated that the
residuals were normally distributed (Table 6.5.T7 to Table 6.5.T9) around
the mean with uniform variance across all concentrations suggesting the
homoscedastic nature of data.
Table 6.5.T4: Linearity results for Losartan Potassium
Concentration (µg mL-1) Peak area
25.08 655974
37.62 982227
50.16 1326884
60.19 1562134
75.24 1994476
Correlation Coefficient(r) 0.999

Limit 0.999
Slope 26538
Intercept -13476
Fig: 6.5.F1: Linearity plot for Losartan potassium
Table 6.5.T5: Linearity results of Atenolol
Concentration (µg mL-1) Peak area
25.05 308526
37.58 470454
50.10 629814
60.12 737250
75.15 943523
Correlation Coefficient(r) 0.999

Limit 0.999
Slope 12541
Intercept -4094
Fig: 6.5.F2: Linearity plot for Assay Method for Atenolol
Table 6.5.T6: Linearity results of Hydrochlorothiazide
Concentration (µg mL-1) Peak area
6.26 258150
9.38 383995
12.51 524652
14.39 607085
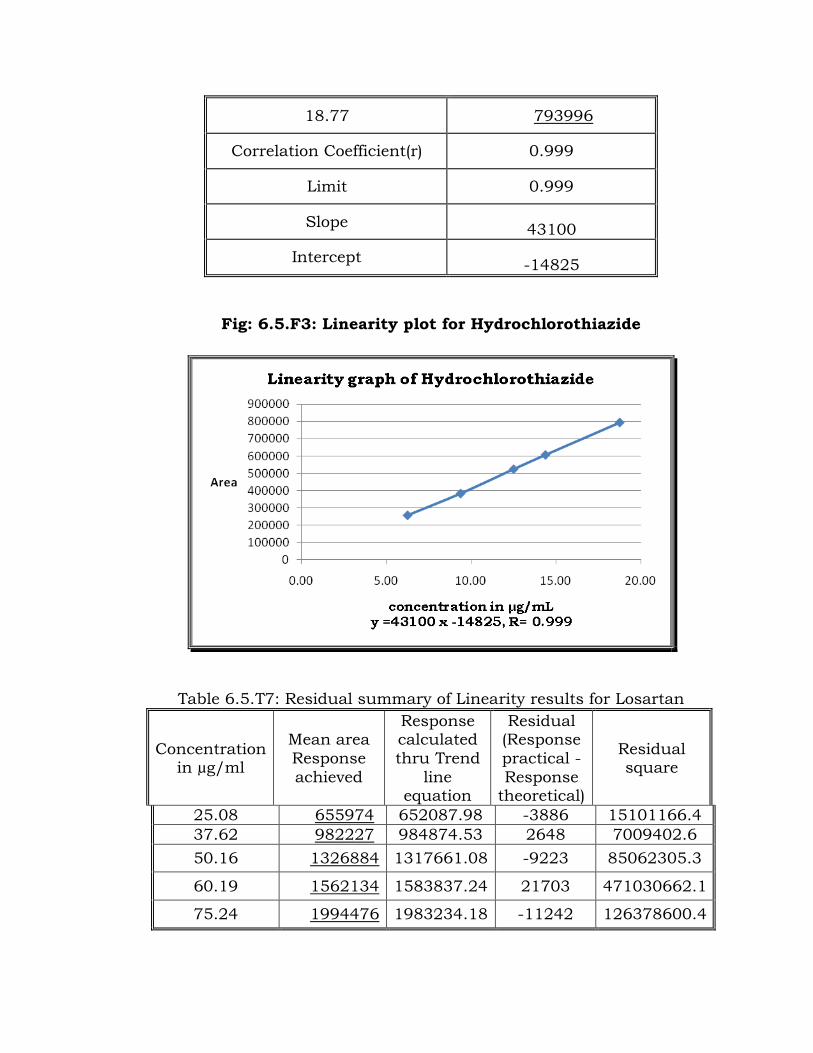
18.77 793996
Correlation Coefficient(r) 0.999
Limit 0.999
Slope 43100
Intercept -14825
Fig: 6.5.F3: Linearity plot for Hydrochlorothiazide
Table 6.5.T7: Residual summary of Linearity results for Losartan
Concentration in µg/ml
Mean area
Response
achieved
Response calculated
thru Trend
line equation
Residual (Response
practical -
Response theoretical)
Residual square
25.08 655974 652087.98 -3886 15101166.4
37.62 982227 984874.53 2648 7009402.6
50.16 1326884 1317661.08 -9223 85062305.3
60.19 1562134 1583837.24 21703 471030662.1
75.24 1994476 1983234.18 -11242 126378600.4
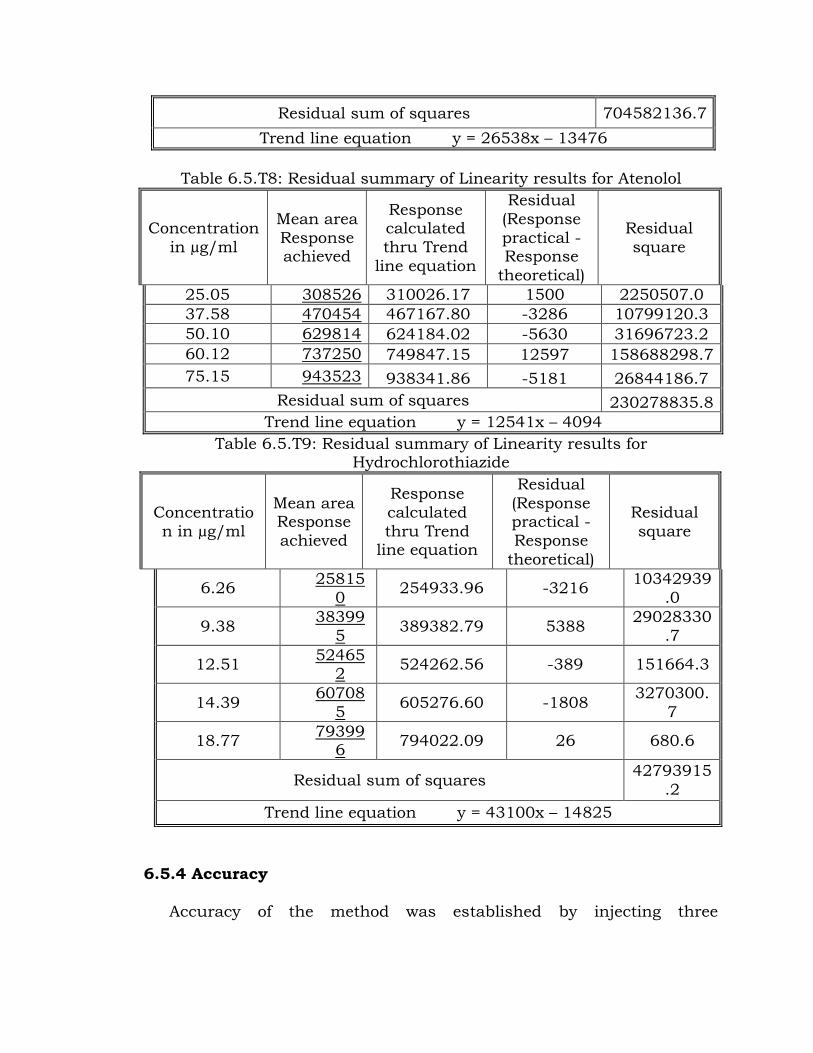
Residual sum of squares 704582136.7
Trend line equation y = 26538x – 13476
Table 6.5.T8: Residual summary of Linearity results for Atenolol
Concentration
in µg/ml
Mean area
Response achieved
Response calculated
thru Trend
line equation
Residual
(Response
practical -Response
theoretical)
Residual
square
25.05 308526 310026.17 1500 2250507.0
37.58 470454 467167.80 -3286 10799120.3
50.10 629814 624184.02 -5630 31696723.2
60.12 737250 749847.15 12597 158688298.7
75.15 943523 938341.86 -5181 26844186.7
Residual sum of squares 230278835.8
Trend line equation y = 12541x – 4094
Table 6.5.T9: Residual summary of Linearity results for Hydrochlorothiazide
Concentratio
n in µg/ml
Mean area Response
achieved
Response
calculated
thru Trend line equation
Residual
(Response practical -
Response
theoretical)
Residual
square
6.26 25815
0 254933.96 -3216
10342939
.0
9.38 38399
5 389382.79 5388
29028330
.7
12.51 52465
2 524262.56 -389 151664.3
14.39 60708
5 605276.60 -1808
3270300.
7
18.77 79399
6 794022.09 26 680.6
Residual sum of squares 42793915
.2
Trend line equation y = 43100x – 14825
6.5.4 Accuracy
Accuracy of the method was established by injecting three
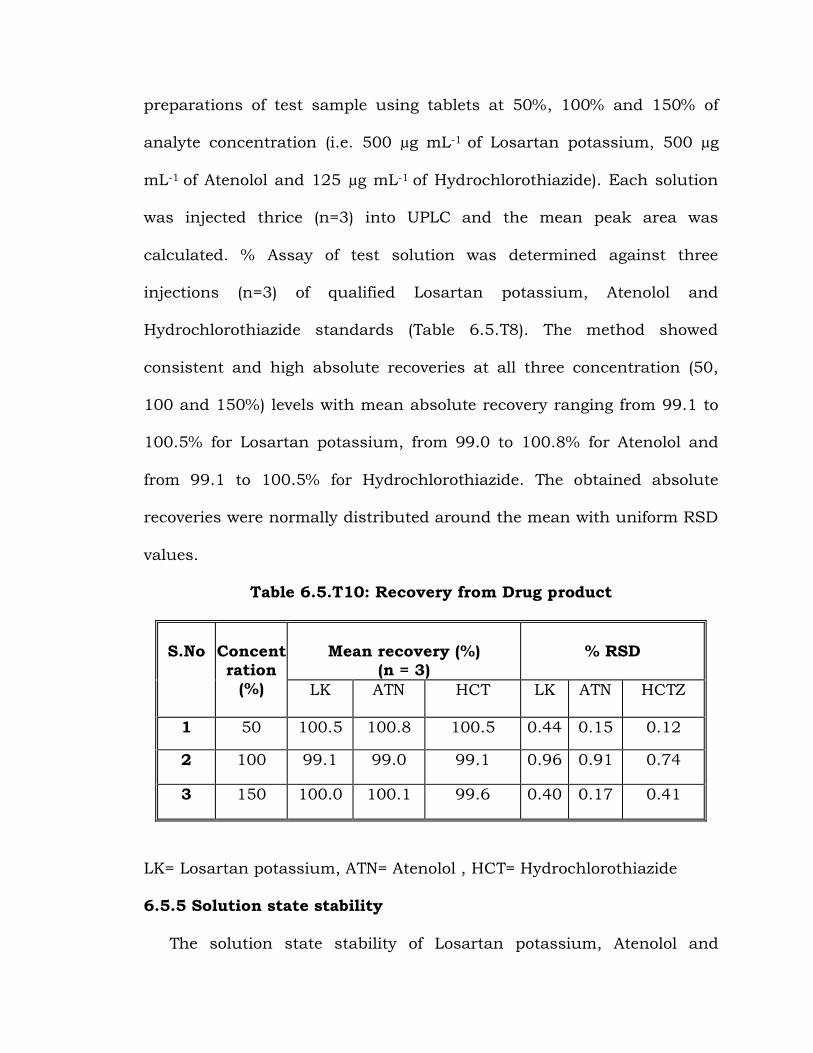
preparations of test sample using tablets at 50%, 100% and 150% of
analyte concentration (i.e. 500 µg mL-1 of Losartan potassium, 500 µg
mL-1 of Atenolol and 125 µg mL-1 of Hydrochlorothiazide). Each solution
was injected thrice (n=3) into UPLC and the mean peak area was
calculated. % Assay of test solution was determined against three
injections (n=3) of qualified Losartan potassium, Atenolol and
Hydrochlorothiazide standards (Table 6.5.T8). The method showed
consistent and high absolute recoveries at all three concentration (50,
100 and 150%) levels with mean absolute recovery ranging from 99.1 to
100.5% for Losartan potassium, from 99.0 to 100.8% for Atenolol and
from 99.1 to 100.5% for Hydrochlorothiazide. The obtained absolute
recoveries were normally distributed around the mean with uniform RSD
values.
Table 6.5.T10: Recovery from Drug product
S.No
Concent
ration
(%)
Mean recovery (%)
(n = 3)
% RSD
LK ATN HCT LK ATN HCTZ
1 50 100.5 100.8 100.5 0.44 0.15 0.12
2 100 99.1 99.0 99.1 0.96 0.91 0.74
3 150 100.0 100.1 99.6 0.40 0.17 0.41
LK= Losartan potassium, ATN= Atenolol , HCT= Hydrochlorothiazide
6.5.5 Solution state stability
The solution state stability of Losartan potassium, Atenolol and
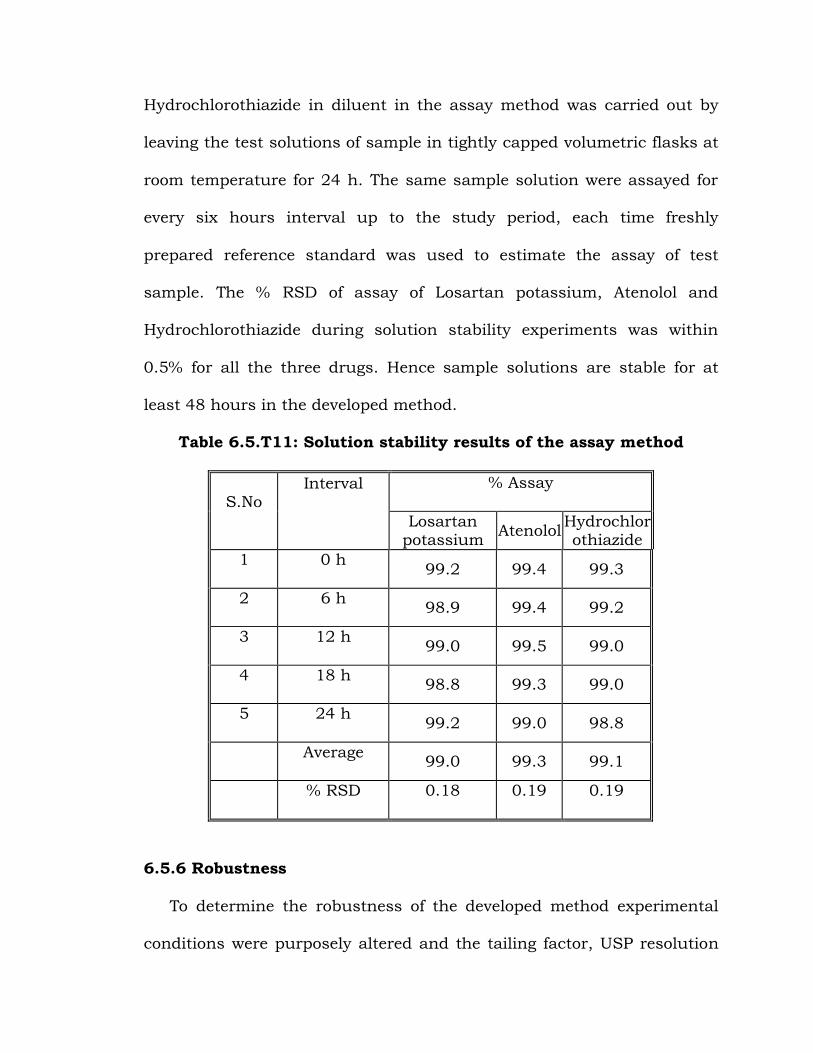
Hydrochlorothiazide in diluent in the assay method was carried out by
leaving the test solutions of sample in tightly capped volumetric flasks at
room temperature for 24 h. The same sample solution were assayed for
every six hours interval up to the study period, each time freshly
prepared reference standard was used to estimate the assay of test
sample. The % RSD of assay of Losartan potassium, Atenolol and
Hydrochlorothiazide during solution stability experiments was within
0.5% for all the three drugs. Hence sample solutions are stable for at
least 48 hours in the developed method.
Table 6.5.T11: Solution stability results of the assay method
S.No Interval
% Assay
Losartan potassium
Atenolol Hydrochlorothiazide
1 0 h 99.2 99.4 99.3
2 6 h 98.9 99.4 99.2
3 12 h 99.0 99.5 99.0
4 18 h 98.8 99.3 99.0
5 24 h 99.2 99.0 98.8
Average 99.0 99.3 99.1
% RSD 0.18 0.19 0.19
6.5.6 Robustness
To determine the robustness of the developed method experimental
conditions were purposely altered and the tailing factor, USP resolution
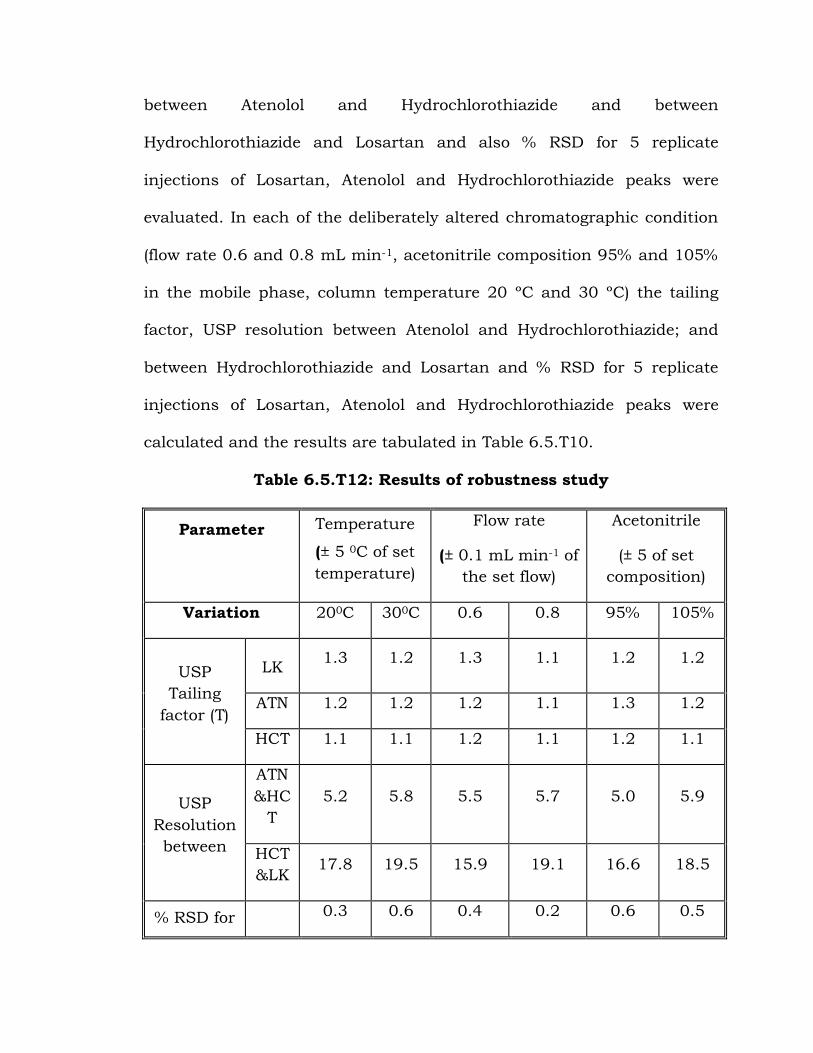
between Atenolol and Hydrochlorothiazide and between
Hydrochlorothiazide and Losartan and also % RSD for 5 replicate
injections of Losartan, Atenolol and Hydrochlorothiazide peaks were
evaluated. In each of the deliberately altered chromatographic condition
(flow rate 0.6 and 0.8 mL min-1, acetonitrile composition 95% and 105%
in the mobile phase, column temperature 20 ºC and 30 ºC) the tailing
factor, USP resolution between Atenolol and Hydrochlorothiazide; and
between Hydrochlorothiazide and Losartan and % RSD for 5 replicate
injections of Losartan, Atenolol and Hydrochlorothiazide peaks were
calculated and the results are tabulated in Table 6.5.T10.
Table 6.5.T12: Results of robustness study
Parameter
Temperature
(± 5 0C of set
temperature)
Flow rate
(± 0.1 mL min-1 of
the set flow)
Acetonitrile
(± 5 of set
composition)
Variation 200C 300C 0.6 0.8 95% 105%
USP
Tailing
factor (T)
LK 1.3 1.2 1.3 1.1 1.2 1.2
ATN 1.2 1.2 1.2 1.1 1.3 1.2
HCT 1.1 1.1 1.2 1.1 1.2 1.1
USP
Resolution
between
ATN
&HC
T
5.2 5.8 5.5 5.7 5.0 5.9
HCT
&LK 17.8 19.5 15.9 19.1 16.6 18.5
% RSD for 0.3 0.6 0.4 0.2 0.6 0.5
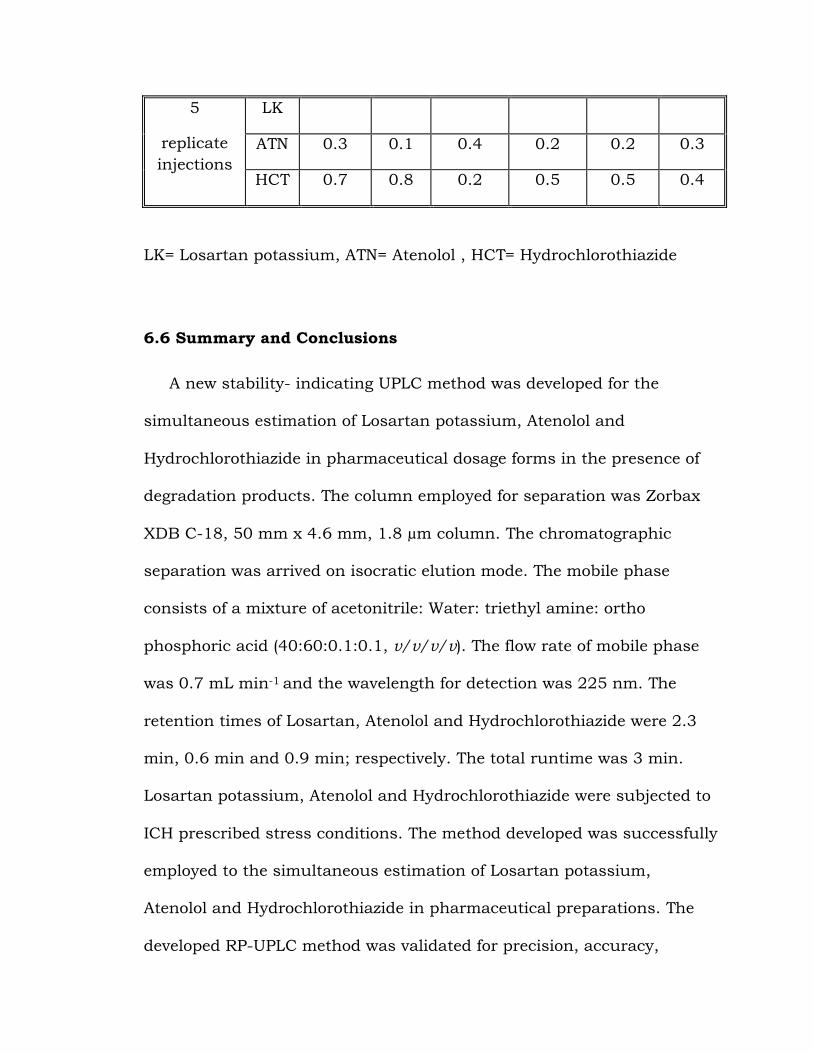
5
replicate
injections
LK
ATN 0.3 0.1 0.4 0.2 0.2 0.3
HCT 0.7 0.8 0.2 0.5 0.5 0.4
LK= Losartan potassium, ATN= Atenolol , HCT= Hydrochlorothiazide
6.6 Summary and Conclusions
A new stability- indicating UPLC method was developed for the
simultaneous estimation of Losartan potassium, Atenolol and
Hydrochlorothiazide in pharmaceutical dosage forms in the presence of
degradation products. The column employed for separation was Zorbax
XDB C-18, 50 mm x 4.6 mm, 1.8 µm column. The chromatographic
separation was arrived on isocratic elution mode. The mobile phase
consists of a mixture of acetonitrile: Water: triethyl amine: ortho
phosphoric acid (40:60:0.1:0.1, v/v/v/v). The flow rate of mobile phase
was 0.7 mL min-1 and the wavelength for detection was 225 nm. The
retention times of Losartan, Atenolol and Hydrochlorothiazide were 2.3
min, 0.6 min and 0.9 min; respectively. The total runtime was 3 min.
Losartan potassium, Atenolol and Hydrochlorothiazide were subjected to
ICH prescribed stress conditions. The method developed was successfully
employed to the simultaneous estimation of Losartan potassium,
Atenolol and Hydrochlorothiazide in pharmaceutical preparations. The
developed RP-UPLC method was validated for precision, accuracy,

linearity, robustness and ruggedness and found to be precise, accurate,
linear, robust, rugged and stability indicating. Thus the proposed method
can be employed for assessing the stability of Losartan potassium,
Atenolol and Hydrochlorothiazide for its individual dosage form and for
its combined dosage forms.
Table 6.6.T1: Summary of analytical method validation
Test
Parameter
Assay method
LK ATN HCT
Precision (RSD) 0.4 0.4 0.5
Linearity (Corre coefficient)
> 0.999 > 0.999 > 0.999
Accuracy % 99.1-100.5 99.0-100.8 99.1-100.5
Robustness
% RSD for 5 replicate injections < 2.0, USP tailing is less than 2.0 and Resolution
between pair compounds was > 5.0
Solution stability Stable for 24 hours at room temperature
Specificity
For all stress conditions, purity angle is less
than the purity threshold and there is no
purity flag observed for purity results
LK= Losartan potassium , ATN= Atenolol , HCT= Hydrochlorothiazide
References
[1] O.C. Lastra, I.G. Lemus, H.J. Sanchez, and R.F. Perez, J.
Pharm. Biomed. Anal. 33(2003) 175-180.
[2] M.B. Shankar, F.A. Metha, K.K. Bhatt, R.S. Metha, M. Geetha, J.
Pharm. Sci. 65 (2003) 167-170.
[3] A.H. Prabhakar, R. Giridhar, J. Pharm. Biomed. Anal. 27 (2002)
861-866.
[4] N. Erk, J. Pharm Biomed. Anal. 24 (2001) 603-611.
[5] G. Carlucci, G. Palumbo, P. Mazzeo, M.G. Quaglia , J. Pharm.
Biomed. Anal. 23 (2000)185-189.
[6] D.L. Hertzog, J.F. McCAfferty, X. Fang, R.J. Tyrrell, R.A. Reed,
J.Pharm. Biomed. Anal. 30 (2002) 747-760.
[7] C.V.N. Prasad, C. Parihar, K. sunil, P.Parimoo, J.Pharm. Biomed.
Anal. 17 (1998) 877-884.
[8] S.M. Al-Ghannam, J.Pharm. Biomed. Anal. 40 (2006) 151-156.
[9] A.P. Agrekar, S.G. Powar, J. Pharm. Biomed. Anal. 21 (2000) 1137-
1142.
[10] G.Lamprecht, T. Kraushofer, K. Stoschitzky, W. Linder, J.
Chromatogr. B. 740 (2000) 219-226.
[11] H. Taomin, H. Zhang, Y. Bei, S. Luping, Z. Xiaowei, D. Gengli, J.
Pharm. Biomed. Anal. 34 (2004) 433-440.
[12] O.A. Razak, J.Pharm. Biomed. Anal. 34 (2006) 433-440.
[13] M. Lusina, T. Cindric, J. Tomaic, M. Peko, L. Poziac, N.Musulin,
Int. J. Pharm. 291 (2005) 127-137.
[14] E. Sidiko, M.C. Sevil, A. Sedef, J. Pharm. Biomed. Anal. 33 (2003)
505-511.
[15] J.A. Murillo, A.A. Pulgarin, M.Alanon, G. Prez-Olivares Nieto, Anal.
Chim. Acta, 518 (2004) 37-43.
[16] T. Takubo, H. Okada, M. Ishii, K. Hara, Y. Ishii, J. Chromatogr. B,
806 (2004)199-203.
[17] N. Erk, J. Chromatogr. B, 784 (2003)195-201.
[18] S.R. Sathe, S.B. Bari, ACTA Chromatogr. 19 (2007) 270-278
[19] International Conference on Harmonization (1996) Text on
Validation of Analytical Procedures: Term and definition Q2A,
International Conference on Harmonization, IFPMA, Geneva.
[20] International Conference on Harmonization (1997) Validation
of Analytical Procedures: Methodology Q2B, International
Conference on Harmonization, IFPMA, Geneva.
[21] International Conference on Harmonization (1996) Photo
stability testing of new drug substance and products Q1B,
International Conference on Harmonization, IFPMA, Geneva.