SYNTHESIS AND CHARACTERIZATION OF MgO … Dr. Farhad, Dr. Hazman, ... CHAPTER 1 ... Table 2.5:...
49
SYNTHESIS AND CHARACTERIZATION OF MgO-Cr 2 O 3 -ZTA CUTTING TOOL MATERIAL by AHMAD ZAHIRANI AHMAD AZHAR Thesis submitted in fulfilment of the requirements for the degree of Doctor of Philosophy January 2013
Transcript of SYNTHESIS AND CHARACTERIZATION OF MgO … Dr. Farhad, Dr. Hazman, ... CHAPTER 1 ... Table 2.5:...

SYNTHESIS AND CHARACTERIZATION OF MgO-Cr2O3-ZTA CUTTING
TOOL MATERIAL
by
AHMAD ZAHIRANI AHMAD AZHAR
Thesis submitted in fulfilment of the requirements
for the degree of
Doctor of Philosophy
January 2013

ii
Author’s declaration
I hereby declare that I have conducted, completed the research work and written the
dissertation entitled “SYNTHESIS AND CHARACTERIZATION OF MgO-Cr2O3-
ZTA CUTTING TOOL MATERIAL”. I also declare that it has not been previously
submitted for the award of any degree or diploma or other similar title of this or any
other examining body or university.
Signature of candidate:
Name of candidate: Ahmad Zahirani Ahmad Azhar
Date:
Witness by:
Signature of witness (main supervisor):
Name: Professor Hj. Zainal Arifin b. Hj. Ahmad
Date:

iii
Acknowledgement
Praise to Allah, the Cherisher and Sustainer of the worlds, for making this thesis a
reality. I wish to express my gratitude to my main supervisor, Prof. Dr. Hj. Zainal
Arifin Hj. Ahmad, for the inspiration, motivation and professionally guiding me to
successfully complete my research work. I would like to also thank him for
providing me with outstanding research facilities and numerous technical discussions
which I found to be very valuable to my research. His constant enthusiasm and
insightfulness will be a model for my career. I would like to express my great
appreciation to Prof. Dr. Mani Maran a/l Ratnam for his contribution on the co-
supervision and valuable suggestions for this research and thesis. I would also like to
thank Assoc. Prof. Dr. Hasmaliza Mohamad for her co-supervision in my research.
Next, I would like to convey my special thanks to dean, Professor Ahmad Fauzi b.
Mohd Noor, Deputy Deans, lecturers and all staffs of the School of Materials and
Mineral Resources Engineering, Universiti Sains Malaysia (USM), for their kind
assistant and supports. Without their kind cooperation, this study may not be
completed on time. I gratefully acknowledge the USM Fellowship Scheme for their
sponsorship throughout my study. My gratitude to Mr. Abdul Rashid, Mr. Mohd.
Shahid, Mr. Khairi, Mr. Mokhtar, Mr. Farid, and Mr. Sharul Ami for their
experimental and technical assistant. My time in USM wouldn’t be pleasant without
accompany of friends and colleagues; Dr. Azam, Dr. Zaky, Dr. Warikh, Dr. Shah
Rizal, Dr. Farhad, Dr. Hazman, Dr. Saidatul Akma, Dr. Banjuraizah, Dr. Al-Amin,
Dr. Hazman, Dr. Julie, Dr. Nor Azam, Dr. Norazharudin, Mohdarif, Nik Akmar, Md
Nor, Fahmin, Azwadi, Johari, Faris and Rashid. I would like to thank my beloved
wife, Nurdina Abd Kadir, for her endless love and support for encouraging me in all
my efforts to this day. Lastly, my special and deepest appreciation and thanks go to

iv
both my parents, Ahmad Azhar Mohamad and Norul Aini Ishak. Their constant
support, encouragement gives warmth and strength to me. They always are there to
share my success as well during sad and down time. Their inspiration, understanding,
patience and support help me to complete this thesis and no words are adequate to
express my appreciation to both of them.

v
Dedication
This thesis is dedicated to my mother, my father, my wife and my child.

vi
Table of contents
Author’s declaration ..................................................................................................... ii
Acknowledgement....................................................................................................... iii
Dedication .................................................................................................................... v
Table of contents ......................................................................................................... vi
List of Figures ............................................................................................................ xii
List of symbols ........................................................................................................... xx
List of abbreviations .................................................................................................. xxi
ABSTRAK ............................................................................................................... xxii
ABSTRACT ............................................................................................................ xxiv
CHAPTER 1 ................................................................................................................ 1
INTRODUCTION ....................................................................................................... 1
1.1 Research background ........................................................................................ 1
1.2 Problem statement ......................................................................................... 4
1.3 Research objectives ....................................................................................... 6
1.4 Project approach ............................................................................................ 6
CHAPTER 2 ................................................................................................................ 8
LITERATURE REVIEW............................................................................................. 8
2.1 Ceramic cutting insert ................................................................................... 8
2.2 Al2O3 as a cutting insert ................................................................................ 9
2.3 Disadvantages of Al2O3 as a cutting insert .................................................... 9
2.4 Yttria stabilized zirconia (YSZ) .................................................................. 10
2.5 Zirconia toughened Al2O3 (ZTA) ................................................................ 11
2.6 Fabrication method ...................................................................................... 13
2.6.1 Sintering ............................................................................................... 14
2.7 Effect of additives ....................................................................................... 16
2.7.1 Effect of MgO addition to Al2O3 ......................................................... 16
2.7.2 Effect of Cr2O3 addition to Al2O3 ........................................................ 19
2.8 Effect of particle size and grain size on mechanical properties .................. 23
2.9 Effect of mechanical properties on tool wear .............................................. 24
2.10 Characterizations ......................................................................................... 29

vii
2.10.1 Tool wear .......................................................................................... 29
2.10.2 Vickers hardness and fracture toughness ......................................... 31
2.10.3 Microstructural observation ............................................................. 38
2.10.4 Effect of microstructure on mechanical properties .......................... 42
2.10.5 Bulk density and shrinkage .............................................................. 43
2.10.6 X-ray diffraction................................................................................ 47
2.11 Summary ..................................................................................................... 51
CHAPTER 3 .............................................................................................................. 52
MATERIALS AND METHODOLOGY ................................................................... 52
3.1 Experimental Design ................................................................................... 52
3.2 Part 1: Effect of MgO addition on mechanical properties, microstructure
and tool wear of ZTA cutting insert ....................................................................... 56
3.2.1 Calculations .......................................................................................... 56
3.2.2 Mixing .................................................................................................. 57
3.2.3 Compaction .......................................................................................... 57
3.2.4 Sintering ............................................................................................... 58
3.2.6 Shrinkage analysis ................................................................................ 59
3.2.7 Bulk density and porosity measurement .............................................. 59
3.2.8 Vickers hardness and fracture toughness ............................................. 60
3.2.9 Microstructural observation ................................................................. 61
3.2.10 Machining ............................................................................................ 62
3.2.11 Tool wear measurement ....................................................................... 63
3.3 Part 2: Effect of MgO particle size on the mechanical properties,
microstructure and tool wear of ZTA cutting insert. .............................................. 64
3.3.1 Calculations .......................................................................................... 64
3.3.2 Mixing .................................................................................................. 64
3.3.3 Compaction .......................................................................................... 65
3.3.4 Sintering ............................................................................................... 65
3.3.5 Characterization method ...................................................................... 65
3.4 Part 3: Effect of Cr2O3 addition on the mechanical properties,
microstructure and tool wear of ZTA and ZTA-MgO ceramic composite ............ 66
3.4.1 Calculations .......................................................................................... 66
3.4.2 Sample preparation............................................................................... 67
3.4.3 Characterization method ...................................................................... 67

viii
CHAPTER 4 .............................................................................................................. 68
RESULT AND DISCUSSION .................................................................................. 68
4.1 Introduction ................................................................................................. 68
4.2 Characterization of starting materials .......................................................... 68
4.2.1 Al2O3 .................................................................................................... 68
4.2.2 YSZ ...................................................................................................... 70
4.2.3 MgO ..................................................................................................... 73
4.2.4 Cr2O3 .................................................................................................... 74
4.3 Part 1: Results and discussions on the effect of MgO addition on the
mechanical properties, microstructures and tool wear of ZTA cutting insert. ....... 76
4.3.1 XRD ..................................................................................................... 76
4.3.2 Microstructural observation, shrinkage analysis, bulk density,
percentage of porosity, Vickers hardness and fracture toughness. ..................... 80
4.2.3 Tool wear measurement ....................................................................... 91
4.2.4 Summary .............................................................................................. 97
4.4 Part 2: Results and discussions on the effect of MgO particle sizes on the
mechanical properties, microstructures and tool wear of ZTA cutting insert. ....... 97
4.4.1 XRD ..................................................................................................... 97
4.4.2 Microstructural observation, shrinkage analysis, bulk density,
percentage of porosity, Vickers hardness and fracture toughness. ................... 102
4.4.3 Tool wear measurement ..................................................................... 116
4.4.4 Summary ............................................................................................ 122
4.5 Part 3: Results and discussions on the effect of Cr2O3 addition on the
mechanical properties, microstructures and tool wear of ZTA and ZTA-20 nm
MgO cutting insert. ............................................................................................... 123
4.5.1 Introduction ........................................................................................ 123
4.5.2 Macro observation .............................................................................. 123
4.5.3 XRD ................................................................................................... 124
4.5.4 Microstructural observation, shrinkage analysis, bulk density,
percentage of porosity, Vickers hardness and fracture toughness. ................... 130
4.5.5 Tool wear measurement ..................................................................... 143
4.5.6 Summary ............................................................................................ 151
CHAPTER 5 ............................................................................................................ 153
CONCLUSION AND FUTURE RECOMMENDATION ...................................... 153
5.1 Conclusion ................................................................................................. 153

ix
5.2 Future recommendations ........................................................................... 154
REFERENCES ......................................................................................................... 156
APPENDICES

x
List of Tables
Table 2.1: Mechanical properties of Al2O3 (Al-Naib, 2000). ..................................... 9
Table 2.2: Summary of mechanical properties of Al2O3 contain different
amount of Cr2O3 (Riu et al., 2000). ......................................................... 21
Table 2.3: Properties of Al2O3-Ag2O composites (Dutta et al., 2006). ..................... 26
Table 2.4: Properties of the studied dense ceramics (Medvedovski, 2001) .............. 27
Table 2.5: Summarize result for VB max for various ceramics inserts
(D`Erico et al., 1999). .............................................................................. 29
Table 2.6: Vickers Hardness for ceramic cutting inserts (D’ Errico et al.,
1999) ........................................................................................................ 32
Table 2.7: Sintering profiles used by Smuk et al. (2003) for mechanical
characterizations (Smuk et al., 2003). ...................................................... 33
Table 2.8: Compositions used by Smuk et al. (2003) for mechanical
charactrerization (Smuk et al., 2003). ...................................................... 34
Table 2.9: Vickers hardness and fracture toughness of the sintered samples
(Magnani and Brilliante, 2005) ................................................................ 37
Table 2.10: Results of grain size for YSZ-Al2O3 at different compositions
(Cesari et al., 2006). ................................................................................. 39
Table 2.11: Al2O3 grain sizes for Al2O3-MgO system with 4.0 wt % Cr2O3
addition (Sarkar et al., 2002) .................................................................... 41
Table 2.12: Grain size, relative density, Vickers hardness and fracture
toughness of pure Al2O3 samples sintered at 1500 oC (Maiti and
Sil, 2010). ................................................................................................. 44
Table 2.13: Densities and shrinkage of the Al2O3–MgO ceramics with
different MgO contents (Rittidech et al., 2006) ....................................... 45
Table 2.14: Unit cell parameter for a and c for Al2O3 with the addition of
Cr2O3 (Bondioli et al., 2000). ................................................................... 49
Table 3.1: Raw materials used in current study. ....................................................... 52
Table 3.2: Formulations used in Part 1...................................................................... 57
Table 3.3: Cutting parameter for using ceramic cutting insert .................................. 62

xi
Table 3.4: Physical and mechanical properties of the workpiece, stainless
steel 316L ................................................................................................. 62
Table 3.5: Formulations used in Part 2...................................................................... 65
Table 3.6: Formulations used for ZTA samples. ....................................................... 67
Table 3.7: Formulations used for ZTA-MgO samples .............................................. 67
Table 4.1: Elemental quantitative analysis on the YSZ particles .............................. 72
Table 4.2: Particle sizes for MgO used in current study. .......................................... 73
Table 4.3: Shrinkage result for ZTA sample with different wt % and different
particle sizes of MgO. ............................................................................ 109
Table 4.4: Unit cell dimensions of Al2O3 with different Cr2O3 wt %. ................. 126
xii
List of Figures
Fig. 1.1: Relationship between cutting speed and tool life for typical
materials for cutting insert application (Kalpakjian and Schmid,
2009). ......................................................................................................... 2
Fig. 1.2: Relationship between temperature and hardness for typical
materials for cutting insert (Kalpakjian and Schmid, 2009). ..................... 3
Fig. 2.1: Grain structure of zirconium oxide (light grey) in aluminium oxide
(dark-grey). The horizontal bar has a length of 1 micron (Casellas
et al., 1999). ............................................................................................. 12
Fig. 2.2: Micrograph for (a) monolithic Al2O3 and (b) 80 wt % Al2O3/20 %
YSZ (Azhar et al., 2009). ......................................................................... 13
Fig. 2.3: Stages of sintering (a) free particles, (b) necking between particles,
(c) formation of grain boundary, and (d) densification process and
pores elimination (Randal, 1991). ............................................................ 15
Fig. 2.4: Densification of Al2O3 compacts with and without MgO additives.
TSI stands for tons per square inch (Coble, 1961). .................................. 16
Fig. 2.5: Grain growth in Al2O3 compacts with temperature, forming
pressure and magnesia additives as variables (Coble, 1961). ................. 17
Fig. 2.6: Phase diagram of the system MgO–Al2O3 (Sarkar and Banerjee,
1999). ........................................................................................................ 18
Fig. 2.7: Morphologies of Al2O3 specimens hot pressed at 1500°C for 1 h
containing (A) 0 mol%, (B) 2 mol%, (C) 5 mol%, and (D) 10
mol% of Cr2O3 (Riu et al., 2000). ............................................................ 20
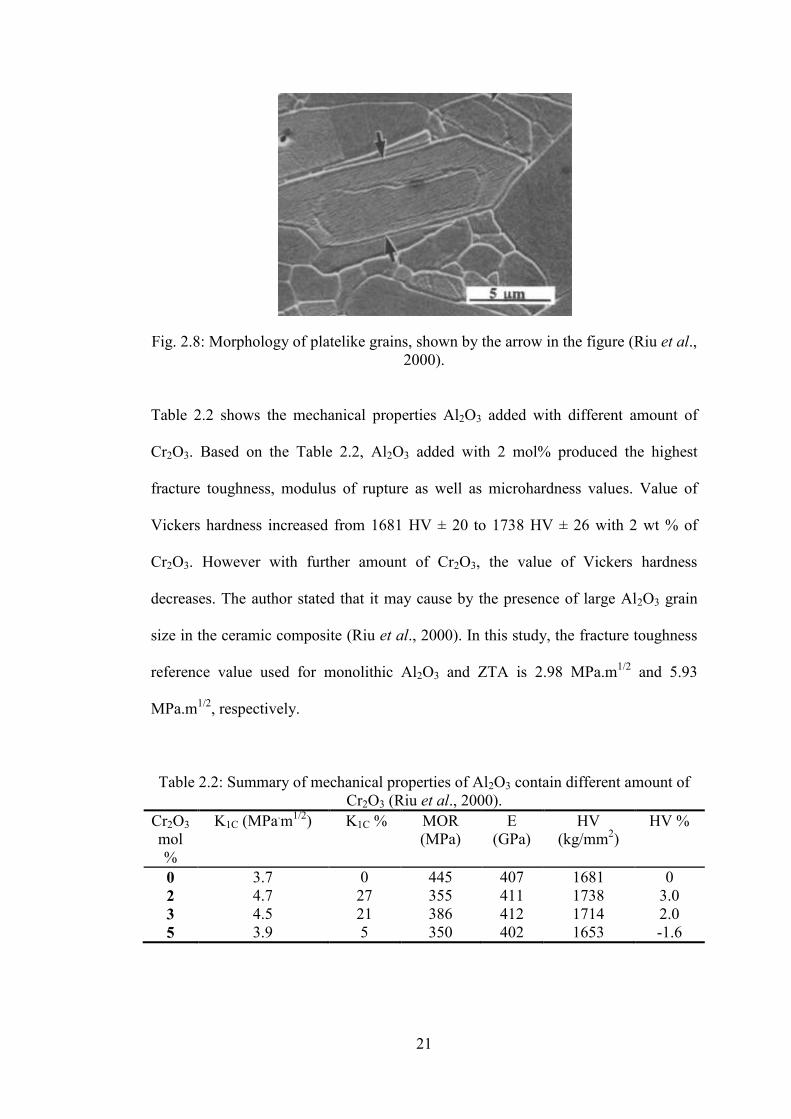
Fig. 2.8: Morphology of platelike grains, shown by the arrow in the figure
(Riu et al., 2000). ..................................................................................... 21
Fig. 2.9: Phase relationship between Al2O3-Cr2O3 (Hirata et al., 2000). ............... 22
Fig. 2.10: Flank wear with machining time (Dutta et al., 2006). ............................. 26
Fig. 2.11: Wear pattern observed during turning process for ceramic cutting
insert (a) primary edge breakage, (b) chipping, (c) edge breakage,
(d) notch wear, © chip hammering and (f) flank wear (Cantero et
al., 2013). ................................................................................................. 28
Fig. 2.12: Schematics of the insert wear measurement system (Shahabi and
Ratnam, 2008) .......................................................................................... 30

xiii
Fig. 2.13: (a) Unworn cutting insert tip, (b) worn cutting insert tip after
machining, and (c) tool wear (Shahabi and Ratnam, 2008). .................... 31
Fig. 2.14: Vickers hardness of the Al2O3–MgO ceramics with variation of
MgO contents (Rittidech et al., 2006) ...................................................... 32
Fig. 2.15: Result for Vickers hardness under different sintering temperature
and different compositions (Smuk et al., 2003). ...................................... 33
Fig. 2.16: Vickers hardness of Al2O3-5 vol % SiC nanocomposite as a
function of MgO content when sintered at 1650 oC for 2 hours in
argon atmosphere (Wang et al., 1998). .................................................... 34
Fig. 2.17: Result for fracture toughness under different sintering temperature
and different compositions (Smuk et al., 2003). ...................................... 36
Fig. 2.18: Configurations of the Palmqvist cracks for the Vickers hardness
indentation, a is half of the indent diagonal and l is length of the
crack (Smuk et al., 2003). ........................................................................ 38
Fig. 2.19: Microstructure of: (a) Al2O3 ceramics with 30 mass% of stabilized
ZrO2 (b) standard Al2O3 ceramics SN80 (Smuk et al., 2003) .................. 39
Fig. 2.20: SEM micrographs showing microstructural evolution in ZTA (a)
as-sintered, and (b) heat treated at 1600 oC for 30 h (Casellas et
al., 2003). ................................................................................................. 40
Fig. 2.21: SEM micrographs of as-received of Al2O3 –MgO ceramics with
different MgO contents at (a) 0 wt.%, (b) 0.05 wt.% (c) 0.10 wt.%,
(d) 0.30 wt.%, © 0.50 wt.%, and (f) 0.70 wt.%, respectively
(Rittidech et al., 2006). ............................................................................ 41
Fig. 2.22: Micrograph of Al2O3-MgO system with 4.0 wt % Cr2O3 addition,
(a) 71.67 wt % Al2O3, 28.33 wt % MgO, (b) 55.78 wt % Al2O3,
44.22 wt % MgO, and (c) 83.49 wt % Al2O3, 16.51 wt % MgO
(Sarkar et al., 2002). ................................................................................. 42
Fig. 2.23: EDX analysis on ZTA sample sintered at 1700 oC (a) Al2O3–5
wt% ZrO2 and (b) Al2O3–5 wt% ZrO2–1000 ppm Y(NO3)3.6H2O
(Maiti and Sil, 2011). ............................................................................... 43
Fig. 2.24: SEM micrograph of Al2O3 sintered at 1500 oC for (a) 3 h, (b) 6 h,
(c) 18 h and (d) 24 h (Maiti and Sil, 2010). ............................................. 44
Fig. 2.25: Sintered density of Al2O3-5 vol % SiC nanocomposite as a
function of MgO content when sintered at 1650 oC for 2 hours in
argon atmosphere (Wang et al., 1998). .................................................... 46

xiv
Fig. 2.26: Relationship between relative densities of Al2O3-Cr2O3 with
sintering temperature (Hirata et al., 2000). .............................................. 46
Fig. 2.27: Result of percentage of shrinkage with Cr2O3 addition for (a)
71.67 wt % Al2O3, 28.33 wt % MgO, (b) 55.78 wt % Al2O3, 44.22
wt % MgO, and (c) 83.49 wt % Al2O3, 16.51 wt % MgO (Sarkar
et al., 2002). ............................................................................................. 47
Fig. 2.28: XRD for (a) ZrO2, and (b) YSZ (Smuk et al., 2003). ............................... 48
Fig. 2.29: XRD patterns of (012) peak of solid solutions with (a)10, (b) 30,
(c) 50, (d) 90 wt% of chromium oxide, (E) eskolaite, and (C)
corundum (Bondioli et al., 2000). ............................................................ 49
Fig. 2.30: Comparison of XRD pattern for MgO-2 wt % nano and micro-
Cr2O3 samples sintered at 1450 oC for 5 hours (Zargar et al.,
2012). ....................................................................................................... 50
Fig. 2.31: XRD scans of Ti/Ti-B composite with different reinforcement
composite particle sizes (Patel et al., 2009). ............................................ 51
Fig. 3.1: Flowchart for Part 1 (To study the effect of MgO additives on the
mechanical properties of ZTA ceramic composite). ................................ 53
Fig. 3.2: Flowchart for Part 2 (To study the effect of MgO particles sizes on
the mechanical properties of ZTA ceramic composite). .......................... 54
Fig. 3.3: Flowchart for Part 3 (To study the effect of Cr2O3 additives on the
mechanical properties of ZTA and ZTA-MgO ceramic composite). ....... 55
Fig. 3.4: Dimension of the die used to produce samples for tool wear
measurement. All value is in mm. ............................................................ 58
Fig. 3.5: Sintering profile used to sinter the green body. ....................................... 58
Fig. 3.6: Indentation schematic for Vickers hardness test. ..................................... 60
Fig. 3.7: Typical crack configuration for determination of fracture
toughness a is half of the indent length and c stand for the crack
length. ....................................................................................................... 61
Fig. 3.8: Heating profile used for thermal etching. ................................................ 62
Fig. 3.9: The flowchart of steps in order to obtain results of tool wear. ................ 63
Fig. 3.10: Print screen of the software used to subtract image of cutting insert
before and after machining and calculate tool wear. ................................ 64

xv
Fig. 4.1: Result of particles size analysis for Al2O3 particles. ................................ 69
Fig. 4.2: Physical appearance of Al2O3 particles (a) magnification 5000 X,
(b) magnification 20 000 X. ..................................................................... 69
Fig. 4.3: XRD result for Al2O3 particles, ICDD reference 10-0173. ...................... 70
Fig. 4.4: Results of particle size for YSZ particles. ................................................ 70
Fig. 4.5: Physical appearance of YSZ particles (a) magnification 5000 X,
(b) magnification 20 000 X. ..................................................................... 71
Fig. 4.6: EDX characterizations of YSZ particles. ................................................. 72
Fig. 4.7: XRD results for YSZ powders, ICDD reference file for tetragonal
(red lines) and monoclinic (blue lines) are 89-9068 and 78-1807
respectively. ............................................................................................. 72
Fig. 4.8: Results for particles size for nano-MgO. ................................................. 73
Fig. 4.9: XRD results for MgO nano particles, which (s) is MgO with
ICDD reference 98-005-3326 and (o) is brucite with ICDD
reference 98-004-4736. ............................................................................ 74
Fig. 4.10: XRD diffractions for MgO with different particle sizes. ......................... 75
Fig. 4.11: Results of particle size for Cr2O3. ............................................................ 75
Fig. 4.12: XRD results for Cr2O3 powder, ICDD reference 01-082-1484 ................ 75
Fig. 4.13: Morphology of Cr2O3 particles. ............................................................... 76
Fig. 4.14: XRD result for ZTA+ 0.7 MgO wt % after sintering process. ................. 77
Fig. 4.15: XRD diffraction for ZTA with 0 wt % MgO for (a) before
sintering, and (b) after sintering. .............................................................. 78
Fig. 4.16: Result of XRD analysis on ZTA–MgO sintered body with
different MgO wt%. Peak shown is for (111), MgAl2O4 (ICDD
01-073-1959) ............................................................................................ 79
Fig. 4.17: Quantitative elemental analysis on the sample for (a) YSZ and (b)
Al2O3. ....................................................................................................... 81
Fig. 4.18: Microstructural images of the samples surface (a) 0 wt% MgO, (b)
0.3 wt% MgO, (c) 0.5 wt% MgO, (d) 0.7 wt% MgO, (e) 0.9 wt%
MgO, and (f) 1.0 wt% MgO. .................................................................... 82

xvi
Fig. 4.19: NL values for Al2O3 grains with different MgO wt %. ............................ 83
Fig. 4.20: Result of shrinkage of ZTA with different MgO wt %. ........................... 84
Fig. 4.21: Result of density and percentage of porosity for ZTA with
different MgO wt %. ................................................................................ 86
Fig. 4.22: Result of Vickers hardness for ZTA as a function of MgO wt %. ........... 88
Fig. 4.23: Result of fracture toughness as a function of MgO wt%. ........................ 89
Fig. 4.24: Images of cutting inserts (a) unworn, (b) example of a worn
cutting insert (c) 0 wt %, (d) 0.1 wt %, (e) 0.2 wt %, and (f) 0.5 wt
%. ............................................................................................................. 92
Fig. 4.25: Result of tool wear for ZTA cutting insert at various addition of
MgO wt % ................................................................................................ 93
Fig. 4.26: Result of flank wear for ZTA cutting insert at various addition of
MgO wt % ................................................................................................ 93
Fig. 4.27: Relationship between bulk density and tool wear for ZTA-MgO
cutting insert. ............................................................................................ 94
Fig. 4.28: Relationship between Vickers hardness and tool wear for ZTA-
MgO cutting insert. .................................................................................. 95
Fig. 4.29: Relationship between fracture toughness and tool wear for ZTA-
MgO cutting insert. .................................................................................. 96
Fig. 4.30: Result of XRD analysis on ZTA–20 nm MgO sintered body with
different MgO wt%. Peak shown is for (111), MgAl2O4 (ICDD
01-073-1959) ............................................................................................ 99
Fig. 4.31: Result of XRD analysis on ZTA–500 nm MgO sintered body with
different MgO wt%. Peak shown is for (111), MgAl2O4 (ICDD
01-073-1959) .......................................................................................... 100
Fig. 4. 32: Result of XRD analysis on ZTA–7000 nm MgO sintered body
with different MgO wt%. Peak shown is for (111), MgAl2O4
(ICDD 01-073-1959) .............................................................................. 101
Fig. 4.33: FESEM microstructural images for ZTA- 0.9 MgO wt % ; (a) 20
nm MgO (NL = 2.54 grain/µm), (b) 100 nm MgO (NL = 2.21
grain/µm), (c) 500 nm MgO (NL = 1.27 grain/µm) and (d) 7000
nm (NL = 0.51 grain/µm). ...................................................................... 103

xvii
Fig. 4.34: NL values for Al2O3 grain for ZTA with different particle sizes of
MgO. ...................................................................................................... 104
Fig. 4.35: FESEM microstructural images for ZTA- 20 nm MgO as additives
(a) 0.3 wt % MgO, (b) 0.5 wt % MgO, (c) 0.7 wt % MgO, (d) 0.9
wt % MgO, (e) 1.1 wt % MgO and (f) 1.3 wt % MgO. All
micrograph is taken with 5000 X magnification. ................................... 105
Fig. 4.36: FESEM microstructural images for ZTA-100 nm MgO as
additives (a) 0.3 wt % MgO, (b) 0.5 wt % MgO, (c) 0.6 wt %
MgO, (d) 0.7 wt % MgO, (e) 0.8 wt % MgO and (f) 0.9 wt %
MgO. All micrograph is taken with 5000 X magnification. .................. 106
Fig. 4.37: FESEM microstructural images for ZTA-500 nm MgO as
additives (a) 0.3 wt % MgO, (b) 0.5 wt % MgO, (c) 0.6 wt %
MgO, (d) 0.7 wt % MgO, (e) 0.8 wt % MgO and (f) 0.9 wt %
MgO. All micrograph is taken with 5000 X magnification. .................. 107
Fig. 4.38: FESEM microstructural images for ZTA-7000 nm MgO as
additives (a) 0.3 wt % MgO, (b) 0.5 wt % MgO, (c) 0.7 wt %
MgO, (d) 0.5 wt % MgO and (e) 0.8 wt % MgO and (f) 0.9 wt %
MgO. All micrograph is taken with 5000 X magnification. .................. 108
Fig. 4.39: Result of bulk densities as a function of MgO wt % with different
particles sizes. ........................................................................................ 110
Fig. 4.40: Percentage of porosity for ZTA samples with different particle
sizes and composition. ........................................................................... 112
Fig. 4.41: Result of Vickers hardness as a function of MgO wt % with
different particle sizes. ........................................................................... 114
Fig. 4.42: Result of fracture toughness as a function of MgO wt % with
different particle sizes. ........................................................................... 116
Fig. 4.43: Images of ZTA-MgO cutting inserts different particle sizes (a)
before machining, (b) after machining, (c) 20 nm, (d) 100 nm, (e)
500 nm, and (f) 7000 nm. ....................................................................... 117
Fig. 4.44: Tool wear after machining stainless steel 316L for cutting insert
with different particle sizes. Amount of MgO was fixed at 0.3 wt
%. ........................................................................................................... 119
Fig. 4.45: Flank wear after machining stainless steel 316L for cutting insert
with different particle sizes. Amount of MgO was fixed at 0.3 wt
%. ........................................................................................................... 119

xviii
Fig. 4.46: Relationship between bulk density and tool wear for ZTA-MgO
cutting insert with different particles sizes. Amount of MgO was
fixed to 0.3 wt %. ................................................................................... 120
Fig. 4.47: Relationship between Vickers hardness and tool wear for ZTA-
MgO cutting insert with different particles sizes. Amount of MgO
was fixed to 0.3 wt %. ............................................................................ 121
Fig. 4.48: Relationship between fracture toughness and tool wear for ZTA-
MgO cutting insert with different particles sizes. Amount of MgO
was fixed to 0.3 wt %. ............................................................................ 122
Fig. 4.49: Sintered samples of (a) ZTA-0.6 wt % Cr2O3, and (b) ZTA-20 nm
MgO-0.6 wt % Cr2O3. ............................................................................ 123
Fig. 4.50: XRD analysis for ZTA-0.6 wt % Cr2O3. ................................................ 125
Fig. 4.51: XRD patterns of (012) peak of pure Al2O3, ZTA with different
Cr2O3 content and pure Cr2O3. ............................................................... 126
Fig. 4.52: Comparison of XRD results for ZTA samples with various Cr2O3
wt %. ...................................................................................................... 127
Fig. 4.53: XRD results of addition of 1.0 % Cr2O3 into ZTA-20 nm MgO
cutting insert. .......................................................................................... 128
Fig. 4.54: Comparison of XRD results for ZTA-MgO samples with various
Cr2O3 wt %. ............................................................................................ 129
Fig. 4.55: Microstructural images of ZTA-Cr2O3 cutting inserts with addition
of (a) 0 wt% Cr2O3, (b) 0.2 wt% Cr2O3, (c) 0.3 wt% Cr2O3, (d) 0.5
wt% of Cr2O3, (e) 0.6 wt% of Cr2O3 (arrow indicated platelike
grain) and (f) 0.7 wt% of Cr2O3. All micrograph were taken with
5000 X magnification. ............................................................................ 131
Fig. 4.56: Number of Al2O3 grain interception per unit length for ZTA
samples with different Cr2O3 wt %. ....................................................... 132
Fig. 4.57: EDX results for ZTA-samples which containing 0.8wt% Cr2O3. .......... 133
Fig. 4.58: Microstructural images of ZTA-MgO-Cr2O3 samples with addition
of (a) 0.4 wt% Cr2O3, (b) 0.6 wt% Cr2O3, and (c) 0.8 wt% Cr2O3. ......... 134
Fig. 4.59: Number of Al2O3 grain interception per unit length for ZTA-MgO
samples with different Cr2O3 wt %. ....................................................... 135

xix
Fig. 4.60: EDX results for ZTA-20 nm MgO samples which containing
0.4wt% of Cr2O3. .................................................................................... 136
Fig. 4.61: Result of shrinkage of ZTA and ZTA-MgO samples with various
Cr2O3 wt % after sintering. ..................................................................... 137
Fig. 4.62: Result of bulk density for ZTA–Cr2O3 and ZTA- Cr2O3-20nm
MgO cutting inserts with different Cr2O3 content.................................. 138
Fig. 4.63: Percentage of porosity for ZTA–Cr2O3 and ZTA- Cr2O3-20nm
MgO cutting inserts with different Cr2O3 content.................................. 139
Fig. 4.64: Vickers hardness of ZTA and ZTA-20 nm MgO samples as a
function of Cr2O3 wt%. ........................................................................... 141
Fig. 4.65: Fracture toughness of ZTA and ZTA-20 nm MgO samples as a
function of Cr2O3 wt%. ........................................................................... 142
Fig. 4.66: Images of cutting inserts (a) unworn, (b) example of a worn
cutting insert, (c) ZTA-20 nm MgO-0.6 Cr2O3 wt%, and (d) ZTA-
0.6 Cr2O3 wt%. ....................................................................................... 144
Fig. 4.67: Result of tool wear for ZTA and ZTA-10 nm MgO cutting insert
with different Cr2O3 wt %. ..................................................................... 145
Fig. 4.68: Flank wear measurement for ZTA and ZTA-20 nm MgO cutting
insert with the addition of 0.6 wt % of Cr2O3. ....................................... 145
Fig. 4.69: Tool wear of ZTA-20 nm MgO-Cr2O3 cutting insert at different
machining speed. .................................................................................... 148
Fig. 4.70: Relationship between bulk density and tool wear for ZTA and
ZTA-20 nm MgO cutting insert. ............................................................ 149
Fig. 4.71: Relationship between Vickers hardness and tool wear for ZTA and
ZTA-20 nm MgO cutting insert. ............................................................ 151
Fig. 4.72: Relationship between fracture toughness and tool wear for ZTA
and ZTA-20 nm MgO cutting insert. ..................................................... 151

xx
List of symbols
a - Half of the indentation diagonal length
a - Lattice parameter a
c - Lattice parameter c
d50 - Mean diameter
E - Modulus Young
HV - Vickers hardness
K1c - Fracture toughness
l - Length of the radiant crack
li - Initial length of sample
lf - Final length of sample
(t) - Tetragonal phase
(m) - Monoclinic phase
ρb - Bulk density
NL - Number of grains intercept per unit length

xxi
List of abbreviations
ASTM - American Standard for Testing Materials
BUE - Build up edge
EDX - Energy Dispersive X-ray
FESEM - Field Emission Scanning Electron Microscope
ICDD - International Centre for Diffraction Data
ISO - International Standard Organization
MPa - Mega Pascal
MOR - Modulus of rupture
HV - Vickers hardness
SEM - Scanning Microscope Electron
TSI - Tonne per square inch
TEM - Transmission Electron Microscope
XRD - X-ray diffraction
YSZ - Yttria stabilized zirconia
ZTA - Zirconia toughened alumina

xxii
SINTESIS DAN PENCIRIAN BAHAN ALAT PEMOTONG MgO-Cr2O3-ZTA
ABSTRAK
Dalam kajian ini, kesan penambahan MgO dan Cr2O3 terhadap mikrostruktur dan
ciri-ciri mekanikal komposit seramik ZTA telah dikaji. Pelbagai amaun MgO dan
Cr2O3 ditambah ke dalam ZTA secara berasingan. Bahan mula dicampur berterusan
selama 8 jam dan kemudiannya dipadatkan secara hidraulik pada 300 MPa. Sampel-
sampel yang telah dipadatkan di sinter pada 1600 oC selama 4 jam. Terdapat tiga
bahagian dalam kajian ini. Bahagian pertama terdiri dari penambahan MgO ke dalam
ZTA. Bahagian kedua difokuskan kepada kesan saiz partikel MgO terhadap sifat-
sifat mekanikal dan bahagian ketiga difokuskan terhadap kesan penambahan Cr2O3
terhadap sistem ZTA and ZTA-20 nm MgO. Untuk bahagian pertama, keputusan
menunjukkan penambahan 0.7 wt % MgO bersaiz 100nm menghasilkan kekerasan
Vickers tertinggi (1710HV). Keliatan patah berkurang secara berterusan dari 5.93
MPa.m1/2
kepada 3.79 MPa.m1/2
dengan penambahan sebanyak 1.0 MgO wt %.
Keterlarutan pepejal MgO di dalam ZTA dianggarkan sebanyak 203 ppm. Tiada
mekanisme baru yang ditemui dengan penambahan MgO ke dalam ZTA.
Pemerhatian terhadap mikrostruktur menunjukkan nilai NL untuk saiz butir sangat
bergantung kepada amaun MgO yang ditambah. Nilai NL meningkat dari 0.68
butir/µm to 2.21 butir/µm dengan penambahan 0.7 wt % MgO. Peningkatan
kekerasan Vickers disebabkan oleh kesan pin mikrostruktur oleh MgO. Dalam
pengukuran kehausan mata alat, peningkatan sebanyak 30 % ditunjukkan oleh
sampel ZTA dengan 0.3 MgO wt %. Untuk bahagian kedua, saiz partikel MgO
dipelbagai dari 20 nm hingga 7000 nm. Pemerhatian menunjukkan MgO dengan saiz
yang lebih halus akan meningkatkan kecekapan kesan pin; satu kelebihan yang
ditunjukkan oleh MgO. Sampel ZTA dengan bahan tambah 20 nm MgO mempunyai
saiz butir Al2O3 yang halus (2.50 grains/µm) berbanding dengan ZTA dengan 100
nm MgO (2.21 grains/µm), 500 nm MgO (1.27 grains/µm) dan 7000 nm MgO (0.81
grains/µm). Saiz butir ZTA dengan 20 nm MgO yang halus menyebabkan kekerasan
Vickers yang tinggi (1740HV) tetapi keliatan patah 3.62 MPa.m1/2
. Pembentukan
MgAl2O4 dikesan pada pelbagai komposisi MgO untuk setiap saiz partikel, dimana
1.1 wt % untuk 20 nm MgO, 0.7 wt % untuk 100 nm MgO, 0.6 wt % untuk 500 nm
MgO untuk 0.5 wt % for 7000 nm MgO. Pengukuran mata alat menunjukkan sampel
ZTA dengan 20 nm MgO menunjukkan peningkatan sebanyak 54.8 % berbanding

xxiii
sampel ZTA dengan 100 nm MgO. Untuk bahagian ketiga, amaun Cr2O3 dari 0 wt %
- 1.0 wt % diperkenalkan kepada dua sistem berbeza; ZTA dan ZTA dengan 20 nm
1.1 wt % MgO. Sampel ZTA dengan penambahan 0.6 wt % menghasilkan kekerasan
Vickers setinggi 1683 HV dan keliatan patah 7.05 MPa.m1/2
. Peningkatan kekerasan
Vickers disebabkan oleh penambahan Cr2O3, yang mana mempunyai kekerasan yang
lebih tinggi dari ZTA. Peningkatan keliatan patah disebabkkan oleh saiz butir Al2O3
yang besar dan kehilangan fasa monoklinik di dalam YSZ. Berdasarkan kepada
analisis XRD, tiada pembentukan fasa baru terhasil dengan penambahan Cr2O3
memandangkan kedua-dua Cr2O3 dan Al2O3 adalah dalam keterlarutan pepejal
sepenuhnya. Nilai NL untuk sampel ZTA berkurangan dengan penambahan 0.6 wt %
Cr2O3 dari 1.30 butir/µm kepada 0.78 butir/µm. Sampel ZTA-20 nm MgO-Cr2O3
mempunyai kekerasan Vickers yang lebih tinggi (1693HV) dan kehausan mata alat
yang lebih rendah (0.015 mm2) berbanding kepada ZTA-Cr2O3 (1683 HV and 0.0190
mm2). Keputusan pengukuran kehausan mata alat menunjukkan sampel ZTA-20nm
MgO-Cr2O3 mempunyai peningkatan sebanyak 25 % berbanding sampel ZTA-Cr2O3.
Keseluruhannya, sampel ZTA-1.1 wt % 20 nm MgO-0.6 wt % Cr2O3 adalah
komposisi terbaik untuk aplikasi mata alat.

xxiv
SYNTHESIS AND CHARACTERIZATION OF MgO-Cr2O3-ZTA CUTTING
TOOL MATERIAL
ABSTRACT
The effect of MgO and Cr2O3 addition on the microstructure and mechanical
properties of ZTA ceramic composite were investigated in this study. Various
amounts of MgO and Cr2O3 were added into ZTA separately. The starting materials
was mixed continuously for 8 hours and subsequently hydraulically pressed at 300
MPa. The pressed samples were sintered at 1600 oC for 4 hours. There are three parts
in this study. The first part consists of addition of MgO into ZTA. Second part is
focused on the effect of MgO particles sizes on ZTA mechanical properties and the
third part is focused on the effect of adding Cr2O3 on ZTA and ZTA-20 nm MgO.
For the first part, the results show that an addition of 0.7 wt % of 100 nm MgO
produces the highest Vickers hardness (1710 HV). The fracture toughness decreased
gradually from 5.93 MPa.m1/2
to 3.79 MPa.m1/2
with further addition of 1.0 MgO wt
%. MgO solid solubility in ZTA was determined around 203 ppm. No new
mechanism was found with the addition of MgO into ZTA. Microstructural
observations show that the NL value for grain size is significantly dependent on the
amount of MgO addition. The NL value increase from 0.68 grains/µm to 2.21
grains/µm with the addition of 0.7 wt % of 100 nm MgO. The increase of hardness is
due to the small grain size of Al2O3 which is caused by the microstructure pinning
effect by MgO. In tool wear measurement, an improvement of 30 % is shown for
ZTA sample with 0.3 MgO wt %. For the second part, the particle sizes of MgO were
varied from 20 nm to 7000 nm. It was observed that finer size of MgO enhances the
microstructure pinning effect; a feature introduce by MgO. ZTA samples with
additives of 20 nm of MgO were found to have fine Al2O3 grain size (2.50
grains/µm) compared to ZTA with 100 nm MgO (2.21 grains/µm), 500 nm MgO
(1.27 grains/µm) and 7000 nm MgO (0.81 grains/µm). The fine grain of ZTA with
20 nm MgO leads to a high Vickers hardness (1740 HV) but a fracture toughness of
3.62 MPa.m1/2
. Formation of MgAl2O4 was detected at different composition of each
MgO particle sizes, whereas 1.1 wt % for 20 nm MgO, 0.7 wt % for 100 nm MgO,
0.6 wt % for 500 nm MgO and 0.5 wt % for 7000 nm MgO. Tool wear measurement
indicated that ZTA samples with 20 nm MgO shows an increase of 54.8 % compare
to ZTA samples with 100 nm MgO. For the third part of the study, amounts from 0

xxv
wt % - 1.0 wt % of Cr2O3 are introduced into two separate systems: ZTA and ZTA
with 20 nm 1.1 wt % MgO. ZTA samples with the addition of 0.6 wt % of Cr2O3
produced Vickers hardness of 1683HV and fracture toughness of 7.05 MPa.m1/2
. The
increase of Vickers hardness is attributed to the addition of Cr2O3, which has higher
hardness than ZTA. The increase of fracture toughness is due to the large Al2O3 grain
and the loss of monoclinic phase inside YSZ due to the presence of Cr2O3. According
to XRD analysis, no new phase was formed with the addition of Cr2O3 since both
Cr2O3 and Al2O3 are in complete solid solubility with each other. NL values for ZTA
samples decrease with the addition of 0.6 wt % Cr2O3 from 1.30 grains/µm to 0.78
grains/µm. Sample of ZTA-20 nm MgO-Cr2O3 has higher Vickers hardness
(1693HV) and lower tool wear (0.015 mm2) compared to ZTA-Cr2O3 (1683 HV and
0.0190 mm2). Result of tool wear measurement shows that sample of ZTA-20 nm
MgO-Cr2O3 has 35 % of improvement compare to ZTA-Cr2O3. In overall, samples of
ZTA-1.1 wt % 20 nm MgO-0.6 wt % Cr2O3 is the best composition for cutting insert
application.

1
CHAPTER 1
INTRODUCTION
1.1 Research background
Products produce by processes such as casting and forming regularly need additional
process or finishing imparting a detailed characteristic for instance dimensional
accuracy and surface finish. Turning process is one of the alternatives used to
accomplish surface finish and removal of materials.
Extremely hard materials can be machined using cutting insert with high heat and
wear resistant. Furthermore, these cutting insert are also chemically stable at high
temperature. The mentioned features enabled them to machine hard metals at high
cutting speed in dry environment. Another advantage of ceramic cutting insert is that
the tips of these cutting insert does not require cooling liquid to reduce the operating
temperature. New cutting insert with improved performance and properties are
produced with the advancement in the technology of ceramic processing. These new
developed cutting inserts has enabled ceramic cutting insert to machine various types
of metals (Senthil Kumar et al., 2003).
Furthermore, cutting insert with high quality and prolonged life can reduce the cost
for machining. Based on the requirement of prolonged life and high-quality cutting
inserts, cutting inserts made from metal oxides or ceramics offers a wide selection of
materials such as Sialon, Si3N4, Al2O3-based, cemented carbide and zirconia
toughened Al2O3 (ZTA) cutting inserts.

2
Fig. 1.1 shows the relationship between cutting speed and tool life for typical
materials for cutting insert applications. Cutting inserts made from ceramic are able
to perform at higher cutting speed and possess longer tool life compare to other types
of materials (Kalpakjian and Schmid, 2009).
Fig. 1.1: Relationship between cutting speed and tool life for typical materials for
cutting insert application (Kalpakjian and Schmid, 2009).
Besides longer tool life, another advantage of ceramic cutting inserts is their ability
to retain high hardness at higher temperature. During machining process, the friction
between the cutting insert and the workpiece will generate heat. Generating too much
heat will reduce the mechanical properties of the cutting insert thus decreasing the
tool life. Fig. 1.2 shows the relationship between temperature and hardness for
typical materials for cutting insert materials. Cutting insert made from ceramics
shows small reduction of hardness with increasing temperature, compared to other
types of cutting insert.
Cutting Speed (m/min)
Tool
life
(m
in)

3
Fig. 1.2: Relationship between temperature and hardness for typical materials for
cutting insert (Kalpakjian and Schmid, 2009).
Among of the popular candidate for cutting insert application is Al2O3. Al2O3 based
cutting inserts provide good abrasion resistance and its hot hardness is high.
Chemically, cutting inserts made from Al2O3 are more inert than high speed steels
and carbide inserts at elevated temperature. Besides their good mechanical
properties, Al2O3 lack toughness, which makes the insert prematurely fail by
chipping during machining.
Despite their weaknesses, these brittle Al2O3 based cutting insert still can be used in
machining. However, their application is limited. In order to avoid premature failure
or chipping, the lathe or CNC machine selected for machining must have minimum
vibration (< 0.28 mm/sec (RMS)), according to ISO 2372 – Vibration Severity
Standard. Furthermore, these brittle cutting insert should only be use to machine soft
material, such as aluminium metal. Optimization of the cutting force is critical in the

4
application of brittle cutting insert. Thus, the chosen cutting parameter (depth of cut,
cutting speed and feed rate) must result minimum force on the insert.
However, this weakness can be overcome by adding secondary material like Y2O3
stabilized ZrO2 (YSZ). With the introduction of few mechanisms to enhance
toughness, Al2O3 based cutting insert with YSZ reinforcement has proven to be one
of the promising cutting inserts (Kalpakjian and Schmid, 2009).
ZTA ceramic composites have been an interesting subject of research due to its high
fracture toughness (6 – 12 MPa.m1/2
), hardness (~1600 HV), high bulk density (4.1
g/cm3) and chemical stability up until 1650
oC. Previously mentioned properties have
qualified cutting insert made from ZTA ceramic composite suitable for a cutting
insert application (Du et al., 2012; Faga et al., 2012).
1.2 Problem statement
The disadvantages of ZTA is that a portion of Al2O3 is substitute out for YSZ
(Geuzens et al., 2008; Oelgardt et al., 2010; Li et al., 2012; Ortmann et al., 2012).
Previous work done by Azhar et al. (2009) showed that the Vickers hardness of
Al2O3 reduces from 1810 HV to 1640 HV with the introduction of 20 wt % of YSZ.
The reduction of Vickers hardness reduces the tool wear and the tool life
(Medvedovski, 2001; Bitterlich et al., 2008). The loss of Vickers hardness can be
recovered by using additives. Previous work by Coble in 1961 proved that the
introduction of MgO in Al2O3 matrix will result in a significant effect on the
mechanical and electrical properties of Al2O3 (Coble, 1961). Similar observations
were also reported by other authors where as the presence of sintering additives can
improve the properties of the sintered product (Wang et al., 1998; Rittidech et al.,

5
2006; Ahangarkani et al., 2012; Huang et al., 2012; Rittidech and Tunkasiri, 2012;
Song et al., 2012; Rittidech et al.).
Another factor that affects the efficiency of additives in the ceramic sintering process
is particle size. Previous report by Golsa et al. (2007) have shown that the effect of
additive's particles sizes such as talc and boehmite in Al2TiO5 ceramic system
increased the bulk density. The increasing of bulk density on different system of
materials were also reported by other researchers as well (Fu et al., 1994; Jeong and
Niihara, 1997; Lumley and Schaffer, 1998; Nawa et al., 1998; Rice, 2000; Ji and
Yeomans, 2002; Homaeigohar et al., 2006). Furthermore, with recent advancement
of materials, addition of nanomaterials has shown to have significant effect on bulk
density and mechanical properties (Wu et al., 2004; Jang, 2005; Ko et al., 2005).
Besides hardness, fracture toughness is also one of the important characteristics for a
cutting insert to perform without experiencing premature failure (Kalpakjian and
Schmid, 2009). Cutting insert with low toughness often failed early during the
machining process (Ezugwu and Wallbank, 1987; Dudzinski et al., 2004). For ZTA
ceramic composite, the toughness can be improved by increasing the content of YSZ.
However, previous study has shown that reducing Al2O3 content would decrease the
hardness since Al2O3 is traded out and replaced by YSZ (Cesari et al., 2006; Azhar et
al., 2009). Alternatively, introduction of additives can be used to improve the
composite’s fracture toughness. Previous research has shown that the fracture
toughness of Al2O3-based ceramic composite can be improved by using additives
such as CeO or Cr2O3 (Tien et al., 1986; Zhang et al., 1997; Riu et al., 2000; Senthil
Kumar et al., 2004b; Magnani and Brillante, 2005; Senthil Kumar et al., 2007; Yang
et al., 2012).

6
1.3 Research objectives
The objectives of this study are as follows:
i. To investigate the effect of MgO additive on the mechanical properties and
tool wear of ZTA ceramic composites.
ii. To investigate the effect of MgO particles sizes as an additives on the
mechanical properties and tool wear of ZTA ceramic composites.
iii. To investigate the effect of Cr2O3 additive on the mechanical properties and
tool wear of ZTA and ZTA-MgO ceramic composites.
1.4 Project approach
The study is divided into three parts. The Part 1 is to study the effect of MgO
additive on the mechanical properties of ZTA ceramic composite. Samples with an
80/20 ratio for Al2O3/YSZ were prepared with different MgO wt% ranging from 0
wt% to 3.5 wt%. The samples were pressed at 300 MPa and subsequently sintered at
1600 oC for 4 hours. Vickers hardness (HV) and fracture toughness (KIc) were
determined by Vickers indentation with a 30 kgf load. Field emission scanning
electron microscopy (FESEM) was employed to study the samples microstructure.
The samples were thermally etched in the same furnace used for sintering at 1400 °C
for 2 hours. Machining test was done using a conventional lathe (Harrison 600) on
commercially available stainless steel 316L.
Part 2 is to study the effect of MgO particle sizes as additive on the mechanical
properties of ZTA ceramic composite. MgO in average particle sizes of 20 nm
(Strem Chemicals), 100 nm (Alfa Aesar), 500 nm (Alfa Aesar) and 7000 nm (Alfa

7
Aesar) were added to the Al2O3/YSZ, respectively. The 80 % Al2O3 and 20 % YSZ
samples were prepared with different MgO particle sizes and wt % ranging from
0.4 wt % to 0.9 wt.% for micron size of additives and 0.4 wt.% to 1.3 wt % for nano
additive. The sample preparations and characterization techniques are identical to
Part 1.
Part 3 is to study the effect of Cr2O3 additives on the mechanical properties of ZTA
and ZTA-MgO ceramic composites. Samples with an 80/20 ratio for Al2O3/YSZ and
Al2O3/YSZ/MgO were prepared with different Cr2O3 wt% ranging from 0 wt% to
1.0 wt%. Step for samples preparation and characterization techniques are similar to
Part 1.

8
CHAPTER 2
LITERATURE REVIEW
2.1 Ceramic cutting insert
Ceramic cutting inserts were introduced in early 1950s, which consists of primarily
fine grained, high purity aluminium oxide or alumina (Al2O3). They were pressed
into inserts shapes at room temperature and with high pressure, sintered at high
temperature and called white, or cold pressed ceramics (Kalpakjian and Schmid,
2009).
Al2O3-base ceramic inserts shows high abrasion resistance and high hot hardness (Fu
et al., 1994). They are chemically more stable than cutting insert made from high
speed steels and carbides. Good surface finish is also obtained with ceramic inserts in
cutting cast irons and steels. Unfortunately, ceramics especially Al2O3 lack toughness
which leads to premature insert failure by chipping (Kalpakjikan and Schmid, 2003).
Previous work by Trent and Wright (2000) also reported that Al2O3 is one of
refractory oxides which shows high hardness and melting point. Disposable cutting
insert consisting of almost 100% Al2O3 has been commercially available for more
than 30 years and have been used in many countries for machining steel and cast
iron.
Nowadays, an extensive series of types of ceramics are currently being applied and
developed as cutting inserts, including Al2O3, Al2O3/ZrO2, SiC whiskers reinforced
Al2O3, Al2O3/TiC and Si3N4 composites. Furthermore, microstructures are being
optimized for high strength, toughness and hardness (D'Errico et al., 1999).

9
2.2 Al2O3 as a cutting insert
Al2O3 is used in many kind of abrasive wear environment such as coal chutes, ball
mills, dies, grinders, mixers, containers for abrasive slurries and cutting inserts
(Dogan and Hawk, 1997; Bernardi et al., 2004). Al2O3 offer advantages such as high
hot hardness, high abrasion resistant, chemically inert and relatively cheap. Table 2.1
shows the mechanical properties of Al2O3 which makes it one of the most popular
materials chosen for metal cutting applications.
Table 2.1: Mechanical properties of Al2O3 (Al-Naib, 2000).
Properties Values
Density (g/cm3) 3.96
Poisson ratio 0.2
Elastic modulus (Gpa) 400
Flexural strength (Mpa) 340
Vickers hardness (HV) 1900
Fracture toughness (Mpa.m1/2
) 4.0
2.3 Disadvantages of Al2O3 as a cutting insert
In spite of the variety of useful physical properties of sintered oxide ceramics based
on chemically and thermally stable modification of -Al2O3, their application as
cutting tool inserts working under mechanical loads and thermal shock conditions is
limited due to their brittleness and low strength. To overcome the brittleness,
reinforcement such as YSZ is introduced into Al2O3. YSZ increases the toughness by
the phase transformation from ZrO2(t) to ZrO2(m) (Dogan and Hawk, 1997; Smuk et
al., 2003; Szutkowska, 2004).
Even with modern and advanced processing, the brittleness of monolithic Al2O3 is
still a critical weakness (Xu et al., 2001). To overcome this problem, efforts have
been made by reinforcing Al2O3 with SiC whiskers and ZrO2 particles.

10
2.4 Yttria stabilized zirconia (YSZ)
Zirconium dioxide (ZrO2), widely known as zirconia, is a white crystalline oxide of
zirconium. Its most naturally occurring form, with a monoclinic crystalline structure,
is the rare mineral, baddeleyite. The high temperature cubic crystalline form, called
‘cubic zirconia’, is rarely, if ever, found in nature, but is synthesized in various
colours for use as a gemstone (Basu et al., 2004a).
Zirconia is one of the most studied ceramic materials. Pure ZrO2 has a monoclinic
crystal structure at room temperature and transforms to tetragonal and cubic at
increasing temperatures. The volume expansion (~ 4 %) caused by the cubic to
tetragonal to monoclinic transformations induce very large stresses, and will cause
pure ZrO2 to crack upon cooling from high temperatures. Several different oxides are
added to zirconia to stabilize the tetragonal and/or cubic phase: magnesium oxide
(MgO), yttrium oxide (Y2O3), calcium oxide (CaO), and cerium oxide (Ce2O3),
amongst others (Basu, 2005).
In zirconia containing ceramics, maximum toughness can be achieved by
manipulating the advantage of tetragonal-to-monoclinic martensitic 10ransformation
that can be induced in the stress field of an approaching crack. Much research has
focused on the mechanisms of ‘transformation toughening’ in zirconia (Dogan and
Hawk, 1997; Mishra et al., 1998). Dogan and Hawk (1999) also reported that
materials in which zirconia are added as a reinforcement phase may be toughened
and strengthened by anyone, or combination of the following mechanisms:
Transformation toughening
Microcracking at monoclinic zirconia-matrix interfaces
Crack deflection by zirconia particles
11
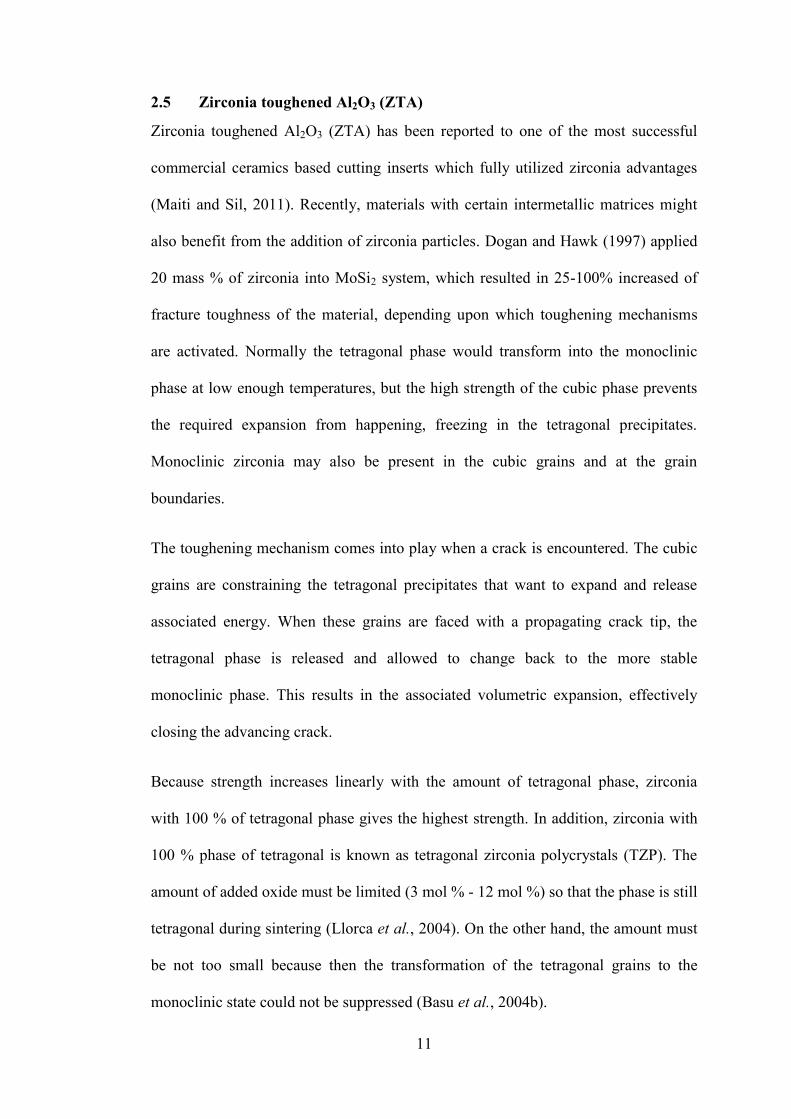
2.5 Zirconia toughened Al2O3 (ZTA)
Zirconia toughened Al2O3 (ZTA) has been reported to one of the most successful
commercial ceramics based cutting inserts which fully utilized zirconia advantages
(Maiti and Sil, 2011). Recently, materials with certain intermetallic matrices might
also benefit from the addition of zirconia particles. Dogan and Hawk (1997) applied
20 mass % of zirconia into MoSi2 system, which resulted in 25-100% increased of
fracture toughness of the material, depending upon which toughening mechanisms
are activated. Normally the tetragonal phase would transform into the monoclinic
phase at low enough temperatures, but the high strength of the cubic phase prevents
the required expansion from happening, freezing in the tetragonal precipitates.
Monoclinic zirconia may also be present in the cubic grains and at the grain
boundaries.
The toughening mechanism comes into play when a crack is encountered. The cubic
grains are constraining the tetragonal precipitates that want to expand and release
associated energy. When these grains are faced with a propagating crack tip, the
tetragonal phase is released and allowed to change back to the more stable
monoclinic phase. This results in the associated volumetric expansion, effectively
closing the advancing crack.
Because strength increases linearly with the amount of tetragonal phase, zirconia
with 100 % of tetragonal phase gives the highest strength. In addition, zirconia with
100 % phase of tetragonal is known as tetragonal zirconia polycrystals (TZP). The
amount of added oxide must be limited (3 mol % - 12 mol %) so that the phase is still
tetragonal during sintering (Llorca et al., 2004). On the other hand, the amount must
be not too small because then the transformation of the tetragonal grains to the
monoclinic state could not be suppressed (Basu et al., 2004b).

12
TZP is having the highest strength and fracture toughness. TZP is not only applicable
in bulk form, but also as reinforcement in other ceramics. Fig. 2.1 shows Al2O3
reinforced with zirconia particles thus called ZTA. If the size of zirconia particles is
larger than the critical value or if the compressive stresses during cooling are not
sufficient, the phase transformation can occur during cooling resulting in no
transformation toughening. Besides, another strengthening mechanism such as crack
deflection and microcracking may be possible to occur (Basu, 2005). Once the
transformation toughening occur, ZTA ceramic composite are no longer protected by
the transformation toughening and expected to fail with further stress or load.
Fig. 2.1: Grain structure of zirconium oxide (light grey) in aluminium oxide (dark-
grey). The horizontal bar has a length of 1 micron (Casellas et al., 1999).
ZTA ceramic composite consists of Al2O3 as the matrix and ZrO2 particle embedded
inside it, either unstabilized or stabilized. Unstabilized ZrO2 refer to ZrO2 without the

13
presence of any stabilizer content and stabilized ZrO2 refer to ZrO2 with the presence
of stabilizer such as MgO, Y2O3 and CaO. The addition of second phase is aimed for
the enhancement of flexural strength, fracture toughness and fatigue resistance,
mainly attributed to the stress-induced phase transformation of the tetragonal ZrO2
which transforms into a more stable monoclinic phase. This transformation
contributes to a volume increase of ~4 % which induces compressive stress around a
propagating crack and develops the toughening effect (Casellas et al., 2003). Value
of fracture toughness for ZTA ranging from 6 – 12 MPa.m1/2
, showing a significant
increase compared fracture toughness of Al2O3 (3 MPa.m1/2
). In terms of
microstructure, ZTA micrograph show to have less amount of porosity compare to
monolithic Al2O3. Fig. 2.2 shows the micrograph for monolithic Al2O3 and ZTA.
Fig. 2.2: Micrograph for (a) monolithic Al2O3 and (b) 80 wt % Al2O3/20 % YSZ
(Azhar et al., 2009).
2.6 Fabrication method
Smuk et al. (2003) fabricated the ZTA cutting insert by pressing the mixture at 300
MPa. The samples were sintered in a high temperature electrical furnace with
constant speed of heating and cooling rate, at temperature 1600 oC. Smuk et al.
(2003) also concluded that ZTA ceramic composite with 20 wt % of YSZ are
(a) 0 wt % YSZ (b) 20 wt % YSZ

14
characterized to have the best mechanical properties from among the tested
compound compositions.
Work done by Azhar et al. (2009) and (Hao et al., 2010) used similar processing
route. Monolithic Al2O3 and YSZ were mixed using a ball mill for 8 hours and
hydraulically pressed at 300 MPa into a rhombic with an 80o angle cutting insert. The
samples were later sintered at 1600 oC for 4 hours with 5
oC/min sintering rate.
2.6.1 Sintering
Sintering is known as a process to create objects from powders or particles. The basic
mechanism is atomic diffusion. Atomic diffusion occurs much faster at higher
temperature. Few parameters are known to affect sintering such as type of materials,
particle sizes, sintering atmosphere, temperature, time and heating rate (Rahaman,
2003).
There are 3 stages during sintering; starting, intermediate and finish. Fig. 2.3 shows
the respective stages. During adhesion stage the particles comes into contact each
other but do not form any bond. At initial stage, there is a rapid growth of the
interparticle neck between the particles. At intermediate stage the pore structure
becomes smooth (reach equilibrium shape) and develops interconnected particles.
The intermediate stage usually covers the major part of the sintering process.
Particles start to form grain boundaries. At the final stage, the densification process is
stopped and the pores become spherical and separated (Rahaman, 2003).

15
Fig. 2.3: Stages of sintering (a) free particles, (b) necking between particles, (c)
formation of grain boundary, and (d) densification process and pores elimination
(Randal, 1991).
Sintering occurs by diffusion of atoms through the microstructure. This diffusion is
caused by a gradient of chemical potential-atoms that move from an area of higher
chemical potential to an area of lower chemical potential. The different paths that the
atoms take to get from one spot to another are known as the sintering mechanisms.
The six common mechanisms are:
Surface diffusion – diffusion of atoms along the surface of a particle
Vapor transport – evaporation of atoms which condense on a different surface
Lattice diffusion from surface – atoms from surface diffuse through lattice
Lattice diffusion from grain boundary – atom from grain boundary diffuses
through lattice
Grain boundary diffusion – atoms diffuse along grain boundary
Plastic deformation – dislocation motion causes flow of matter

16
2.7 Effect of additives
2.7.1 Effect of MgO addition to Al2O3
Research done by Coble (1961) stated that small addition (≤0.25 wt %) of MgO
would hinder the grain growth of Al2O3 during sintering process. In addition, Al2O3
with near theoretical density is possible with the addition of MgO (Ikegami et al.,
2010). Fig. 2.4 shows the densification of Al2O3 compacts with and without the
addition of MgO. Al2O3 containing MgO (represents by solid circle) is shown to
achieve 100% relative density while Al2O3 without MgO reaches 97% of relative
density under the similar sintering condition. The work done by Coble (1961)
suggests that the discontinuous grain growth of Al2O3 has been averted by the
enhancement of the sintering rate by the presence of MgO.
Fig. 2.4: Densification of Al2O3 compacts with and without MgO additives. TSI
stands for tons per square inch (Coble, 1961).
Fig. 2.5 shows the grain growth of Al2O3 compacts with different temperature and
additives as variables. One series containing Al2O3 with 0.25 wt % of MgO and is
shown by filled circles while Al2O3 without MgO is represented by open diamonds.

17
Both Al2O3 series shows normal grain growth up to a size of 10 µm at 560 min.
Beyond 560 min, Al2O3 with MgO continue to exhibit normal growth, while
undoped Al2O3 samples undergo discontinuous grain growth. According to Coble
(1961) at 1800 min the discontinuous growth is completed and the undoped Al2O3
samples show final grain size of 208 µm. Beyond 1800 min, grain size for Al2O3
doped with MgO was observed does not to decrease lower than 130 µm.
Fig. 2.5: Grain growth in Al2O3 compacts with temperature, forming pressure and
magnesia additives as variables (Coble, 1961).
Explanation by Rahaman (2003) showed that the addition of MgO would decrease
the grain mobility in Al2O3. Two mechanisms have been proposed i.e. (i) solute drag
due to Mg2+
segregation at grain boundaries, and (ii) pinning of the grain boundaries
by fine particles of MgAl2O4. However, use of MgO with another additives material
will mask the effect of MgO on Al2O3.
A study by Rittidech et al. (2006) also highlighted the potential of MgO as sintering
additives for Al2O3. Addition of MgO would result in a smaller grain size and
decrease the fracture toughness significantly. In addition, MgO is one of the

18
additives that can be used to reduce the sintering temperature and enable to sinter
Al2O3 to near theoretical density.
Fig. 2.6 shows the MgO–Al2O3 phase diagram use by Sarkar and Banerjee (1999) in
his previous work. Sarkar and Banerjee (1999) studied the densification mechanism
of MgO–Al2O3 compacts with MgO to Al2O3 molar ratios 1:1 (stoichiometric spinel),
2:1 (magnesia rich spinel) and 1:2 (alumina rich spinel). They found that very high
density can be obtained in a single stage sintering process for all the stoichiometric
and nonstoichiometric spinels (MgO: Al2O3 molar ratios=2:1, 1:1 and 1:2) by
incorporation of milling process.
Fig. 2.6: Phase diagram of the system MgO–Al2O3 (Sarkar and Banerjee, 1999).
Previous work by Greskovich and Brewer (2001) and Miller et al. (2006) focused on
determining the solubility limit of MgO in Al2O3. Greskovich and Brewer (2001)
conclude that the The solubility limits of MgO in Al2O3 were very low (~75 ppm

19
MgO at 1720°C and 175 ppm MgO at 1880°C). Miller et al. (2006) reported that the
solubility limit of MgO in Al2O3 at 1600oC was found to be 132±11 ppm.
2.7.2 Effect of Cr2O3 addition to Al2O3
Similar with other ceramics, the strength of Al2O3 is proportional to the size of its
grains. High strength as well as high hardness is obtained when the grain size is fine
and homogeneous. However, the fracture toughness is generally low if the grain is
small and homogeneous. Therefore, the fracture toughness will be increased when
there are large elongated or platelike grains dispersed in a fine-grained matrix. This
is because large grains can resist crack propagation in a fracture process (Riu et al.,
2000).
Previous research done by Hirata et al. (2000) showed that the addition of Cr2O3
would increase the fracture toughness of Al2O3. When Cr2O3 is added into Al2O3
system, isovalent solid solution will form over the full range of compositions due to
both Cr2O3 and Al2O3 having the same corundum crystal structure. Reaction at high
temperature (T >1000 °C) will produced a complete ranges of substitution solid
solution (Magnani and Brilliante, 2005). Isovalent solid solution happened when an
atom or ion replaces an atom or ion of the same charge in the parent structure. It
contributes to high refractoriness and chemical stability. The addition of Cr2O3 also
increases the hardness, tensile strength and thermal shock resistance of Al2O3 (Riu et
al., 2000).
Based on Fig. 2.7, when a small amount of Cr2O3 (~2 mol %) was added, the grains
became larger and bimodal in size distribution. Meanwhile, the fracture toughness
and flaw tolerance of Al2O3 were improved. The hardness as well as elastic modulus
was increased. However, fracture strength decreased by the Cr2O3 additions. The

20
large grains had platelike shape and were composed of a core region that is free from
Cr3+
and a surrounding shell region rich in Cr3+
(Riu et al., 2000).
Fig. 2.7: Morphologies of Al2O3 specimens hot pressed at 1500°C for 1 h containing
(A) 0 mol%, (B) 2 mol%, (C) 5 mol%, and (D) 10 mol% of Cr2O3 (Riu et al., 2000).
The increase of Al2O3 grains size is due to the presence of Cr3+
ions. Diffusion of Cr
through Al2O3 surface is faster compared to bulk diffusion. As a result, Al2O3 grains
adjacent to Cr2O3 become full with Cr3+
ion during sintering. Those grains show
faster grain growth. Riu et al. (2000) mentioned that large grains of Al2O3 will
produce a platelike morphology as shown in Fig. 2.8. The formation of platelike
grains was previously reported to increase the fracture toughness (Riu et al., 2000;
Magnani and Brillante, 2005).
21
Fig. 2.8: Morphology of platelike grains, shown by the arrow in the figure (Riu et al.,
2000).
Table 2.2 shows the mechanical properties Al2O3 added with different amount of
Cr2O3. Based on the Table 2.2, Al2O3 added with 2 mol% produced the highest
fracture toughness, modulus of rupture as well as microhardness values. Value of
Vickers hardness increased from 1681 HV ± 20 to 1738 HV ± 26 with 2 wt % of
Cr2O3. However with further amount of Cr2O3, the value of Vickers hardness
decreases. The author stated that it may cause by the presence of large Al2O3 grain
size in the ceramic composite (Riu et al., 2000). In this study, the fracture toughness
reference value used for monolithic Al2O3 and ZTA is 2.98 MPa.m1/2
and 5.93
MPa.m1/2
, respectively.
Table 2.2: Summary of mechanical properties of Al2O3 contain different amount of
Cr2O3 (Riu et al., 2000).
Cr2O3
mol
%
K1C (MPa.m
1/2) K1C % MOR
(MPa)
E
(GPa)
HV
(kg/mm2)
HV %
0 3.7 0 445 407 1681 0
2 4.7 27 355 411 1738 3.0
3 4.5 21 386 412 1714 2.0
5 3.9 5 350 402 1653 -1.6

22
Research done by Magnani et al. (2005) showed that the fracture toughness of ZTA
system can be improved with addition of small amount of Cr2O3. Fracture toughness
of ZTA system has increased 12.3% with addition of 0.5wt% of Cr2O3.
Study by Hirata et al. (2000) showed that Cr2O3 and Al2O3 forms solid solution over
the complete range of composition as shown in Fig.2.9. At 1200oC, Cr2O3 is not
stable and prone to become CrO3. The CrO3 is produced at high vapour pressure. It is
hard to obtain a high density of Cr2O3 via solid state sintering. By sintering Cr2O3 in
a control environment (vacuum or in an inert gas atmosphere), the relative density
can be increased. Al-Douri et al. (1994) and Yamauchi et al. (2003) reported that the
evaporation of Cr2O3 in O2 atmosphere is caused by the following reaction:
Cr2O3 (s) + 3/2O2(g) = 2CrO3(g) (2.1)
Fig.2.9: Phase relationship between Al2O3-Cr2O3 (Hirata et al., 2000).

23
2.8 Effect of particle size and grain size on mechanical properties
Studies done by Teng et al. (2007) showed the effect of Al2O3 particle size on the
mechanical properties of alumina-based ceramics. By comparing the monolithic
nano-scale alumina ceramics and monolithic micro-scale alumina ceramics, the
monolithic nano-scale alumina ceramics showed intergranular fracture mode and
higher flexural strength due to finer grain and higher density. The mechanical
properties of the Al2O3µ/Al2O3n/SiCn multi-scale nanocomposite were also greatly
improved. When hot-press fabricating nano-scale Al2O3 particles and nano-scale SiC
particles at 1700 ºC, these particles can form homogeneous and compact body. When
observing the microstructure, the grain boundary of the composite is reinforced thus
resulting in the transition from intergranular to transgranular fracture mode. The
Al2O3µ/Al2O3n/SiCn composite had higher mechanical properties than Al2O3µ/SiCn
composite due to the size matched effect and the different thermal expansion
coefficient of the nano-scale Al2O3 particles.
Many researchers (Hall et al., 1995; Goh et al., 1997; Azhar et al., 2009; Jianxin et
al., 2009; Xu et al., 2009; Zhao et al., 2010) have done their investigation on the
wear resistance of alumina ceramic by focusing on the microstructure and alumina
grain size. They found that by reducing the matrix grain size and promoting narrow
grain size distribution; this method can enhance the wear resistance of the material in
abrasive and sliding environments. Besides that, porosity has also been shown to
affect the wear behaviour of alumina ceramics. Increase in porosity will lead to a
decrease in wear resistance.
The mechanical properties of ceramics are often dependent on the grain size of the
materials. Materials with fine-grained size (< 10µm) usually have superior
properties. Cutting insert with long life requires grain size less than 3 µm, uniform

24
grain size and minimum porosity. Besides that, inserts with smaller average and
uniform grain size showed a longer tool life and machinability.
Dogan and Hawk (1999) also suggested that the microstructure and overall chemistry
of the ceramic must be taken into consideration when selecting a high-alumina
material for a wear-resistant application. In order to optimize the abrasive wear-
resistance, the alumina grain size must be small, regardless of the alumina content.
Besides that, if second phases are present at the boundaries, they should be
amorphous and with composition high in alkaline earth constituents to reduce their
softening point.
Study was also done by Ko et al. (2005) on the Al2O3-SiC composite system
containing 30 wt % of dispersed SiC particles (~280nm) which was fabricated
through hot-pressing and machined as cutting inserts. The Al2O3-SiC particulate
composites exhibit higher hardness than the unreinforced matrix. This is because the
SiC inhibits grain growth and the SiC is present as the hard secondary phase. The
SiC particles on the grain boundary of the composites contribute to the increasing of
toughness at high SiC loadings (≥20wt.%). The reduced grain size and the
transformation of the fracture mode from intergranular to intragranular of the
composite lead to the reduction of the fracture toughness whereas crack deflection by
the SiC particles contributed the increase in toughness.
2.9 Effect of mechanical properties on tool wear
In cutting insert application, hardness and fracture toughness are the main
mechanical properties that will affect the wear behaviour of the insert. The role of
hardness is to resist wear during machining against the workpiece. Theoretically,
cutting insert with high hardness will have longer tool life due to its high wear
![Final Shilpabank-Farhad[1].doc](https://static.fdocuments.us/doc/165x107/577cc0091a28aba7118ea31d/final-shilpabank-farhad1doc.jpg)


![Final Shilpabank Farhad[1]](https://static.fdocuments.us/doc/165x107/577d275b1a28ab4e1ea3b63e/final-shilpabank-farhad1.jpg)
![DSE_5210-5220_US_WEB[1] FARHAD](https://static.fdocuments.us/doc/165x107/577d37551a28ab3a6b956e56/dse5210-5220usweb1-farhad.jpg)