
The effect of propylene glycol and polyethylene glycol 400 ...
Vol.:(0123456789)1 3
Petroleum Science (2021) 18:827–838 https://doi.org/10.1007/s12182-020-00543-w
ORIGINAL PAPER
Synergistic inhibition of polyethylene glycol and potassium chloride in water‑based drilling fluids
Dan‑Chao Huang1,2 · Gang Xie1 · Ni‑Yuan Peng2 · Jian‑Guo Zou2 · Yao Xu2 · Ming‑Yi Deng1 · Wei‑Chao Du1,3 · Yu‑Rong Xiao1 · Jin‑Jun Huang1 · Ping‑Ya Luo1
Received: 25 November 2019 / Accepted: 9 November 2020 / Published online: 15 February 2021 © The Author(s) 2021
AbstractMud shale hydration and swelling are major challenges in the development of water-based drilling fluids (WBDFs). In this work, the inhibition performance and inhibition mechanism of polyethylene glycol (PEG) and potassium chloride (KCl) were investigated by hot rolling recovery tests, linear swell tests, Fourier transform infrared spectroscopy, X-ray diffraction, atomic absorption spectrophotometry and X-ray photoelectron spectroscopy. The experimental results show that the com-bination of PEG and KCl achieved higher recovery and lower linear swelling rate than those obtained by individual PEG or KCl. Compared to the d-spacing of Na-montmorillonite (Na-Mt) with PEG or KCl, the d-spacing of Na-Mt with PEG+KCl was lower, which indicates that KCl and PEG have synergistic inhibition effect. This synergistic effect can replace sodium ions and water molecules from the interlayer space of Na-Mt and decrease the d-spacing of Na-Mt. Based on the above experimental results and analysis, a method for optimizing PEG and KCl concentrations was proposed and further verified by rheological and hot rolling recovery tests of WBDFs. Hence, the results of this work can provide valuable theoretical guidance for developing other synergistic inhibitors.
Keywords Clay hydration · Inhibitor · Synergistic inhibition · Polyethylene glycol · Water-based drilling fluids
1 Introduction
Shale oil and gas resources have been attracting a consider-able amount of attention in recent years (Qian et al. 2020; Li et al. 2020). Severe wellbore instability frequently occurs during drilling of water-sensitive shale formations, which account for 75% of the drilling formations (Bol et al. 1994; Dzialowski et al. 1993; Steiger and Leung 1992; Li et al.
2020). When water-sensitive shale comes into contact with water-based drilling fluids (WBDFs), hydration and swelling of clay minerals occur, which can generate wellbore insta-bility (Cook et al. 1993; Mody and Hale 1993; van Oort 2003; Guo et al. 2006; Al-Bazali 2011). This results in sev-eral downhole complications, including wellbore collapse, wellbore shrinkage, pipe sticking and bit balling, which can increase both drilling times and costs (Khodja et al. 2010; Liu et al. 2006; Wang et al. 2009; Cai et al. 2008; Baohua et al. 2013; Li et al. 2015). In many cases, oil-based/syn-thetic-based drilling fluids are used to ensure swelling inhi-bition in water-sensitive formations (Li et al. 2016a, 2019). Despite their benefits, such as well inhibition ability, tem-perature resistance and lubricity, the oil-based drilling fluids lead to environmental pollution and high costs, limiting their application in the field. Therefore, WBDFs are the focus of much research, and the most important task in the research of WBDFs is to develop an excellent swelling inhibitor.
In the field of WBDFs, amine inhibitors have emerged as a research focus, but there are some environmental problems associated with this class of chemicals. However, polyols, as inhibitors for WBDFs, satisfy international environmental
Edited by Yan-Hua Sun
* Gang Xie [email protected]
* Ping-Ya Luo [email protected]
1 State Key Laboratory of Oil & Gas Reservoir Geology and Exploitation, Southwest Petroleum University, Chengdu 610500, Sichuan, China
2 College of Chemistry and Chemical Engineering, Southwest Petroleum University, Chengdu 610500, Sichuan, China
3 College of Chemistry and Chemical Engineering, Xi’an Shiyou University, Xi’an 710056, Shanxi, China
828 Petroleum Science (2021) 18:827–838
1 3
standards in terms of toxicity and biodegradability (Twynam et al. 1994). In addition, polyols have the advantages of water solubility, lubricity, thermal stability and compat-ibility with conventional treatment in the WBDFs (Bland et al. 1996; Bland 1992). In 1940, Cannon (1940) success-fully tackled the shale swelling problem during drilling of a water-sensitive formation with 30% ethylene glycol and propylene glycol in the WBDFs. A large number of field applications and laboratory studies have shown that polyols have an excellent inhibition performance in the presence of KCl (Bland 1992). Low-salinity glycol WBDFs have been developed for shale drilling in environmentally sensitive locations (Brady et al. 1998). KCl-PHPA-polyols were used to maintain borehole stability and reduce torque in the Sob-hasan oilfield of India (Raza Khan et al. 2006). Moreover, polyol and potassium carbonate were applied as inhibitors to the Kanina oilfields of Albania (Isinak et al. 2005). In the deep exploratory wells of the Assam oilfield, polyol-KCl drilling fluids effectively inhibited clay swelling, improved wettability of drill pipe and reduced torque. The combina-tion of polyethylene glycol (PEG) and KCl exhibits better inhibition performance than that provided by individual PEG or KCl. The mechanism of synergistic inhibition is related to a complexation between PEG and K+, which can weaken the hydration of K+ (Sartori et al. 1990; Tasaki et al. 1999). Boulet (2004) demonstrated that PEG+KCl can decrease the layer spacing of Mt crystalline to 1.40 nm, and PEG adopts a single-layer structure. However, the mechanism of syner-gistic inhibition caused by PEG+KCl is still not well under-stood and needs to be theoretically explored. Moreover, no studies have yet proposed a general principle to optimize the concentrations of these two inhibitors for WBDFs.
In this study, the synergistic inhibition effect of PEG and KCl was investigated through linear swell tests and hot roll-ing recovery tests. After that, Fourier transform infrared spectroscopy (FTIR), X-ray diffraction (XRD), elemental analysis (EA), atomic absorption spectrophotometry (AAS), X-ray photoelectron spectroscopy (XPS) and scanning elec-tron microscopy (SEM) were used to demonstrate and reveal the complex mechanism of this synergistic inhibition. Based on the proposed mechanism, a principle of optimizing con-centrations of PEG and KCl in WBDF was put forward. Both the inhibition mechanism and optimization principle were verified against the results of drilling fluid tests in the laboratory.
2 Experimental
2.1 Materials
The chemical composition of Na-montmorillonite (Na-Mt) (obtained from the Nanocor Company) was as follows:
71.30% SiO2, 13.22% Al2O3, 4.79% Na2O, 7.10% MgO and 3.59% Fe2O3, which was determined with the X-ray diffrac-tion method. The cation exchange capacity (CEC) of Na-Mt was 113 meq/100 g. Drill cuttings were purchased from the Center for Well Completion and Logging Laboratory and had 58.7% clay and 41.3% non-clay. Polyacrylamide (PAM) (anionic; mean molecular weight of 3 × 10⁶), carboxymethyl cellulose (CMC), polyethylene glycol (PEG, mean molecu-lar weight of 500), Na2CO3 and KCl were purchased from Chengdu Micxy Chemical Co., Ltd. Bentonite was pur-chased from Xinjiang Zhongfei Xiazi Street Bentonite Co., Ltd.
2.2 Sample preparation
The sample pretreatment process is as follows. Na-Mt was dried at 150 °C for 24 h. Then, 1 g of dry Na-Mt was added to 25 mL of distilled water. After 3 h of stirring at 30 °C, the Na-Mt dispersion was added to 25 mL of inhibitor solution of different concentrations. Then, the dispersion was stirred at 30 °C for 24 h and centrifuged at 5000 rpm for 25 min. The centrifugal sediment was added to 25 mL of distilled water and stirred with a glass rod. After that, the samples were centrifuged and washed three times by water.
In order to facilitate the description and comparison of the experimental results, two types of samples are defined: wet Na-Mt/inhibitor samples and dry Na-Mt/inhibitor samples. The pre-treated samples are wet Na-Mt/inhibitor samples. Dry Na-Mt/inhibitor samples were obtained through drying the wet sample at 150 °C for 24 h and complete grinding.
2.3 Methods
2.3.1 Inhibition performance evaluation
Hot rolling recovery tests are performed as follows. A total of 50 ± 0.01 g drill cuttings were passed through a 10-mesh sieve and dried at 105 ± 3 °C for 4 h. The drill cuttings were added to high-temperature aging tanks with 350 mL of 1% inhibitor solution. The tanks were aged in a roller oven at 120 °C for 16 h. After hot rolling, the drill cuttings were passed through a 40-mesh sieves and dried at 105 ± 3 °C for 4 h. Cuttings were cooled to room temperature and weighed (m). The first hot rolling recovery (R1) was the ratio of resid-ual drill cuttings after first aging. The cuttings from the first recovery were aged a second and a third time. The first, second and third hot rolling recovery of the drill cuttings (R1, R2, R3) were calculated using Eq. (1):
(1)Ri=
mi
50× 100%

829Petroleum Science (2021) 18:827–838
1 3
where mi is the recovery mass of cuttings (i = 1, 2, 3); Ri is the cutting recovery, %.
Linear swell tests were performed as follows. A total of 10 ± 0.01 g of drill cuttings were passed through a 100-mesh sieve and dried at 105 ± 3 °C for 4 h. After that, the drill cuttings were added to test tubes and compressed at 4 MPa for 5 min. The pressure was then relieved, and the original height of the cutting column (H) was measured with a Vernier caliper.
Then, the cutting column was installed in the linear dilatometer. Certain concentrations of inhibitor solution were added to the linear dilatometer until the solution is above the top of the cutting column. With the change of time, the changes in the height of the cutting column were recorded. At last, the linear swell ratio was calculated using Eq. (2):
where Wt is the percentage of linear swell ratio; H is the original height of the cutting column in mm; and Ht is the height of the cutting column at time t, mm.
2.3.2 Structure characterization and morphology observation
Fourier transform infrared spectroscopy (FTIR) was used to investigate the organic adsorption on clay. FTIR was performed using a Nicolet 6700 FTIR spectrometer (Thermo Scientific Corporation, USA).
The layer spacing of Mt (d001) crystal plane is usually defined as d-spacing (Chaudhary et al. 2013; Lee et al. 2005). X-ray diffraction (XRD) can be used to study the d-spacing of Na-Mt. The XRD patterns of the samples were obtained with an X’Pert Pro MPD diffractometer (a Cu Kα radiation source) at 2θ angles scanned from 3° to 40°. The d-spacing of the samples were analyzed through Bragg’s equation (Xie et al. 2017).
Ion adsorption can be investigated through elemen-tal analysis, atomic absorption spectroscopy (AAS) and X-ray photoelectron spectroscopy (XPS). In this study, the carbon content was measured using a Var10EL-III ele-mental analyzer (Germany). Dry Na-Mt samples, which were prepared in Sect. 2.2, were used to evaluate the content of potassium and sodium ions on a SHIMADZU AA-6300C atomic absorption spectrophotometer. XPS analysis of the compacted samples was assessed with an ESCALAB 250X-ray photoelectron spectrometer.
The morphology of wet Na-Mt samples, which were prepared in Sect. 2.2, was observed with environmental
(2)Wt=
Ht
H× 100%
scanning electron microscope (SEM). SEM was per-formed with a Quanta 650F instrument.
2.3.3 Inhibition performance evaluation of WBDF
To evaluate the inhibition performance of WBDF with inhib-itors, the following steps are required. (1) The preparation of the WBDF with inhibitors. The formulation of the basic WBDF is listed in Table 1. The bentonite and Na2CO3 were added to 200 mL of freshwater and pre-hydrated at room temperature for 24 h. Then, the other agents (as shown in Table 1) were slowly added to the system and stirred thor-oughly in a high-speed mixer at a rate of 11,000 rpm (Li et al. 2016c). At last, certain concentrations of inhibitors were added to the basic WBDF. (2) The evaluation of inhibi-tion performance of WBDF with inhibitors. For the WBDF with inhibitors, their rheological parameters including apparent viscosity (AV), plastic viscosity (PV), yield point (YP), yield point and plastic viscosity ratio (YP/PV), and gel strength, API filtrate volume after hot rolling (120 °C, 16 h) were measured in light of the standard test recom-mended by API RP 13B-2 (2005). According to the method in Sect. 2.3.1, the hot rolling recovery of the drill cuttings in the WBDF with inhibitors was obtained.
3 Results and discussion
3.1 Inhibition performance of KCl and PEG
3.1.1 Hot rolling recovery tests
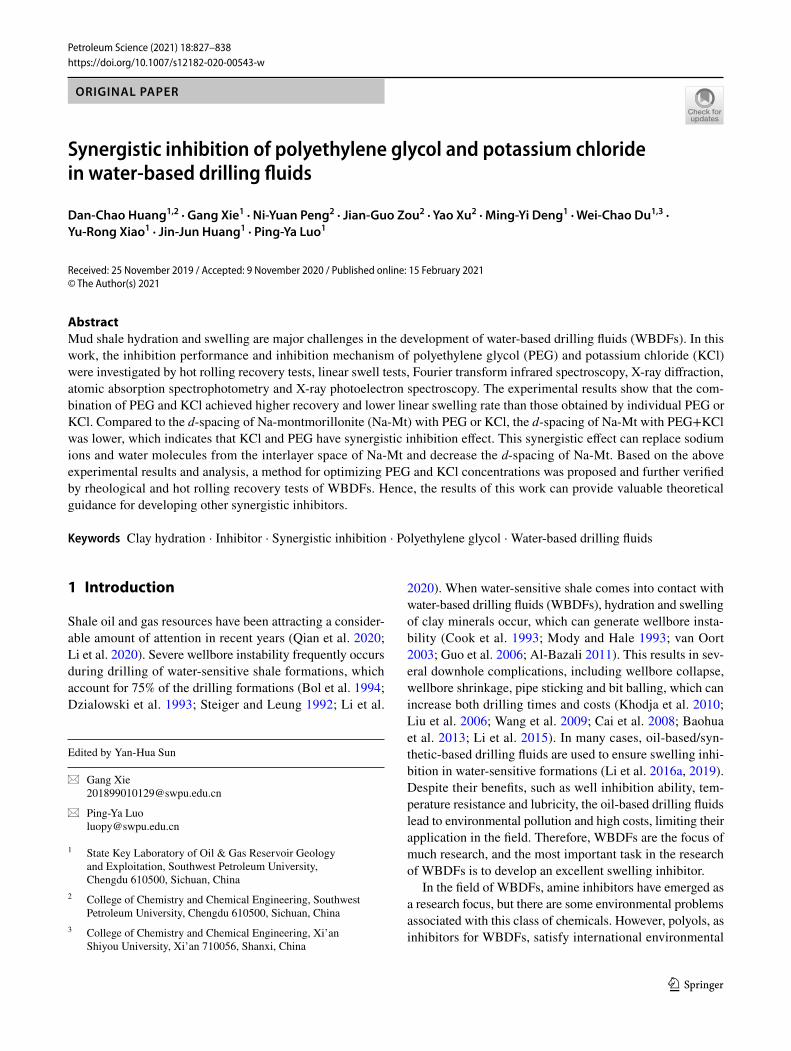
Hot rolling recovery tests were used to evaluate the swelling ability of the shale. An improved inhibitive capacity can be indicated by higher cuttings recovery (Khodja et al. 2010). In application, 3%–10% KCl and 5%–7% PEG (by weight) are commonly used (Hale and Blytas 1993; Reid et al. 2003; Smith and Balson 2004). After hot rolling at 120 °C for 16 h, the cutting recovery of the different systems was measured (Fig. 1). The hot rolling recovery of cuttings in the KCl solu-tion was lower than that in the PEG+KCl solution, as shown in Fig. 1a. With increasing the KCl concentration from 0 to
Table 1 Formulation of basic WBDF
Composition Dosage, wt% Function
Fresh water 93.3 Dispersion mediumBentonite 4.0 Increase viscosity
and shear forceNa2CO3 0.2 Increase viscosityPAM 0.5 Increase viscosityCMC 1.0 Reduce filtration loss
830 Petroleum Science (2021) 18:827–838
1 3
19%, the hot rolling recovery of cuttings in the KCl solution increased from 27% to 35% and increased from 27% to 41% in the PEG+KCl solution. As shown in Fig. 1b, the hot roll-ing recovery of cuttings in the PEG solution was also lower than that in the PEG+KCl solution. With increasing the PEG concentrations from 0 to 18%, the hot rolling recovery of cuttings in the PEG solution increased from 28% to 40% and increased from 28% to 45% in the PEG+KCl solution. This shows that the order of inhibition capacity of the three systems is PEG+KCl > PEG > KCl.
3.1.2 Linear swell tests
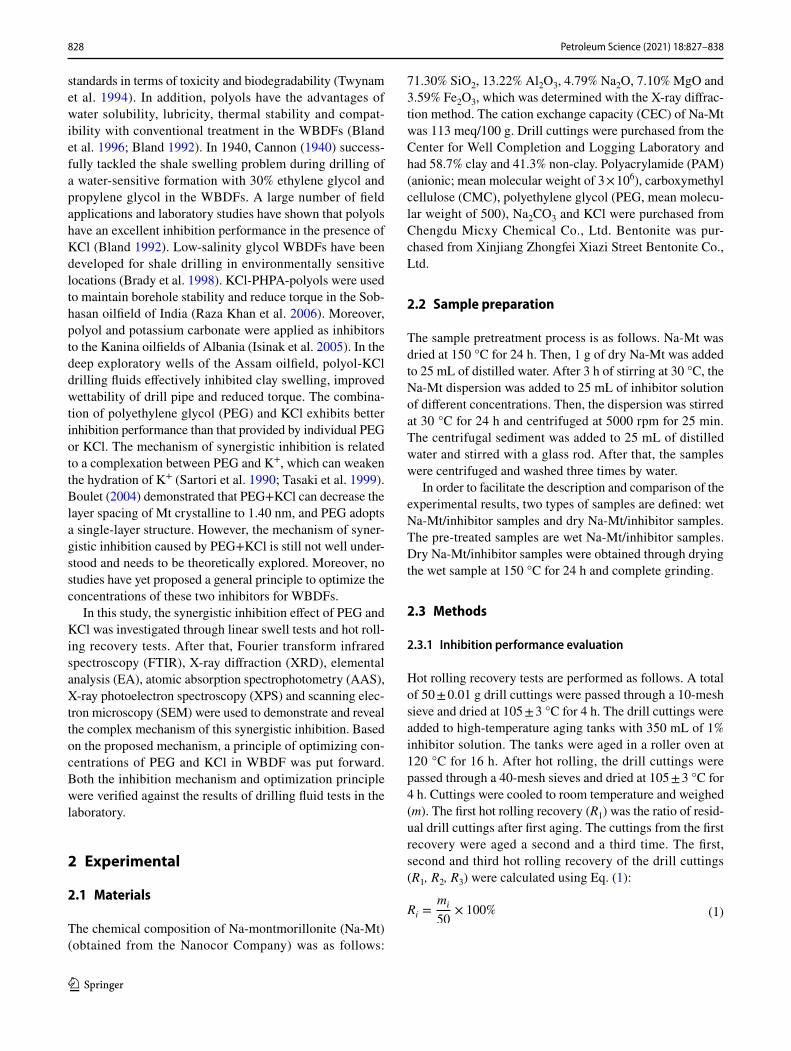
Linear swell tests are widely used to evaluate shale expan-sibility (van Oort et al. 2016). The linear swell rates of the three different inhibition systems are shown in Fig. 2. Lower linear swell rate indicates an improved inhibition
performance. From the data, both PEG and KCl have inhibi-tive capacity, which are lower than the inhibitive capacity of PEG+KCl. The order of linear swell rates was deionized water > KCl > PEG > PEG+KCl. Compared with the linear swell rate of deionized water, the linear swell rates of KCl, PEG and PEG+KCl were reduced by 69%, 51% and 26%, respectively, after 72 h.
According to the results of hot rolling recovery test and linear swell test, it can be concluded that PEG+KCl showed an improved inhibition performance than that of PEG or KCl. PEG+KCl has synergistic inhibition effect.
3.2 Analysis of the inhibitive mechanism
3.2.1 Fourier transform infrared spectroscopy
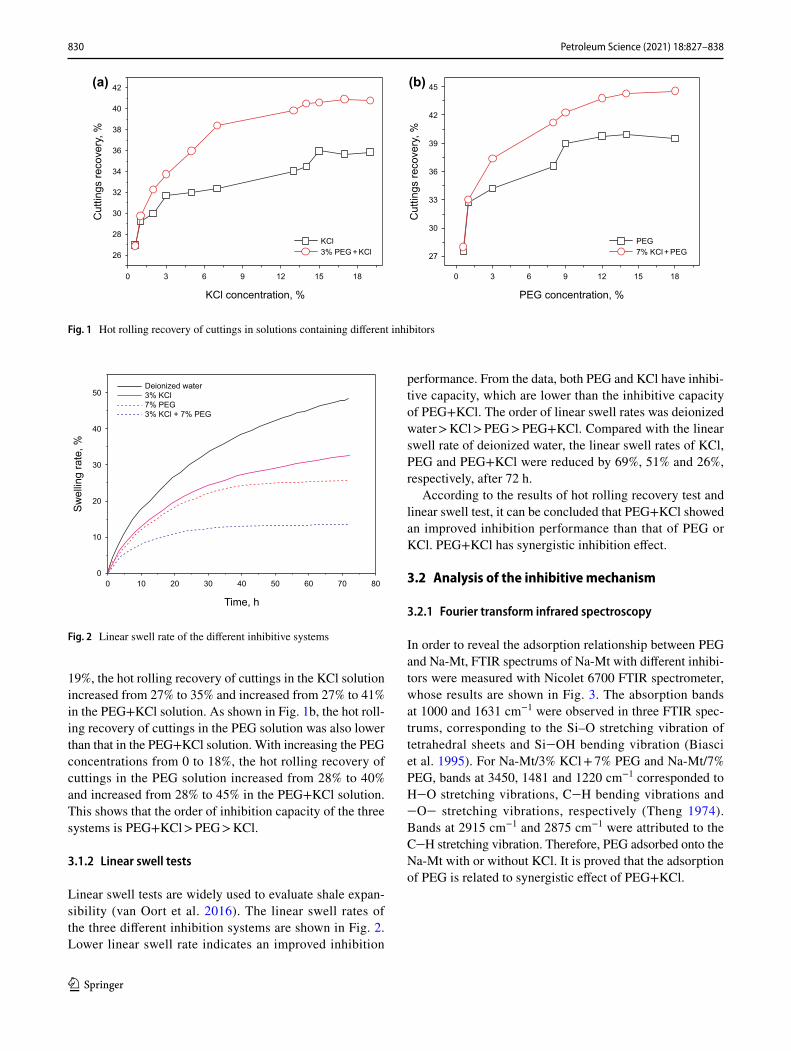
In order to reveal the adsorption relationship between PEG and Na-Mt, FTIR spectrums of Na-Mt with different inhibi-tors were measured with Nicolet 6700 FTIR spectrometer, whose results are shown in Fig. 3. The absorption bands at 1000 and 1631 cm−1 were observed in three FTIR spec-trums, corresponding to the Si–O stretching vibration of tetrahedral sheets and Si‒OH bending vibration (Biasci et al. 1995). For Na-Mt/3% KCl + 7% PEG and Na-Mt/7% PEG, bands at 3450, 1481 and 1220 cm−1 corresponded to H‒O stretching vibrations, C‒H bending vibrations and ‒O‒ stretching vibrations, respectively (Theng 1974). Bands at 2915 cm−1 and 2875 cm−1 were attributed to the C‒H stretching vibration. Therefore, PEG adsorbed onto the Na-Mt with or without KCl. It is proved that the adsorption of PEG is related to synergistic effect of PEG+KCl.
0 3 6 9 12 15 18
26
28
30
32
34
36
38
40
42(a) (b)
KCl3% PEG + KCl
% ,yrevocer sgnittuC
KCl concentration, %
0 3 6 9 12 15 18
27
30
33
36
39
42
45
PEG concentration, %
% ,yrevocer sgnittuC
PEG7% KCl + PEG
Fig. 1 Hot rolling recovery of cuttings in solutions containing different inhibitors
0 10 20 30 40 50 60 70 800
10
20
30
40
50
% ,etar gnillewS
Time, h
Deionized water3% KCl7% PEG3% KCl + 7% PEG
Fig. 2 Linear swell rate of the different inhibitive systems
831Petroleum Science (2021) 18:827–838
1 3
3.2.2 X‑ray diffraction
To study the effect of inhibitors on the structure of Na-Mt, the d-spacing of Na-Mt with different inhibitors was tested by XRD, as shown in Fig. 4. The d-spacing of Na-Mt with 3% PEG was 1.81 nm. The d-spacing of Na-Mt with 7% KCl was 1.53 nm. The d-spacing of Na-Mt with 3% PEG and 7% KCl was 1.40 nm. The three d-spacing values were lower than the d-spacing related to hydrated Na-Mt (1.91 nm) (Xie et al. 2017), which indicates that the three inhibition sys-tems (KCl, PEG and PEG+KCl) can decrease d-spacing, repel water molecules of interlayer and inhibit hydration of Na-Mt. Therefore, the order of inhibition performance is as
follows: PEG+KCl > KCl > PEG. Moreover, the results of XRD also show the synergistic effect on the reduction in d-spacing.
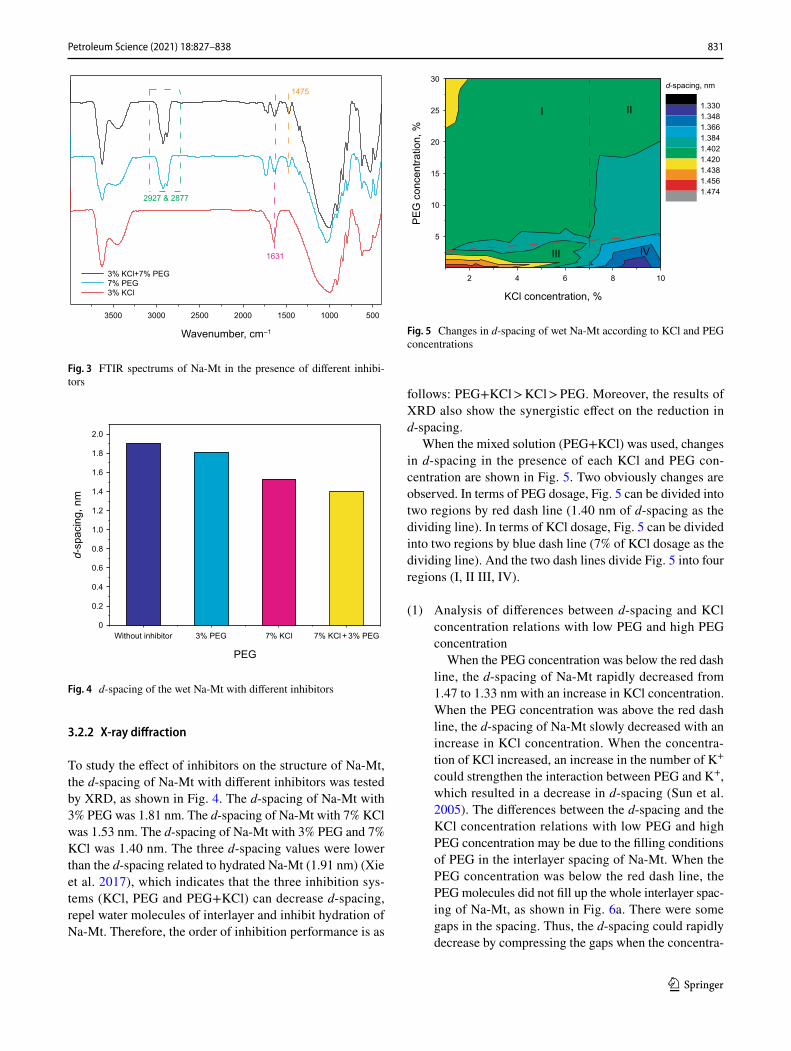
When the mixed solution (PEG+KCl) was used, changes in d-spacing in the presence of each KCl and PEG con-centration are shown in Fig. 5. Two obviously changes are observed. In terms of PEG dosage, Fig. 5 can be divided into two regions by red dash line (1.40 nm of d-spacing as the dividing line). In terms of KCl dosage, Fig. 5 can be divided into two regions by blue dash line (7% of KCl dosage as the dividing line). And the two dash lines divide Fig. 5 into four regions (I, II III, IV).
(1) Analysis of differences between d-spacing and KCl concentration relations with low PEG and high PEG concentration
When the PEG concentration was below the red dash line, the d-spacing of Na-Mt rapidly decreased from 1.47 to 1.33 nm with an increase in KCl concentration. When the PEG concentration was above the red dash line, the d-spacing of Na-Mt slowly decreased with an increase in KCl concentration. When the concentra-tion of KCl increased, an increase in the number of K+ could strengthen the interaction between PEG and K+, which resulted in a decrease in d-spacing (Sun et al. 2005). The differences between the d-spacing and the KCl concentration relations with low PEG and high PEG concentration may be due to the filling conditions of PEG in the interlayer spacing of Na-Mt. When the PEG concentration was below the red dash line, the PEG molecules did not fill up the whole interlayer spac-ing of Na-Mt, as shown in Fig. 6a. There were some gaps in the spacing. Thus, the d-spacing could rapidly decrease by compressing the gaps when the concentra-
3500 3000 2500 2000 1500 1000 500
1475
Wavenumber, cm-1
3% KCl+7% PEG7% PEG3% KCl
2927 & 2877
1631
Fig. 3 FTIR spectrums of Na-Mt in the presence of different inhibi-tors
Without inhibitor 3% PEG 7% KCl 7% KCl + 3% PEG0
0.2
0.4
0.6
0.8
1.0
1.2
1.4
1.6
1.8
2.0
dmn ,gnicaps-
PEG
Fig. 4 d-spacing of the wet Na-Mt with different inhibitors
2 4 6 8 10
5
10
15
20
25
30
III
II
% ,noitartnecnoc GEP
KCl concentration, %
1.3301.3481.3661.3841.4021.4201.4381.4561.474
d-spacing, nm
I
IV
Fig. 5 Changes in d-spacing of wet Na-Mt according to KCl and PEG concentrations

832 Petroleum Science (2021) 18:827–838
1 3
tion of KCl increased. When the PEG concentration was above the red dash line, it can be considered that PEG filled up the whole interlayer spacing of Na-Mt, as shown in Fig. 6b. The d-spacing of Na-Mt slowly decreased with KCl concentration, because there were not compressible gaps in the spacing of interlayer of Na-Mt.
(2) Analysis of differences between d-spacing and PEG concentration relations with low KCl and high KCl concentration
When the KCl concentration was below 7%, the d-spacing of Na-Mt initially decreased and then increased with an increase in PEG concentration. However, the d-spacing of Na-Mt showed an increased trend with increasing PEG concentration at the KCl concentration greater than 7%. The main difference of above behavior is at PEG concentration below the red dash line of Fig. 5. The differences between the d-spacing and the PEG concentration with low KCl and high KCl concentrations may be due to their different critical factors (accumulation height of PEG and hydra-tion radius of K+). When the KCl concentration was below 7%, the critical factor was the hydration radius of K+. When the concentration of PEG increased, more water molecules bonded with K+ were replaced by PEG molecules, which resulted in decreases in the hydration radius of K+ and d-spacing of Na-Mt. When the KCl concentration was above 7%, the d-spacing of Na-Mt increased with increasing PEG concentration, because more PEG molecules accumulated in the interlayer of Na-Mt. More importantly, it can be concluded that the
number of coordinated water molecules of coordination compound of PEG and KCl was significantly reduced at the KCl concentration above 7%.
In summary, based on the results and analysis of Fig. 5, the change of d-spacing with changes of KCl and PEG con-centrations can be concluded into two tables (Tables 2 and 3). Table 2 gives the critical factors of d-spacing of Na-Mt with difference in KCl and PEG concentrations. Table 3 gives the mutual behavior of different regions in Fig. 5.
3.3 KCl–PEG–Mt interaction mechanism by chemical characterization and SEM characterization
In the above part, we discussed the influence of two inhibi-tors on Na-Mt structure at different concentrations by tak-ing d-spacing as the index. However, the d-spacing is the result of multiple physical processes. In this section, these processes are studied further.
3.3.1 Elemental analysis
In order to reveal the interaction between KCl and PEG, the carbon content of Na-Mt/inhibitor complexes was tested by elemental analysis. Because Na-Mt only has low levels of organic carbon, the carbon content of Na-Mt/inhibitor complexes shows the adsorption quantity of PEG on Na-Mt. The carbon content analysis of the Na-Mt with 3% PEG
Water
PEG
Mt
(a) (b)
Fig. 6 Schematic of the PEG filling conditions. a PEG concentration below red dash line in Fig. 5; b PEG concentration above red dash line in Fig. 5
Table 2 The critical factors of d-spacing of Na-Mt with difference KCl and PEG concentrations
The region in Fig. 5 Critical factors
I Accumulation height of PEGII Accumulation height of PEGIII Hydration radius of K+
IV Accumulation height of PEG
Table 3 Mutual behavior of different regions in Fig. 5
Regions Mutual behaviors
I, II d-spacing slowly increases with an increase in KCl con-centration
III, IV d-spacing rapidly increases with an increase in KCl concentration
I, III d-spacing initially decreases and then increases with an increase in PEG concentration
II, IV d-spacing increases with an increase in PEG concentration

833Petroleum Science (2021) 18:827–838
1 3
and different KCl concentrations are shown in Fig. 7. With increasing KCl concentration from 0.1% to 4%, the adsorp-tion quantity of PEG increased, implying that KCl promoted PEG adsorption at this concentration range. This promotion effect is attributed to the mutual attraction between KCl and PEG (Yanagida et al. 1977, 1978a, b). With increasing KCl concentration from 4% to 11%, the adsorption quantity of PEG decreased, which indicates that KCl can inhibit the adsorption of PEG. This was likely due to the competitive adsorption relationship between PEG and KCl on the surface of Na-Mt. It can be concluded that the promotion effect was dominant when the KCl concentration was lower than 4%, while the competitive adsorption was dominant when the KCl concentration was higher than 4%.
3.3.2 Atomic absorption spectroscopy
To study the adsorption quantity of K+ and Na+, a series of Na-Mt with different concentrations of KCl and PEG were analyzed with an atomic absorption spectrophotom-eter. The adsorption capacity of Na-Mt with 3% PEG and different concentrations of KCl are shown in Fig. 8a. With an increase in KCl concentration, the adsorption quantity of Na+ rapidly decreased. The adsorption quantity of K+ adsorbed onto the clay surface increased with an increase in KCl concentration. The adsorption quantity of K+ and Na+ of Na-Mt with 7% KCl and different concentrations of PEG are shown in Fig. 8b. With an increase in PEG concentration, the adsorption quantity of Na+ remained unchanged, because the amount of K+ is sufficient to dis-place all the exchangeable cations at the KCl concentra-tion of 7%. Additionally, the adsorption amount of K+ decreased as the PEG concentration increased from 0.5% to 5%, and the adsorption amount remained constant after the PEG concentration was above 7%. These phenomena can be attributed to the different types of adsorption of K+. On the surface of Na-Mt, there are three types of adsorp-tion sites: oxygen atom of hexagonal site of silica, HAl and TAl, which are defined in Fig. 9 (Ruankaew et al. 2020). The main adsorption force of K+ is the isomorphic substi-tution in tetrahedral sheet and octahedral sheet (Li et al. 2018). So, the adsorption strength of the oxygen atom of hexagonal site of silica is lower than those of HAl and TAl. Based on the experimental results of atomic absorp-tion spectroscopy, it can be considered that the adsorp-tion sites of HAl and TAl are only occupied by K+, whose adsorption is not affected by PEG. The adsorption sites of the oxygen atom of hexagonal site of silica can be occu-pied by both K+ and PEG. And the adsorption amounts of K+ and PEG depend on their concentration ratio. Their
0 2 4 6 8 10 123.75
3.80
3.85
3.90
3.95
4.00
4.05
4.10
4.15
KCl concentration, %
% ,tnetnoc nobraC
Fig. 7 Carbon content of Na-Mt/inhibitor complexes with different KCl concentrations and 3% PEG
0 2 4 6 8 10 12 14 160
30
60
90
120
150
180
PEG concentration, %
g 001/lom
m ,tnetnoc noitaC
0 1 2 3 4 5 6 70
30
60
90
120
150
180
210(a) (b)
g 001/lom
m ,tnetnoc noitaC
KCl concentration, %
K+
Na+
K+
Na+
Fig. 8 Variations in cation content according to inhibitor concentrations: a different KCl concentrations and 3% PEG; b different PEG concen-trations and 7% KCl

834 Petroleum Science (2021) 18:827–838
1 3
competitive adsorption capacity increased when the PEG concentration increased from 0.5% to 5%, which resulted in an increase in the adsorption amount of PEG. When the PEG concentration was above 7%, all the sites of HAl and TAl were occupied by K+, and all the sites of the oxygen atom of hexagonal site of silica were occupied by PEG. Therefore, the adsorption amount of K+ is not affected by PEG concentration.
By comprehensive analysis of the results of elemen-tal analysis and atomic absorption spectrophotometry as shown in Fig. 10, the initial assessment of the optimal KCl concentrations can be performed. The PEG adsorption
capacity reached its peak when the KCl concentration is 4%. Nevertheless, as considering the adsorption of K+, the total adsorption reached its peak value when the KCl concentration is above 7%. Considering the cost, the KCl concentration range of 6%–8% is the most suitable. When the total adsorption reached the peak, the synergistic effect was most likely to be exerted. Therefore, the estimated concentration range had a good effect.
3.3.3 X‑ray photoelectron spectroscopy
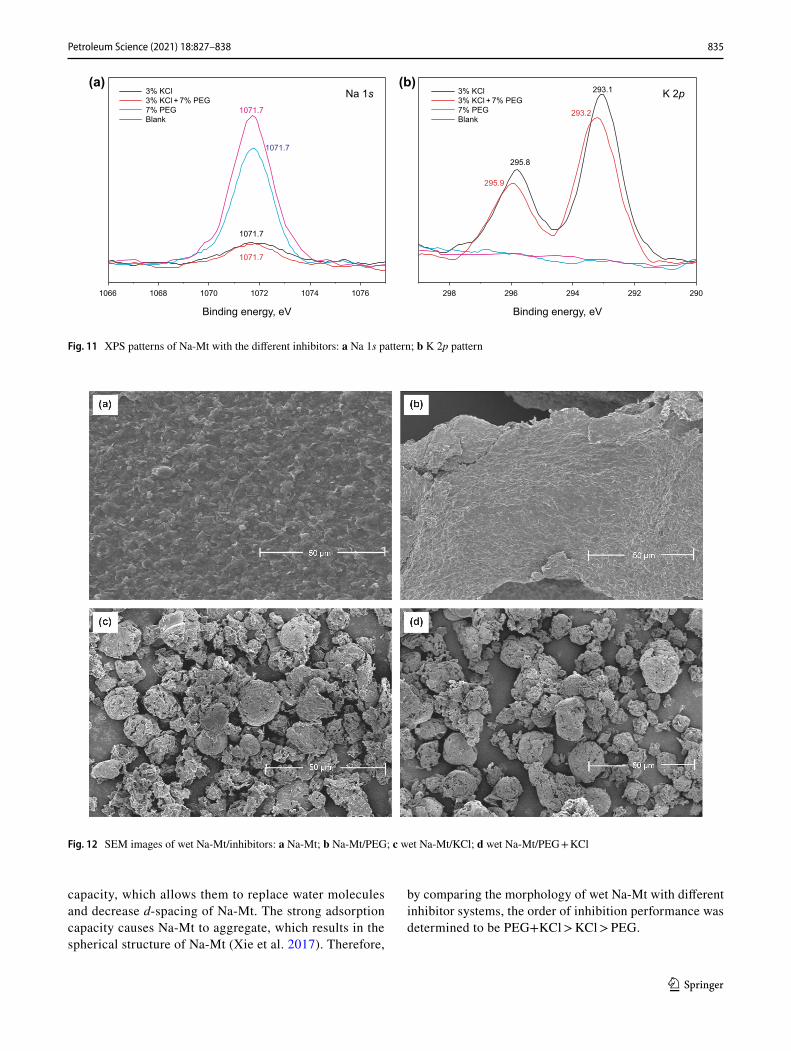
In order to demonstrate the substitution of Na+ by K+ and the synergistic effects of KCl and PEG, dry Na-Mt samples with different inhibitors were tested by XPS, as shown in Fig. 11. XPS can be used to investigate the surface com-position of Na-Mt with different inhibitors (Jiang et al. 2016). The XPS spectra of Na 1s of Na-Mt with differ-ent inhibitors are shown in Fig. 11a. Blank spectrum was tested with Na-Mt without inhibitors. Compared with the blank spectrum, the signal peak of Na-Mt with 3% KCl became weaker, which showed that KCl replaced Na+ in Na-Mt. In addition, the signal peak of Na-Mt with 3% KCl and 7% PEG was similar to that with 3% KCl. It sug-gests that PEG cannot influence the displacement of Na+ by KCl.
In the XPS spectra of K 2p of Na-Mt with different inhibitors (Fig. 11b), the blank spectrum was obtained without inhibitor and showed no K 2p signal, which indicates that Na-Mt does not contain K+. After addi-tion of 3% KCl, the signal peak became stronger. Then, after further addition of 7% PEG, the signal peak became weaker, which possibly resulted from competitive adsorp-tion between KCl and PEG on Na-Mt. This was confirmed through the elemental analysis in Sect. 3.3.1. Moreover, the Na-Mt/KCl binding energy of K 2p increased from 295.8, 293.1 to 295.9, 293.2 eV after PEG addition, imply-ing that PEG undergoes binding with K+. This was also demonstrated through the elemental analysis in Sect. 3.3.1.
3.3.4 Scanning electron microscopy
SEM was used to observe the morphology of wet Na-Mt with different inhibitor systems. The morphology of pure Na-Mt was a layered structure, as shown in Fig. 12a. Fol-lowing the addition of 3% PEG, the morphology of Na-Mt with PEG was still layered structure in Fig. 12b, which was similar to that of pure Na-Mt. After the addition of 7% KCl, some of the Na-Mt particles showed spherical struc-tures, as illustrated in Fig. 12c. When 3% PEG and 7% KCl were used together as a synergistic inhibitor, the majority of Na-Mt particles exhibited spherical structures, as shown in Fig. 12d. Inhibitors usually have strong adsorption
TAl
HAl
TSi
HSi
Fig. 9 A most top surface of Mt with the isomorphous replacement of silica by aluminum. Atomic legends were colored highlight as silica (light blue), oxygen (red), hydrogen (white) and aluminum (orange). Dotted triangles, TSi and TAl, represent the triangular site of silica and aluminum, respectively. Dotted hexagons, HSi and HAl, represent the hexagonal site next to the triangular site of silica and aluminum, respectively
0 2 4 6 8 10 120
100
200
300
400
500
600
g 001/lom
m ,tnetnoc tnemelE
KCl concentration, %
CKC+K
Fig. 10 Elemental contents with different KCl concentrations
835Petroleum Science (2021) 18:827–838
1 3
capacity, which allows them to replace water molecules and decrease d-spacing of Na-Mt. The strong adsorption capacity causes Na-Mt to aggregate, which results in the spherical structure of Na-Mt (Xie et al. 2017). Therefore,
by comparing the morphology of wet Na-Mt with different inhibitor systems, the order of inhibition performance was determined to be PEG+KCl > KCl > PEG.
1066 1068 1070 1072 1074 1076
3% KCl3% KCl + 7% PEG7% PEGBlank
Na 1s(a) (b)
1071.7
Binding energy, eV
1071.7
1071.7
1071.7
298 296 294 292 290
Binding energy, eV
K 2p
295.8
295.9
293.2
293.13% KCl3% KCl + 7% PEG7% PEGBlank
Fig. 11 XPS patterns of Na-Mt with the different inhibitors: a Na 1s pattern; b K 2p pattern
Fig. 12 SEM images of wet Na-Mt/inhibitors: a Na-Mt; b Na-Mt/PEG; c wet Na-Mt/KCl; d wet Na-Mt/PEG + KCl

836 Petroleum Science (2021) 18:827–838
1 3
3.4 Optimization of PEG and KCl concentrations
The optimization of PEG and KCl concentrations was as fol-lows: (1) XRD was used to identify the boundary of chang-ing trend in d-spacing with an increase in PEG concentra-tion. When concentration ranges of PEG and KCl were on the boundary (the red dash line in Fig. 5), the interlayer spacing of Na-Mt was filled up by PEG. Hence, the optimal concentration of PEG was in this range. (2) XRD was also used to identify the boundary of changing trend in d-spacing with an increase in KCl concentration. At the KCl concentra-tion above the boundary, the number of coordinated water molecules of the PEG–KCl coordination compound was sig-nificantly reduced. In consideration of cost, the optimal con-centration of KCl should be near the boundary (the blue dash line in Fig. 5). (3) The intersection of the above two bounda-ries represents the optimal KCl and PEG concentrations.
The optimal KCl and PEG concentrations should be near the intersection of the above two boundaries. Then, several con-centrations were selected, as shown in Fig. 13. The optimal KCl and PEG concentrations were chosen from the different concentrations by the shale hot rolling recovery test.
For the Na-Mt sample studied in this work, the optimal concentrations of PEG and KCl were obtained as 7% KCl and 5% PEG. Then, the optimization of PEG and KCl con-centrations was verified by a series of tests on Na-Mt. A set of water-based drilling fluids with different concentra-tions of KCl and PEG was designed. The corresponding basic rheological properties and API filtrate volumes are given in Table 4. The rheological properties and filtrate properties of the water-based drilling fluids are acceptable according to API RP 13B-2 (2005).
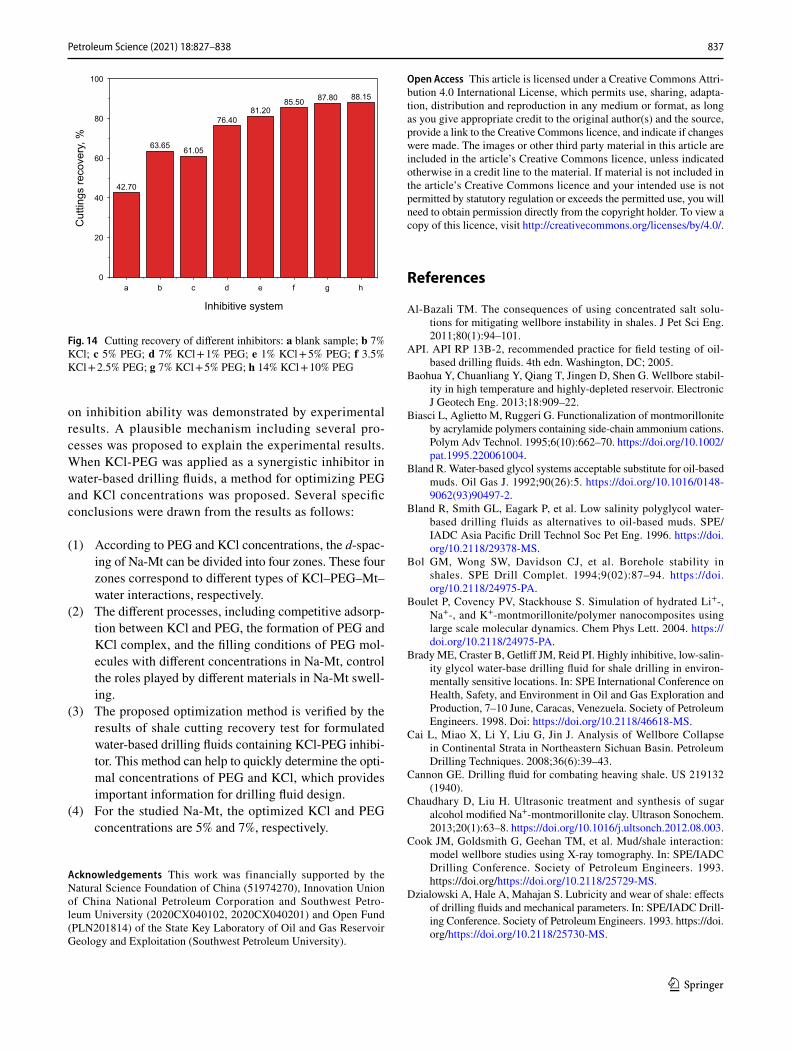
The shale hot rolling recovery results of water-based drilling fluids with different inhibitors are shown in Fig. 14. KCl and PEG improved the cutting recovery of the drilling fluids, indicating that both KCl and PEG can improve inhibition properties of water-based drilling flu-ids. The synergistic inhibitive effects of KCl and PEG were obvious, which resulted in higher cutting recovery. Moreo-ver, the higher the concentration, the higher the cutting recovery. When 14% KCl and 5% PEG were used together as synergistic inhibitors (Fig. 14h), both the rheological properties and filtrate properties of the drilling fluid were unacceptable for engineering practice. Thus, for the Na-Mt studied in this paper, 7% KCl and 5% PEG were deemed to be the optimal concentrations.
4 Conclusions
The synergistic inhibition performance of PEG and KCl was evaluated through hot rolling recovery tests and lin-ear swell tests on shale cuttings. For the inhibition of Na-Mt hydration, the synergistic effect of KCl and PEG
(a-1, b+1) (a, b+1) (a+1, b+1)
(a-1, b) (a, b)
a: PEG concentration, %; b: KCl concentration, %
(a+1, b)
(a-1, b-1) (a, b-1) (a+1, b-1)
Fig. 13 Schematic diagram of concentration optimization
Table 4 Rheological properties and API filtrate volumes of drilling fluids with different inhibitors after hot rolling (120 °C, 16 h)
Sample No. Inhibitors AV, mPa s PV, mPa s YP, Pa YP/PV, Pa/(mP s)
Gel strength (10 s/10 min), Pa
Filtrate volume, cm3
a Blank sample 27.0 24.0 6.0 0.25 4.0/4.5 11.4b 7% KCl 19.0 14.0 8.0 0.57 3.5/4.0 12.6c 5% PEG 27.0 23.0 7.0 0.30 3.0/4.0 8.4d 7% KCl + 1% PEG 24.0 20.0 7.0 0.35 3.0/4.0 10.6e 1% KCl + 5% PEG 26.5 22.0 7.5 0.34 3.0/3.5 7.8f 3.5% KCl + 2.5% PEG 28.0 24.0 8.0 0.35 3.5/4.0 8.2g 7% KCl + 5 wt% PEG 25.5 20.0 8.5 0.43 3.0/3.5 9.9h 14% KCl + 10% PEG 16.0 11.0 9.0 0.73 2.5/3.0 14.3
837Petroleum Science (2021) 18:827–838
1 3
on inhibition ability was demonstrated by experimental results. A plausible mechanism including several pro-cesses was proposed to explain the experimental results. When KCl-PEG was applied as a synergistic inhibitor in water-based drilling fluids, a method for optimizing PEG and KCl concentrations was proposed. Several specific conclusions were drawn from the results as follows:
(1) According to PEG and KCl concentrations, the d-spac-ing of Na-Mt can be divided into four zones. These four zones correspond to different types of KCl–PEG–Mt–water interactions, respectively.
(2) The different processes, including competitive adsorp-tion between KCl and PEG, the formation of PEG and KCl complex, and the filling conditions of PEG mol-ecules with different concentrations in Na-Mt, control the roles played by different materials in Na-Mt swell-ing.
(3) The proposed optimization method is verified by the results of shale cutting recovery test for formulated water-based drilling fluids containing KCl-PEG inhibi-tor. This method can help to quickly determine the opti-mal concentrations of PEG and KCl, which provides important information for drilling fluid design.
(4) For the studied Na-Mt, the optimized KCl and PEG concentrations are 5% and 7%, respectively.
Acknowledgements This work was financially supported by the Natural Science Foundation of China (51974270), Innovation Union of China National Petroleum Corporation and Southwest Petro-leum University (2020CX040102, 2020CX040201) and Open Fund (PLN201814) of the State Key Laboratory of Oil and Gas Reservoir Geology and Exploitation (Southwest Petroleum University).
Open Access This article is licensed under a Creative Commons Attri-bution 4.0 International License, which permits use, sharing, adapta-tion, distribution and reproduction in any medium or format, as long as you give appropriate credit to the original author(s) and the source, provide a link to the Creative Commons licence, and indicate if changes were made. The images or other third party material in this article are included in the article’s Creative Commons licence, unless indicated otherwise in a credit line to the material. If material is not included in the article’s Creative Commons licence and your intended use is not permitted by statutory regulation or exceeds the permitted use, you will need to obtain permission directly from the copyright holder. To view a copy of this licence, visit http://creat iveco mmons .org/licen ses/by/4.0/.
References
Al-Bazali TM. The consequences of using concentrated salt solu-tions for mitigating wellbore instability in shales. J Pet Sci Eng. 2011;80(1):94–101.
API. API RP 13B-2, recommended practice for field testing of oil-based drilling fluids. 4th edn. Washington, DC; 2005.
Baohua Y, Chuanliang Y, Qiang T, Jingen D, Shen G. Wellbore stabil-ity in high temperature and highly-depleted reservoir. Electronic J Geotech Eng. 2013;18:909–22.
Biasci L, Aglietto M, Ruggeri G. Functionalization of montmorillonite by acrylamide polymers containing side-chain ammonium cations. Polym Adv Technol. 1995;6(10):662–70. https ://doi.org/10.1002/pat.1995.22006 1004.
Bland R. Water-based glycol systems acceptable substitute for oil-based muds. Oil Gas J. 1992;90(26):5. https ://doi.org/10.1016/0148-9062(93)90497 -2.
Bland R, Smith GL, Eagark P, et al. Low salinity polyglycol water-based drilling fluids as alternatives to oil-based muds. SPE/IADC Asia Pacific Drill Technol Soc Pet Eng. 1996. https ://doi.org/10.2118/29378 -MS.
Bol GM, Wong SW, Davidson CJ, et al. Borehole stability in shales. SPE Drill Complet. 1994;9(02):87–94. https ://doi.org/10.2118/24975 -PA.
Boulet P, Covency PV, Stackhouse S. Simulation of hydrated Li+-, Na+-, and K+-montmorillonite/polymer nanocomposites using large scale molecular dynamics. Chem Phys Lett. 2004. https ://doi.org/10.2118/24975 -PA.
Brady ME, Craster B, Getliff JM, Reid PI. Highly inhibitive, low-salin-ity glycol water-base drilling fluid for shale drilling in environ-mentally sensitive locations. In: SPE International Conference on Health, Safety, and Environment in Oil and Gas Exploration and Production, 7–10 June, Caracas, Venezuela. Society of Petroleum Engineers. 1998. Doi: https ://doi.org/10.2118/46618 -MS.
Cai L, Miao X, Li Y, Liu G, Jin J. Analysis of Wellbore Collapse in Continental Strata in Northeastern Sichuan Basin. Petroleum Drilling Techniques. 2008;36(6):39–43.
Cannon GE. Drilling fluid for combating heaving shale. US 219132 (1940).
Chaudhary D, Liu H. Ultrasonic treatment and synthesis of sugar alcohol modified Na+-montmorillonite clay. Ultrason Sonochem. 2013;20(1):63–8. https ://doi.org/10.1016/j.ultso nch.2012.08.003.
Cook JM, Goldsmith G, Geehan TM, et al. Mud/shale interaction: model wellbore studies using X-ray tomography. In: SPE/IADC Drilling Conference. Society of Petroleum Engineers. 1993. https://doi.org/https ://doi.org/10.2118/25729 -MS.
Dzialowski A, Hale A, Mahajan S. Lubricity and wear of shale: effects of drilling fluids and mechanical parameters. In: SPE/IADC Drill-ing Conference. Society of Petroleum Engineers. 1993. https://doi.org/https ://doi.org/10.2118/25730 -MS.
42.70
63.65 61.05
76.4081.20
85.50 87.80 88.15
a b c d e f g h0
20
40
60
80
100% ,yrevocer sgnittu
C
Inhibitive system
Fig. 14 Cutting recovery of different inhibitors: a blank sample; b 7% KCl; c 5% PEG; d 7% KCl + 1% PEG; e 1% KCl + 5% PEG; f 3.5% KCl + 2.5% PEG; g 7% KCl + 5% PEG; h 14% KCl + 10% PEG

838 Petroleum Science (2021) 18:827–838
1 3
Guo J, Yan J, Fan W. Applications of strongly inhibitive silicate-based drilling fluids in troublesome shale formations in Sudan. J Pet-rol Sci Eng. 2006;50(3):195–203. https ://doi.org/10.1016/j.petro l.2005.12.006.
Hale AH, Blytas GC. Alcohol-in-oil drilling fluid system comprising polycyclic polyetherpolyol. US Patent 5198416 (1993).
Isinak A, Smith V, Alessandro FD, et al. Application of a complex pol-yol drilling fluid in Albania. Oil Gas Eur Magaz. 2005;31(3):124.
Jiang GC, Qi YR, An YX, et al. Polyethyleneimine as shale inhibitor in drilling fluid. Appl Clay Sci. 2016. https ://doi.org/10.1016/j.clay.2016.04.013.
Khodja M, Canselier PJ, Bergaya F, Fourar K, Khodja M, Cohaut N, Benmounah A. Shale problems and water-based drilling fluid optimization in the Hassi Messaoud Algerian oil field. Appl Clay Sci. 2010;49:383–93. https ://doi.org/10.1016/j.clay.2010.06.008.
Lee DH, Kim HS, Yoon KB, et al. Polyethylene/MMT nanocompos-ites prepared by in situ polymerization using supported catalyst systems. Sci Technol Adv Mater. 2005;6(5):457–62. https ://doi.org/10.1016/j.stam.2005.04.004.
Li W, Zhao X, Li Y, Ji Y, Peng H, Liu L, Yang Q. Laboratory investiga-tions on the effects of surfactants on rate of penetration in rotary diamond drilling. J Pet Sci Eng. 2015;134:114–22. https ://doi.org/10.1016/j.petro l.2015.07.027.
Li W, Zhao X, Ji Y, et al. Investigation of biodiesel-based drilling fluid, Part 2: formulation design, rheological study, and labo-ratory evaluation. SPE J. 2016b;21(05):1767–81. https ://doi.org/10.2118/18092 6-PA.
Li W, Zhao X, Ji Y, et al. Investigation of biodiesel-based drilling fluid, part 1: biodiesel evaluation, invert-emulsion properties, and devel-opment of a novel emulsifier package. SPE J. 2016a;21(05):1755–66. https ://doi.org/10.2118/18091 8-PA.
Li W, Zhao X, Ji Y, et al. An investigation on environmentally friendly biodiesel-based invert emulsion drilling fluid. J Pet Explor Prod Technol. 2016c;6(3):505–17. https ://doi.org/10.1007/s1320 2-015-0205-7.
Li W, Liu J, Zhao X, Zhang J, Jiang J, He T, Liu L, Shen P, Zhang M. Novel modified rectorite provides reliable rheology and sus-pendability for biodiesel based drilling fluid. In: SPE/IADC Mid-dle East Drilling Technology Conference and Exhibition, Abu Dhabi, UAE, 29–31 January, 2018. https://doi.org/https ://doi.org/10.2118/18931 0-MS.
Li W, Liu J, Zhao X, Jiang J, Peng H, Zhang M, He T, Liu G, Shen P. Development and screening of additives for biodiesel based drill-ing fluids: principles, strategies and experience. In: SPE Interna-tional Conference on Oilfield Chemistry, Galveston, Texas, USA, 8–9 April, 2019. https://doi.org/https ://doi.org/10.2118/19359 7-MS.
Li W, Liu J, Zeng J, et al. A fully coupled multidomain and mul-tiphysics model for evaluation of shale gas extraction. Fuel. 2020;15(278):118214. https ://doi.org/10.1016/j.fuel.2020.11821 4.
Liu D, Xue B, Li J, Zhang Y, Liang Z, Cheng Z, et al. Research and Application of Heavy Mud Technology in Strong Mud-making Formations. Drill Fluid Complet Fluid. 2006;23(5):4–7.
Mody FK, Hale AH. Borehole-stability model to couple the mechanics and chemistry of drilling-fluid/shale interactions. J Pet Technol. 1993. https ://doi.org/10.2118/25728 -PA.
Qian X, Zhang J. Exploration and development technology of shale oil and gas in the world: progress, impact, and implication. IOP Conf Ser Earth Environ ENCE. 2020;526:012131.
Raza Khan MS, Pratap V, Sharma KC, Anilkumar BS, Gupta AK. Polyol drilling fluid: a novel solution to curb recurring drilling and
completion problems in mature Sobhasan Field, Mehsana Asset, ONGC, India. In: SPE/IADC Indian Drilling Technology Confer-ence and Exhibition, 16–18 October, Mumbai, India. Society of Petroleum Engineers. 2006. https ://doi.org/10.2118/10204 0-MS.
Reid PI, Craster B, Crawshaw JP, et al. Drilling fluid. US Patent 6544933 (2003).
Ruankaew N, Kristinawati A, Yoshida N, Phongphanphanee S. A 3D-RISM study of water and potassium ion adsorption in Montmorillonite nanoclay. IOP Conf Ser Mater Sci Eng. 2020;773:012060.
Sartori R, Sepulveda L, Quina F, et al. Binding of electrolytes to poly (ethylene oxide) in aqueous solutions. Macromolecules. 1990;23(17):3878–81. https ://doi.org/10.1021/ma002 19a00 2.
Smith CK, Balson TG. Shale-stabilizing additives. US Patent 6706667 (2004).
Steiger R, Leung PK. Quantitative determination of the mechanical properties of shales. SPE Drill Eng. 1992;7(3):181–5. https ://doi.org/10.2118/18024 -PA.
Sun MB, Hou WG, Sun DJ, Dai XN. Interaction mechanism study on poly(ethylene oxide)-clay-alkali metal ion intercalation compos-ites. Acta Chim Sinica. 2005;63(7):562–6.
Tasaki K. Poly (oxyethylene)–cation interactions in aqueous solution: a molecular dynamics study. Comput Theor Polym Sci. 1999;9(3–4):271–84. https ://doi.org/10.1016/S1089 -3156(99)00015 -X.
Theng BKG. The chemistry of clay-organic reactions. Chem Clay-Org React. 1974. https ://doi.org/10.2136/sssaj 1975.03615 99500 39000 20002 x.
Twynam AJ, Caldwell PA, Meads K. Glycol-enhanced water-based muds: case history to demonstrate improved drilling efficiency in tectonically stressed shales. In: SPE/IADC Drilling Confer-ence. Society of Petroleum Engineers. 1994. doi: https ://doi.org/10.2118/27451 -MS.
van Oort E. On the physical and chemical stability of shales. J Pet-rol Sci Eng. 2003;38(3):213–35. https ://doi.org/10.1016/S0920 -4105(03)00034 -2.
van Oort E, Hoxha BB, Hale A, et al. How to test fluids for shale compatibility. In: The AADE Fluids Technical Conference and Exhibition. American Association of Drilling Engineers, Houston, USA. 2016;1–9.
Wang Y, Meng Y, Li G, Li Y. Factor analysis of pressure used in man-aged pressure drilling on injected gas. Oil Drilling & Production Technology. 2009;31(1):31–4.
Xie G, Luo P, Deng M, et al. Intercalation behavior of branched polyethyleneimine into sodium bentonite and its effect on rheo-logical properties. Appl Clay Sci. 2017;141:95–103. https ://doi.org/10.1016/j.clay.2017.02.018.
Yanagida S, Takahashi K, Okahara M. Metal-ion complexation of noncyclic poly (oxyethylene) derivatives. I. Solvent extraction of alkali and alkaline earth metal thiocyanates and iodides. Bull Chem Soc Jpn. 1977;50(6):1386–90. https ://doi.org/10.1246/bcsj.50.1386.
Yanagida S, Takahashi K, Okahara M. Metal-ion complexation of noncyclic poly (oxyethylene) derivatives. II. PMR studies of the complexation with alkali and alkaline-earth metal cations. Bull Chem Soc Jpn. 1978;51(5):1294–9. https ://doi.org/10.1246/bcsj.51.1294.
Yanagida S, Takahashi K, Okahara M. Metal-ion complexation of non-cyclic poly (oxyethylene) derivatives. Complexation in aprotic solvent and isolation of their solid complexes. Bull Chem Soc Jpn. 1978;51(11):3111–20. https ://doi.org/10.1246/bcsj.51.3111.


