Synergistic data-driven travel demand management based on...
9
Synergistic data-driven travel demand management based on phone records Yan Leng Masachusetts Institute of Technology Media Lab Cambridge, MA 02139, USA [email protected] Larry Rudolph Two Sigma LP & Masachusetts Institute of Technology New York, NY, USA [email protected] Jinhua Zhao Masachusetts Institute of Technology Department of Urban Studies and Planning Cambridge, MA 02139, USA [email protected] Haris N. Koutsopolous Masachusetts Institute of Technology Civil and Environmental Engineering Boston , MA 02115, USA [email protected] Alex ‘Sandy’ Pentland Masachusetts Institute of Technology Media Lab Cambridge, MA 02139, USA [email protected] ABSTRACT Traffic congestion has increasingly threatened urban development economically, societally, and environmentally. Leisure trips con- tribute to 79% of the total travel demand. However, leisure trips suffer from the ‘richer-get-richer’ effect, leading to congestion ex- acerbation. We address this issue with a novel data-driven travel demand management framework by recommending locations based on the phone records. In particular, we infer unobserved location preferences using Matrix Factorization from longitudinal mobility histories. We then formulate an constrained optimization problem to maximize preferences regarding recommended locations while accounting for constraints imposed by road capacity. Our case study shows that under full compliance rate, congestion falls by 52% at a cost of 31% less location satisfaction. Under 60% compliance rate, 41% travel delay is saved with a 17% reduction in satisfaction. This study highlights the effectiveness of the synergy among collective behaviors in improving system efficiency. KEYWORDS Travel demand management, Congestion alleviation, Call Detail Records, Constrained Optimization ACM Reference format: Yan Leng, Larry Rudolph, Jinhua Zhao, Haris N. Koutsopolous, and Alex ‘Sandy’ Pentland. 2017. Synergistic data-driven travel demand management based on phone records . In Proceedings of ACM KDD UrbComp’17, Halifax, Nova Scotia, Canada, , 9 pages. https://doi.org/10.1145/nnnnnnn.nnnnnnn Permission to make digital or hard copies of part or all of this work for personal or classroom use is granted without fee provided that copies are not made or distributed for profit or commercial advantage and that copies bear this notice and the full citation on the first page. Copyrights for third-party components of this work must be honored. For all other uses, contact the owner/author(s). ACM KDD UrbComp’17, , Halifax, Nova Scotia, Canada © 2017 Copyright held by the owner/author(s). ACM ISBN 978-x-xxxx-xxxx-x/YY/MM. . . $15.00 https://doi.org/10.1145/nnnnnnn.nnnnnnn 1 INTRODUCTION Traffic congestion presents increasingly severe world-wide threats to urban areas, causing huge time lost, monetary costs, environmen- tal deterioration, energy wastes and fatal accidents. Take the United States as an example, the extra economic cost of congestion due to time and fuel was estimated to be $160 billion in 2014. Furthermore, negative congestion impacts spread from peak commuting hours to midday and overnight, generating approximately additional 41% of the total travel delay during these periods [14]. Meanwhile, U.S. Travel Association released the travel statistic of 2016, concluding that 79% of domestic trips taken are for leisure purposes, with a total number of 1.7 billion person-trips (U.S. residents) and $106.4 billion tax revenues 1 [8]. Naturally, an inquiry comes to mind is how to manage the leisure trips and flexible travel demand to partly address the congestion problem. Leisure travelers, by definition, are more flexible in terms of time and destinations than commuting trips. As an illustrative example shown in Figure 1, individuals’ preferences regarding (location · time) bundles are relatively indif- ferent from one another when above a certain threshold, indicating the elasticities of leisure trips [15]. This indicates that the paradigm to manage the travel demand of leisure purposes has the potential to relieve the congestion to a large degree [24]. Nonetheless, little research has geared towards managing flexible travel demand in particular. Another concern, however, rises when people make decisions on destinations or activities are the ‘richer-get-richer’ or ‘preferential attachment’ effect. Namely, popular locations and activities will be recommended either via mouth-to-mouth spreading or various recommendation engines, further causing severe coordination fail- ure. This calls for meticulous and optimized coordinations of travel destinations and travel time [13, 15, 27]. Centralized coordination platform for distributed trips has grown to become even more nec- essary with the increasing of leisure travel demand. Specifically, it increments internationally and domestically by around 4.2% to 6.6% since 2010 respectively [1]. We argue that balancing and co- ordinating traffic flow should be centrally optimized as a demand 1 Top leisure trips of U.S. domestic travelers include visiting relatives, shopping, visiting friends, fine dining and rural sightseeing.
Transcript of Synergistic data-driven travel demand management based on...
Synergistic data-driven travel demand management based onphone records
Yan LengMasachusetts Institute of Technology
Media LabCambridge, MA 02139, USA
Larry RudolphTwo Sigma LP & Masachusetts
Institute of TechnologyNew York, NY, USA
Jinhua ZhaoMasachusetts Institute of TechnologyDepartment of Urban Studies and
PlanningCambridge, MA 02139, USA
Haris N. KoutsopolousMasachusetts Institute of TechnologyCivil and Environmental Engineering
Boston , MA 02115, [email protected]
Alex ‘Sandy’ PentlandMasachusetts Institute of Technology
Media LabCambridge, MA 02139, USA
ABSTRACTTraffic congestion has increasingly threatened urban developmenteconomically, societally, and environmentally. Leisure trips con-tribute to 79% of the total travel demand. However, leisure tripssuffer from the ‘richer-get-richer’ effect, leading to congestion ex-acerbation. We address this issue with a novel data-driven traveldemand management framework by recommending locations basedon the phone records. In particular, we infer unobserved locationpreferences using Matrix Factorization from longitudinal mobilityhistories. We then formulate an constrained optimization problemto maximize preferences regarding recommended locations whileaccounting for constraints imposed by road capacity. Our case studyshows that under full compliance rate, congestion falls by 52% at acost of 31% less location satisfaction. Under 60% compliance rate,41% travel delay is saved with a 17% reduction in satisfaction. Thisstudy highlights the effectiveness of the synergy among collectivebehaviors in improving system efficiency.
KEYWORDSTravel demand management, Congestion alleviation, Call DetailRecords, Constrained Optimization
ACM Reference format:Yan Leng, Larry Rudolph, Jinhua Zhao, Haris N. Koutsopolous, and Alex‘Sandy’ Pentland. 2017. Synergistic data-driven travel demand managementbased on phone records . In Proceedings of ACM KDD UrbComp’17, Halifax,Nova Scotia, Canada, , 9 pages.https://doi.org/10.1145/nnnnnnn.nnnnnnn
Permission to make digital or hard copies of part or all of this work for personal orclassroom use is granted without fee provided that copies are not made or distributedfor profit or commercial advantage and that copies bear this notice and the full citationon the first page. Copyrights for third-party components of this work must be honored.For all other uses, contact the owner/author(s).ACM KDD UrbComp’17, , Halifax, Nova Scotia, Canada© 2017 Copyright held by the owner/author(s).ACM ISBN 978-x-xxxx-xxxx-x/YY/MM. . . $15.00https://doi.org/10.1145/nnnnnnn.nnnnnnn
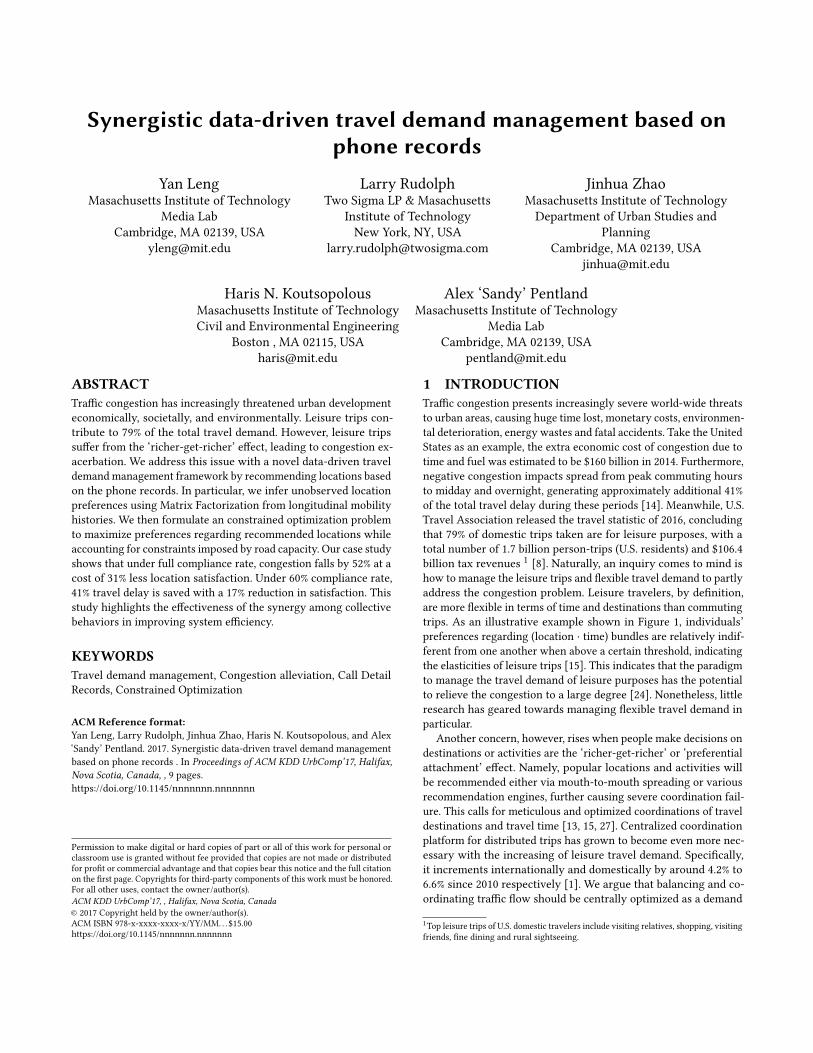
1 INTRODUCTIONTraffic congestion presents increasingly severe world-wide threatsto urban areas, causing huge time lost, monetary costs, environmen-tal deterioration, energy wastes and fatal accidents. Take the UnitedStates as an example, the extra economic cost of congestion due totime and fuel was estimated to be $160 billion in 2014. Furthermore,negative congestion impacts spread from peak commuting hoursto midday and overnight, generating approximately additional 41%of the total travel delay during these periods [14]. Meanwhile, U.S.Travel Association released the travel statistic of 2016, concludingthat 79% of domestic trips taken are for leisure purposes, with atotal number of 1.7 billion person-trips (U.S. residents) and $106.4billion tax revenues 1 [8]. Naturally, an inquiry comes to mind ishow to manage the leisure trips and flexible travel demand to partlyaddress the congestion problem. Leisure travelers, by definition,are more flexible in terms of time and destinations than commutingtrips. As an illustrative example shown in Figure 1, individuals’preferences regarding (location · time) bundles are relatively indif-ferent from one another when above a certain threshold, indicatingthe elasticities of leisure trips [15]. This indicates that the paradigmto manage the travel demand of leisure purposes has the potentialto relieve the congestion to a large degree [24]. Nonetheless, littleresearch has geared towards managing flexible travel demand inparticular.
Another concern, however, rises when people make decisions ondestinations or activities are the ‘richer-get-richer’ or ‘preferentialattachment’ effect. Namely, popular locations and activities willbe recommended either via mouth-to-mouth spreading or variousrecommendation engines, further causing severe coordination fail-ure. This calls for meticulous and optimized coordinations of traveldestinations and travel time [13, 15, 27]. Centralized coordinationplatform for distributed trips has grown to become even more nec-essary with the increasing of leisure travel demand. Specifically,it increments internationally and domestically by around 4.2% to6.6% since 2010 respectively [1]. We argue that balancing and co-ordinating traffic flow should be centrally optimized as a demand
1Top leisure trips of U.S. domestic travelers include visiting relatives, shopping, visitingfriends, fine dining and rural sightseeing.
ACM KDD UrbComp’17, , Halifax, Nova Scotia, Canada Y. Leng et al.
Figure 1: An illustration on choice flexibilities. A choice bun-dle is a combination of spatial and temporal decisions. X-axis showsvarious choice bundles and y-axis shows an individual’s preferencesregarding each choice bundle (the higher the preference, the betterthe choice bundle for this individual). Individual preferences uponleisure activities are unconstrained within certain space of spatialand temporal choices. Trading primary choice with the secondaryone does not sacrifice noticeable utility, which in turn, gain notablecollective travel time savings.
management strategy by policy makers with an analysis of theinterplay between user preferences and systematic travel delay.Furthermore, individual travel time can also be reduced to avoidthe unpredicted travel delay caused by stochastic traffic flow [2].
The availability of large-scale geo-localized data from mobile de-vices, such as the Call Detail Records (CDR) used in this study, offersan unprecedented opportunity for location-based service providersand governments to understand human mobility patterns in or-der to provide better services and improve system performances[11, 23, 39]. CDR is an opportunistic dataset that is collected bymobile phone carriers for billing purposes - making it a widely-prevalent, readily available, longitudinal and even real-time datasource. The comprehensive picture of population-wide travel be-haviors, more inclusive than almost all other data sources, enablespolicy-makers and transportation agencies to intervene from aholistic perspective. Given the promising applications of CDR intransportation, it has rarely been applied to manage travel demandas a decision-making tool apart from understanding existing travelpatterns [4, 15, 28]. The central power of policy-makers with acollection of information both involving travelers from the demandside and the detailed traffic infrastructure from the supply side,can be taken advantage of in order to build a travel demand man-agement system not only satisfying personal preferences but alsomaking efficient use of the system capacity.
To address the above mentioned issue, this paper proposes a data-driven travel demand management framework for policy-makersto mitigates the adverse effects of flexible travel demand whilerespecting the needs of all stakeholders using a personalized anddistributed travel recommendation engine. We show that the spon-taneous travel decisions lead to severe traffic congestion; whileexiting location recommendation engines aggravate the situation.
In this work, we develop a novel recommendation engine for au-thorities to optimize system performance by trading-off betweensatisfied preferences and road congestions. We use Bayesian Non-negative Matrix Factorization (BNMF) to infer travelers’ implicitpreferences, exploiting the underlying similarities of locations andtravelers. We then formulate an inequality constrained optimiza-tion problem to maximize satisfied location preferences at the userlevel under pre-defined road congestion constraints. Lastly, weidentify the target population for distributing recommendations byintegrating the system with a next-location prediction approachusing Recurrent Neural Network. With an implementation on theCDR data in Andorra under various compliance rates, we show theeffectiveness of the method. Specifically, under a 100% compliancerate, a 52% reduction in travel delay (from 11.73 minutes per hourto 5.61 minutes per hour) only sacrifices 31% satisfaction regardingthe recommendations. Similarly, under a 60% compliance rate, a41% reduction in travel delay (to 6.98 minutes per hour) sacrifices17% in satisfaction regarding the recommendations. The obviousadvantage of the method lies in the slight sacrifice of individual util-ity in return of the benefits for a larger population and the societyas a whole.
The paper is organized as follows. Section 2 summarizes currentliterature regarding travel demand management and location rec-ommendations. The data sources this study rely on are described insection 3. Section 4 demonstrates the framework and the detailedsteps, including traffic flow estimation, preference inference, systemefficiency maximization and identification of the target population.Section 5 evaluates the method with an application to the countryof Andorra under various compliance rates. Section 6 concludesthe paper and discusses future directions.
2 RELATEDWORKS2.1 Travel demand managementTravel Demand Management (TDM) encompasses strategies thatalter demand patterns to increase transportation system efficiency,in contrast with adding more capacities to the system [24]. Withlow coast and easy-to-implement characteristics, TDM has broadapplications in energy savings, air quality improvements, peakperiod congestion alleviation, etc [19].
Different categories of TDM strategies include, economic poli-cies, physical change measures, legal policies, and information oreducation measures [21, 24]. Our study implicitly connects witheconomic policies. The traditional strategies of economic policiesinclude taxing vehicles, congestion pricing, lowering transit costs,etc [24, 37].
However, Most of the existing TDM strategies ignore flexibletravel demand, which differentiates our work from prior research.More specifically, our study differentiates itself from existing TDMstrategies in several aspects:
• We focus on travel demandwith leisure purposes, the flexiblenature of which can be manipulated at the destination andtime-of-day levels.
• We propose to use a new large-scale and readily-availablebehavioral data, Call Detail Records, to support our TDM
Synergistic data-driven travel demand management based on phone records ACM KDD UrbComp’17, , Halifax, Nova Scotia, Canada
strategy for policy makers. We argue that this can be de-veloped into a new direction supplementing existing datasources mostly focus on travel surveys and census.
2.2 Location recommendationsThe innate characteristic of learning users’ preference from sparsevisitation pattens links our study with the location recommendationliterature. In the early 2010s, several studies introduced traditionalrecommender engines to personalized location recommendation.Since then, a prosperous collection of papers have sprouted in thisarea. Ye (2011) [42] introduced user-based and item-based Collabo-rative Filtering (CF) to location recommendations using check-indata, based on the assumption that similar users have similar tastesand users are interested in similar Points of Interests (POIs). Ber-jani (2011) [10] employed the more effective and efficient matrixfactorization in POI recommendations on check-in history. Quercia(2010) [35] is the only work that makes recommendations usingmobile phone data, which, however, only applies an inefficient andhard-to-scale item-based CF [40, 42].
Yet, the application of existing methods, ignoring service capac-ity constraints, will result in traffic congestions and exacerbatetravel experiences, no matter how sophisticated these methods arein inferring preferences. Therefore, our paper has the followingimprovements:
• We argue that capacity constraints, currently ignored byexisting literature, are in-negligible factors of location rec-ommendation. This is the central novelty of our study.
• We develop a framework to recommend locations for systemefficiency based on Call Detail Record. It can be appliedin other cities when call records (or other large-scale datasources, such as WiFi, GPS, Smart-card transactions, etc),traffic counts and road network GIS files are available.
2.3 Next-location predictionAccurate next-location predictions, given previous footprints fromthese data sources, is a significant building block benefiting manyareas, including mobile advertising, public transit planning, andurban infrastructure management [5, 22, 30, 34]. It is therefore anincreasingly popular topic in pervasive computing based on GPS,bluetooth, check-in histories, etc. Obviously, different data sourcesvary in terms of resolutions at spatiotemporal scales, representative-ness of the population and the availability of contextual information[16]. Most researchers build Markov models and predict longitudesand latitudes as continuous variables based on previous travel tra-jectories [6, 7, 20]. For example, Mathew [31] predicts next-locationusing a Hidden Markov Model with contextual information cap-tured by hidden factors, such as activities and purposes. Domenico[16] and Alhasoun [5] utilize mobility correlations, either measuredby social interactions or mutual information, to improve accura-cies. Even though extensive researches have acceptable accuracy inpredicting next locations on GPS or social media check-in histories,the performance is poor with Call Detail Record, which is sparse inspace and time [5].
In this paper, we propose a new perspective by mapping mobilitybehaviors based on Call Detail Record as sentences. This enablesus to introduce the application of Recurrent Neural Network, a
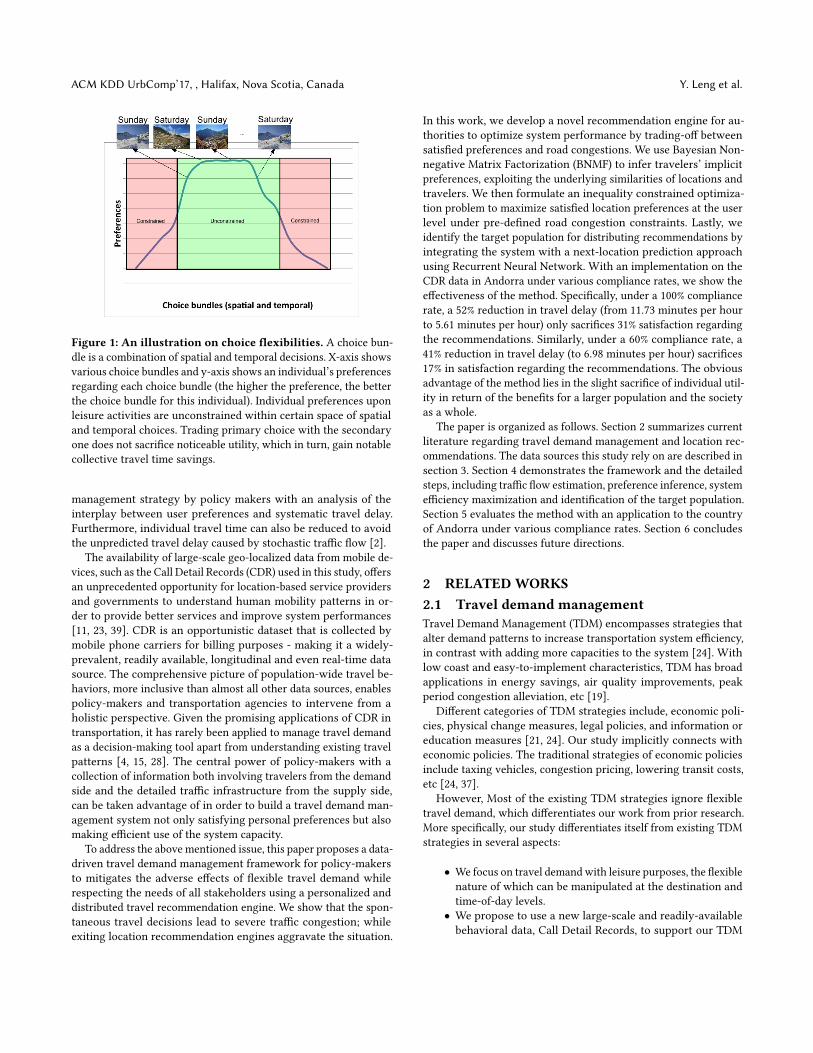
Figure 2: Snapshot of Call Detail Records.
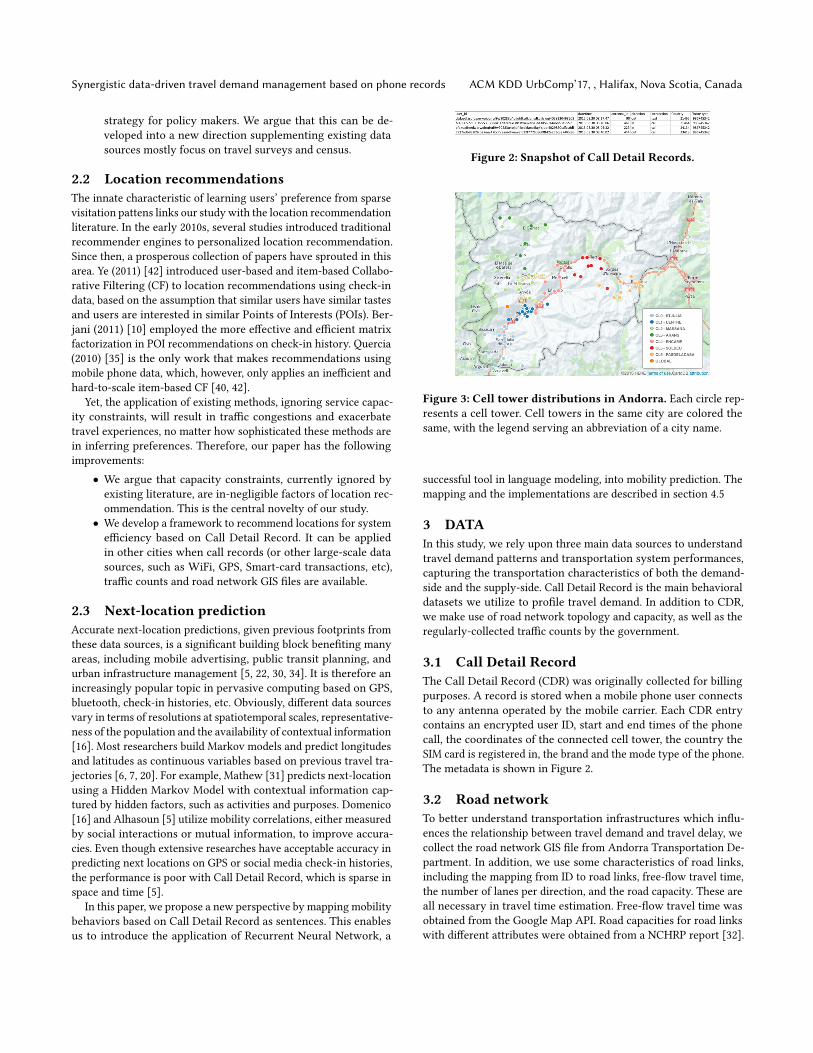
Figure 3: Cell tower distributions in Andorra. Each circle rep-resents a cell tower. Cell towers in the same city are colored thesame, with the legend serving an abbreviation of a city name.
successful tool in language modeling, into mobility prediction. Themapping and the implementations are described in section 4.5
3 DATAIn this study, we rely upon three main data sources to understandtravel demand patterns and transportation system performances,capturing the transportation characteristics of both the demand-side and the supply-side. Call Detail Record is the main behavioraldatasets we utilize to profile travel demand. In addition to CDR,we make use of road network topology and capacity, as well as theregularly-collected traffic counts by the government.
3.1 Call Detail RecordThe Call Detail Record (CDR) was originally collected for billingpurposes. A record is stored when a mobile phone user connectsto any antenna operated by the mobile carrier. Each CDR entrycontains an encrypted user ID, start and end times of the phonecall, the coordinates of the connected cell tower, the country theSIM card is registered in, the brand and the mode type of the phone.The metadata is shown in Figure 2.
3.2 Road networkTo better understand transportation infrastructures which influ-ences the relationship between travel demand and travel delay, wecollect the road network GIS file from Andorra Transportation De-partment. In addition, we use some characteristics of road links,including the mapping from ID to road links, free-flow travel time,the number of lanes per direction, and the road capacity. These areall necessary in travel time estimation. Free-flow travel time wasobtained from the Google Map API. Road capacities for road linkswith different attributes were obtained from a NCHRP report [32].
ACM KDD UrbComp’17, , Halifax, Nova Scotia, Canada Y. Leng et al.
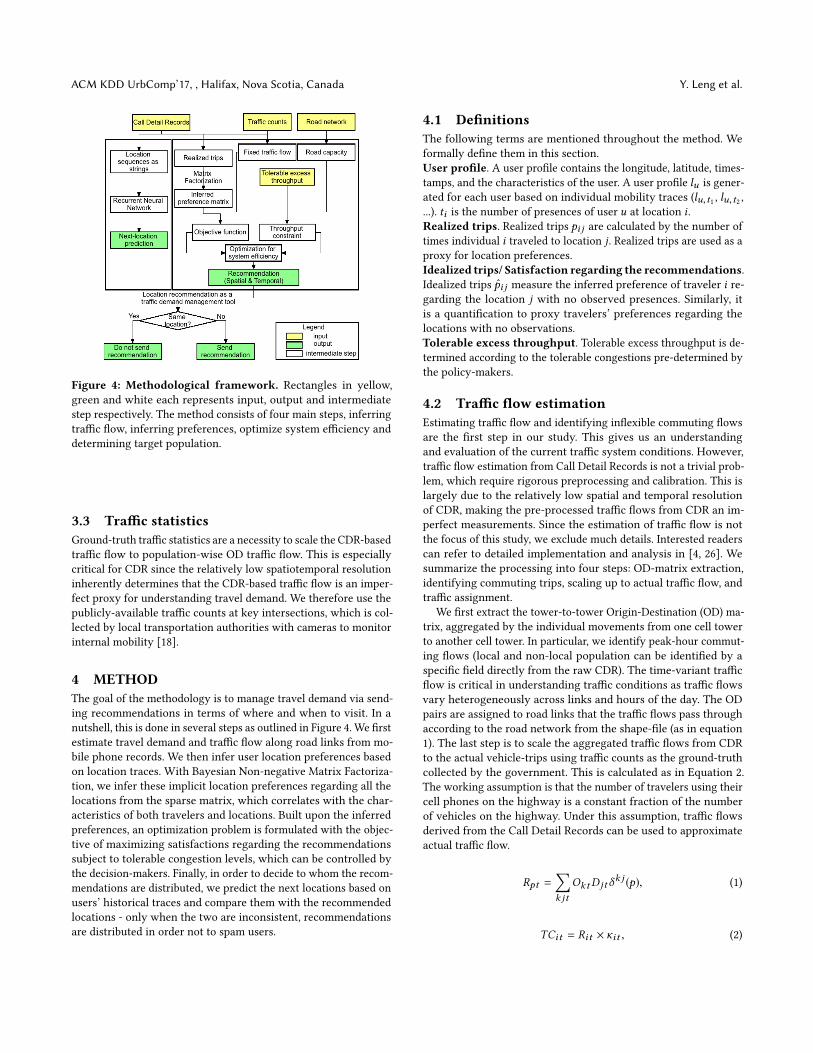
Figure 4: Methodological framework. Rectangles in yellow,green and white each represents input, output and intermediatestep respectively. The method consists of four main steps, inferringtraffic flow, inferring preferences, optimize system efficiency anddetermining target population.
3.3 Traffic statisticsGround-truth traffic statistics are a necessity to scale the CDR-basedtraffic flow to population-wise OD traffic flow. This is especiallycritical for CDR since the relatively low spatiotemporal resolutioninherently determines that the CDR-based traffic flow is an imper-fect proxy for understanding travel demand. We therefore use thepublicly-available traffic counts at key intersections, which is col-lected by local transportation authorities with cameras to monitorinternal mobility [18].
4 METHODThe goal of the methodology is to manage travel demand via send-ing recommendations in terms of where and when to visit. In anutshell, this is done in several steps as outlined in Figure 4. We firstestimate travel demand and traffic flow along road links from mo-bile phone records. We then infer user location preferences basedon location traces. With Bayesian Non-negative Matrix Factoriza-tion, we infer these implicit location preferences regarding all thelocations from the sparse matrix, which correlates with the char-acteristics of both travelers and locations. Built upon the inferredpreferences, an optimization problem is formulated with the objec-tive of maximizing satisfactions regarding the recommendationssubject to tolerable congestion levels, which can be controlled bythe decision-makers. Finally, in order to decide to whom the recom-mendations are distributed, we predict the next locations based onusers’ historical traces and compare them with the recommendedlocations - only when the two are inconsistent, recommendationsare distributed in order not to spam users.
4.1 DefinitionsThe following terms are mentioned throughout the method. Weformally define them in this section.User profile. A user profile contains the longitude, latitude, times-tamps, and the characteristics of the user. A user profile lu is gener-ated for each user based on individual mobility traces (lu,t1 , lu,t2 ,...). ti is the number of presences of user u at location i .Realized trips. Realized trips pi j are calculated by the number oftimes individual i traveled to location j . Realized trips are used as aproxy for location preferences.Idealized trips/ Satisfaction regarding the recommendations.Idealized trips pi j measure the inferred preference of traveler i re-garding the location j with no observed presences. Similarly, itis a quantification to proxy travelers’ preferences regarding thelocations with no observations.Tolerable excess throughput. Tolerable excess throughput is de-termined according to the tolerable congestions pre-determined bythe policy-makers.
4.2 Traffic flow estimationEstimating traffic flow and identifying inflexible commuting flowsare the first step in our study. This gives us an understandingand evaluation of the current traffic system conditions. However,traffic flow estimation from Call Detail Records is not a trivial prob-lem, which require rigorous preprocessing and calibration. This islargely due to the relatively low spatial and temporal resolutionof CDR, making the pre-processed traffic flows from CDR an im-perfect measurements. Since the estimation of traffic flow is notthe focus of this study, we exclude much details. Interested readerscan refer to detailed implementation and analysis in [4, 26]. Wesummarize the processing into four steps: OD-matrix extraction,identifying commuting trips, scaling up to actual traffic flow, andtraffic assignment.
We first extract the tower-to-tower Origin-Destination (OD) ma-trix, aggregated by the individual movements from one cell towerto another cell tower. In particular, we identify peak-hour commut-ing flows (local and non-local population can be identified by aspecific field directly from the raw CDR). The time-variant trafficflow is critical in understanding traffic conditions as traffic flowsvary heterogeneously across links and hours of the day. The ODpairs are assigned to road links that the traffic flows pass throughaccording to the road network from the shape-file (as in equation1). The last step is to scale the aggregated traffic flows from CDRto the actual vehicle-trips using traffic counts as the ground-truthcollected by the government. This is calculated as in Equation 2.The working assumption is that the number of travelers using theircell phones on the highway is a constant fraction of the numberof vehicles on the highway. Under this assumption, traffic flowsderived from the Call Detail Records can be used to approximateactual traffic flow.
Rpt =∑k jt
OktD jtδk j (p), (1)
TCit = Rit × κit , (2)
Synergistic data-driven travel demand management based on phone records ACM KDD UrbComp’17, , Halifax, Nova Scotia, Canada
where p is the index of road link, t is the index for hour of day,OkD j represents OD pair with origin j and destination k , Rpt isthe vehicle trips along road link p during time period t , TC is theactual traffic counts and κ is the scaling factor. δk j (p) is an indica-tor function, which equals 1 when traffic flow originating from kand targeting at j passes through link p. Due to the heterogeneityof traffic flow across time and space, we calculate scaling factorsseparately for each road link during each time period.
4.3 Preference inferenceAs no explicit review or rating regarding locations is available inCDR, we propose to use visiting frequencies/ realized trips as aproxy for location preferences. The problem this section tackles isto infer user’ preferences regarding all other locations.
We use Bayesian Non-negative Matrix Factorization, a latentfactormodel, to infer travelers’ preferences regarding locations withno observations. The decomposition of visiting frequency matrixcharacterizes both the locations and users by vector of factorsinferred from location visiting patterns, mapping both travelers andlocations to a joint latent factor space of dimensionalityk . The latentfactor space determines why and how travelers prefer or dislikeeach location based on hidden characteristics. The hidden factorscan be interpreted as personal interests or land use categories. Highcorrespondence between location and user factors, based on thecharacterization of both the locations and the travelers, leads to arecommendation [29].
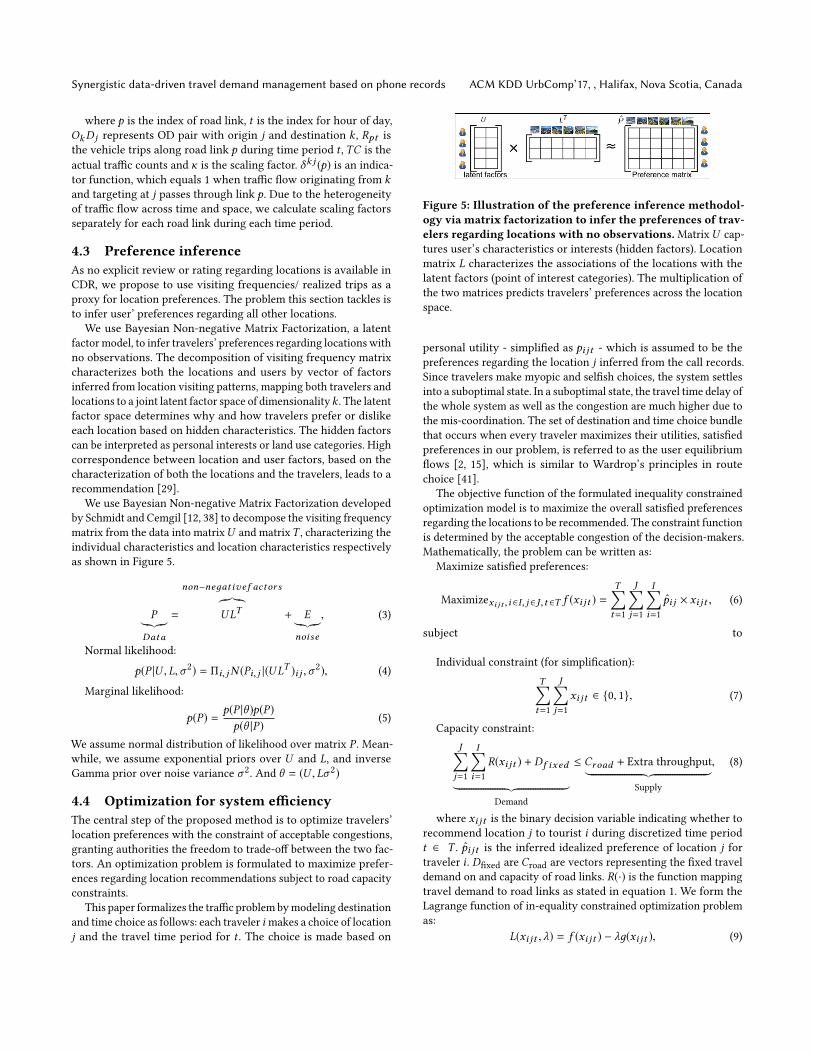
We use Bayesian Non-negative Matrix Factorization developedby Schmidt and Cemgil [12, 38] to decompose the visiting frequencymatrix from the data into matrixU and matrixT , characterizing theindividual characteristics and location characteristics respectivelyas shown in Figure 5.
P︸︷︷︸Data
=
non−neдativef actors︷︸︸︷ULT + E︸︷︷︸
noise
, (3)
Normal likelihood:
p(P |U ,L,σ 2) = Πi, jN (Pi, j |(ULT )i j ,σ 2), (4)
Marginal likelihood:
p(P) = p(P |θ )p(P)p(θ |P) (5)
We assume normal distribution of likelihood over matrix P . Mean-while, we assume exponential priors over U and L, and inverseGamma prior over noise variance σ 2. And θ = (U ,Lσ 2)
4.4 Optimization for system efficiencyThe central step of the proposed method is to optimize travelers’location preferences with the constraint of acceptable congestions,granting authorities the freedom to trade-off between the two fac-tors. An optimization problem is formulated to maximize prefer-ences regarding location recommendations subject to road capacityconstraints.
This paper formalizes the traffic problem bymodeling destinationand time choice as follows: each traveler i makes a choice of locationj and the travel time period for t . The choice is made based on
Figure 5: Illustration of the preference inference methodol-ogy via matrix factorization to infer the preferences of trav-elers regarding locations with no observations.MatrixU cap-tures user’s characteristics or interests (hidden factors). Locationmatrix L characterizes the associations of the locations with thelatent factors (point of interest categories). The multiplication ofthe two matrices predicts travelers’ preferences across the locationspace.
personal utility - simplified as pi jt - which is assumed to be thepreferences regarding the location j inferred from the call records.Since travelers make myopic and selfish choices, the system settlesinto a suboptimal state. In a suboptimal state, the travel time delay ofthe whole system as well as the congestion are much higher due tothe mis-coordination. The set of destination and time choice bundlethat occurs when every traveler maximizes their utilities, satisfiedpreferences in our problem, is referred to as the user equilibriumflows [2, 15], which is similar to Wardrop’s principles in routechoice [41].
The objective function of the formulated inequality constrainedoptimization model is to maximize the overall satisfied preferencesregarding the locations to be recommended. The constraint functionis determined by the acceptable congestion of the decision-makers.Mathematically, the problem can be written as:
Maximize satisfied preferences:
Maximizexi jt ,i ∈I, j ∈J ,t ∈T f (xi jt ) =T∑t=1
J∑j=1
I∑i=1
pi j × xi jt , (6)
subject to
Individual constraint (for simplification):T∑t=1
J∑j=1
xi jt ∈ {0, 1}, (7)
Capacity constraint:J∑j=1
I∑i=1
R(xi jt ) + Df ixed︸ ︷︷ ︸Demand
≤ Croad + Extra throughput︸ ︷︷ ︸Supply
, (8)
where xi jt is the binary decision variable indicating whether torecommend location j to tourist i during discretized time periodt ∈ T . pi jt is the inferred idealized preference of location j fortraveler i . Dfixed are Croad are vectors representing the fixed traveldemand on and capacity of road links. R(·) is the function mappingtravel demand to road links as stated in equation 1. We form theLagrange function of in-equality constrained optimization problemas:
L(xi jt , λ) = f (xi jt ) − λд(xi jt ), (9)
ACM KDD UrbComp’17, , Halifax, Nova Scotia, Canada Y. Leng et al.
д(xi jt ) = Croad + Extra throughput −J∑j=1
I∑i=1
R(xi jt − Dfixed)
(10)One compelling characteristic of our optimization framework
is that it can be easily extended to incorporate more factors fromboth from the user characteristics and from the systematic per-formance perspective. We only consider users’ preferences in theutility function,Uit =max j ∈J x(ijt). More variables, such as traveltime and travel monetary costs, can be added to better surrogate forthe utility, for exampleUit = β0+β1max j ∈J x(ijt)+β2travel time+β3travel cost. Additional constraints can be added to incorporatemore societal benefits, such as lower energy consumption, smallernegative environmental impact, and diversified social interactions,etc.
4.5 Identifying target population -Next-location prediction with NeuralNetwork
In order to distribute recommendations more efficiently, the laststep of the framework aims to identify the target population whosepredicted next-locations are inconsistent with the one to be recom-mended. The problem can simply be formulated as predicting thenext-locations of individuals based on historical location traces.
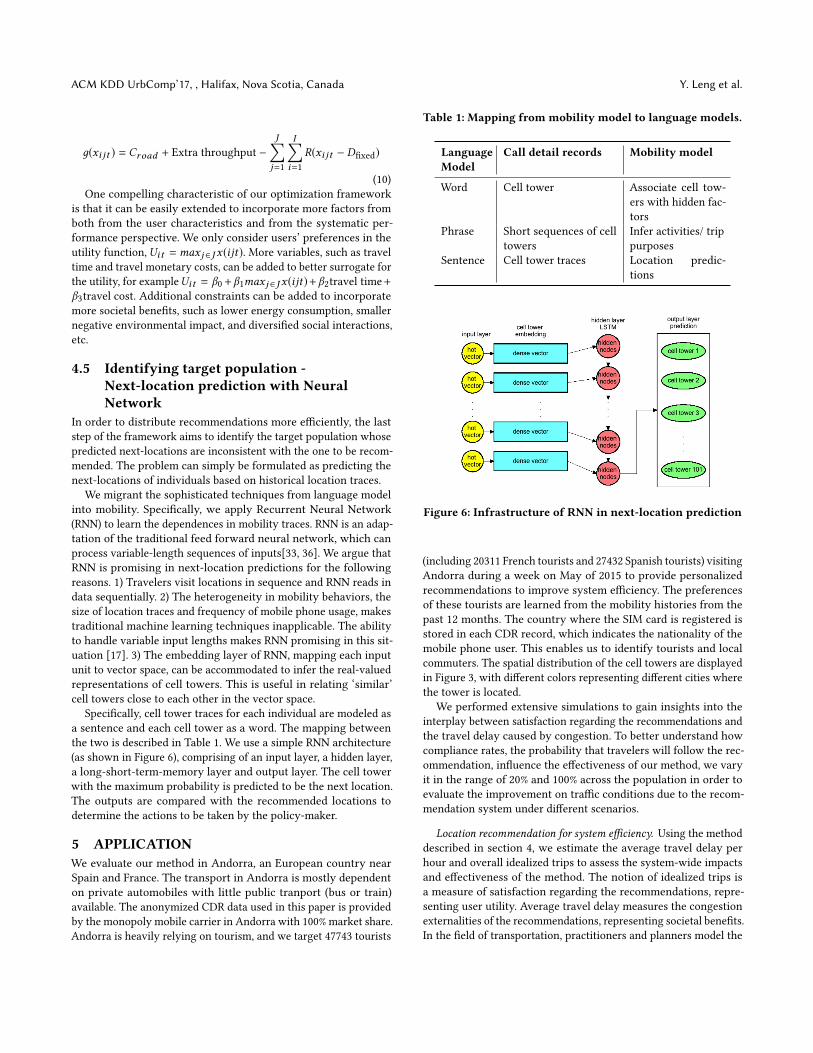
We migrant the sophisticated techniques from language modelinto mobility. Specifically, we apply Recurrent Neural Network(RNN) to learn the dependences in mobility traces. RNN is an adap-tation of the traditional feed forward neural network, which canprocess variable-length sequences of inputs[33, 36]. We argue thatRNN is promising in next-location predictions for the followingreasons. 1) Travelers visit locations in sequence and RNN reads indata sequentially. 2) The heterogeneity in mobility behaviors, thesize of location traces and frequency of mobile phone usage, makestraditional machine learning techniques inapplicable. The abilityto handle variable input lengths makes RNN promising in this sit-uation [17]. 3) The embedding layer of RNN, mapping each inputunit to vector space, can be accommodated to infer the real-valuedrepresentations of cell towers. This is useful in relating ‘similar’cell towers close to each other in the vector space.
Specifically, cell tower traces for each individual are modeled asa sentence and each cell tower as a word. The mapping betweenthe two is described in Table 1. We use a simple RNN architecture(as shown in Figure 6), comprising of an input layer, a hidden layer,a long-short-term-memory layer and output layer. The cell towerwith the maximum probability is predicted to be the next location.The outputs are compared with the recommended locations todetermine the actions to be taken by the policy-maker.
5 APPLICATIONWe evaluate our method in Andorra, an European country nearSpain and France. The transport in Andorra is mostly dependenton private automobiles with little public tranport (bus or train)available. The anonymized CDR data used in this paper is providedby the monopoly mobile carrier in Andorra with 100% market share.Andorra is heavily relying on tourism, and we target 47743 tourists
Table 1: Mapping from mobility model to language models.
LanguageModel
Call detail records Mobility model
Word Cell tower Associate cell tow-ers with hidden fac-tors
Phrase Short sequences of celltowers
Infer activities/ trippurposes
Sentence Cell tower traces Location predic-tions
Figure 6: Infrastructure of RNN in next-location prediction
(including 20311 French tourists and 27432 Spanish tourists) visitingAndorra during a week on May of 2015 to provide personalizedrecommendations to improve system efficiency. The preferencesof these tourists are learned from the mobility histories from thepast 12 months. The country where the SIM card is registered isstored in each CDR record, which indicates the nationality of themobile phone user. This enables us to identify tourists and localcommuters. The spatial distribution of the cell towers are displayedin Figure 3, with different colors representing different cities wherethe tower is located.
We performed extensive simulations to gain insights into theinterplay between satisfaction regarding the recommendations andthe travel delay caused by congestion. To better understand howcompliance rates, the probability that travelers will follow the rec-ommendation, influence the effectiveness of our method, we varyit in the range of 20% and 100% across the population in order toevaluate the improvement on traffic conditions due to the recom-mendation system under different scenarios.
Location recommendation for system efficiency. Using the methoddescribed in section 4, we estimate the average travel delay perhour and overall idealized trips to assess the system-wide impactsand effectiveness of the method. The notion of idealized trips isa measure of satisfaction regarding the recommendations, repre-senting user utility. Average travel delay measures the congestionexternalities of the recommendations, representing societal benefits.In the field of transportation, practitioners and planners model the
Synergistic data-driven travel demand management based on phone records ACM KDD UrbComp’17, , Halifax, Nova Scotia, Canada
Table 2: Results comparisons. ∆t is the average travel delay dur-ing the peak hour. Idealized trips measure travelers’ satisfaction re-garding the recommended locations. Comp. is short for compliancerate. User optimal is the baseline model where recommendationsare only based on user preferences.
Scenario ∆t (min/h) Idealized tripsUser optimal 11.73 64925100% comp. 5.61 4493080% comp. 6.17 4999760% comp. 6.98 5368040% comp. 8.37 5744220% comp. 10.40 61219
relationships between traffic flow and travel time based on the char-acteristics of the road infrastructure. One of the most widely usedmethods is the Bureau of Public Road function (BPR) [3], whichmodels travel time as a function of the ratio between actual traf-fic volume and road capacity, volume-over-capacity (VOC) [9], asshown in Equation (11).
t(fsim) = tfff × (1 + α(V /C)β ) (11)
Average travel delay:
∆t = t(fsim) − t(fff) (12)
where t(fff) and t(fsim) are the free flow and simulated travel timeon the road segment. ∆t is the delay caused by congestion, α andβ are parameters used to characterize the non-linear relationshipbetweenV /C and tsim . The default parameter for the BPR equationare α = 0.15 and β = 4.
We compare ourmethodwith a baselinemodel, referred to as useroptimal method. This method make recommendations by maximiz-ing overall user utilities - preferences regarding the recommendedlocations. Evaluation results are shown in Table 2, which summa-rize average travel delay per hour and idealized trips of: 1) useroptimal method; 2) the proposed method under various compliancerates. Idealized trips, one of the metrics used to evaluate the method,are aggregated as
∑i jpi j . Under full compliance rate, the average
travel delay is 5.61 minutes per hour with 44930 idealized trips,which indicates that with a 52% reduction in congestion time, andonly 31% of idealized trips are sacrificed. When the compliance ratereduces to 80%, a 47% reduction in congestion time is achieved withonly 23% of idealized trips being sacrificed. In general, the lowerthe compliance rate, the larger the idealized trips and the longerthe travel delay.
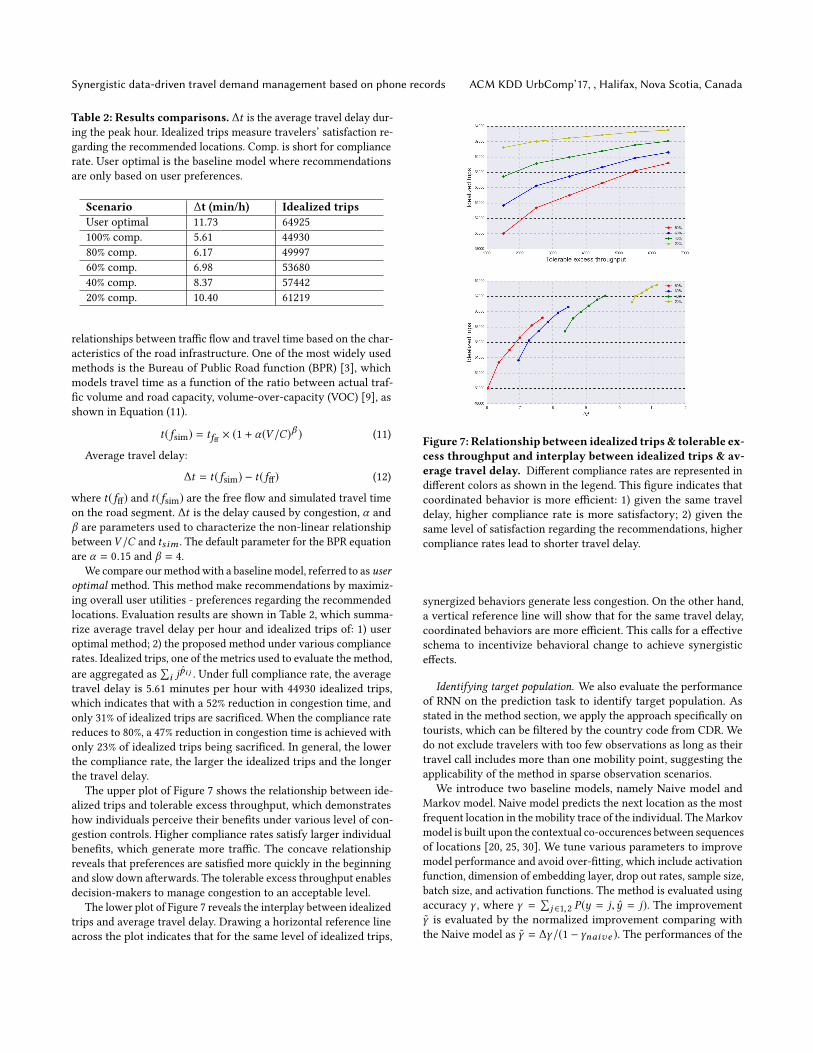
The upper plot of Figure 7 shows the relationship between ide-alized trips and tolerable excess throughput, which demonstrateshow individuals perceive their benefits under various level of con-gestion controls. Higher compliance rates satisfy larger individualbenefits, which generate more traffic. The concave relationshipreveals that preferences are satisfied more quickly in the beginningand slow down afterwards. The tolerable excess throughput enablesdecision-makers to manage congestion to an acceptable level.
The lower plot of Figure 7 reveals the interplay between idealizedtrips and average travel delay. Drawing a horizontal reference lineacross the plot indicates that for the same level of idealized trips,
Figure 7: Relationship between idealized trips& tolerable ex-cess throughput and interplay between idealized trips & av-erage travel delay. Different compliance rates are represented indifferent colors as shown in the legend. This figure indicates thatcoordinated behavior is more efficient: 1) given the same traveldelay, higher compliance rate is more satisfactory; 2) given thesame level of satisfaction regarding the recommendations, highercompliance rates lead to shorter travel delay.
synergized behaviors generate less congestion. On the other hand,a vertical reference line will show that for the same travel delay,coordinated behaviors are more efficient. This calls for a effectiveschema to incentivize behavioral change to achieve synergisticeffects.
Identifying target population. We also evaluate the performanceof RNN on the prediction task to identify target population. Asstated in the method section, we apply the approach specifically ontourists, which can be filtered by the country code from CDR. Wedo not exclude travelers with too few observations as long as theirtravel call includes more than one mobility point, suggesting theapplicability of the method in sparse observation scenarios.
We introduce two baseline models, namely Naive model andMarkov model. Naive model predicts the next location as the mostfrequent location in themobility trace of the individual. TheMarkovmodel is built upon the contextual co-occurences between sequencesof locations [20, 25, 30]. We tune various parameters to improvemodel performance and avoid over-fitting, which include activationfunction, dimension of embedding layer, drop out rates, sample size,batch size, and activation functions. The method is evaluated usingaccuracy γ , where γ =
∑j ∈1,2 P(y = j, y = j). The improvement
γ is evaluated by the normalized improvement comparing withthe Naive model as γ = ∆γ/(1 − γnaive ). The performances of the
ACM KDD UrbComp’17, , Halifax, Nova Scotia, Canada Y. Leng et al.
Table 3: Accuracy comparisons of Naive, Markov and RNN
Accuracy ImprovementNaive model 50% NAMarkov model 54% 8%
RNN 67% 34%
model are shown in Table 3, which shows that we out-perform 34%in the accuracy comparing with the Naive model.
6 DISCUSSIONSTraffic congestions have caused tremendous economic costs andgenerated severe urban issues across the world, deteriorating the en-vironments, increase energy consumptions, wasting huge amountsof time, blocking emergency vehicles and calling for resources foradditional infrastructures. Further, travel delays have expandedfrom commuting hours to midday and midnights by about 41%compare to free flow traffic [14]. Additional statistics shows thatabout 79% travels are non-work related, which are flexible in spaceand time by nature [8]. However, most existing transportationresearch targets peak-hour commuting traffic flows. In contrast,flexible travel demand is the population that this paper targets.In this work, we propose a low-cost solution utilizing existing in-formation infrastructure to develop a centralized travel demandmanagement tool - a space-time recommendation engine - to dis-tribute traffic flows and divert travelers to various locations in orderto gain more travel-time savings and improve travel experiencesboth for individuals and the society as a whole.
Our results suggest that uncoordinated individual travel deci-sions, without accounting for system efficiency, lead to traffic con-gestion; Furthermore, existing location recommendation or mouth-to-mouth influence exacerbates the situation due to the ‘richer-get-richer’ effect. In particular, we propose a travel demand man-agement framework, recommending locations and time based onwidely-existing and the most pervasive Call Detail Records basedon a centralized optimization system accounting for both individualpreferences and systematic capacity. The framework distinguishesitself from existing methods by different targeted demand - leisuretravelers - and the trading-off between system capacity and indi-vidual preferences as a recommendation engine and travel demandmanagement tool. The combination of recommendation and systemefficiency is also a novel aspect of our study which are ignored byexisting location recommendation engines. Our framework andpipeline are composed of four step: estimating traffic flow, inferlocation preferences, centralized optimizing for system efficiencyand identifying target population.
We simulate traffic flows with our method as a case study in An-dorra, revealing a noticeable impact in reducing traffic congestionwith moderate sacrifices on individual preferences. For example,under 100% compliance rate, there is a 52% reduction in travel delay(from 11.73 minutes per hour to 5.61 minutes per hour) with 31%dissatisfaction rate regarding the recommendations. Even with amuch smaller compliance rate, under 60%, there is a 41% reductionin travel delay (to 6.98 minutes per hour) with only a 17% dissatis-faction rate. The simultaneous trade-off between congestion relief
and overall satisfied location preferences from the simulation re-sults indicates that moderate sacrifices for individual utilities leadto significant collective travel-time savings.
This research opens up several promising directions to extendthe synergistic travel demand management framework with perva-sive technologies. Given different objectives of the policy-makers,more systematic measures can be consolidated into the frameworkby enriching the optimization problem. Other systematic measures,such as air pollution, energy consumptions, can be factored intothe constraints for a more systematic and customized evaluationsand improvements of the system. In addition to the system-side ex-tensions, detailed travel planning, including transportation modes,budges, and routes, can be supplemented to augment the user utilityfunctions.
In addition, the proof-of-concept simulations in this study, asa first attempt, demonstrate the effectiveness of the synergistictravel demand management tool in distributing travel delay andcongestions. The natural future direction is to investigate the designof mechanisms to incentivize users to slightly sacrifice perceivedimmediate benefits for more societal gains. This includes design-ing information configurations for travelers, such as strategicallypresent information accounting for travelers’ willingness to ac-cept or using dynamic pricing mechanism to optimally shift traveldemand. Moreover, it is interesting to propose a comprehensiveframework of for practical applications, detailing the distributionchannel, frequencies, target markets, from game-theoretic, behav-ioral economics and marketing science perspective.
ACKNOWLEDGMENTSThe authors would like to thank Changing Places Group at MITMedia Lab, directed by Professor Kent Larson, for initiating theproject and the collaboration.We acknowledge Luis Alonso, ArnaudGrignard, Nuria Macia for the helpful discussions. We would alsolike to thank Andorra Telecom for the data and technical support.
REFERENCES[1] World Tourism Organization (2016). UNWTO Annual Report 2015. Technical
Report.[2] Daron Acemoglu, Ali Makhdoumi, Azarakhsh Malekian, and Asuman Ozdaglar.
2016. Informational Braess’ Paradox: The Effect of Information on Traffic Con-gestion. arXiv preprint arXiv:1601.02039 (2016).
[3] Rahmi Akcelik. 1991. Travel time functions for transport planning purposes:Davidson’s function, its time dependent form and alternative travel time function.Australian Road Research 21, 3 (1991).
[4] Lauren Alexander, Shan Jiang, Mikel Murga, and Marta C González. 2015. Origin–destination trips by purpose and time of day inferred from mobile phone data.Transportation Research Part C: Emerging Technologies (2015).
[5] Fahad Alhasoun, May Alhazzani, and Marta C González. 2016. City Scale NextPlace Prediction from Sparse Data through Similar Strangers. (2016).
[6] Akinori Asahara, Kishiko Maruyama, Akiko Sato, and Kouichi Seto. 2011.Pedestrian-movement prediction based on mixed Markov-chain model. In Pro-ceedings of the 19th ACM SIGSPATIAL international conference on advances ingeographic information systems. ACM, 25–33.
[7] Daniel Ashbrook and Thad Starner. 2003. Using GPS to learn significant locationsand predict movement across multiple users. Personal and Ubiquitous Computing7, 5 (2003), 275–286.
[8] U.S. Travel Association. (????).[9] Moshe Ben-Akiva and Michel Bierlaire. 1999. Discrete choice methods and their
applications to short term travel decisions. In Handbook of transportation science.Springer, 5–33.
[10] Betim Berjani and Thorsten Strufe. 2011. A recommendation system for spotsin location-based online social networks. In Proceedings of the 4th Workshop onSocial Network Systems. ACM, 4.
Synergistic data-driven travel demand management based on phone records ACM KDD UrbComp’17, , Halifax, Nova Scotia, Canada
[11] Dirk Brockmann, Lars Hufnagel, and Theo Geisel. 2006. The scaling laws ofhuman travel. Nature 439, 7075 (2006), 462–465.
[12] Ali Taylan Cemgil. 2009. Bayesian inference for nonnegative matrix factorisationmodels. Computational Intelligence and Neuroscience 2009 (2009).
[13] Serdar Çolak, Antonio Lima, and Marta C González. 2016. Understanding con-gested travel in urban areas. Nature communications 7 (2016).
[14] Tim Lomax Jim Bak David Schrank, Bill Eisele. 2015. 2015 Urban Mobility Score-card. Technical Report. Texas A&M Transportation Institute.
[15] Manlio De Domenico, Antonio Lima, Marta C González, and Alex Arenas. 2015.Personalized routing for multitudes in smart cities. EPJ Data Science 4, 1 (2015),1–11.
[16] Manlio De Domenico, Antonio Lima, and Mirco Musolesi. 2013. Interdependenceand predictability of humanmobility and social interactions. Pervasive and MobileComputing 9, 6 (2013), 798–807.
[17] Wim De Mulder, Steven Bethard, and Marie-Francine Moens. 2015. A survey onthe application of recurrent neural networks to statistical language modeling.Computer Speech & Language 30, 1 (2015), 61–98.
[18] Departament D’Estadistica. 2016. INTERNAL MOBILITY. (2016).http://www.estadistica.ad/serveiestudis/web/banc_dades4.asp?lang=4&codi_tema=11&codi_divisio=1701&codi_subtemes=207
[19] FHWA. 2014. Travel demand management. (2014). http://www.ops.fhwa.dot.gov/tdm/
[20] Sébastien Gambs, Marc-Olivier Killijian, and Miguel Núñez del Prado Cortez.2012. Next place prediction using mobility markov chains. In Proceedings of theFirst Workshop on Measurement, Privacy, and Mobility. ACM, 3.
[21] Tommy Gärling and Geertje Schuitema. 2007. Travel demand managementtargeting reduced private car use: effectiveness, public acceptability and politicalfeasibility. Journal of Social Issues 63, 1 (2007), 139–153.
[22] João Bártolo Gomes, Clifton Phua, and Shonali Krishnaswamy. 2013. Where willyou go? mobile data mining for next place prediction. In Data Warehousing andKnowledge Discovery. Springer, 146–158.
[23] Marta C Gonzalez, Cesar A Hidalgo, and Albert-Laszlo Barabasi. 2008. Under-standing individual human mobility patterns. Nature 453, 7196 (2008), 779–782.
[24] Anne Anne Fire Halvorsen. 2015. Improving transit demand management withSmart Card data: general framework and applications. Ph.D. Dissertation. Mas-sachusetts Institute of Technology.
[25] Hsun-Ping Hsieh, Cheng-Te Li, and Xiaoqing Gao. 2015. T-Gram: A Time-AwareLanguage Model to Predict Human Mobility. In Ninth International AAAI Confer-ence on Web and Social Media.
[26] Md Shahadat Iqbal, Charisma F Choudhury, Pu Wang, and Marta C González.2014. Development of origin–destination matrices using mobile phone call data.Transportation Research Part C: Emerging Technologies 40 (2014), 63–74.
[27] M Ivanovic, PS KHUNON, N Reynish, R Pawson, L Tseane, and N Wassung. 2009.Fresh perspectives: tourism development. Cape Town: Pearson (2009).
[28] Shan Jiang, Joseph Ferreira Jr, and Marta C González. 2015. Activity-BasedHuman Mobility Patterns Inferred from Mobile Phone Data: A Case Study ofSingapore. In Int. Workshop on Urban Computing.
[29] Defu Lian, Cong Zhao, Xing Xie, Guangzhong Sun, Enhong Chen, and Yong Rui.2014. GeoMF: joint geographical modeling and matrix factorization for point-of-interest recommendation. In Proceedings of the 20th ACM SIGKDD internationalconference on Knowledge discovery and data mining. ACM, 831–840.
[30] Xin Lu, Erik Wetter, Nita Bharti, Andrew J Tatem, and Linus Bengtsson. 2013.Approaching the limit of predictability in human mobility. Scientific reports 3(2013).
[31] Wesley Mathew, Ruben Raposo, and Bruno Martins. 2012. Predicting futurelocations with hidden Markov models. In Proceedings of the 2012 ACM conferenceon ubiquitous computing. ACM, 911–918.
[32] Transportation Research Board of the National Academies. 2008. Default Valuesfor Highway Capacity and Level of Service Analyses. (2008).
[33] Razvan Pascanu, Caglar Gulcehre, Kyunghyun Cho, and Yoshua Bengio. 2013.How to construct deep recurrent neural networks. arXiv preprint arXiv:1312.6026(2013).
[34] Jan Petzold, Faruk Bagci,Wolfgang Trumler, and Theo Ungerer. 2006. Comparisonof different methods for next location prediction. In Euro-Par 2006 ParallelProcessing. Springer, 909–918.
[35] D. Quercia, N. Lathia, F. Calabrese, G. Di Lorenzo, and J. Crowcroft. 2010. Rec-ommending Social Events from Mobile Phone Location Data. In Data Mining(ICDM), 2010 IEEE 10th International Conference on. 971–976. https://doi.org/10.1109/ICDM.2010.152
[36] David E Rumelhart, Geoffrey E Hinton, and Ronald J Williams. 1985. Learninginternal representations by error propagation. Technical Report. DTIC Document.
[37] Georgina Santos. 2005. Urban congestion charging: a comparison betweenLondon and Singapore. Transport Reviews 25, 5 (2005), 511–534.
[38] Mikkel N Schmidt, Ole Winther, and Lars Kai Hansen. 2009. Bayesian non-negative matrix factorization. In International Conference on Independent Compo-nent Analysis and Signal Separation. Springer, 540–547.
[39] Chaoming Song, Tal Koren, PuWang, andAlbert-László Barabási. 2010. Modellingthe scaling properties of human mobility. Nature Physics 6, 10 (2010), 818–823.
[40] Hao Wang, Manolis Terrovitis, and Nikos Mamoulis. 2013. Location recommen-dation in location-based social networks using user check-in data. In Proceedingsof the 21st ACM SIGSPATIAL International Conference on Advances in GeographicInformation Systems. ACM, 374–383.
[41] John Glen Wardrop. 1952. ROAD PAPER. SOME THEORETICAL ASPECTS OFROAD TRAFFIC RESEARCH. Proceedings of the institution of civil engineers 1, 3(1952), 325–362.
[42] Mao Ye, Peifeng Yin, Wang-Chien Lee, and Dik-Lun Lee. 2011. Exploiting geo-graphical influence for collaborative point-of-interest recommendation. In Pro-ceedings of the 34th international ACM SIGIR conference on Research and develop-ment in Information Retrieval. ACM, 325–334.