Synchrotron Tools - Binghamton University Modules_Synchrotron... · • Synchrotron Radiation: a...
109
Synchrotron Tools 1 Advanced Characterization Techniques for Energy Storage By Tianchan Jiang
Transcript of Synchrotron Tools - Binghamton University Modules_Synchrotron... · • Synchrotron Radiation: a...

Synchrotron Tools
1
Advanced Characterization Techniques for Energy Storage
By Tianchan Jiang
What is Synchrotron Radiation (SR)?
• Synchrotron: a type of cyclic particle accelerator.
• Synchrotron Radiation: a type of electromagnetic radiationswhich are produced in synchrotron when charged particles (electrons or positrons) are accelerated radially (namely, acceleration is normal to velocity). It is produced using bending magnets or undulators, by the acceleration of ultra relativistic charged particles through magnetic fields.
accelerator
electromagnetic radiations
2
Overview of Synchrotron Radiation
• Introduction
• Properties of Synchrotron Radiation
• Hard versus Soft X-ray Synchrotron Radiation
• Synchrotron Radiation Sources, Research Facilities, and Instrumentation
3
• High brilliance of X-ray beam that can be achieved in is 4 (1st
generation synchrotrons) to 12 (3rd generation synchrotrons) orders of magnitude higher than that from conventional X-ray source.
• The high intensity, observed in a broad range of photon energies, allow for easy selection of nearly any desired wavelength.
4
Introduction of Synchrotron Radiation
Properties of Synchrotron Radiation
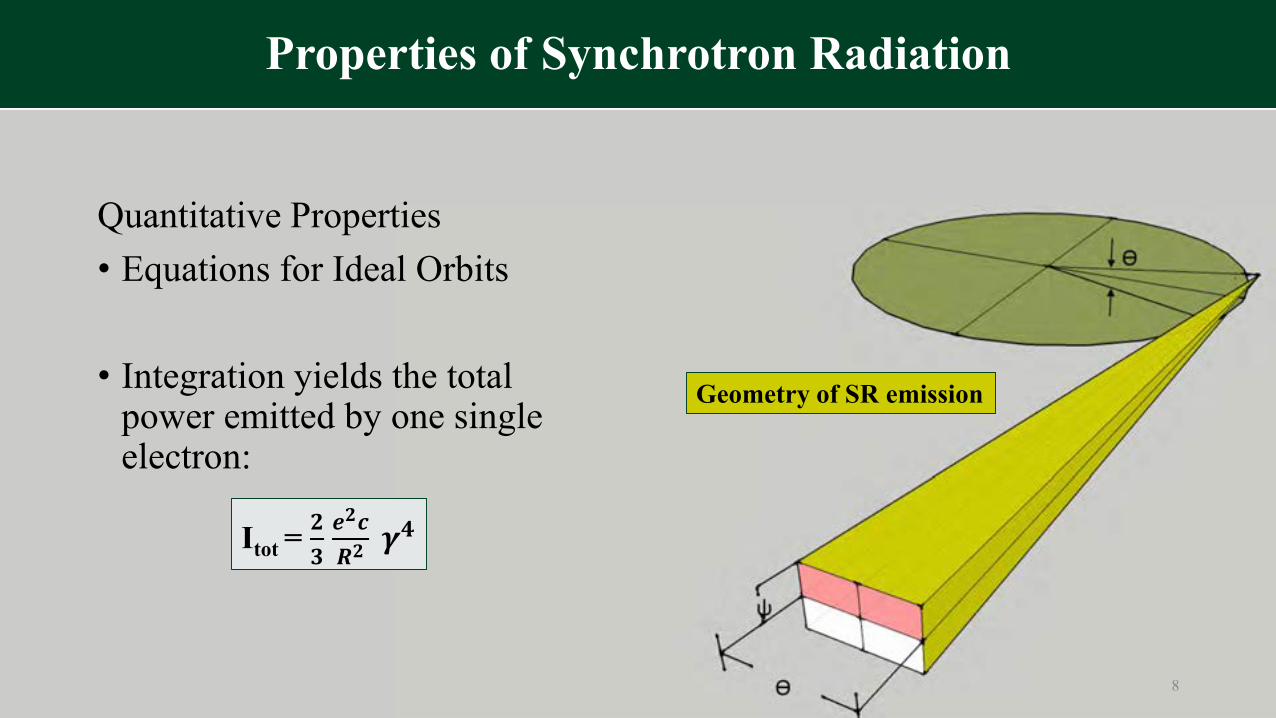
Quantitative Properties
• Equations for Ideal Orbits
• Considerations for Real Orbits
• Time Structure
5

Properties of Synchrotron Radiation
Quantitative Properties• Equations for Ideal Orbits
e : electron chargem: massc: velocity of lightdτ = dt/γ : the element of proper timemomentum p = γmvenergy E = γmc2
Circular orbit
6

Properties of Synchrotron Radiation
Quantitative Properties• Equations for Ideal Orbits For a single electron moving with constant velocity v on a circular orbit one obtains the power I(λ, ψ) radiated off around the whole orbit in cgsunits in erg/ (s·electron) into a wavelength interval dλ and an interval dψof the azimuthal angle ψ
λ = 4π𝑅3
γ-3
ξ = λ𝑐2λ
[1 +(γψ)2]3/2
γ = 𝐸
𝑚𝑐2
R: the radius of curvatureK1/3 and K2/3 the modified Bessel functions of the second kind
7
𝐼 𝜆, 𝜓 =27
32𝜋3𝑒2𝑐
𝑅2𝜆𝑐𝜆
4
𝛾8 1 + 𝛾𝜓 2 2 𝐾2/32 𝜉 +
𝛾𝜓 2
1 + 𝛾𝜓 2 𝐾1/32 𝜉
Properties of Synchrotron Radiation
Quantitative Properties• Equations for Ideal Orbits
• Integration yields the total power emitted by one single electron:
Geometry of SR emission
Itot = 𝟐𝟑
𝒆𝟐𝒄
𝑹𝟐𝜸𝟒
8
Properties of Synchrotron Radiation
Quantitative Properties• Considerations for Real Orbits
- Coherence- Periodic Wigglers- Synchrotron Accelerators- Beam Cross Section and Divergency
9

Wavelength shifter
Multipole wiggler magnet
Helical wiggler
e-
e-
e-
Wiggle type
10
Wiggler: an insertion device in a synchrotron. A series of magnets designed to periodically laterally deflect ('wiggle') a beam of charged particles (invariably electrons or positrons) inside a storage ring of a synchrotron.
Properties of Synchrotron Radiation

Polarization & Time structure• The radiation from bending magnets and insertion devices is highly
polarized in the plane of the electron or positron orbit.• Polarization can be exploited to reduce the scattered background radiation
and decrease the detection limit in X-ray fluorescence spectroscopy or it can be used to design certain X-ray absorption spectroscopy experiments.
• The electrons or positrons are not distributed evenly around the storage ring, but are grouped into a number of bunches. X-rays are produced only when a bunch of particles passes through the bending magnet or insertion device.
• The exact timing and duration of these X-ray pulses depends on the size and operating characteristics of the ring.
11
Properties of Synchrotron Radiation

Constraints on the design of monochromators for use with SR
Constraints ImplicationsThe light source is fixed in position and in many cases also the experiment
Constant deviation optics is required for the system: beamline–monochromator-experiment. In the grazing incidence regime in general a complex coupled motion is required for high resolution.
SR beam is highly polarized with the electric vector in the horizontal orbit plane
Vertical reflections and dispersions are preferred due to higher intensity and polarization
At synchrotrons the light intensity can considerably fluctuate with time due to different fillings
Suitable intensity monitors are required for compensation, beam-splitter technique might be necessary for high accuracy experiments
12
Hard versus Soft X-ray Synchrotron Radiation
• Synchrotron radiation is produced from the infrared region (E<1 eV) to the hard X-ray region (E> 100 keV).
• Hard X-ray synchrotrons- Have most or all of the beamlines isolated from the storage ring vacuum by Be windows. - Operate in air. N, O and Ar in the air also efficiently absorb and scatter low-energy radiation beamlines on hard X-ray rings typically have low-energy cutoffs between 2 and 5 keV. - Elements from about Ca (Z=20) and heavier in the periodic table can be studied using X-ray absorption spectroscopy with both the sample and instrumentation in air.• Soft X-ray beamlines generally have direct vacuum connections to the storage ring
and the sample must also generally be placed in a high vacuum environment
13
Soft X-ray Synchrotron Radiation Requirements
• Vacuum requirementsFor electron beams to have lifetimes of many hours it is necessary for the pressure in an electron storage ring to be in the 10-9 –torr range or lower. Chamber walls have to be clean!Removal of contamination: differential pumping.• Small vertical size of the beam lead to nonuniformities over large specimens. Beam lines are being designed to eliminate the problem, which also affect X-ray lithography
14
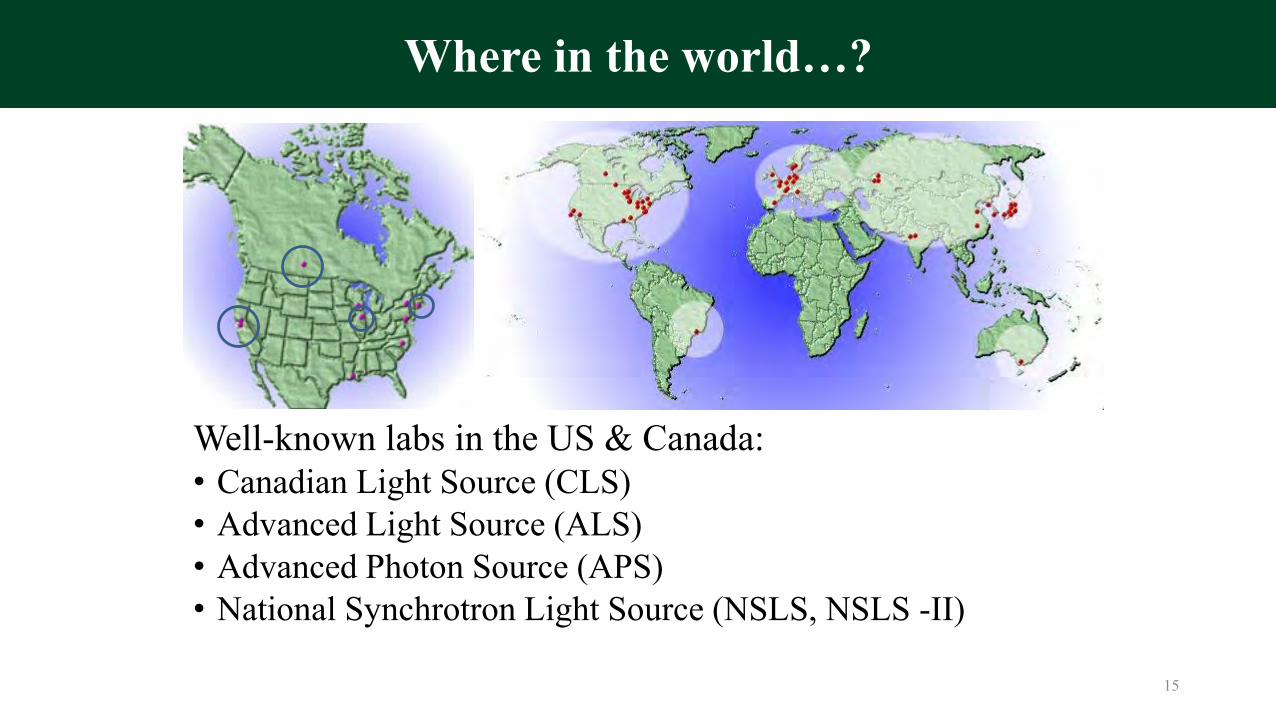
Where in the world…?
Well-known labs in the US & Canada:• Canadian Light Source (CLS)• Advanced Light Source (ALS)• Advanced Photon Source (APS)• National Synchrotron Light Source (NSLS, NSLS -II)
15
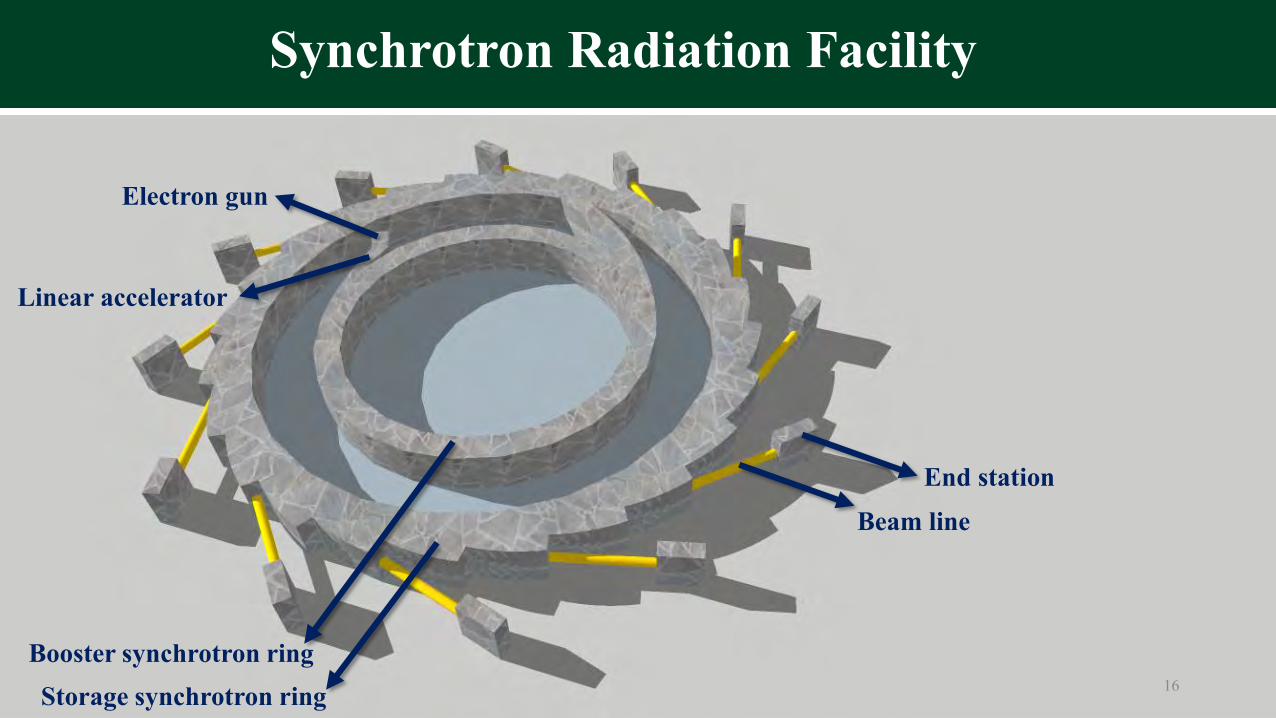
Synchrotron Radiation Facility
Electron gun
Linear accelerator
Booster synchrotron ringStorage synchrotron ring
Beam line
End station
16

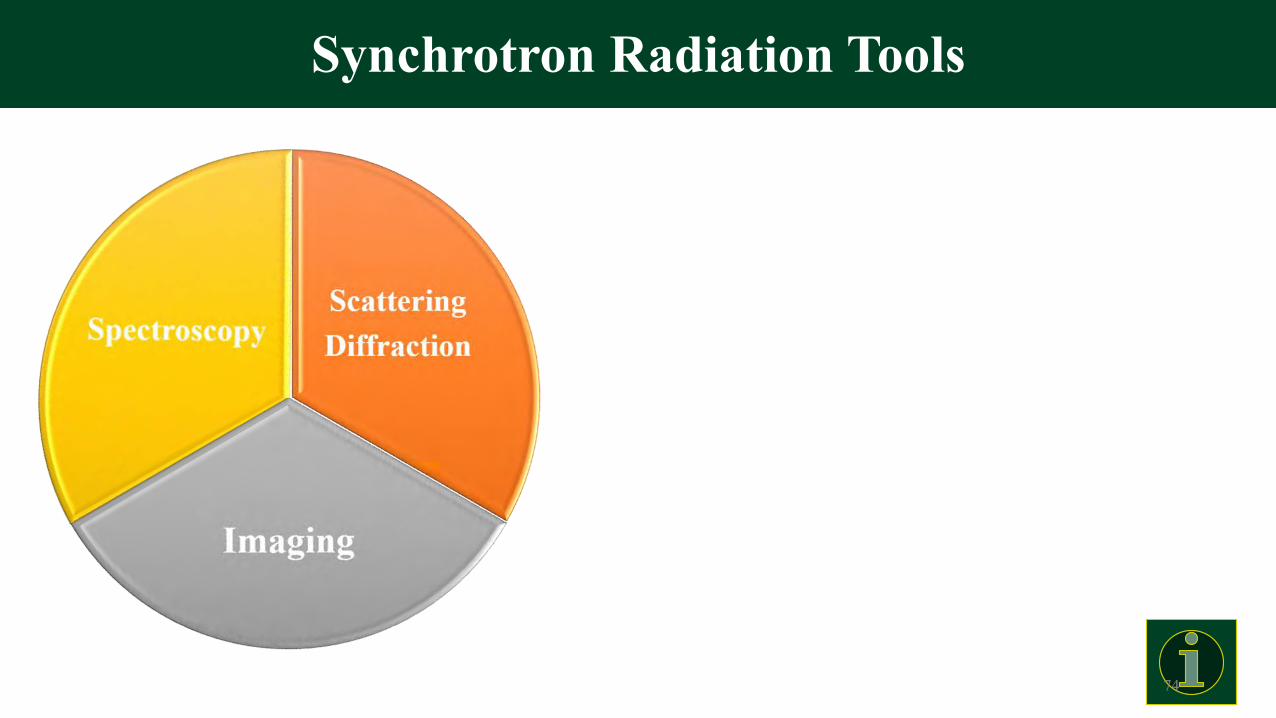
ScatteringDiffraction
Imaging
SpectroscopySynchrotron Diffraction
• The high brilliance of the synchrotron radiation has drastically improved the structural characterization and level of detection of mixture components.
• The speed of the measurement makes it possible to perform kinetic studies on structural changes during chemical reactions or under temperature and pressure ramps.
17
What can SR do for materials characterization?

Imaging18
Synchrotron Radiation Tools

• High energy X-ray diffraction (XRD)
• Micro X-ray diffraction (µ-XRD)
• Pair distribution function (PDF)
• Small/Wide angle X-ray scattering (SAXS/WAXS)
• Grazing-incidence small-angle X-ray scattering/X-ray diffraction
(GISAXS/GIXD)
• Resonant X-ray scattering/diffraction (RXS/RXD)
• Micro-X-ray computed tomography (µ-XCT) Imaging19
Synchrotron Radiation Tools
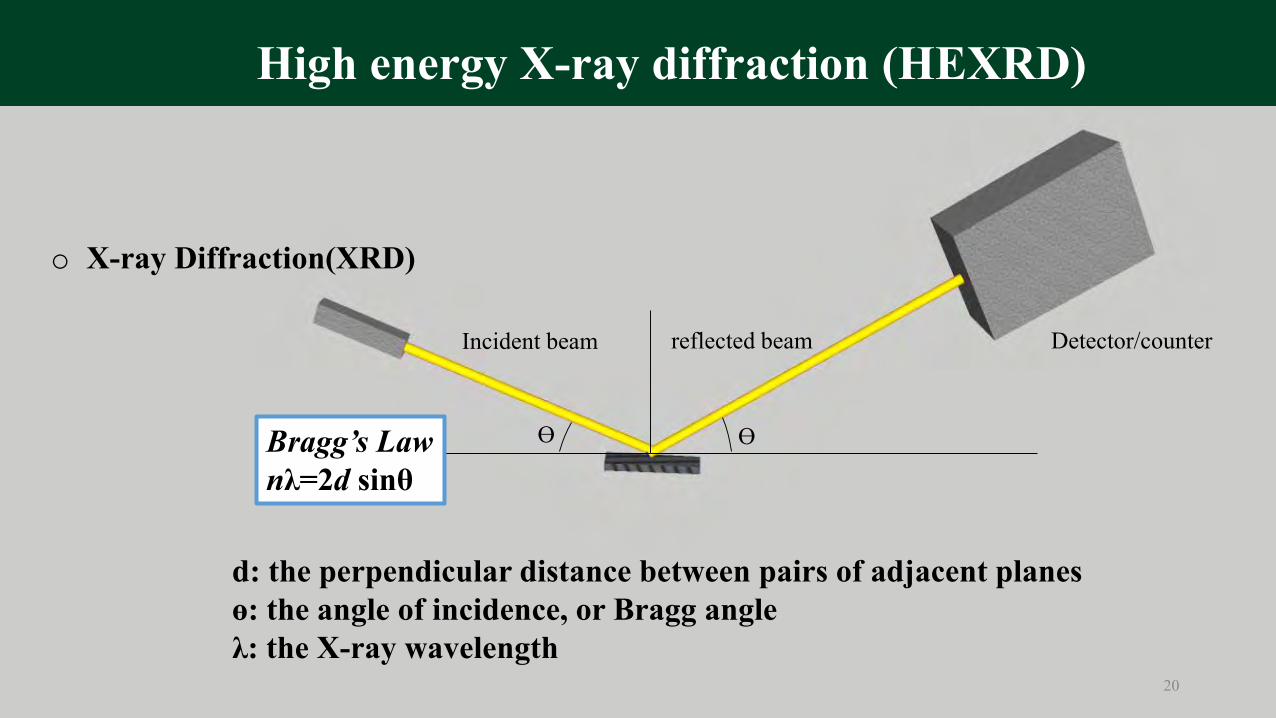
o X-ray Diffraction(XRD)
Ɵ ƟBragg’s Lawnλ=2d sinθ
Incident beam reflected beam Detector/counter
d: the perpendicular distance between pairs of adjacent planesɵ: the angle of incidence, or Bragg angleλ: the X-ray wavelength
20
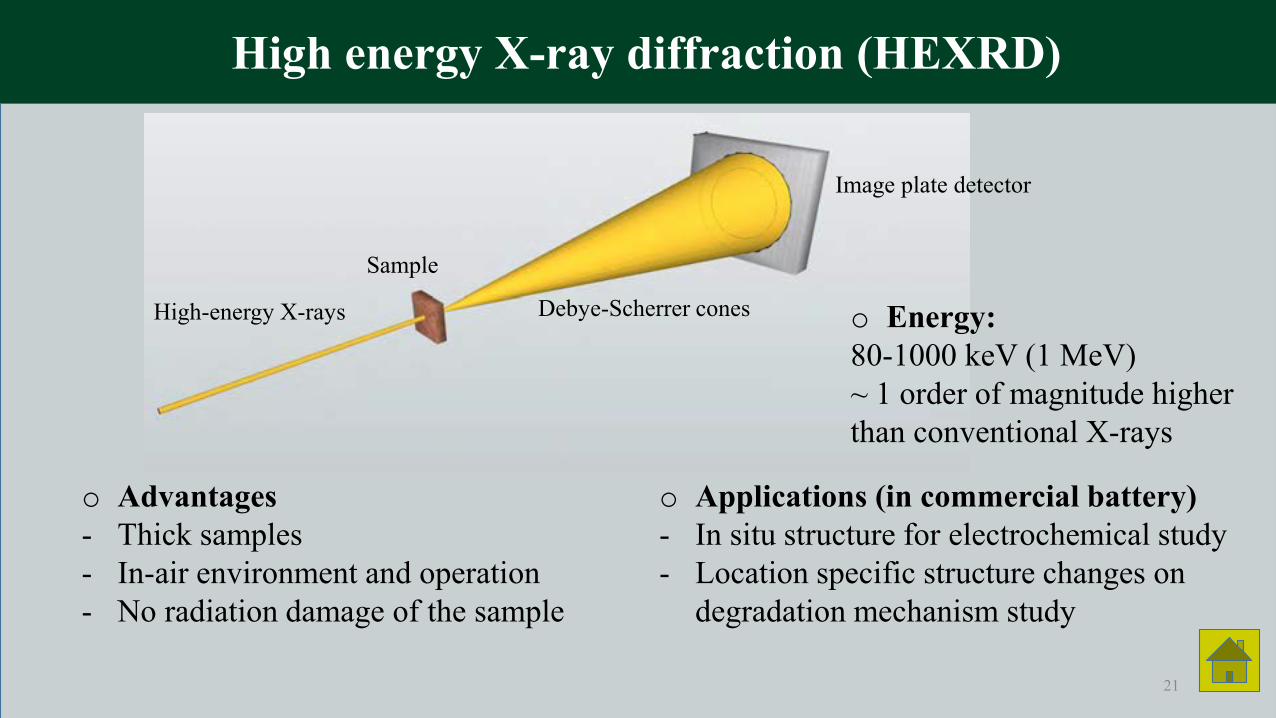
High energy X-ray diffraction (HEXRD)
High energy X-ray diffraction (HEXRD)
o Advantages- Thick samples- In-air environment and operation - No radiation damage of the sample
o Applications (in commercial battery)- In situ structure for electrochemical study- Location specific structure changes on
degradation mechanism study
o Energy:80-1000 keV (1 MeV)~ 1 order of magnitude higher than conventional X-rays
High-energy X-rays
Sample
Debye-Scherrer cones
Image plate detector
21
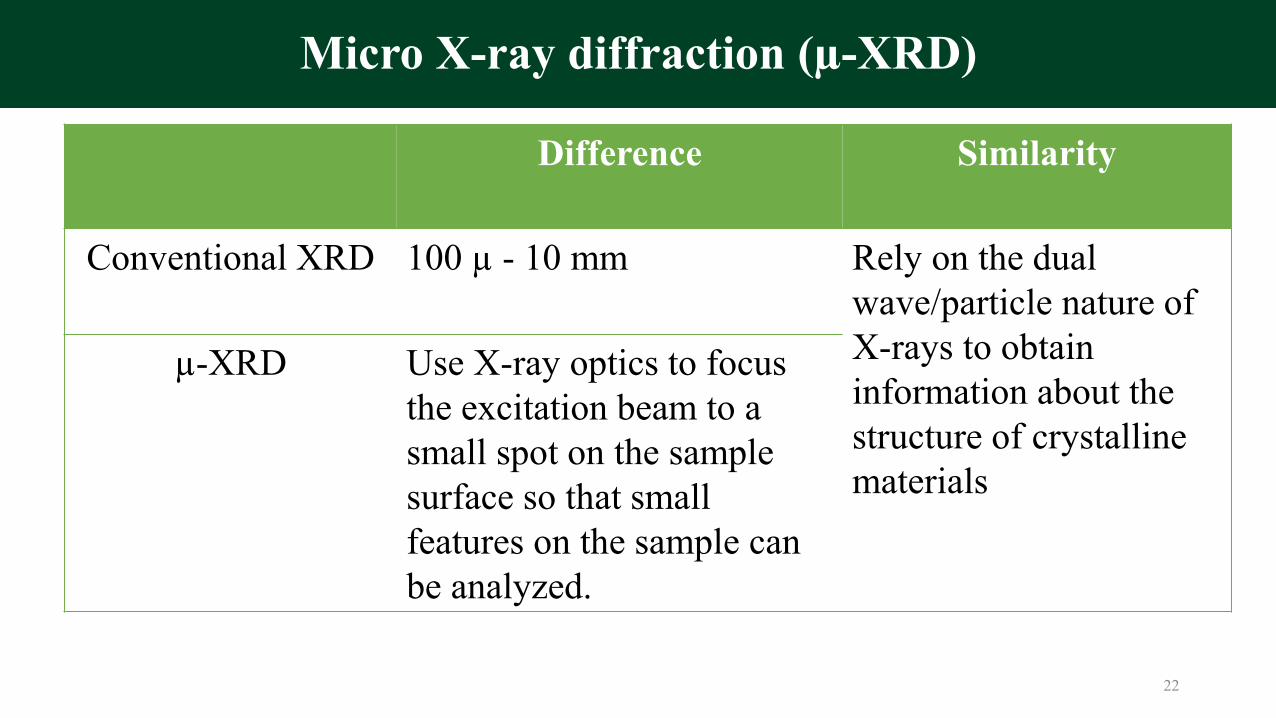
Difference Similarity
Conventional XRD 100 µ - 10 mm Rely on the dual wave/particle nature of X-rays to obtain information about the structure of crystalline materials
µ-XRD Use X-ray optics to focus the excitation beam to a small spot on the sample surface so that small features on the sample can be analyzed.
22
Micro X-ray diffraction (µ-XRD)

o Applications to circumvent technology issue- Phase transformation study in micron region for electrochemical behavior- Grain structure, orientation, stress and strain study to explore new electrode
materials- In situ cracking and stress study
2 mm
12 mm
0.05 mm (diameter)Point source beam size with micro-optics
Line source beam sizewith conventional optics
Small features can be detected!!
23
Micro X-ray diffraction (µ-XRD)

o PDF FormalismG(r): the probability of finding an atom at a distance r from a reference atom.S(Q): total structure factor
G(r) = 4πr ρo[g(r)-1]=(2/ π ) ʃ Q[S(Q)-1]sin(Qr)dQ
S(Q) = 1+[Icoh(Q)-Σci|fi(Q)|2/ |Σcifi(Q)|2
Corrected diffraction intensity
24
Pair Distribution Function Measurements (PDF)
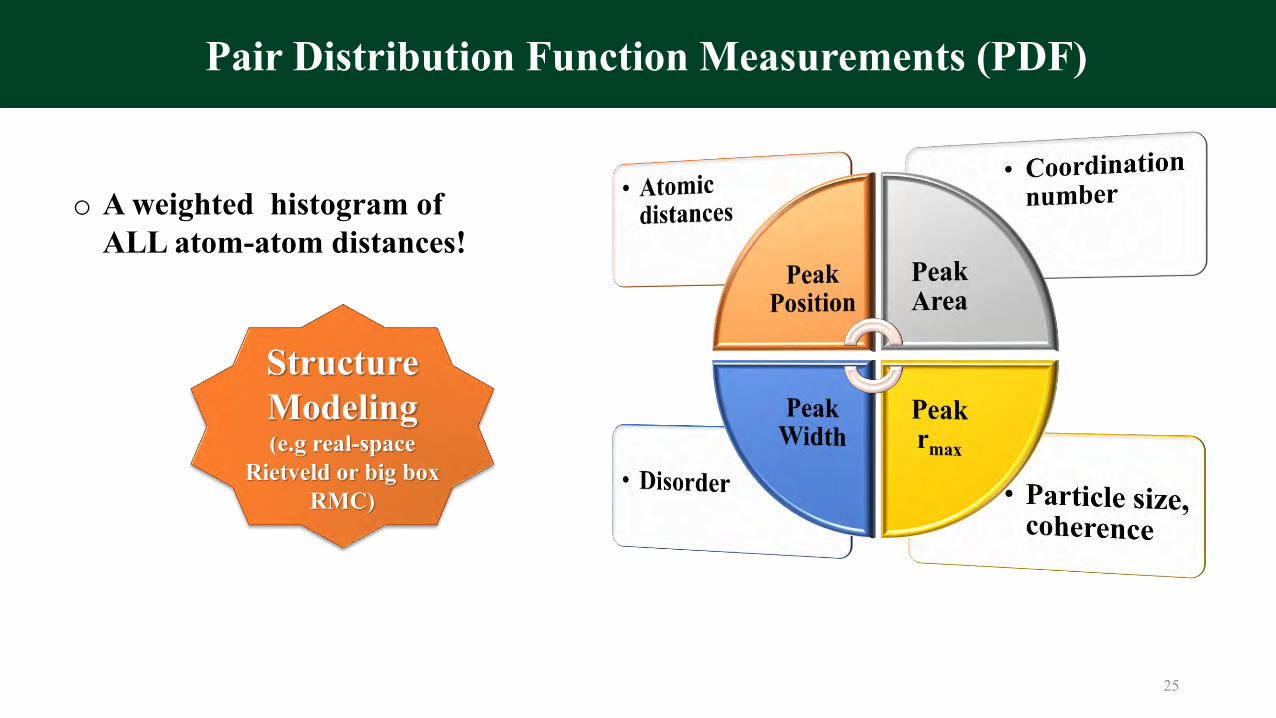
o A weighted histogram of ALL atom-atom distances!
Structure Modeling(e.g real-space
Rietveld or big box RMC)
25
Pair Distribution Function Measurements (PDF)
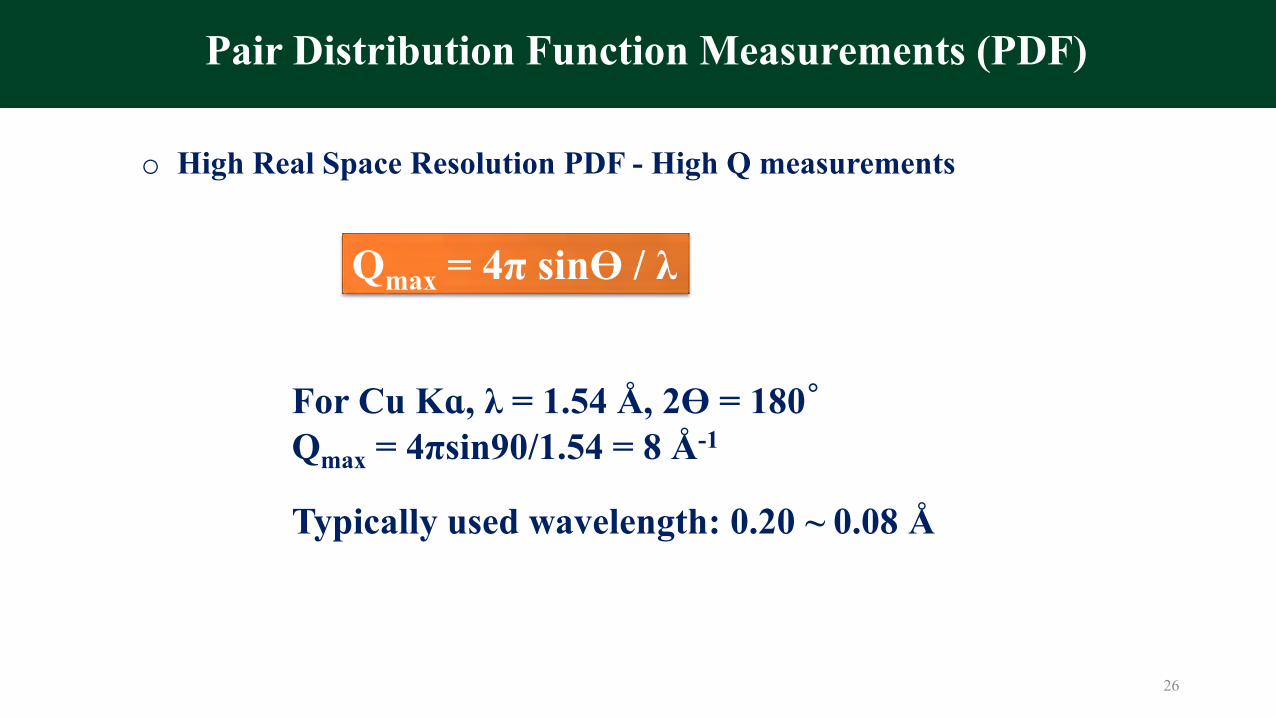
o High Real Space Resolution PDF - High Q measurements
Qmax = 4π sinƟ / λ
For Cu Kɑ, λ = 1.54 Å, 2Ɵ = 180˚Qmax = 4πsin90/1.54 = 8 Å-1
Typically used wavelength: 0.20 ~ 0.08 Å
26
Pair Distribution Function Measurements (PDF)
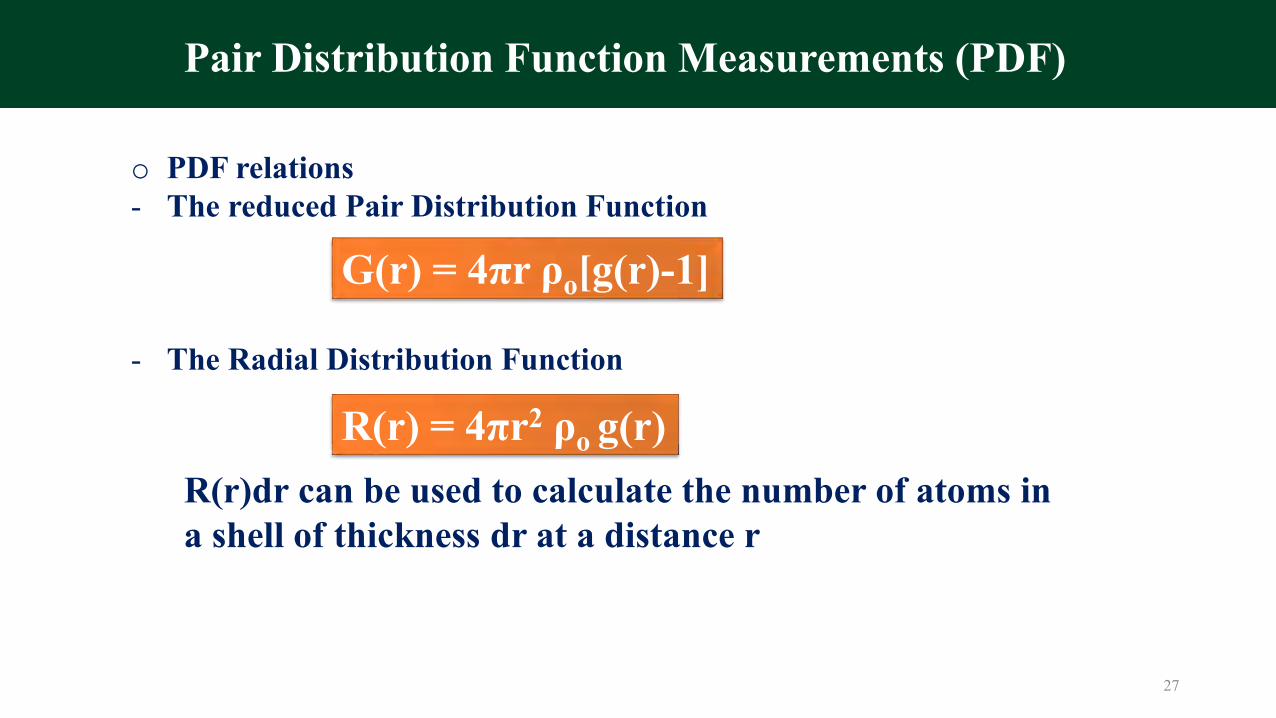
o PDF relations - The reduced Pair Distribution Function
- The Radial Distribution Function
G(r) = 4πr ρo[g(r)-1]
R(r)dr can be used to calculate the number of atoms in a shell of thickness dr at a distance r
R(r) = 4πr2 ρo g(r)
27
Pair Distribution Function Measurements (PDF)
Video Tutorial
• Integration & Calibration
• Processing data collected using the sample changer
• Optimizing an Integration
By Karena Chapman from ANL
28
Pair Distribution Function Measurements (PDF)
Integration & Calibration
29
Pair Distribution Function Measurements (PDF)
Processing data collected using the sample changer
30
Pair Distribution Function Measurements (PDF)
Optimizing an Integration
31
Pair Distribution Function Measurements (PDF)
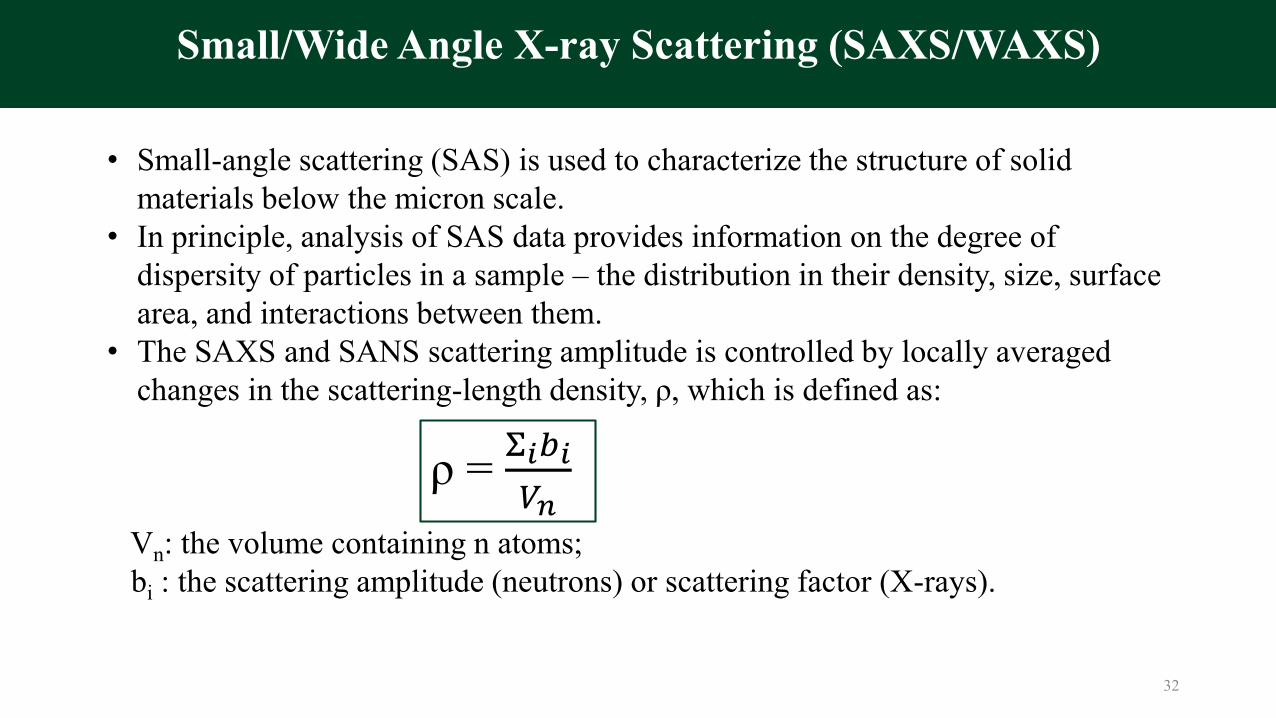
• Small-angle scattering (SAS) is used to characterize the structure of solid materials below the micron scale.
• In principle, analysis of SAS data provides information on the degree of dispersity of particles in a sample – the distribution in their density, size, surface area, and interactions between them.
• The SAXS and SANS scattering amplitude is controlled by locally averaged changes in the scattering-length density, ρ, which is defined as:
Vn: the volume containing n atoms; bi : the scattering amplitude (neutrons) or scattering factor (X-rays).
ρ = Σ𝑖𝑏𝑖𝑉𝑛
32
Small/Wide Angle X-ray Scattering (SAXS/WAXS)

- Particle sizes (rough estimations)
- Sharpness of interfaces between surfaces in the sample
- Size distribution
• What physical parameters can be extracted from SAXS data?
33
Small/Wide Angle X-ray Scattering (SAXS/WAXS)
- Instruments with one monochromator crystal
- Mirror-monochromator system
- Double-monochromator system
- Energy dispersive method
• Small-Angle Scattering Instruments
34
Small/Wide Angle X-ray Scattering (SAXS/WAXS)
• Study electron density contrast variations(structure), characterize nanoscale density correlations and/or the shape of nanoscopic objects:
- surfaces - buried interfaces - in thin films- inner electron density fluctuations of the deposited material
35
Grazing-Incidence Small-Angle X-ray Scattering/X-ray Diffraction (GISAXS/GIXD)

• X-rays at grazing incidence- Limited penetration into sample means enhanced surface sensitivity
36
Grazing-Incidence Small-Angle X-ray Scattering/X-ray Diffraction (GISAXS/GIXD)

• Beam-defining and guard slits• Area detector• Diffractometer for sample positioning: 6 degrees of freedom:
– x, y, z– Θ, χ, φ
• Extended beamstop• Fast (point) detector for alignment• Synchrotron source
37
𝑞𝑥,𝑦,𝑧 =2𝜋
𝜆
cos 𝛼𝑓 cos 2𝜃𝑓 − cos 𝛼𝑖
cos 𝛼𝑓 sin 2𝜃𝑓
sin 𝛼𝑓 + sin 𝛼𝑖
GISAXS Experimental Requirements

• Remote control- Offer the possibility of computer control and semiautomatic alignment
• Vacuum window- Beryllium window
• Curved mirrorsƟ𝑐: grazing angle
• Curved crystal monochromatorsIntegrated reflectivity:
Ɵ𝑐(mrad) = 26.3 λ (nm)
𝑃ℎ𝑃𝑜
∝ (𝑁𝑣𝑁𝑢)12
38
Small-Angle Diffraction Cameras for Synchrotron Radiation
Condition Imposed by Detector Technology• X-ray film is the simplest detector to use
- good spatial resolution- high quantum efficiency- easy data storage- measuring the optical density is relatively simple and straightforward
• X-ray phosphors [ZnS(Ag)] in conjunction with high-sensitivity television have been employed for the registration of X-ray diffraction diagrams.
39
Small-angle X-ray scattering/X-ray diffraction

• Study of the ground states of strongly correlated electron materials.• Virtual absorption of the incoming photon, provoking a transition of a
core electron that is promoted to some unoccupied levels.• The electron immediately (∼ 10−15 s) decays back to its initial core state,
emitting thus a new photon, with the same energy than the incoming one, but eventually with different polarization and wave vector.
• A good approximation ‘‘dipolar’’ is that only electronic states whose angular momenta are separated by one unit can be coupled.
40
Resonant X-ray Scattering/Diffraction (RXS/RXD)
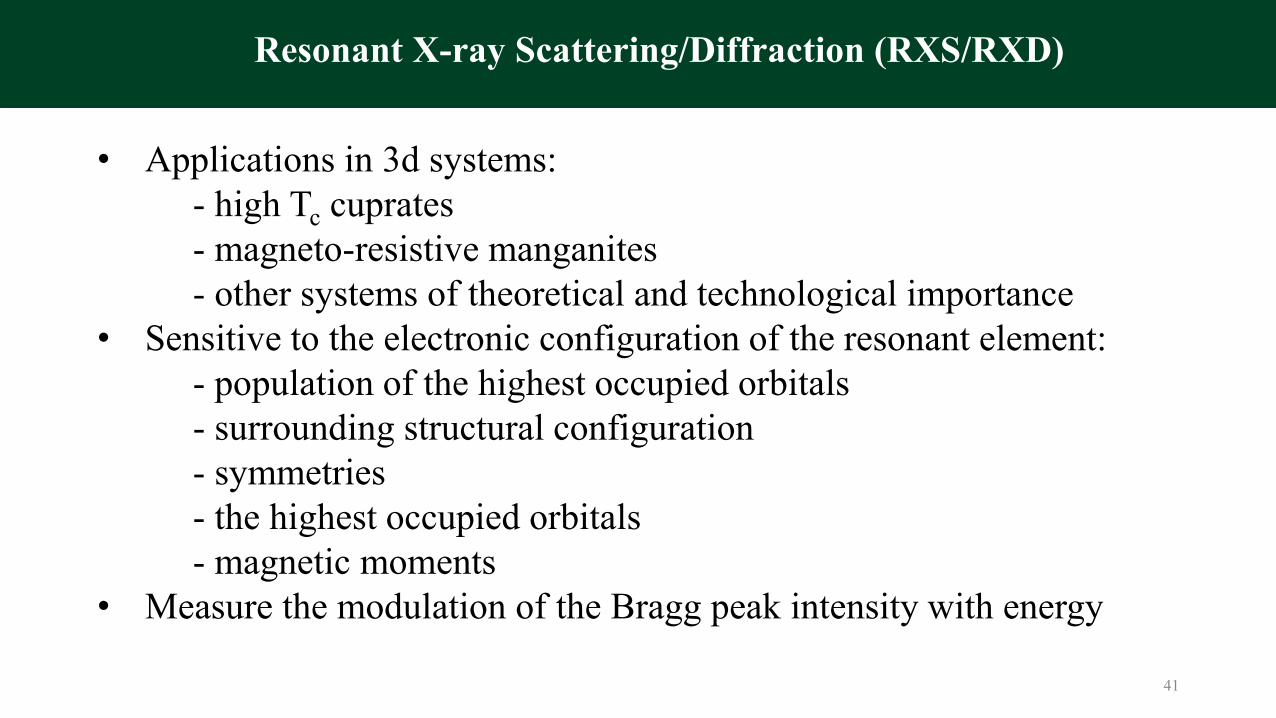
• Applications in 3d systems:- high Tc cuprates- magneto-resistive manganites- other systems of theoretical and technological importance
• Sensitive to the electronic configuration of the resonant element:- population of the highest occupied orbitals- surrounding structural configuration - symmetries- the highest occupied orbitals - magnetic moments
• Measure the modulation of the Bragg peak intensity with energy
41
Resonant X-ray Scattering/Diffraction (RXS/RXD)
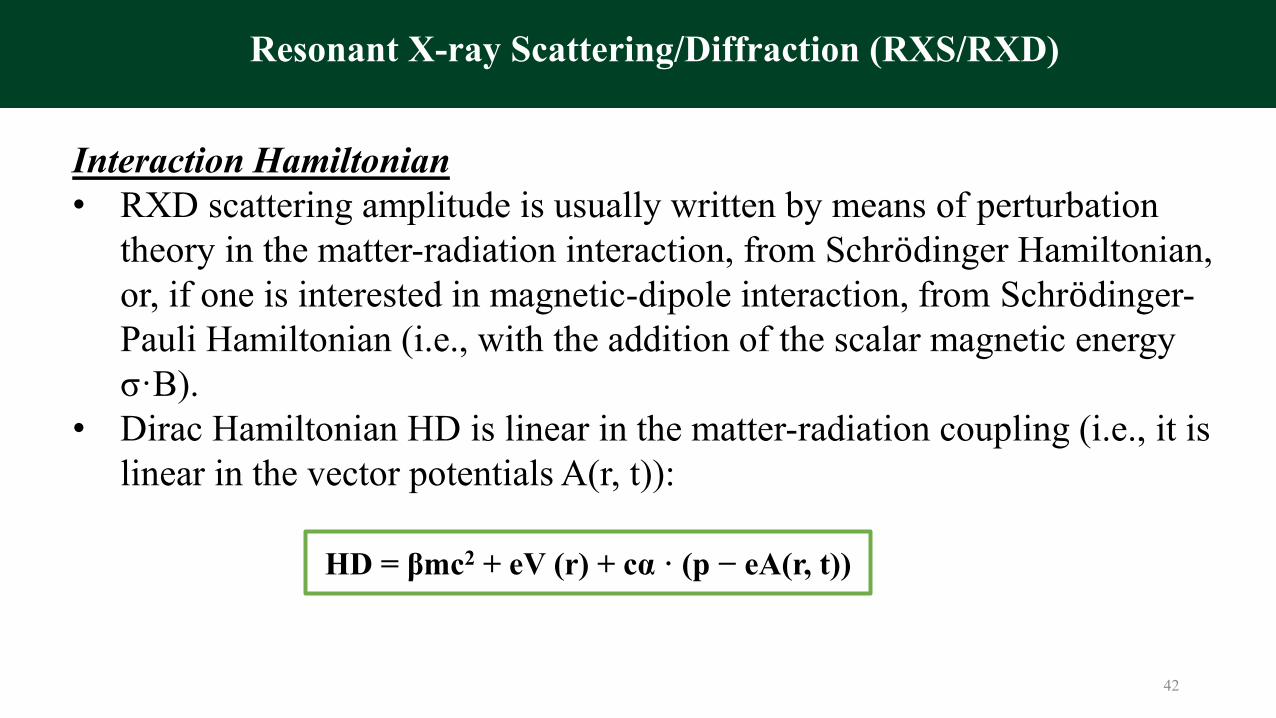
Interaction Hamiltonian• RXD scattering amplitude is usually written by means of perturbation
theory in the matter-radiation interaction, from Schrӧdinger Hamiltonian, or, if one is interested in magnetic-dipole interaction, from Schrӧdinger-Pauli Hamiltonian (i.e., with the addition of the scalar magnetic energy σ·B).
• Dirac Hamiltonian HD is linear in the matter-radiation coupling (i.e., it is linear in the vector potentials A(r, t)):
HD = βmc2 + eV (r) + cα · (p − eA(r, t))
42
Resonant X-ray Scattering/Diffraction (RXS/RXD)
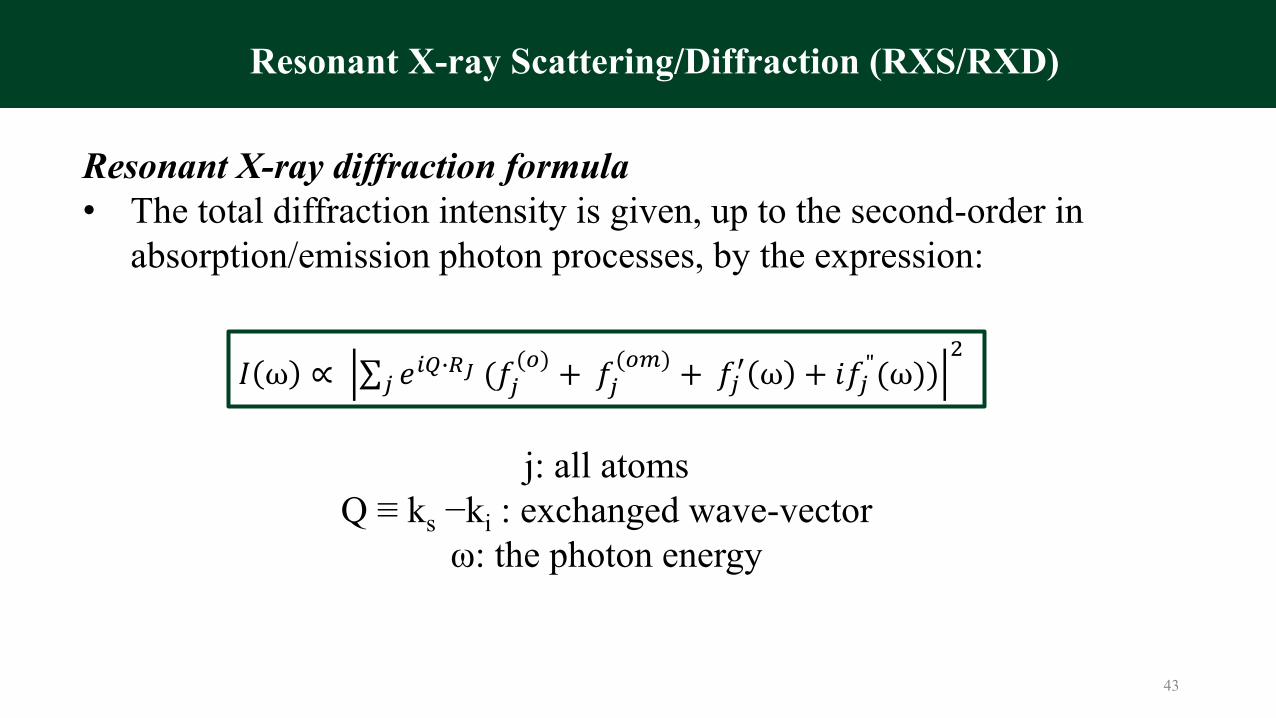
Resonant X-ray diffraction formula• The total diffraction intensity is given, up to the second-order in
absorption/emission photon processes, by the expression:
𝐼 ω ∝ σ𝑗 𝑒𝑖𝑄∙𝑅𝐽 (𝑓𝑗
(𝑜)+ 𝑓𝑗
(𝑜𝑚)+ 𝑓𝑗
′ ω + 𝑖𝑓𝑗"(ω))
2
j: all atomsQ ≡ ks −ki : exchanged wave-vector
ω: the photon energy
43
Resonant X-ray Scattering/Diffraction (RXS/RXD)
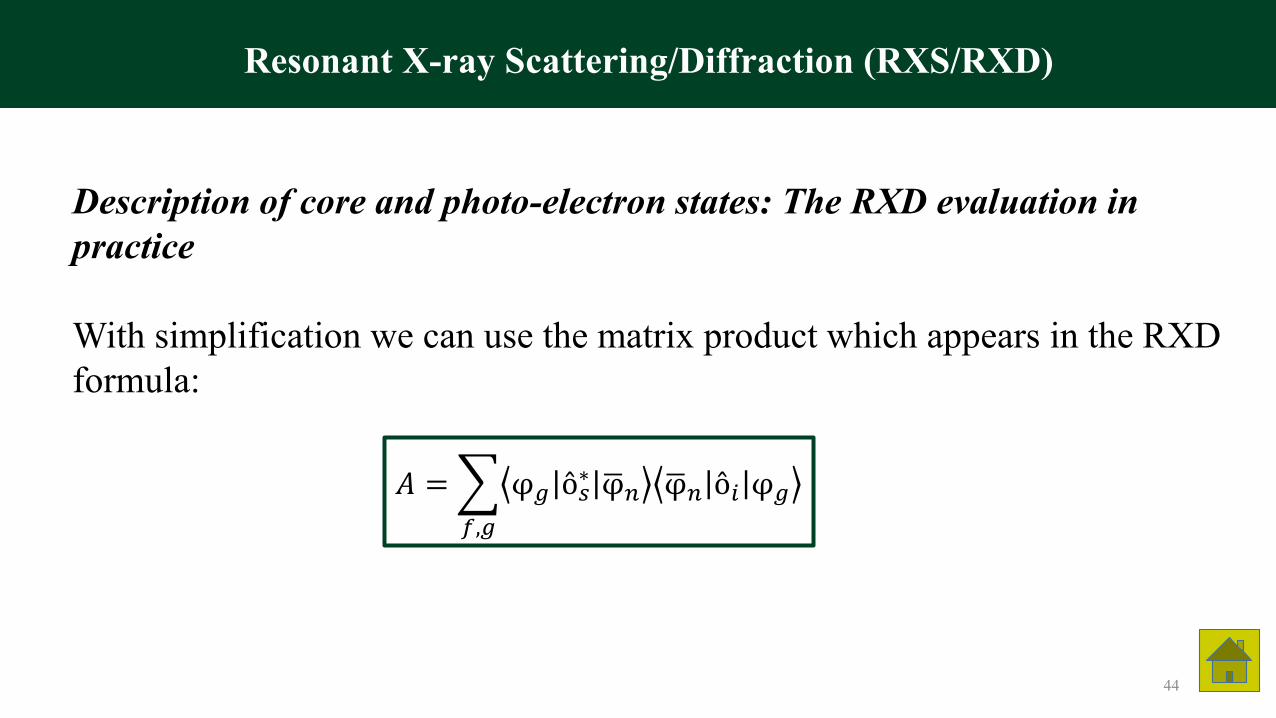
Description of core and photo-electron states: The RXD evaluation in practice
With simplification we can use the matrix product which appears in the RXDformula:
𝐴 =
𝑓,𝑔
φ𝑔 ô𝑠∗ ഥφ𝑛 ഥφ𝑛 ô𝑖 φ𝑔
44
Resonant X-ray Scattering/Diffraction (RXS/RXD)
• Compared to optical images of sections, CT data reveal comprehensive geometrical information at smaller scales, individual particles, and particle coatings, can also be extracted but image artifacts can compromise interpretation.
• Measure:o Certain characteristics of textile geometryo Tow deformation: tow interlacements lead to a reduction in the in-
plane moduli of the composite laminateso Porosity and its changes during processing steps
• Yield 3D images of specimens that are 1–10 mm in linear dimension with a spatial micron resolution (in synchrotron beamline).
45
Micro-X-ray Computed Tomography (µ-XCT)

Experimental set-up:
X-raysSamplestage
Sample
Scintillator
Focusing optics
High resolution14-bit CCD
46
Micro-X-ray Computed Tomography (µ-XCT)

Typical experimental setting:
• The stage is equipped with a vertical translation system which allows for tiled scanning.
• For each scan, the sample was rotated by 180° in steps of 0.125°, giving 1440 exposures over a period of about 60–90 min.
• The transmission images thus captured were used for reconstructing two-dimensional slices normal to the rotation axis. The reconstruction takes ~2.2 s per slice on an eight processor computer.
47
Micro-X-ray Computed Tomography (µ-XCT)
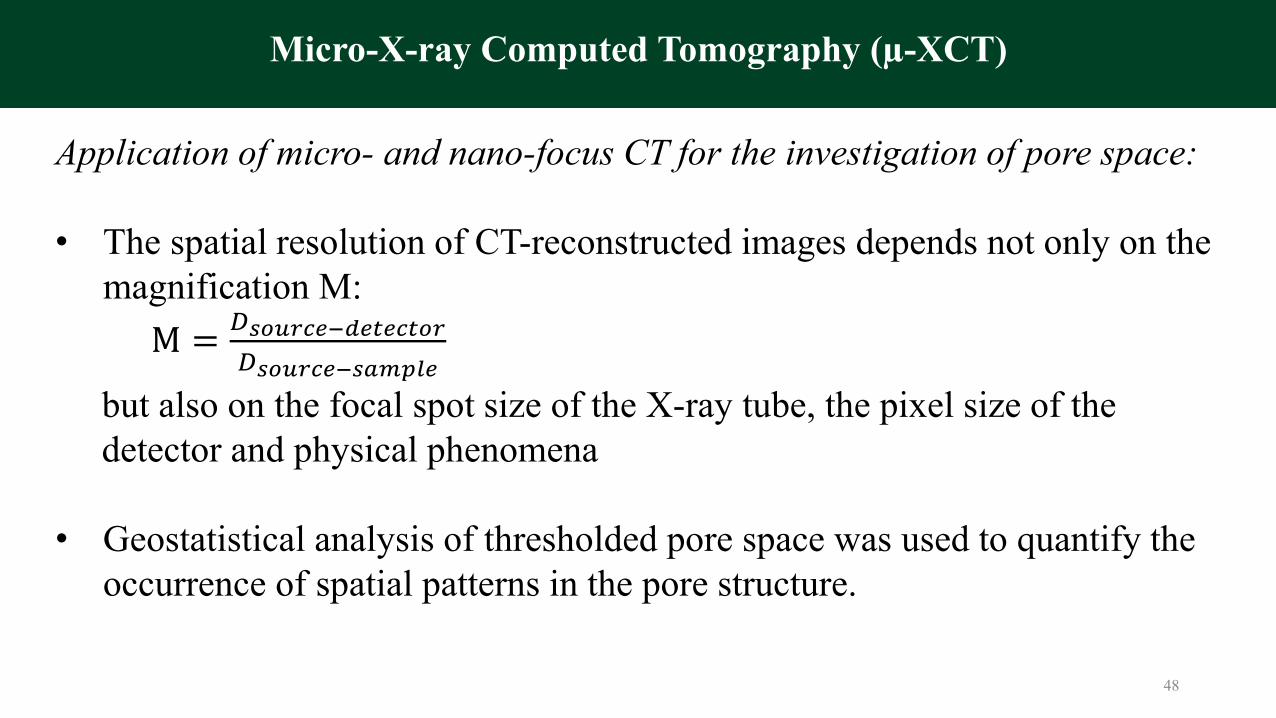
Application of micro- and nano-focus CT for the investigation of pore space:
• The spatial resolution of CT-reconstructed images depends not only on the magnification M:
M =𝐷𝑠𝑜𝑢𝑟𝑐𝑒−𝑑𝑒𝑡𝑒𝑐𝑡𝑜𝑟
𝐷𝑠𝑜𝑢𝑟𝑐𝑒−𝑠𝑎𝑚𝑝𝑙𝑒
but also on the focal spot size of the X-ray tube, the pixel size of thedetector and physical phenomena
• Geostatistical analysis of thresholded pore space was used to quantify the occurrence of spatial patterns in the pore structure.
48
Micro-X-ray Computed Tomography (µ-XCT)
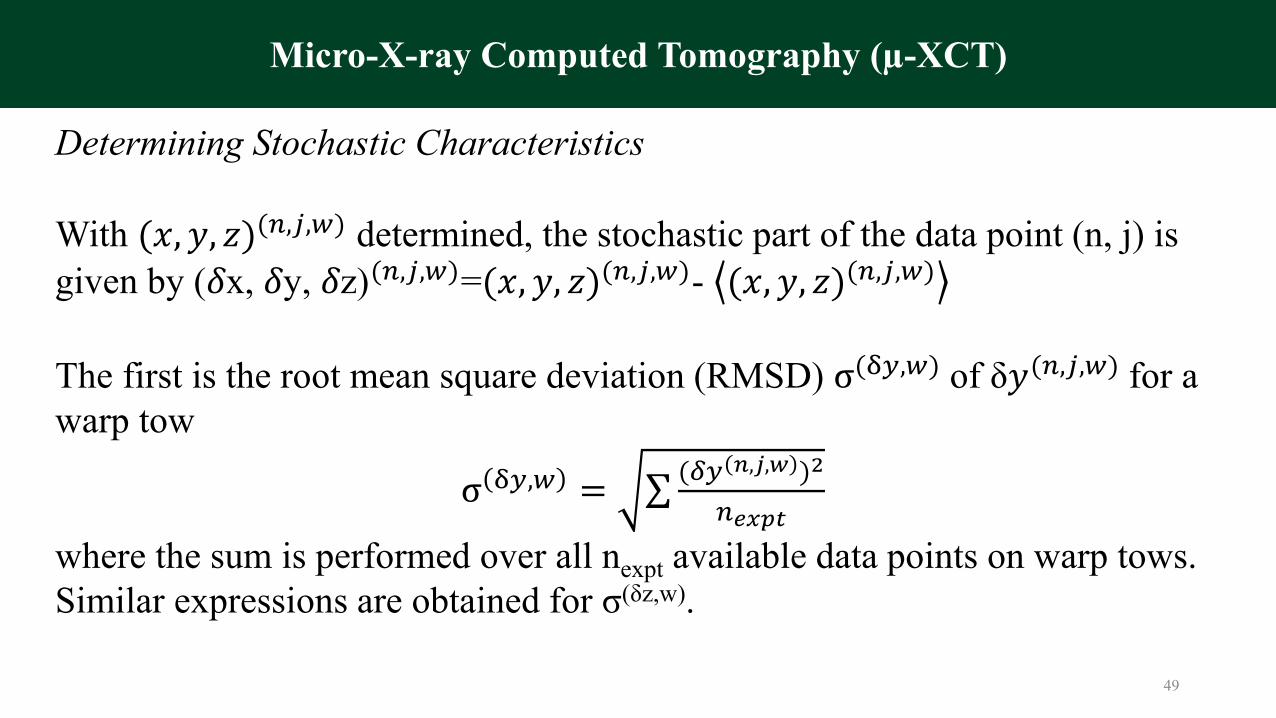
Determining Stochastic Characteristics
With (𝑥, 𝑦, 𝑧)(𝑛,𝑗,𝑤) determined, the stochastic part of the data point (n, j) is given by (𝛿x, 𝛿y, 𝛿z)(𝑛,𝑗,𝑤)=(𝑥, 𝑦, 𝑧)(𝑛,𝑗,𝑤)- (𝑥, 𝑦, 𝑧)(𝑛,𝑗,𝑤)
The first is the root mean square deviation (RMSD) σ(δ𝑦,𝑤) of δ𝑦(𝑛,𝑗,𝑤) for a warp tow
σ δ𝑦,𝑤 = σ(𝛿𝑦 𝑛,𝑗,𝑤 )2
𝑛𝑒𝑥𝑝𝑡
where the sum is performed over all nexpt available data points on warp tows. Similar expressions are obtained for σ(δz,w).
49
Micro-X-ray Computed Tomography (µ-XCT)
Experimental protocol: (take Lawrence Berkeley National Laboratory as an example: hard X-ray tomography beamline at the Advanced Light Source)
• The beamline receives tunable X-rays in the energy range 8–40 keV from a superconducting bend magnet.
• Movable monochromator optics provide either monochromatic or polychromatic X-rays.
• The X-ray transmission images are acquired using a CdWO4 scintillator to convert transmitted X-rays to visible light, which is then reflected into an optical microscope.
50
Micro-X-ray Computed Tomography (µ-XCT)

Spectroscopy
51
Synchrotron Radiation Tools
• Soft X-ray Microscopy overview
• Transmission X-ray Microscopy (TXM)
• Scanning X-ray Microscopy (SXM)
• Topography• X-ray photoemission electron
microscopy (PEEM)/Low Energy Electron Microscopy (LEEM)
Spectroscopy
52
Synchrotron Radiation Tools
Soft X-ray Microscopes
• Soft X-ray microscopy can be carried out in an advantageous way in the energy range of the so called ‘water window’ between the K-absorption edges of oxygen (543 eV) and carbon (284 eV). This provides a natural contrast without any other sample treatment like staining.
• Common types of microscopes which use soft X-rays to illuminate the specimen:
− Transmission X-ray microscope (TXM) and scanning X-ray microscope (SXM).
− X-ray photoemission electron microscopy (PEEM)/electron spectroscopy for chemical analysis (ESCA) and scanning photoemission microscopy (SPEM).
53

o Introduction
- X-rays are focused to a point and the sample is mechanically scanned through the produced focal spot.
- At each point the transmitted X-rays are recorded with a detector such as a proportional counter or an avalanche photodiode.
- The Scanning Transmission X-ray Microscope (STXM) was first developed by researchers at Stony Brook University and was employed at the National Synchrotron Light Source at Brookhaven National Laboratory.
Transmission X-ray Microscopy (TXM)
54
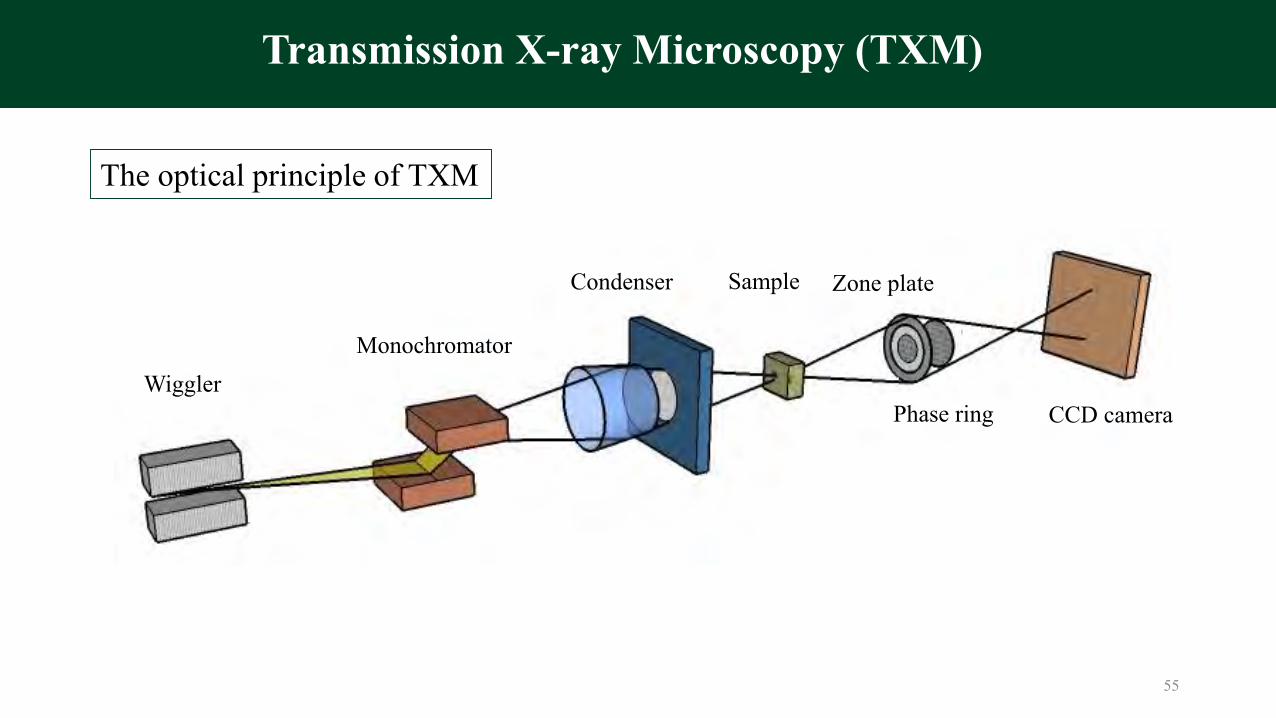
WigglerMonochromator
Condenser Sample Zone plate
Phase ring CCD camera
The optical principle of TXM
55
Transmission X-ray Microscopy (TXM)
o As with conventional optical microscopes, these microscopes use incoherent or partially coherent illumination, making them well suited to use at bend magnet sources.
o To obtain the highest resolution:- The spectral resolving power of the specimen illumination should match the number of
zone plate zones- For a zone plate condenser/monochromator the spectral resolving power is given by
dcondenser/dfield when matched to the source size (dcondenser: the diameter of the condenser zone plate; dfield: the diameter of the image field as restricted using a monochromatorpinhole)
- Because imaging fields of 10-20 μm are usually desired, condenser zone plate diameter of 5-9 mm are preferred and the spectral resolving power is then in the range 200-400.
Transmission X-ray Microscopy (TXM)
56
o Current Energy Applications
- Batteries, catalysts and fuel cells can be characterized using TXM, both ex situ and in situ/operando (full operating system).
- 2D and 3D XANES imaging can determine nanoscale chemistry. - Single-energy tomography can determine porosity and tortuosity, and multiple-
energy tomography can determine elemental heterogeneities.- In situ structure for electrochemical study- Location specific structure changes on degradation mechanism study
57
Transmission X-ray Microscopy (TXM)

oApplications to circumvent technology issue
- Changes in near surface and morphology- 3D elemental distribution and morphological changes in nm scale- Evolution of surface or interface structure at nm scale- Interface structure by phase contrast- Structural and morphological changes during thermal decomposition
58
Transmission X-ray Microscopy (TXM)
The first design for an X-ray scanning microscope was put forward by Pattee:• It places the specimen in contact with the window of an X-ray tube.• The electron beam is scanned over the window, in television raster
fashion, generating x rays.• The transmitted flux is detected electronically, and this signal is
used to modulate the brightness of an oscilloscope trace, scanned in synchronism with the beam in the X-ray tube.
• The device did not live up to expectations in the practical sense, essentially because of the limitations of the X-ray source. The availability of synchrotron radiation brightens the prospects considerably for the future.
59
Scanning X-ray Microscopy (SXM)

The scanning X-ray microscope using synchrotron radiation was built by Horowitz and Howell for operation at the Cambridge Electron Accelerator:
• Ellipsoidal mirror was used to focus the beam to a 1×2 mm2 spot, with a 3.5 keV high-energy cutoff. A 10 μm-thick Be window terminated the vacuum system; the microscope itself was in the open environment.
• The beam was collimated with a 2 μm pinhole in a 100 μm-thick gold foil. This spot size sets the resolution of the instrument.
• The specimen was scanned in raster fashion across the spot.• Images formed by fluorescent x rays were obtained, revealing the
elemental composition of the specimen.
60
Scanning X-ray Microscopy (SXM)

Vacuum inout & exit window
ZP stage OSA stage
Wet specimen chamber
ZP: Zone plateOSA: Order sorting aperture
Proportional counter
Plazo X-Y stageStepping motor X-Y stage
Stepping motor Z stage
Zone plate
61
Scanning X-ray Microscopy (SXM)

Approaches to achieve higher resolution:
• Demagnify the beam spot emerging from the pinhole or from some other small source- Reflection optics with grazing-incidence mirrors, since the
aberrations of mirror systems are unimportant for the small field of view required.
- Reflection optics with multilayer normal-incidence mirrors will work best at longer wavelengths.
- Zone plate optics requires a monochromatic source.
62
Scanning X-ray Microscopy (SXM)
Applications to circumvent technology issue:
o Electrochemical performance, degradation mechanism study- Chemical/oxidation states and local structure in micro scale
o Understanding materials synthesis process- 2D composition and oxidation mapping
o Electrode-electrolyte Interface (SEI)- Local oxidation state change
63
Scanning X-ray Microscopy (SXM)

oUse conventional synchrotron grating monochromators: the spectral resolving power can be in the 1000-10,000 range.
oOperate best using undulator sources and even then the imaging time can be 1-10 minutes.
o Scanning microscopes can offer easier access to high spectral resolution and a range of modalities:− Dark field methods can be used to localize structures− Luminescence microscopy can be used to visualize light-emitting
probes.o No changes in optical configuration are required to change the image
field size or to maintain constant magnification as the X-ray wavelength is tuned.
64
Scanning Transmission X-ray Microscopy (STXM)
• In topography experiments a sample crystal is positioned in the undispersed white beam of synchrotron radiation (SR) producing Laue reflections. Any defects inside the crystals are projected onto the film and are observable as fine structures in the Laue reflections.
• In contrast to electron microscopy, which provides information on the location of features in small regions of materials, topography can portray minute deviations from crystal perfection over larger areas.
65
Topography
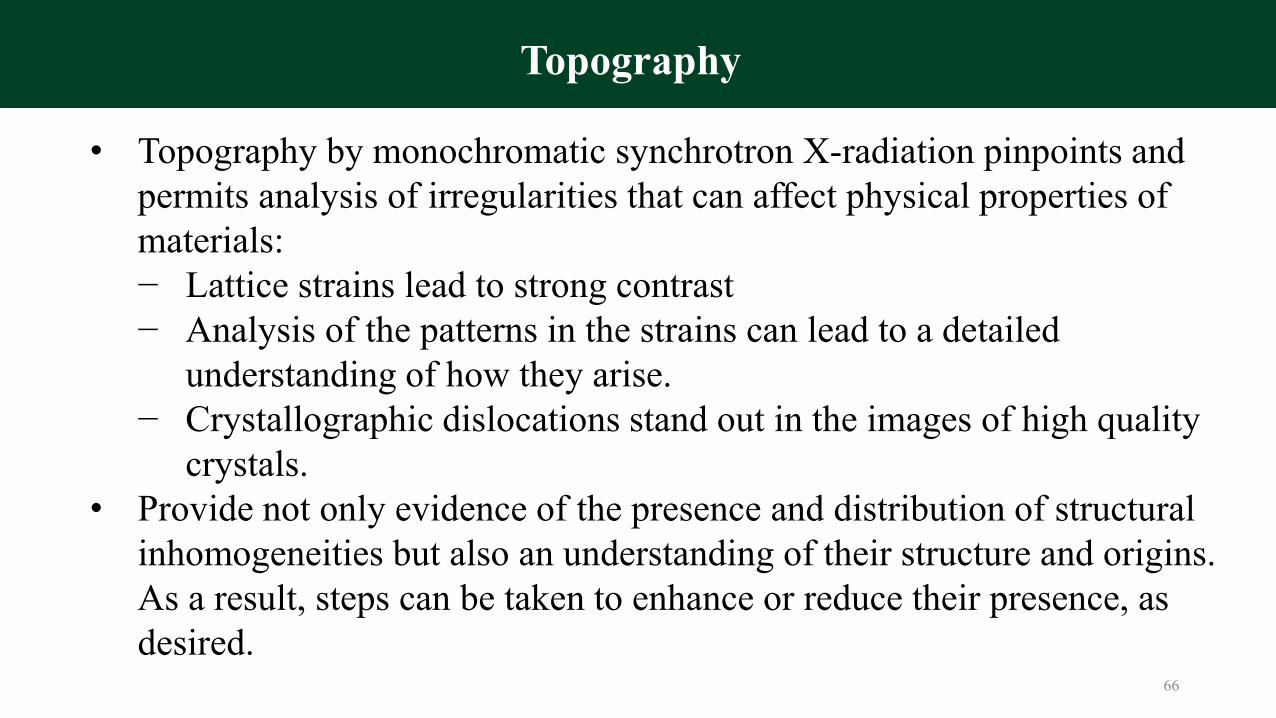
• Topography by monochromatic synchrotron X-radiation pinpoints and permits analysis of irregularities that can affect physical properties of materials:− Lattice strains lead to strong contrast− Analysis of the patterns in the strains can lead to a detailed
understanding of how they arise.− Crystallographic dislocations stand out in the images of high quality
crystals.• Provide not only evidence of the presence and distribution of structural
inhomogeneities but also an understanding of their structure and origins. As a result, steps can be taken to enhance or reduce their presence, as desired.
66
Topography
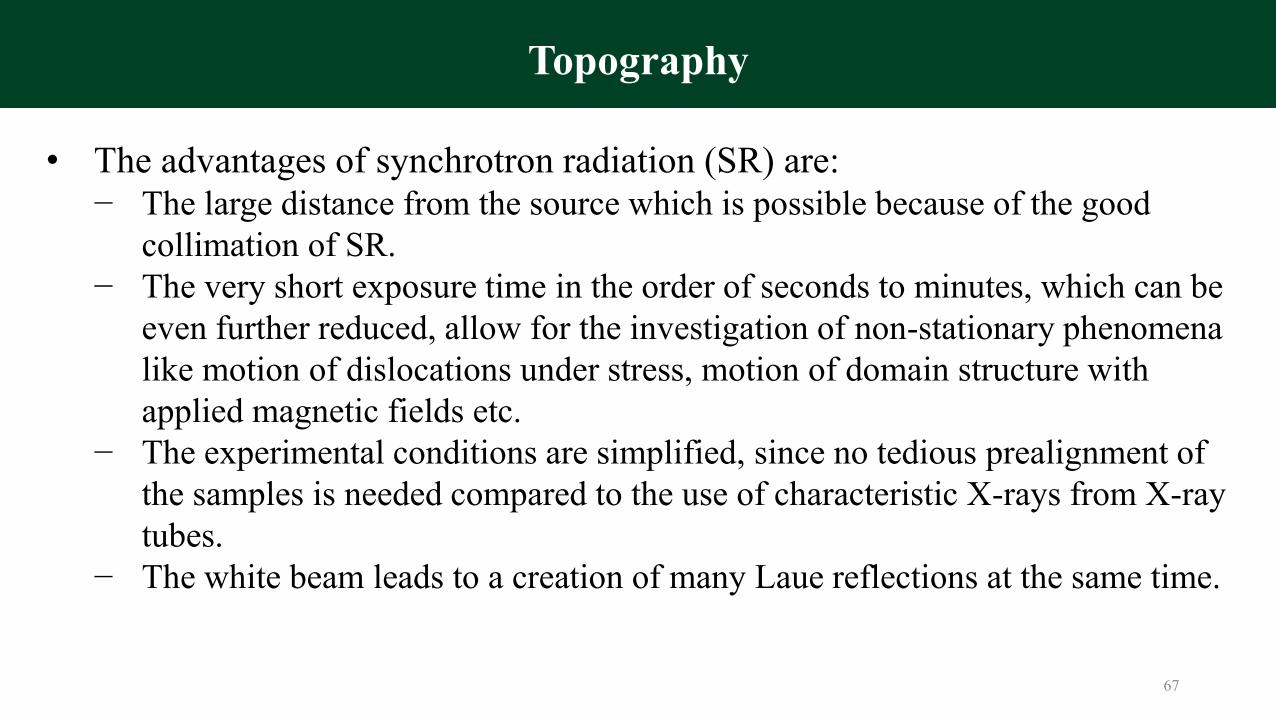
• The advantages of synchrotron radiation (SR) are:− The large distance from the source which is possible because of the good
collimation of SR.− The very short exposure time in the order of seconds to minutes, which can be
even further reduced, allow for the investigation of non-stationary phenomena like motion of dislocations under stress, motion of domain structure with applied magnetic fields etc.
− The experimental conditions are simplified, since no tedious prealignment of the samples is needed compared to the use of characteristic X-rays from X-ray tubes.
− The white beam leads to a creation of many Laue reflections at the same time.
67
Topography

White
Radiation
X-Y slits
Monochromaticradiation
X-Y slitsSample
Detector
White
Radiation
68
Topography

Applications to circumvent technology issue:o Electrochemical performance and electrode material study- Structural investigation in near surface- Strain distribution and strain induced by cycling
Important properties of SR:o Tunabilityo Brightnesso Pulses
69
Topography
X-ray photoemission electron microscopy (PEEM)/Low Energy Electron Microscopy (LEEM)
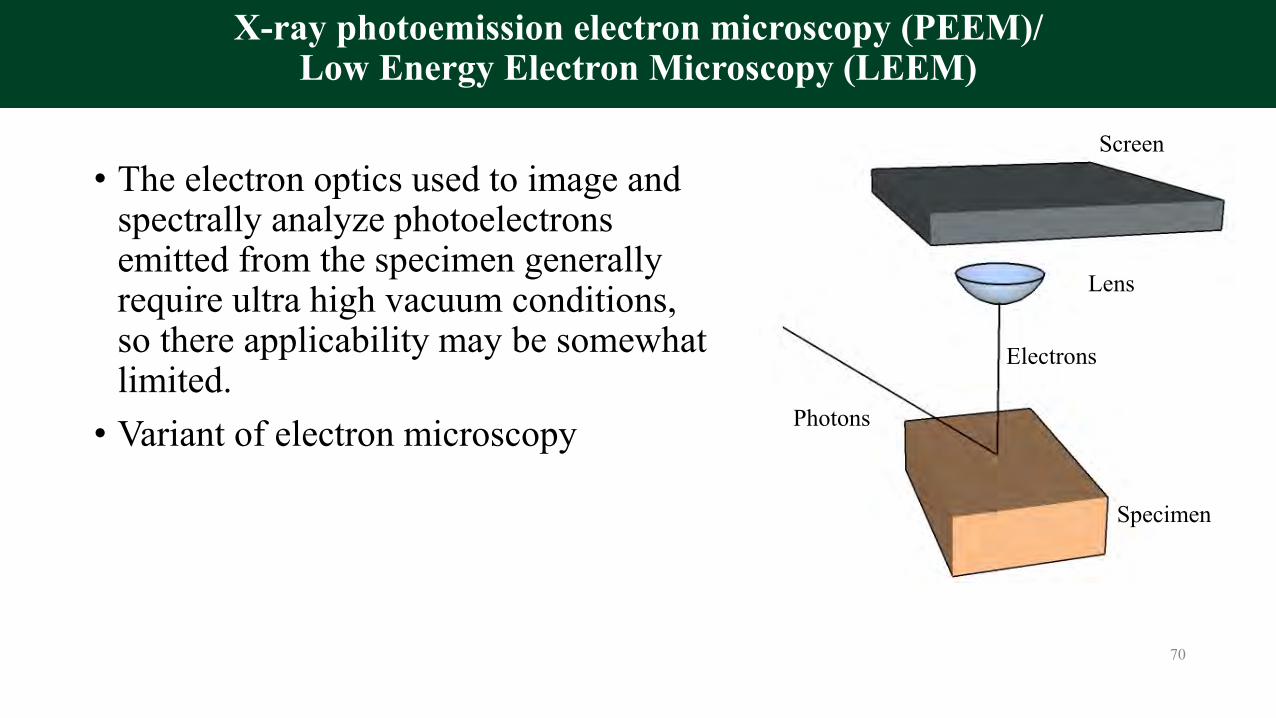
• The electron optics used to image and spectrally analyze photoelectrons emitted from the specimen generally require ultra high vacuum conditions, so there applicability may be somewhat limited.
• Variant of electron microscopy Photons
Electrons
Specimen
Lens
Screen
70
X-ray photoemission electron microscopy (PEEM)/Low Energy Electron Microscopy (LEEM)
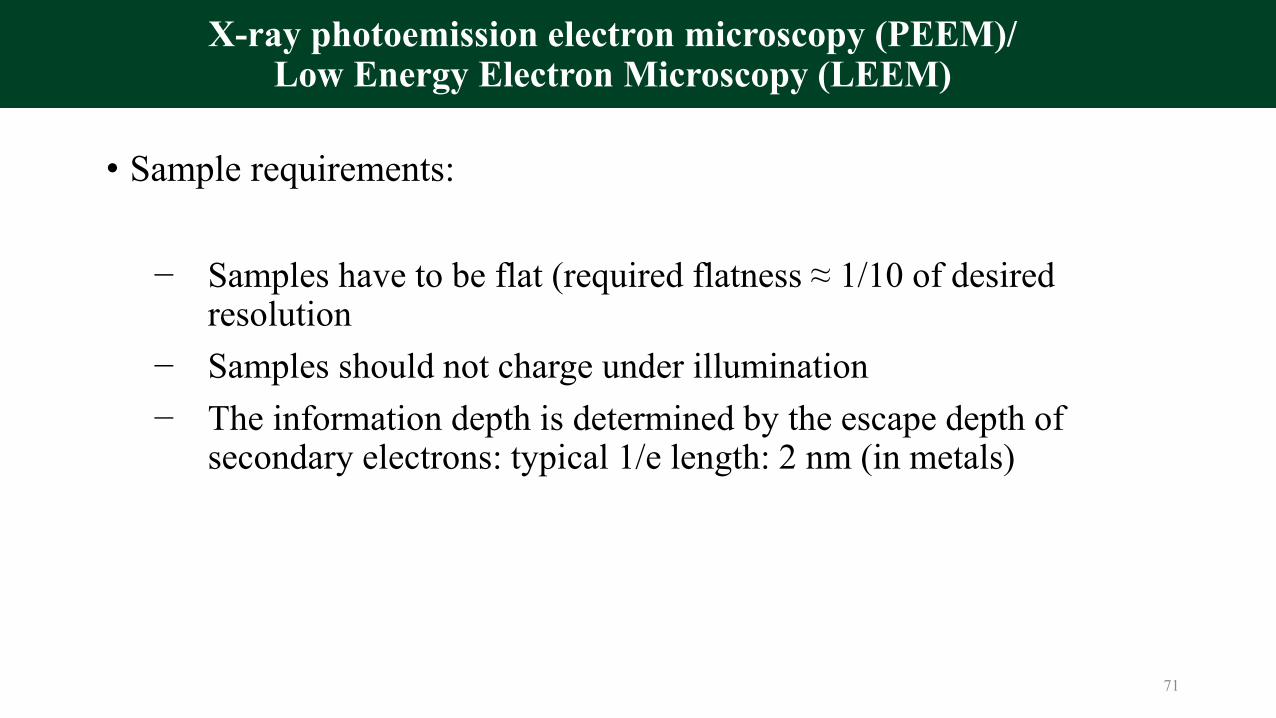
• Sample requirements:
− Samples have to be flat (required flatness ≈ 1/10 of desired resolution
− Samples should not charge under illumination− The information depth is determined by the escape depth of
secondary electrons: typical 1/e length: 2 nm (in metals)
71
X-ray photoemission electron microscopy (PEEM)/Low Energy Electron Microscopy (LEEM)
• The photoemission process comprises the following events:1) Absorption of the photon by the bound electron, thereby
increasing the kinetic energy of the electron2) Ejection of the electron from the atom using some of its kinetic
energy to overcome the Coulomb attraction of the nucleus3) Simultaneous with (2), the electrons in the outer orbitals readjust
(intra-atomic relaxation) to a low-energy final state, transferring this energy to the outgoing electron.
72

X-ray photoemission electron microscopy (PEEM)/Low Energy Electron Microscopy (LEEM)
• Applications to circumvent technology issue:o Electrochemical performance and electrode material study- Surface element 2D mapping
• Important properties of SR:o Tunabilityo Brightnesso Pulseso Polarizationo Total intensity
73
74
Synchrotron Radiation Tools
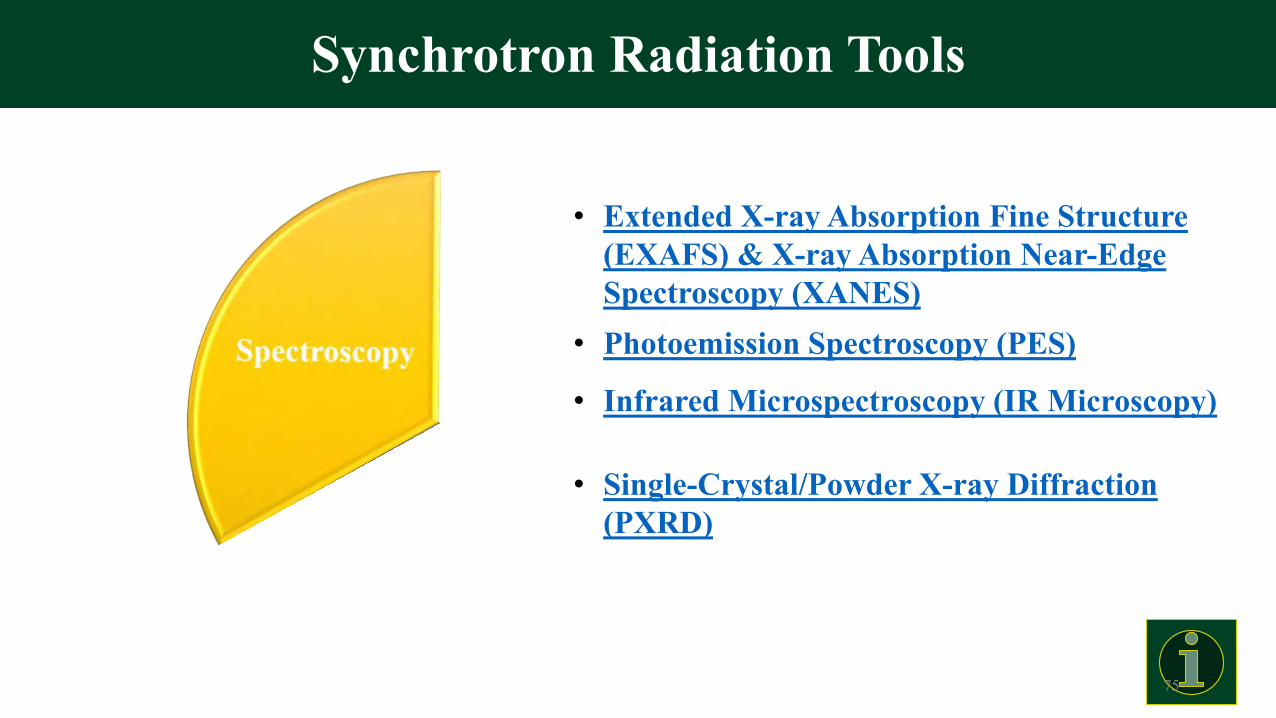
• Extended X-ray Absorption Fine Structure (EXAFS) & X-ray Absorption Near-Edge Spectroscopy (XANES)
• Photoemission Spectroscopy (PES)
• Infrared Microspectroscopy (IR Microscopy)
• Single-Crystal/Powder X-ray Diffraction (PXRD)
75
Synchrotron Radiation Tools
X-ray Absorption Fine Structure (XAFS)
• Introduction‒ X-ray absorption fine structure (XAFS) refers to the details of how X-rays are
absorbed by an atom at energies near and above the core-level binding energies of that atom. Specifically, XAFS is the modulation of an atom’s X-ray absorption probability due to the chemical and physical state of the atom.
‒ X-ray spectra are distinguished from ordinary visible light or soft-UV spectra by the fact that these photons can excite inner-shell electrons from the absorbing atoms with consequent sharp steps in the absorption cross section as the X-ray energy is increased through an inner-shell ionization threshold.
76
X-ray Absorption Fine Structure (XAFS)
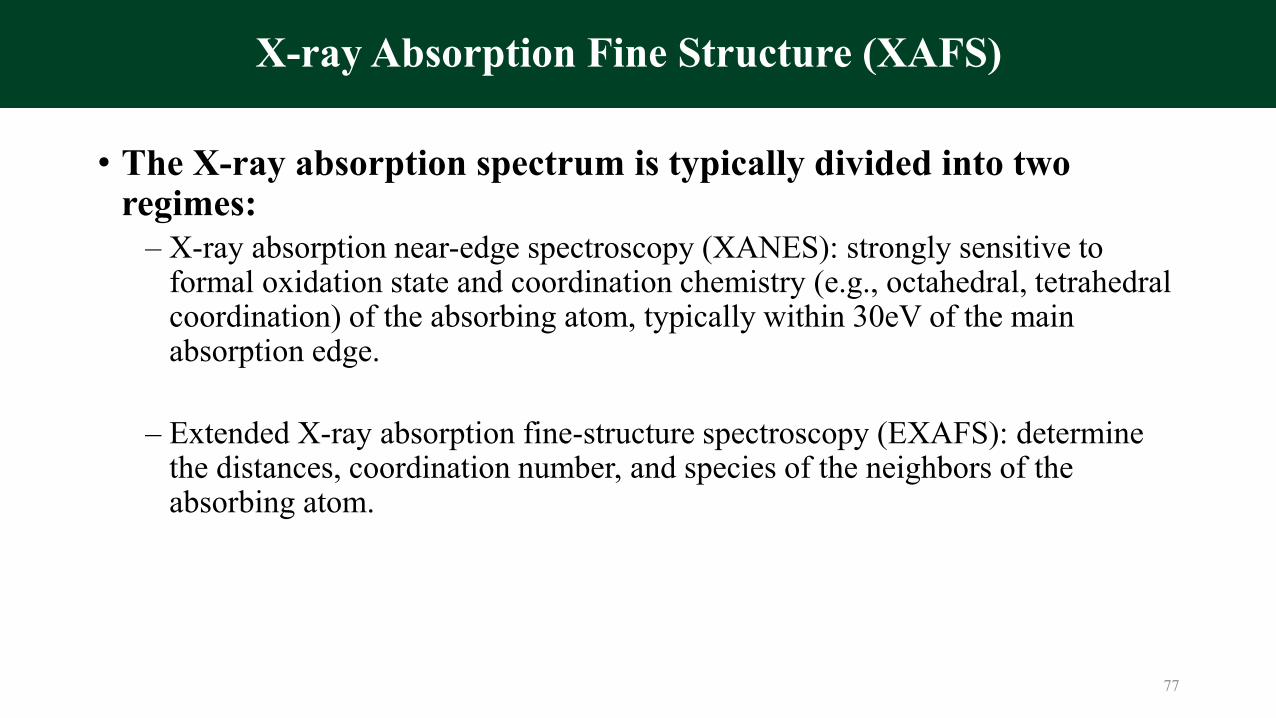
• The X-ray absorption spectrum is typically divided into two regimes:
‒ X-ray absorption near-edge spectroscopy (XANES): strongly sensitive to formal oxidation state and coordination chemistry (e.g., octahedral, tetrahedral coordination) of the absorbing atom, typically within 30eV of the main absorption edge.
‒ Extended X-ray absorption fine-structure spectroscopy (EXAFS): determine the distances, coordination number, and species of the neighbors of the absorbing atom.
77

XANES EXAFS
χ 𝐸 =μ 𝐸 − μ0(𝐸)
μ0(𝐸)
- K-edge- Oxidation state- Charge transfer
- Phase: local ordering- Amplitude: particle size
Virtual observation
Pre-edge region
Edge region
EXAFS region
78

Extended X-ray Absorption Fine Structure (EXAFS)
• Characteristics‒ The Threshold Region: It contains information about the binding energies,
quantum numbers, and multiplicities of low-lying bound electronic excited states of the ionized absorbing atom and of low-lying resonant electronic states in the continuum of the absorbing atom.
‒ The EXAFS Region: The observed series of gentle oscillations in the absorption cross section may be interpreted in a highly quantitative way in terms of the scattering of the excited photoelectrons by the neighboring atoms and the resulting interference of this reflected electron wave with the outgoing photoelectron waves, leading to the observed modulation of the cross section.
79
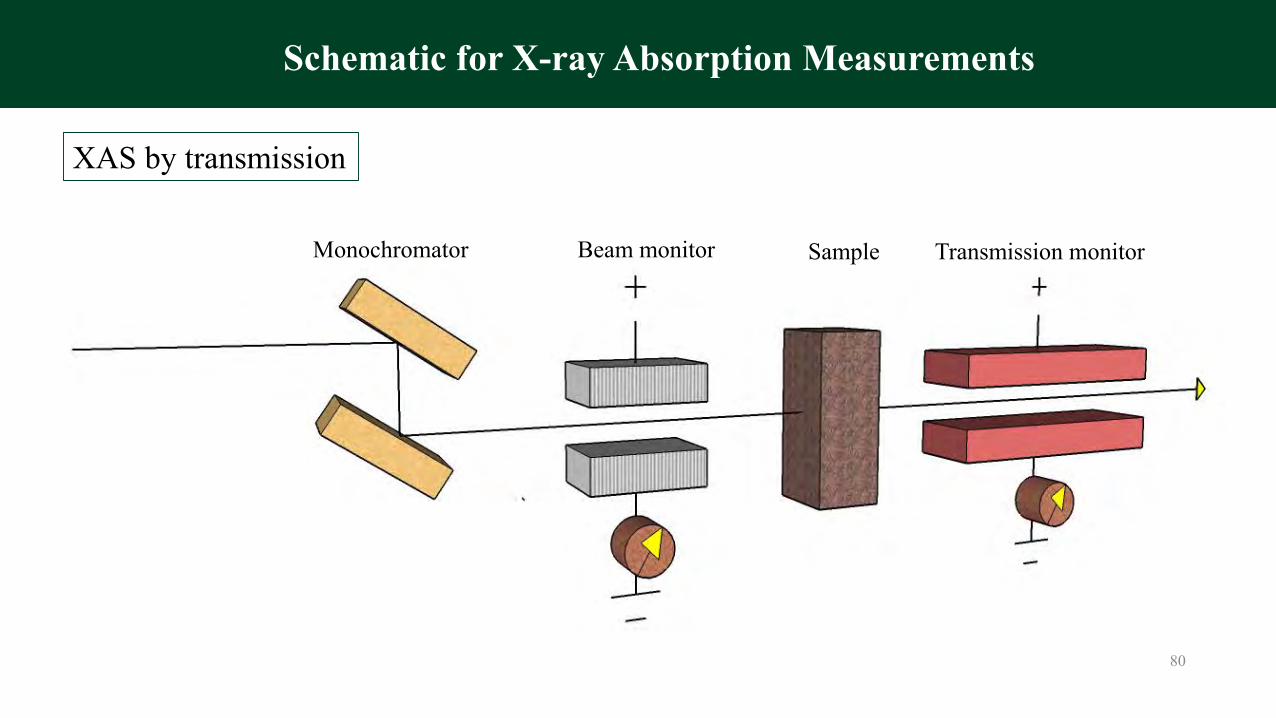
Monochromator Beam monitor Sample Transmission monitor
XAS by transmission
80
Schematic for X-ray Absorption Measurements
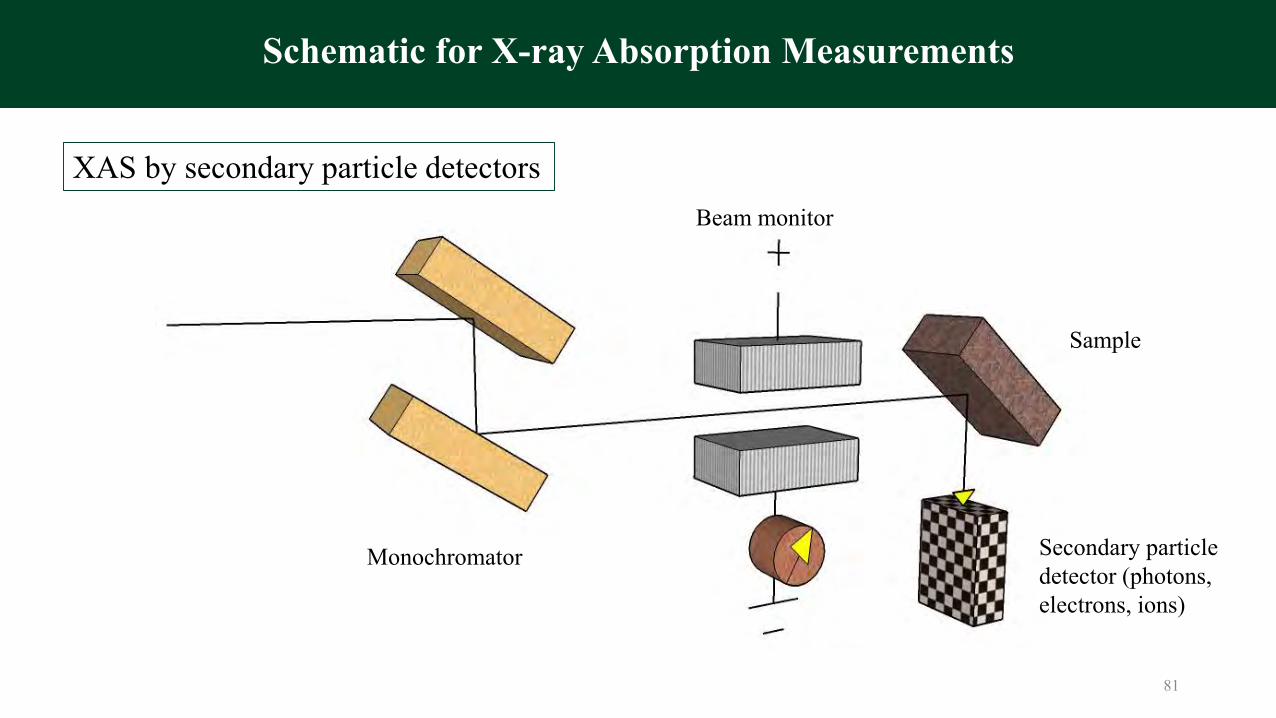
Monochromator
Beam monitor
Sample
Secondary particle detector (photons, electrons, ions)
XAS by secondary particle detectors
81
Schematic for X-ray Absorption Measurements

X-ray Absorption Near-edge Spectroscopy (XANES)
• XANES Interpretation‒ Since XANES is a much larger signal than EXAFS, XANES can be done at
lower concentrations, and at less-than-perfect sample conditions. ‒ The interpretation of XANES is complicated by the fact that there is not a
simple analytic (or even physical) description of XANES. Still, there is much chemical information from the XANES region, notably formal valence (very difficult to experimentally determine in a nondestructive way) and coordination environment.
‒ The edge position and shape is sensitive to formal valence state, ligand type, and coordination environment.
‒ If nothing else, XANES can be used as a fingerprint to identify phases.
82
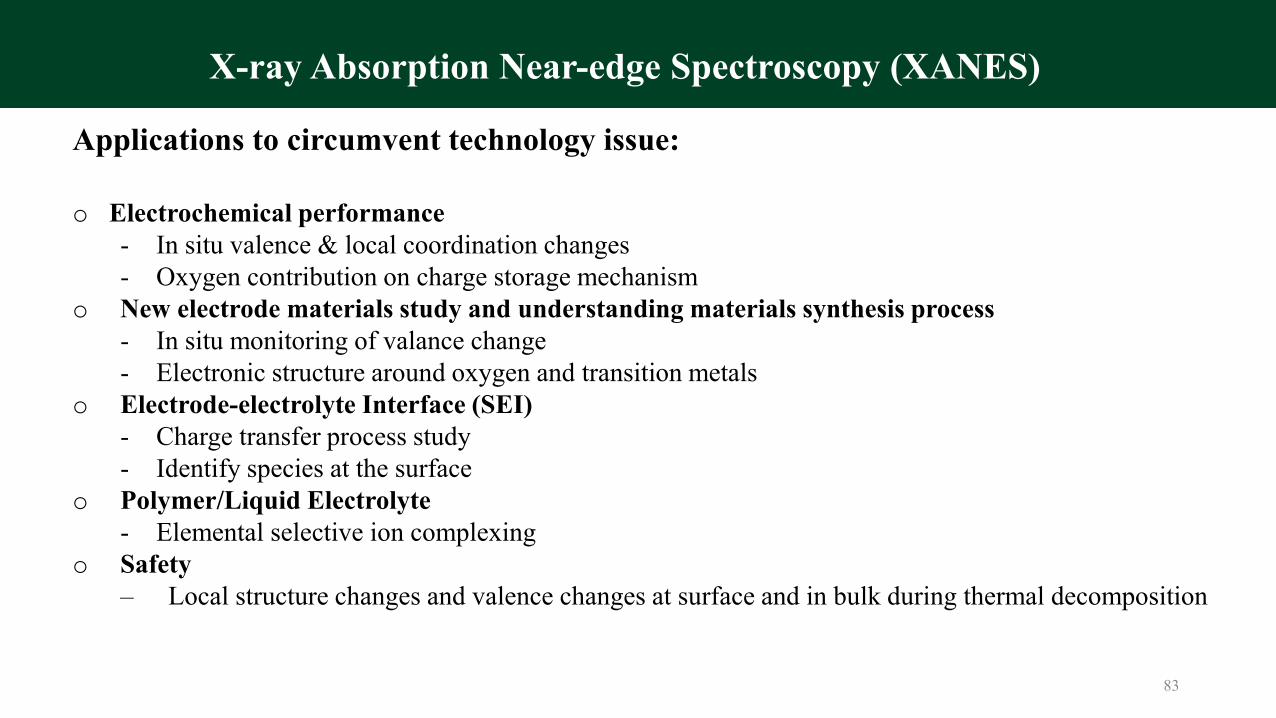
Applications to circumvent technology issue:
o Electrochemical performance- In situ valence & local coordination changes- Oxygen contribution on charge storage mechanism
o New electrode materials study and understanding materials synthesis process- In situ monitoring of valance change- Electronic structure around oxygen and transition metals
o Electrode-electrolyte Interface (SEI)- Charge transfer process study- Identify species at the surface
o Polymer/Liquid Electrolyte- Elemental selective ion complexing
o Safety‒ Local structure changes and valence changes at surface and in bulk during thermal decomposition
83
X-ray Absorption Near-edge Spectroscopy (XANES)

Extended X-ray Absorption Fine Structure (EXAFS)
• General features in the use of EXAFS to determine near-neighbor structural information:
‒ The absorption spectrum is element specific: the inner-shell absorption steps occur at X-ray energies characteristic of the atomic number of the absorbing element, so that individual element absorption spectra can be picked out in samples containing a complex chemical mixture of different elements simply by changing the X-ray wavelength;
‒ The absorption measurement is entirely independent of the physical form of the sample: It may be applied to gases, liquids, solids (both crystalline and noncrystalline), amorphous materials, living matter, mineral samples, etc.
84
Extended X-ray Absorption Fine Structure (EXAFS)
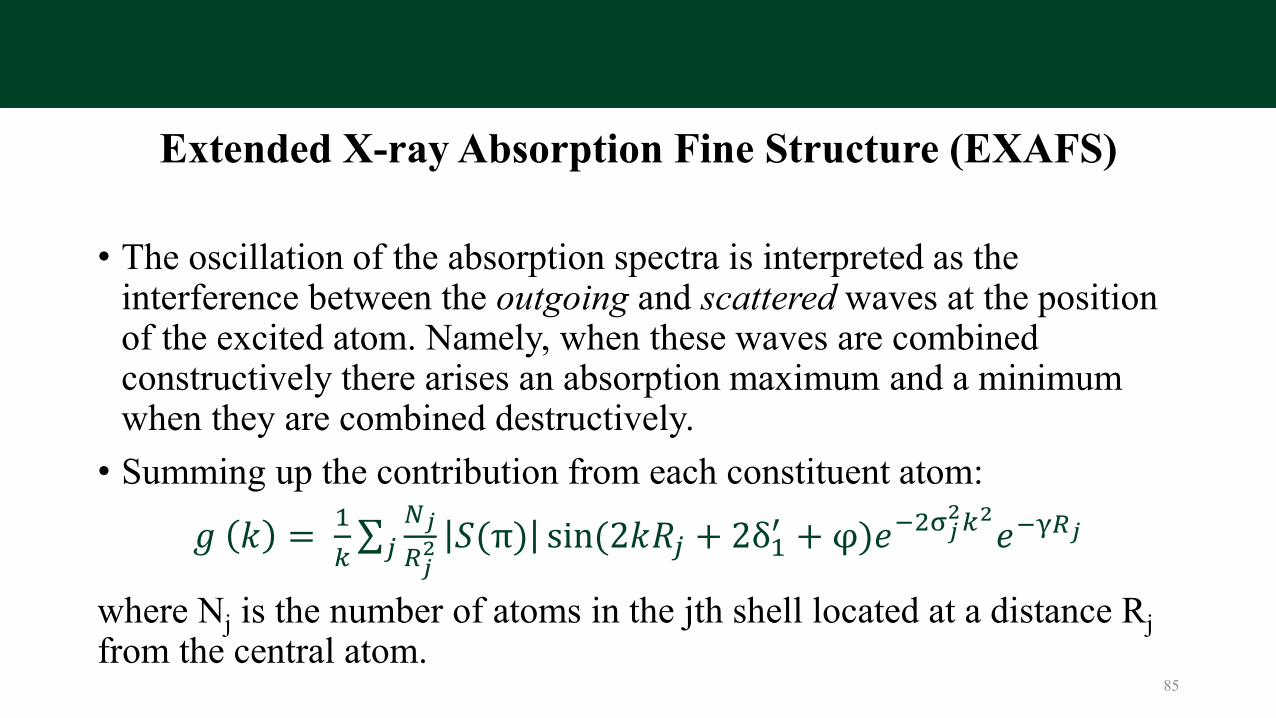
• The oscillation of the absorption spectra is interpreted as the interference between the outgoing and scattered waves at the position of the excited atom. Namely, when these waves are combined constructively there arises an absorption maximum and a minimum when they are combined destructively.
• Summing up the contribution from each constituent atom:
𝑔 𝑘 =1
𝑘σ𝑗
𝑁𝑗
𝑅𝑗2 𝑆(π) sin(2𝑘𝑅𝑗 + 2δ1
′ + φ)𝑒−2σ𝑗2𝑘2𝑒−γ𝑅𝑗
where Nj is the number of atoms in the jth shell located at a distance Rjfrom the central atom.
85
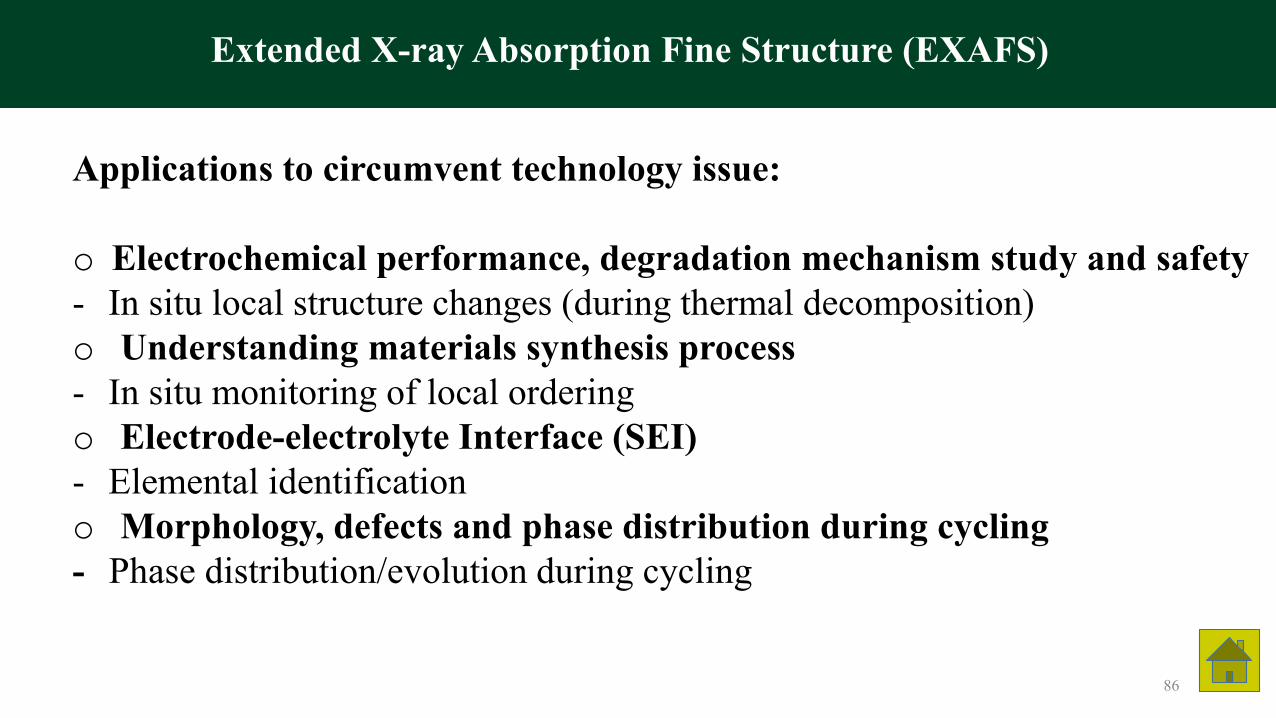
Applications to circumvent technology issue:
o Electrochemical performance, degradation mechanism study and safety- In situ local structure changes (during thermal decomposition)o Understanding materials synthesis process- In situ monitoring of local orderingo Electrode-electrolyte Interface (SEI)- Elemental identificationo Morphology, defects and phase distribution during cycling- Phase distribution/evolution during cycling
86
Extended X-ray Absorption Fine Structure (EXAFS)
Photoemission Spectroscopy (PES)
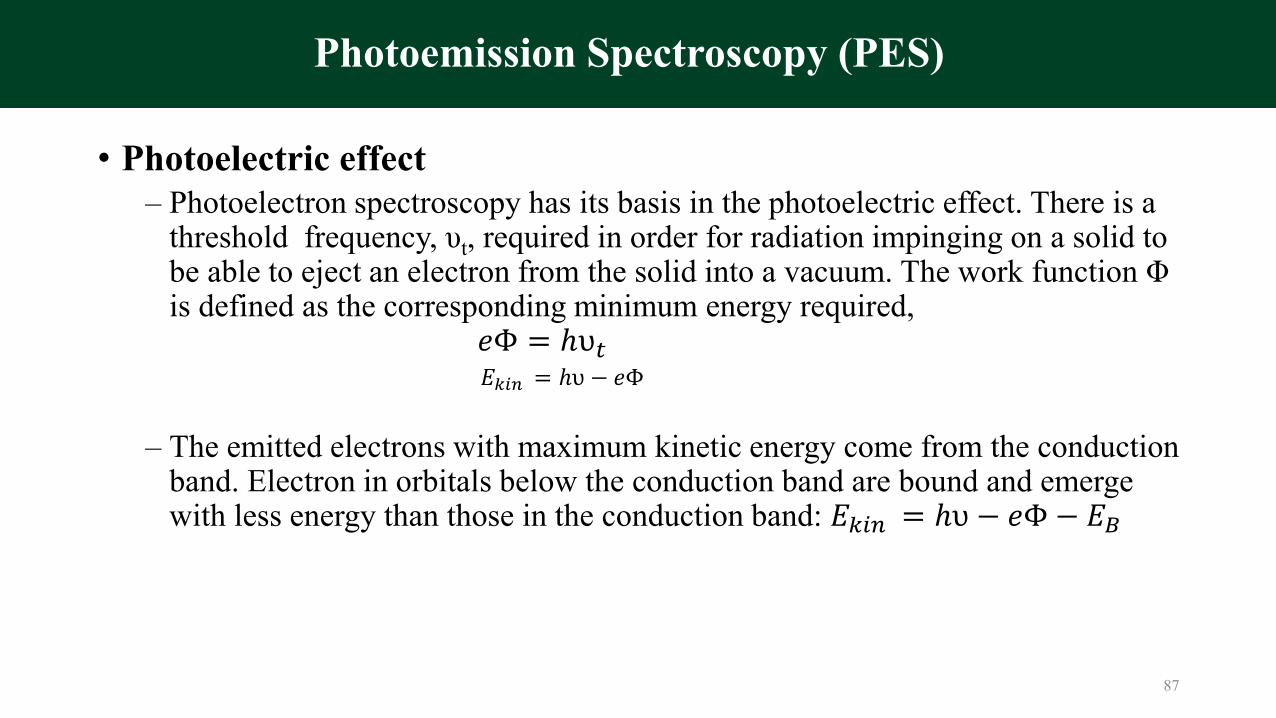
• Photoelectric effect‒ Photoelectron spectroscopy has its basis in the photoelectric effect. There is a
threshold frequency, υt, required in order for radiation impinging on a solid to be able to eject an electron from the solid into a vacuum. The work function Φis defined as the corresponding minimum energy required,
𝑒Φ = ℎυ𝑡𝐸𝑘𝑖𝑛 = ℎυ − 𝑒Φ
‒ The emitted electrons with maximum kinetic energy come from the conduction band. Electron in orbitals below the conduction band are bound and emerge with less energy than those in the conduction band: 𝐸𝑘𝑖𝑛 = ℎυ − 𝑒Φ − 𝐸𝐵
87
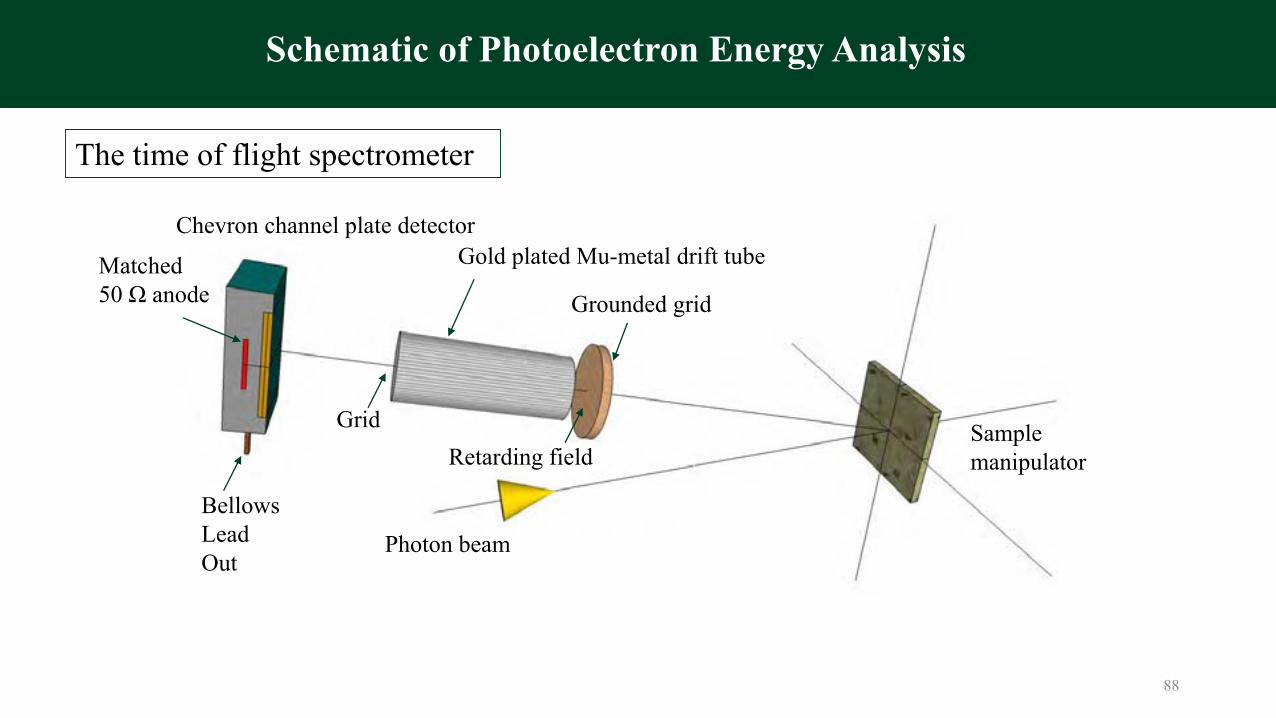
Photon beam
Gold plated Mu-metal drift tube
Sample manipulator
The time of flight spectrometer
Grounded grid
GridRetarding field
BellowsLeadOut
Matched 50 Ω anode
Chevron channel plate detector
88
Schematic of Photoelectron Energy Analysis
Photoemission Spectroscopy (PES)
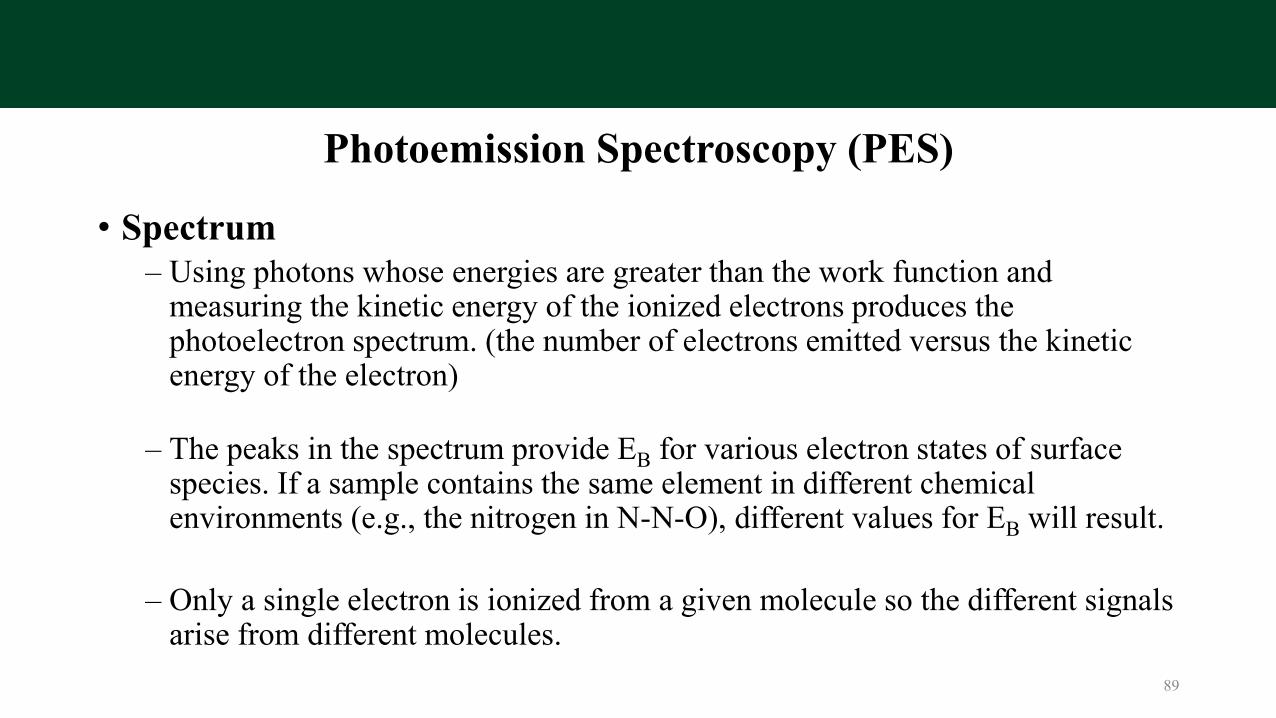
• Spectrum‒ Using photons whose energies are greater than the work function and
measuring the kinetic energy of the ionized electrons produces the photoelectron spectrum. (the number of electrons emitted versus the kinetic energy of the electron)
‒ The peaks in the spectrum provide EB for various electron states of surface species. If a sample contains the same element in different chemical environments (e.g., the nitrogen in N-N-O), different values for EB will result.
‒ Only a single electron is ionized from a given molecule so the different signals arise from different molecules.
89

Photoemission Spectroscopy (PES)
• Category The source photon is monochromatic. Depending upon whether X-ray or ultraviolet radiation is employed, two different experiments result.
‒ The X-ray source experiment is called either X-ray photoelectron spectroscopy (XPS) or electron spectroscopy for chemical analysis (ESCA). XPS is concerned with both valence and non-valence shell (core) electrons.
‒ The ultraviolet source is called ultraviolet photoelectron spectroscopy (UPS or PES). UPS is concerned with valence shell electrons.
90

Photoemission Spectroscopy (PES)
• XPS
The Nobel Prize in Physics 1921 was awarded to Albert Einstein "for his services to Theoretical Physics, and especially for his discovery of the law of the photoelectric effect".
The Nobel Prize in Physics 1981 was divided, one half to Kai M. Siegbahn "for his contribution to the development of high-resolution electron spectroscopy".
91
Photoemission Spectroscopy (PES)
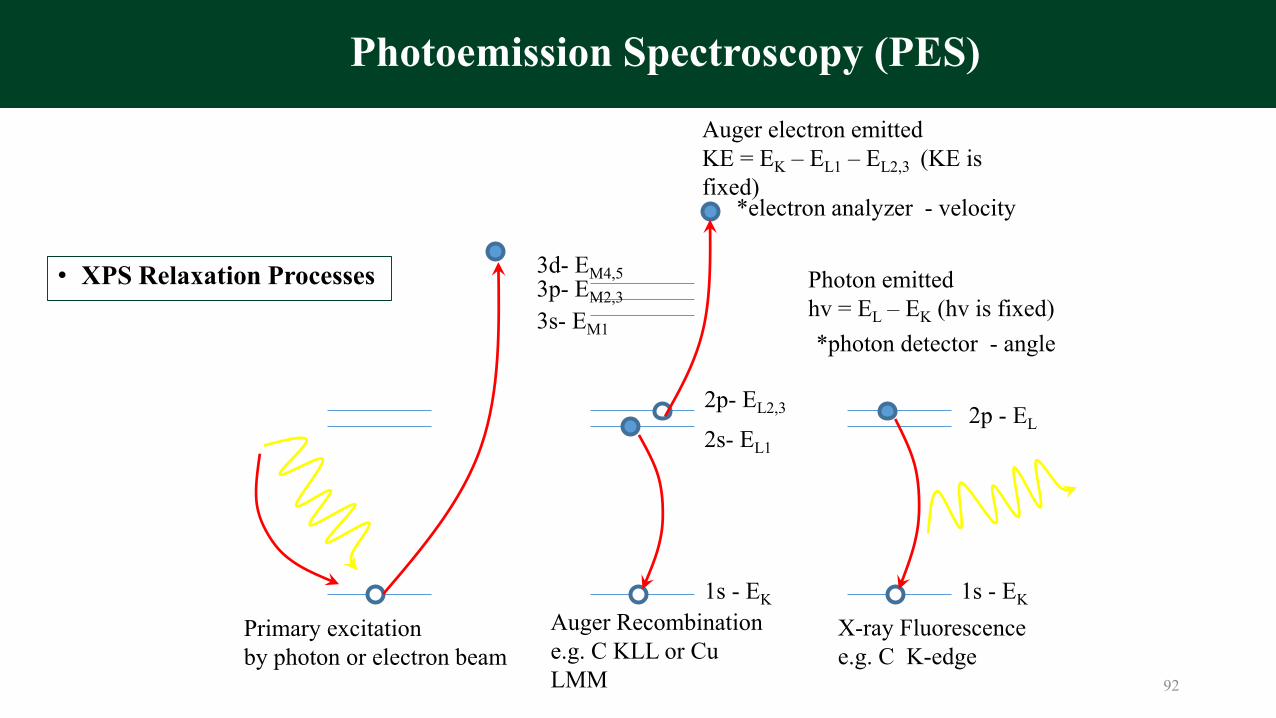
• XPS Relaxation Processes
Auger Recombination e.g. C KLL or Cu LMM
Auger electron emittedKE = EK – EL1 – EL2,3 (KE is fixed)
1s - EK
2s- EL1
1s - EK
2p - EL
Photon emittedhv = EL – EK (hv is fixed)
X-ray Fluorescence e.g. C K-edge
Primary excitation by photon or electron beam
*electron analyzer - velocity
*photon detector - angle
2p- EL2,3
3s- EM1
3p- EM2,3
3d- EM4,5
92
Photoemission Spectroscopy (PES)
• XPSSolids (including frozen solutions), gases, liquids, and solutions have been studied by XPS.The photoemission process comprises the following events:
1. Absorption of the photon by the bound electron, thereby increasing the kinetic energy of the electron.
2. Ejection of the electron from the atom using some of its kinetic energy to overcome the Coulomb attraction of the nucleus.
3. Simultaneous with 2, the electrons in the outer orbitals readjust (intra-atomic relaxation) to a lower-energy final state, transferring this energy to the outgoing electron.
93

Photoemission Spectroscopy (PES)
• UPSoIn the UPS experiment, vacuum ultraviolet radiation is used as the
ionizing radiation; usually this is provided by a helium resonance lamp with an energy of 21.21 eV. The energy of the lamps limits UPS to studies of valence electrons and, in general, measurements have been mostly confined to gaseous samples.
oThe vibrational structure on a UPS band tells something about the bonding characteristics of the electron that is ionized. The ionization of a non-bonding electron will result in an ion with the same internuclear distance as the parent molecule.
94
The tunability of the synchrotron radiation over a large energy region has made it possible to optimize the two most important parameters:- Photoionization cross sections (matrix elements)- Electron escape depths
Applications to circumvent technology issue:o Degradation mechanism study- Electronic energy-band structureso Electrode-electrolyte Interface (SEI)- Bulk/surface electronic structure
95
Photoemission Spectroscopy (PES)
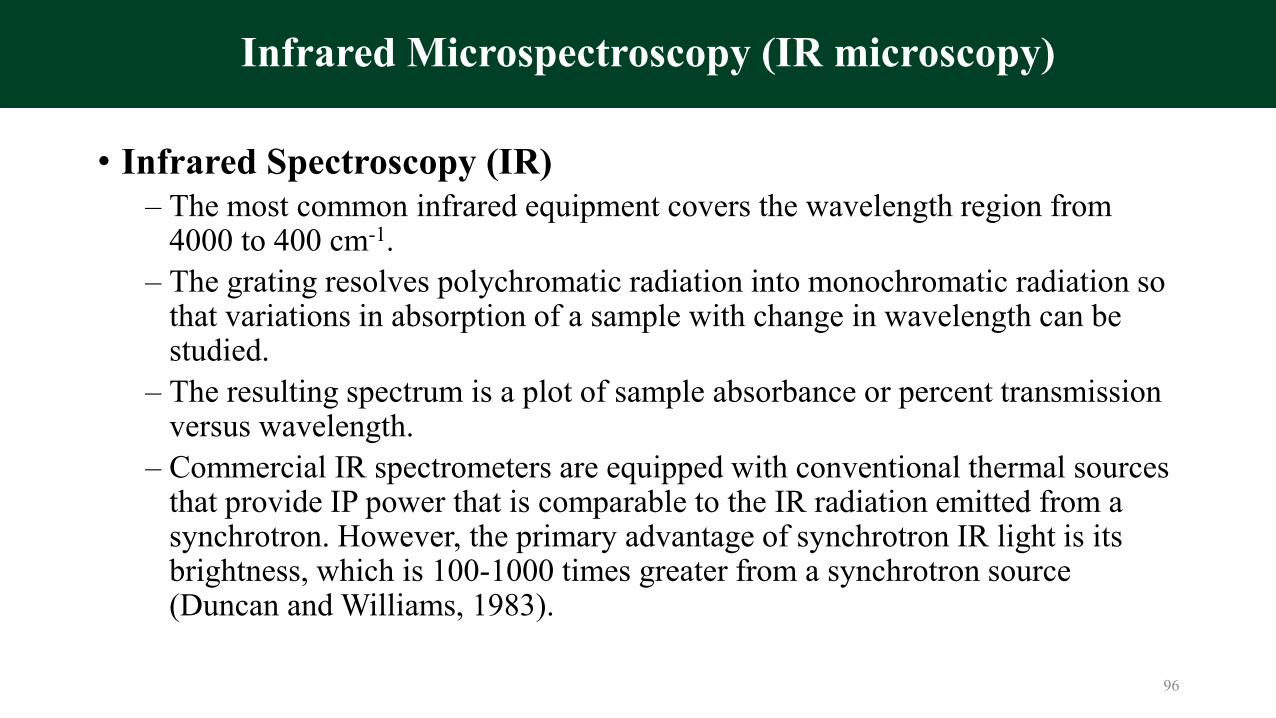
• Infrared Spectroscopy (IR)‒ The most common infrared equipment covers the wavelength region from
4000 to 400 cm-1.‒ The grating resolves polychromatic radiation into monochromatic radiation so
that variations in absorption of a sample with change in wavelength can be studied.
‒ The resulting spectrum is a plot of sample absorbance or percent transmission versus wavelength.
‒ Commercial IR spectrometers are equipped with conventional thermal sources that provide IP power that is comparable to the IR radiation emitted from a synchrotron. However, the primary advantage of synchrotron IR light is its brightness, which is 100-1000 times greater from a synchrotron source (Duncan and Williams, 1983).
96
Infrared Microspectroscopy (IR microscopy)
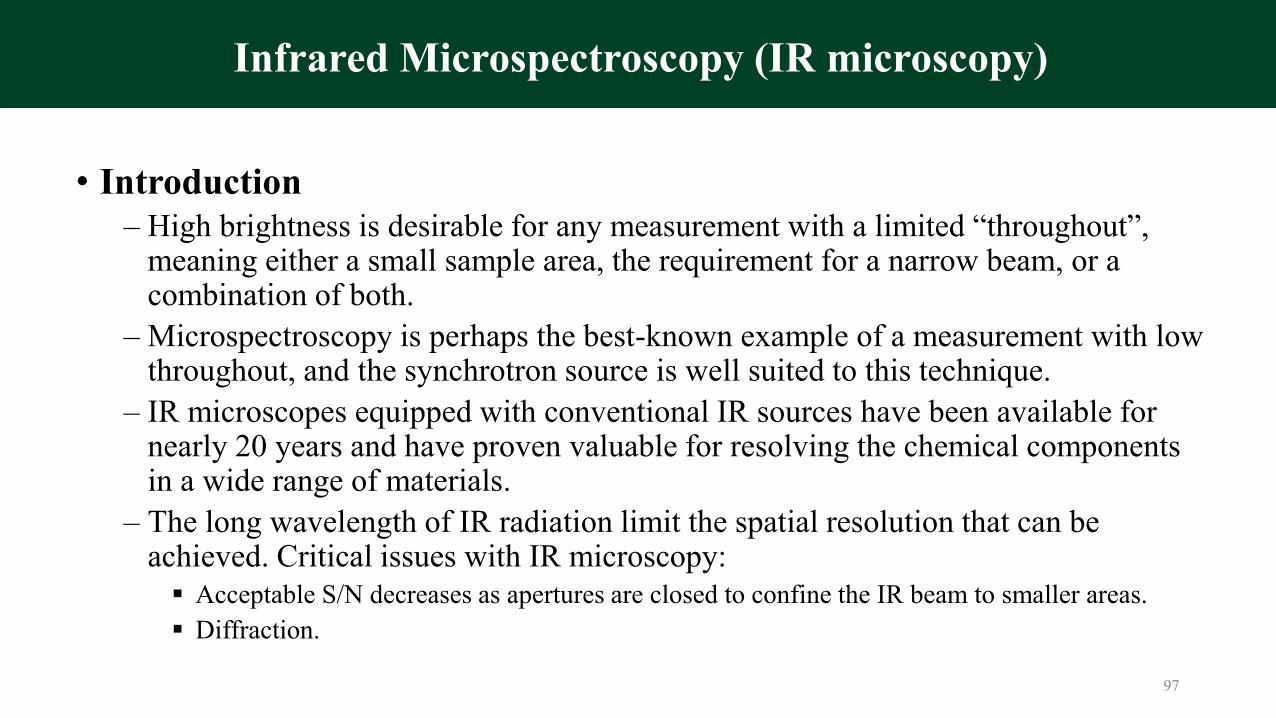
• Introduction‒ High brightness is desirable for any measurement with a limited “throughout”,
meaning either a small sample area, the requirement for a narrow beam, or a combination of both.
‒ Microspectroscopy is perhaps the best-known example of a measurement with low throughout, and the synchrotron source is well suited to this technique.
‒ IR microscopes equipped with conventional IR sources have been available for nearly 20 years and have proven valuable for resolving the chemical components in a wide range of materials.
‒ The long wavelength of IR radiation limit the spatial resolution that can be achieved. Critical issues with IR microscopy: Acceptable S/N decreases as apertures are closed to confine the IR beam to smaller areas. Diffraction.
97
Infrared Microspectroscopy (IR microscopy)

Infrared Microspectroscopy (IR) Related Techniques
Fourier transform infrared (FTIR) technique:• Greatly decrease the amount of time needed to accumulate a spectrum.• Multiple scanning of the spectrum and computer storage of the scans become
feasible, greatly enhance the signal-to-noise ratio.• Filtering is not required, eliminate the need for energy-wasting slits.• Enhanced resolution in a shorter time period is possible.• Many magnetic nuclei are present in nature in low abundance and also have low
sensitivity (e.g., 13C). The signal is reinforced by each sweep and, eventually, on adding many sweeps, the spectrum emerges from the background. This process is time consuming.
98
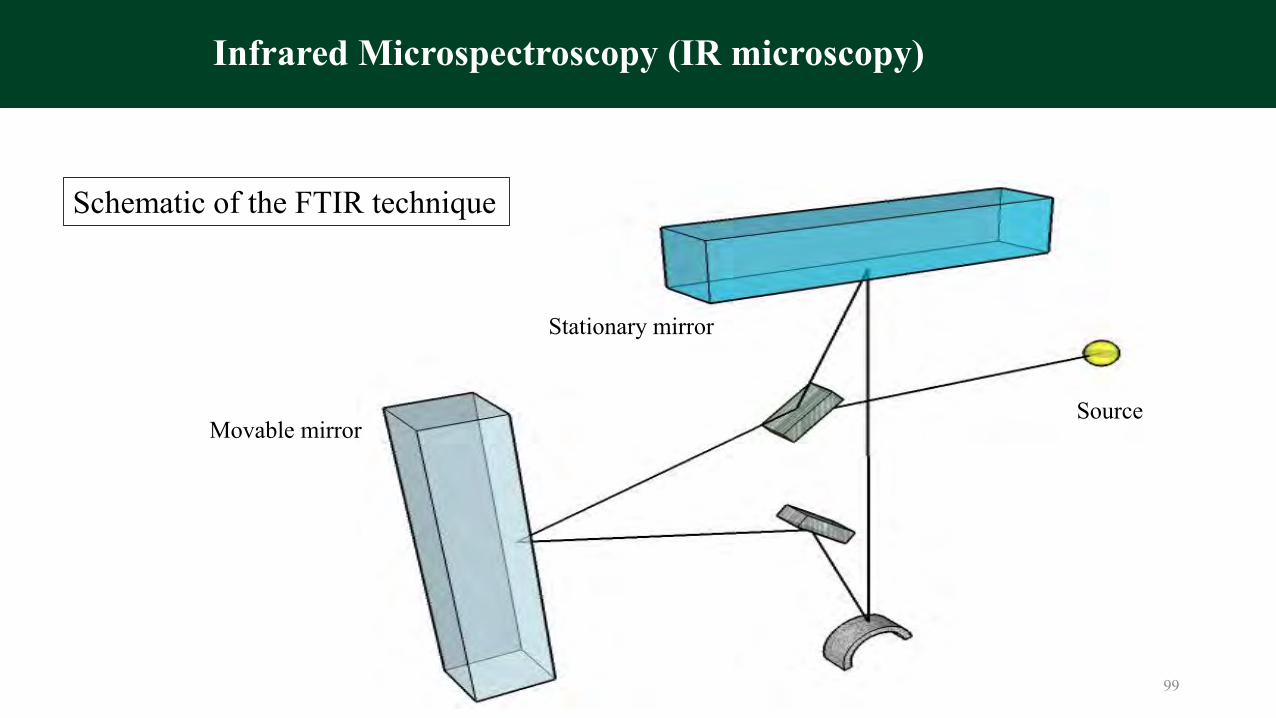
Infrared Microspectroscopy (IR microscopy)
Schematic of the FTIR technique
Movable mirror
Stationary mirror
Source
99
o Current Energy Applications
- Reaction pathway study on electrochemical performance.
- Identifying species present in polymer/liquid electrolyte and Electrode-electrolyte interface (SEI)
- The improvement in spatial resolution achieved by synchrotron IR source has only been realized recently, and many applications are still in their infancy.
100
Infrared Microspectroscopy (IR microscopy)
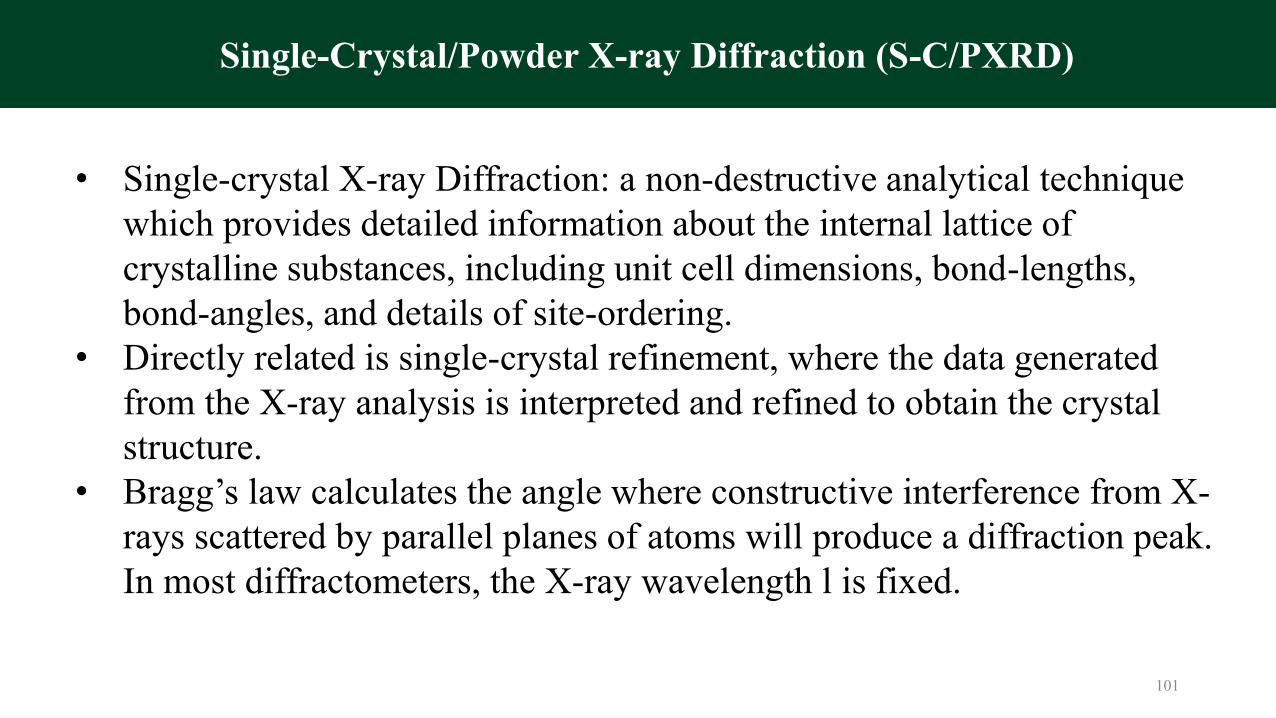
• Single-crystal X-ray Diffraction: a non-destructive analytical technique which provides detailed information about the internal lattice of crystalline substances, including unit cell dimensions, bond-lengths, bond-angles, and details of site-ordering.
• Directly related is single-crystal refinement, where the data generated from the X-ray analysis is interpreted and refined to obtain the crystal structure.
• Bragg’s law calculates the angle where constructive interference from X-rays scattered by parallel planes of atoms will produce a diffraction peak. In most diffractometers, the X-ray wavelength l is fixed.
101
Single-Crystal/Powder X-ray Diffraction (S-C/PXRD)

o X-ray Diffraction(XRD)
Ɵ ƟBragg’s Lawnλ=d sinθ
Incident beam reflected beam Detector/counter
d: the perpendicular distance between pairs of adjacent planesɵ: the angle of incidence, or Bragg angleλ: the X-ray wavelength
102
X-ray Diffraction (XRD)
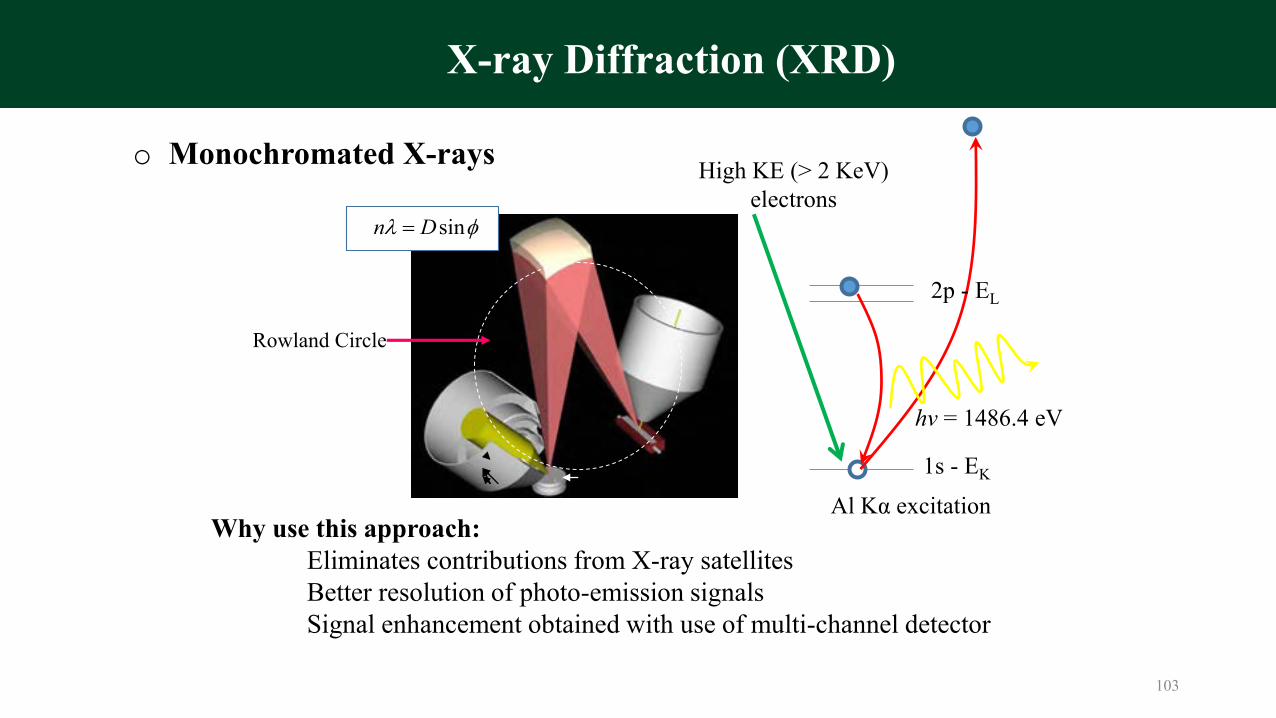
o Monochromated X-rays
Anode
Monochromator
Rowland Circle
Why use this approach:Eliminates contributions from X-ray satellitesBetter resolution of photo-emission signalsSignal enhancement obtained with use of multi-channel detector
Sample 1s - EK
Al Kα excitation
2p - EL
hν = 1486.4 eV
High KE (> 2 KeV) electrons
sinDn
103
X-ray Diffraction (XRD)
• Instrumentation o Single-crystal diffractometers use either 3- or 4-circle goniometers.
These circles refer to the four angles (2θ, χ, φ, and Ω) that define the relationship between the crystal lattice, the incident ray and detector.
o Samples are mounted on thin glass fibers which are attached to brass pins and mounted onto goniometer heads. Adjustment of the X, Y and Z orthogonal directions allows centering of the crystal within the X-ray beam.
o Modern single-crystal diffractometers use CCD (charge-coupled device) technology to transform the X-ray photons into an electrical signal which are then sent to a computer for processing.
104
Single-Crystal/Powder X-ray Diffraction (S-C/PXRD)
Applications to circumvent technology issue:
o Electrochemical performance- Dynamic studies
o Degradation mechanism during cycling & storage- Irreversible structural damage
o New electrode materials study and understanding materials synthesis process- Temperature dependent in-situ phase identification, defect analysis
o Electrode-electrolyte Interface (SEI)- Interface structure
o Safety‒ In-situ phase transformation during thermal decomposition
105
Single-Crystal/Powder X-ray Diffraction (S-C/PXRD)
Technique List
• Synchrotron Tools
Scattering/DiffractionHigh Energy X-Ray DiffractionMicro X-Ray Diffraction (μ-XRD) Pair Diffraction Function (PDF) Small/Wide Angle X-ray Scattering (SAXS/WAXS)Grazing-Incidence Small-angle X-ray Scattering/X-
ray Diffraction (GISAXS/GIXD) Resonant X-ray scattering/diffraction (RXS/RXD)Micro-X-ray computed tomography (µ-XCT)
Imaging Soft X-ray Microscopy Overview Transmission X-Ray Microscopy (TXM) Scanning X-Ray Microscopy (SXM) TopographyX-Ray Photoemission Electron Microscopy
(PEEM)/Low Energy Electron Microscopy (LEEM)
Spectroscopy Extended X-ray Absorption Fine Structure (EXAFS)
& X-ray Absorption Near-Edge Spectroscopy (XANES)
Photoemission Spectroscopy (PES) Infrared Microspectroscopy (IR Microscopy) Single-Crystal/Powder X-ray Diffraction (PXRD)
106

References/Further readings
• Synchrotron Radiation Research, Herman Winick and S. Doniach, 1980.• Topics in Current Physics, Vol 10, Synchrotron Radiation, techniques and
applications, C. Kunz, 1979.• Fundamentals of Powder Diffraction and Structural Characterization of
Materials, Vitalij K. Pecharsky and Peter Y. Zavalij.• CMS workshop lectures, Vol 9, Synchrotron X-ray Methods in Clay
Science, 1999.• Physical Methods for chemists, second edition, Russell S. Drago, 1992.• Infrared Microspectroscopy and Imaging, Lisa M. Miller, NSLS, BNL.
107

References/Further readings
JournalsRXS/RXD• S. Grenier, K. J. Thomas, Y. J. Kim, J. P. Hill, D. Gibbs, V. Kiryukhin, Y. Tokura,
Y. Tomioka, D. Casa, T. Gog and C. Venkataraman, Physica B-Condensed Matter, 345, 6 (2004).
• Y. Joly, S. D. Matteo and O. Bunau, European Physical Journal-Special Topics, 208, 21 (2012).
XCT• S. Sleutel, V. Cnudde, B. Masschaele, J. Vlassenbroek, M. Dierick, L. Van
Hoorebeke, P. Jacobs and S. De Neve, Computers & Geosciences, 34, 931 (2008).• H. Bale, M. Blacklock, M. R. Begley, D. B. Marshall, B. N. Cox and R. O.
Ritchie, Journal of the American Ceramic Society, 95, 392 (2012).108

Acknowledgement
• Dr. M Stanley Whittingham, Binghamton University (SUNY)• Dr. John Parise, Stony Brook University (SUNY)• Dr. Guangwen Zhou, Binghamton University (SUNY)• Dr. Louis Piper, Binghamton University (SUNY)• Dr. Wayne Jones, Binghamton University (SUNY)• Dr. Gerard McGrady, Binghamton University (SUNY)• Dr. Karena Chapman, Argone National Laboratory (APS)• Dr. Olaf Borkiewicz, Argone National Laboratory (APS)• Dr. Fredric Omenya, Binghamton University (SUNY)
109