
Symphony Plus as application for power plants – S+ Operations ...
57
Symphony Plus as application for power plants – S+ Operations subproject Anton Wargh Bachelor´s thesis Electrical Engineering Vaasa 2014
Transcript of Symphony Plus as application for power plants – S+ Operations ...
Symphony Plus as application for
power plants – S+ Operations
subproject
Anton Wargh
Bachelor´s thesis
Electrical Engineering
Vaasa 2014
BACHELOR´s THESIS
Author: Anton Wargh
Degree programme: Electrical Engineering
Specialization: Automation Technology
Supervisor: Ronnie Sundsten
Title: Symphony Plus as application for power plants – S+ Operations subproject
Date: 2 March 2014 Number of pages: 46 Appendices: 1
Abstract
This thesis is one part of a project with the purpose to investigate ABB´s control system
Symphony Plus in combination with ABB´s PLC AC500 as a solution for power plants.
This thesis focuses on the human-machine interface S+ Operations and analyses the
suitability and advantages as well as potential improvement areas regarding a solution
based on the Water & Wastewater library. ABB Power Generation in Vaasa has
commissioned the thesis.
The thesis gives an introduction to automation systems and OPC interfaces. ABB´s
control system Symphony Plus is presented in general and S+ Operations is discussed
more specifically. S+ Operations were installed and configured to control and monitor
a simulated process of water tanks. Advantages and improvement areas were
investigated during the configuration and testing of the system.
The result of this thesis is a demo solution with S+ Operations and AC500. The demo
solution may be used to test and further develop functions in S+ Operations. S+
Operations was considered flexible and easy to combine with AC500, although some
improvement areas were found.
Language: English
Key words: Symphony Plus, S+ Operations, control system, automation system, OPC

EXAMENSARBETE
Författare: Anton Wargh
Utbildningsprogram: Elektroteknik
Fördjupning: Automationsteknik
Handledare: Ronnie Sundsten
Titel: Symphony Plus som applikation för kraftverk – S+ Operations delprojekt
Datum: 2 mars 2014 Sidantal: 46 Bilagor: 1
Abstrakt
Detta lärdomsprov är en del av ett projekt med syftet att undersöka lämpligheten med
att använda ABB:s styrsystem Symphony Plus i kombination med ABB:s PLC AC500
som applikation för kraftverk. Lärdomsprovets mål var att se närmare på
användargränssnittet S+ Operations och analysera fördelarna och eventuella
nackdelarna med att använda sig av en lösning baserat på Water & Wastewater-
biblioteket. Lärdomsprovets uppdragsgivare är ABB Power Generation i Vasa.
Lärdomsprovet ger en introduktion i automationssystem samt OPC-gränssnitt. ABB:s
styrsystem Symphony Plus presenteras i allmänhet medan S+ Operations diskuteras
mera ingående. S+ Operations installerades och konfigurerades för att styra och
övervaka en simulerad process med vattentankar. Under konfigurationen och
testningen av systemet undersöktes både för- och nackdelarna av upplägget.
Resultatet blev en demolösning där S+ Operations kombinerats med AC500.
Demolösningen kan användas för att testa och vidareutveckla funktioner i S+
Operations. S+ Operations konstaterades vara en flexibel lösning som är lätt att
kombinera med AC500, även om en del nackdelar framkom.
Språk: engelska
Nyckelord: Symphony Plus, S+ Operations, styrsystem, automations system, OPC
OPINNÄYTETYÖ
Tekijä: Anton Wargh
Koulutusohjelma: Elektrotekniikka
Syventävät opinnot: Automaatiotekniikka
Ohjaaja: Ronnie Sundsten
Otsikko: Symphony Plus sovelluksena voimalaitoksissa– S+ Operations osaprojekti
Päivämäärä: 2. huhtikuuta 2014 Sivumäärä: 46 Liitteet: 1
Tiivistelmä
Tämä opinnäytetyö on ollut osa projektia, jossa selvitetään ABB:n ohjausjärjestelmän
Symphony Plussan sopivuutta voimalaitoksiin ABB:n AC500 PLC:hen yhdistettynä.
Työn tarkoituksena on ollut tutustua käyttöjärjestelmä S+ Operations:iin sekä selvittää
järjestelmän vahvuudet sekä mahdolliset heikkoudet ratkaisun perustuessa Water &
Wastewater kirjastoon. ABB Power Generation Vaasassa on toiminut opinnäytetyön
toimeksiantajana.
Opinnäytetyö tarjoaa johdannon automaatiojärjestelmiin sekä OPC-käyttöliittymiin.
Tämän lisäksi ABB:n ohjausjärjestelmä Symphony Plus esitellään yleisellä tasolla, kun
taas S+ Operations:ia käydään läpi tarkemmin. S+ Operations asennettiin ja säädettiin
simuloidun prosessin ohjaamista sekä valvomista varten. Järjestelmän vahvuudet sekä
heikkoudet selvitettiin säätämisen ja testaamisen aikana.
Opinnäytetyön tuloksena on demoratkaisu, jossa S+ Operations on yhdistetty AC500:n
kanssa. Ratkaisua voi käyttää S+ Operations:in toimintojen testaamiseen sekä
kehittämiseen. S+ Operations todettiin joustavaksi järjestelmäksi, joka on helppo
yhdistää AC500 kanssa, muutamista heikkouksista huolimatta.
Kieli: englanti
Avainsanat: Symphony Plus, S+ Operations, ohjausjärjestelmä, automaatiojärjestelmä,
OPC

Table of Contents
Abbreviations
1 Introduction ........................................................................................................................... 1 1.1 Commissioner ....................................................................................................... 1 1.2 Purpose ................................................................................................................... 2 1.3 Background ............................................................................................................. 2
2 Automation and control systems .................................................................................... 3 2.1 Types of automation systems ................................................................................... 3
2.1.1 Localized process .......................................................................................................... 3 2.1.2 Distributed process....................................................................................................... 5
2.2 Automation system elements .................................................................................. 7 2.2.1 Process interface .......................................................................................................... 8 2.2.2 Local system ................................................................................................................. 8 2.2.3 Communication system ................................................................................................ 9 2.2.4 Central system .............................................................................................................. 9 2.2.5 Human-machine interface ............................................................................................ 9
3 Symphony Plus ................................................................................................................... 10 3.1 Symphony Plus elements ....................................................................................... 10 3.2 AC500-series ......................................................................................................... 11
4 S+ Operations ...................................................................................................................... 12 4.1 System architecture ............................................................................................... 12 4.2 Nodes ................................................................................................................... 16 4.3 Alarm management ............................................................................................... 17 4.4 History Server and Client ....................................................................................... 18
4.4.1 History tools and applications .................................................................................... 20 4.5 Additional applications .......................................................................................... 21
4.5.1 S+ Explorer .................................................................................................................. 21 4.5.2 System Setup .............................................................................................................. 21 4.5.3 Interactive Database builder ...................................................................................... 22 4.5.4 Tag summaries ............................................................................................................ 22 4.5.5 Display Builder ............................................................................................................ 23 4.5.6 Universal Connect Tool ............................................................................................... 23
5 OLE for Process Control ................................................................................................... 24 5.1 OPC Data Access .................................................................................................... 25 5.2 OPC Alarms & Events ............................................................................................. 26 5.3 Other interfaces .................................................................................................... 26
6 Demo process ...................................................................................................................... 27
7 Implementation of an S+ Operations system ........................................................... 28 7.1 Installation and configuration ................................................................................ 28
7.1.1 Pre-requirements ....................................................................................................... 28 7.1.2 Installation and post-installation settings .................................................................. 29 7.1.3 General configuration................................................................................................. 30 7.1.4 Tag database configuration ........................................................................................ 32 7.1.5 History server configuration ....................................................................................... 33 7.1.6 Web server configuration ........................................................................................... 35
7.2 Communication via OPC......................................................................................... 36 7.2.1 OPC DA ....................................................................................................................... 36 7.2.2 OPC A&E ..................................................................................................................... 37
7.3 Process specific configurations ............................................................................... 38 7.3.1 Displays and faceplates .............................................................................................. 38 7.3.2 Reports ....................................................................................................................... 41 7.3.3 Trends ......................................................................................................................... 41
8 Results ................................................................................................................................... 42 8.1 Advantages ........................................................................................................... 42 8.2 Improvement areas ............................................................................................... 43
9 Discussion ............................................................................................................................ 44 9.1 Thesis work process ............................................................................................... 44 9.2 Conclusion ............................................................................................................. 45
Bibliography
Appendices

Abbreviations API = Application Programming Interface
CCS = Centralized Control System
COM = Component Object Model
CPU = Central Processing Unit
CSMA/CD = Carrier Sense Multiple Access/Collision Detect
DCOM = Distributed Component Object Model
DCS = Distributed Control System
GUI = Graphical User Interface
HMI = Human-Machine Interface
HSI = Human-System Interface
I/O = Input/Output
IED = Intelligent Electronic Device
IIS = Internet Information Service
LAN = Local Area Network
NCS = Network Control System
OLE = Object Linking and Embedding
OPC = OLE for Process Control
OPC A&E = OPC Alarm and Events
OPC DA = OPC Data Access
OPC HDA = OPC Historical Data Access
OPC UA = OPC Unified Architecture
PGIM = Power Generation Information Management
PGP = Power Generation Portal
PIMS = Process Information Management System
PLC = Programmable Logic Controller
RCS = Remote Control System
RTU = Remote Terminal Unit
SCADA = Supervisory Control and Data Acquisition
WAN = Wide Area Network

1
1 Introduction
In April 2011 ABB announced the launch of a new distributed control system called
Symphony Plus. The product is designed to meet a broad range of needs, from
monitoring a small wastewater process to controlling a large power plant. Symphony
Plus is the newest generation of ABB´s Symphony product family.
ABB Power Generation in Vaasa decided to start offering Symphony Plus as an
automation system solution to power plants. At a meeting on 4 October 2013 a project
was started with the purpose to investigate Symphony Plus in combination with AC500
as a solution for power plants. Advantages and potential improvement areas of this
solution were of great interest. The project was divided into two subprojects: S+
Operations subproject and AC500 subproject.
This thesis comprises the S+ Operations subproject. This part of the project has a focus
on the human-machine interface of Symphony Plus. Mr Daniel Hummel has conducted
the other subproject focusing on ABB´s PLC AC500 and the Water & Wastewater
library.
1.1 Commissioner
This Bachelor´s thesis was commissioned by ABB Power Generation in Vaasa. ABB is a
global company specialized on power and automation technologies. The company is
divided into five divisions: Power Products, Power Systems, Discrete Automation and
Motion, Low voltage products and Process Automation. Power Generation is a part of
the Power Systems division and its core product is to provide integrated power and
automation solutions to power generation plants and water applications. The thesis
work was made for the Power Generation unit located in Strömberg Park in Vaasa. The
unit in Vaasa has about 70 employees and provides power and automation solutions
mainly to gas, water, thermal, engine and nuclear power plants. (ABB, 2014).
The unit has knowledge of several different automation system software, both ABB´s
own brands and other companies’ brands. The most used automation systems are
WonderWare InTouch, ABB MicroSCADA, ABB 800xA and ABB Advant OCS.

2 WonderWare InTouch is an HMI provided by Invensys, which is a part of the Schneider
Electric Group. Power Generation uses WonderWare InTouch mostly in engine power
plant solutions in co-operation with Wärtsilä. MicroSCADA is ABB´s own product and
it is especially used in water power plants located in Finland. ABB 800xA is a control
system designed for the process industry. It is used in various projects like gas, water,
and thermal power plants. ABB Advant OCS is an older control system still offered as a
solution to different kinds of processes.
1.2 Purpose
The purpose of this thesis work is to investigate Symphony Plus in combination with
AC500 as a solution for power plants. The goal is to develop a demo solution based on
the Water & Wastewater library where all the functionalities of S+ Operations can be
tested and further developed. This solution will be an example of how to configure S+
Operations and how to establish a connection between S+ Operations and AC500 using
OPC. The thesis focuses on S+ Operations and analyses the suitability and advantages
as well as potential improvement areas regarding S+ Operations in combination with
AC500.
1.3 Background
ABB introduced a control system called Symphony Plus in April 2011. The new
Symphony Plus control system is a Power Generation product. A couple of years later
Power Generation in Vaasa made a decision to start offering Symphony Plus as an
automation solution to different kinds of projects. Symphony Plus was considered to
replace 800xA and provide a platform for small water, solar, wind and engine power
plants and water and wastewater treatment plants.
Power Generation in Vaasa has no earlier experience of Symphony Plus and therefore
the suitability for typical projects commissioned by the unit was a question mark. The
unit has not any exact requirements on a control system but the following aspects are
of interest:
Reports – The control system should provide tools to generate various kinds of reports.
Timestamp – Timestamp from PLC is critical in some automation solutions.
3
Historic data – The capability to handle and store historic data is of great interest.
Alarm handling – Alarm handling should be powerful. Function blocks and faceplates – Commonly used function blocks and
faceplates should be included. Remote monitoring – What kind of solutions for remote monitoring are
offered? License – How is the control system licensed?
(Personal communication with Mr Daniel Fröjdö on 7 March 2014)
2 Automation and control systems
According to Sharma (2011) an automation system is an arrangement for monitoring
and controlling a process automatically and so achieve desired results. Zhang says in
his book “Advanced Industrial Control Technology” (2010) that a control system, now
referred to as an industrial control system, is a device to manage, command or regulate
the behaviour of other devices or systems. In this chapter some fundamental aspects
of this arrangement or device are discussed.
2.1 Types of automation systems
Automation systems are continuously developing and many control system software
includes several types of automation systems. This makes categorizing automation
systems by type difficult. However, the type of automation system still differs
significantly depending on the type of process. Hence in this chapter different types of
automation systems in localized and distributed processes are presented.
2.1.1 Localized process
A localized process is defined as a process present in a small physical area. The control
center is close to the process and the controller is connected to the operator station
over local communication lines. An example of a local process could be a Wärtsilä
generating set. There are two main categories of control systems for localized
processes: centralized and distributed. (Sharma, 2011).
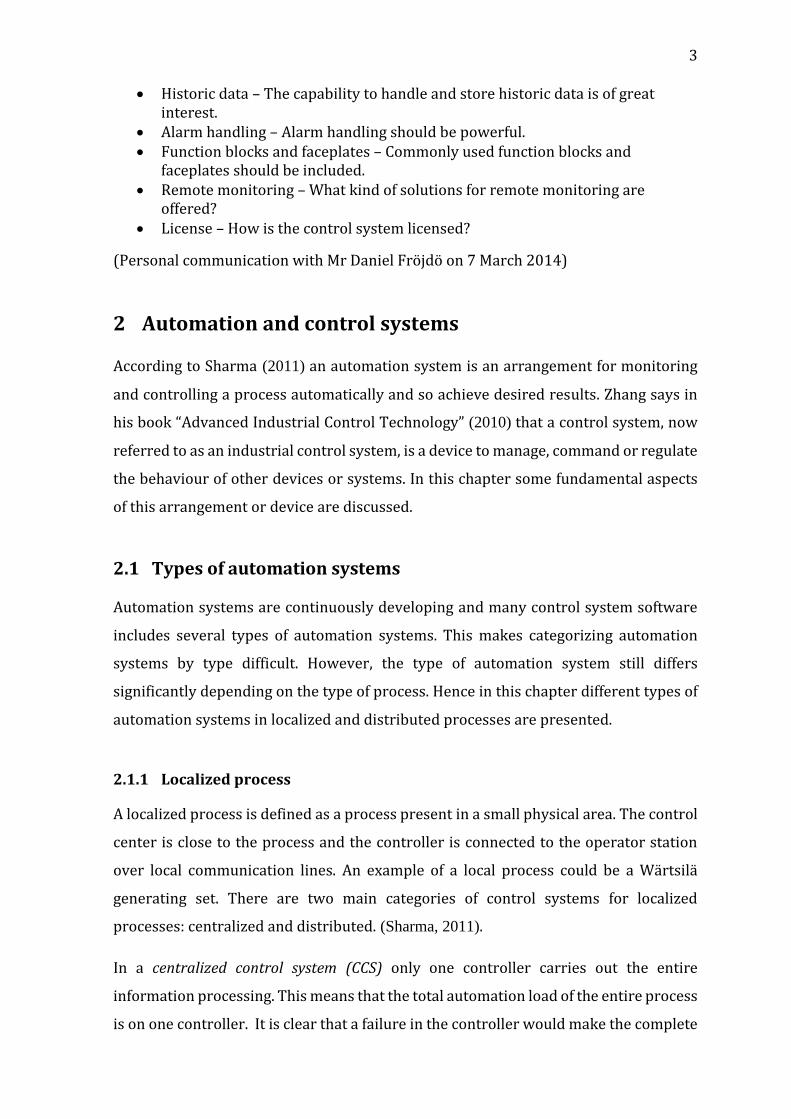
In a centralized control system (CCS) only one controller carries out the entire
information processing. This means that the total automation load of the entire process
is on one controller. It is clear that a failure in the controller would make the complete
4 plant automation facility unavailable. The advantages in this kind of systems are low
cost and technical simplicity. (Sharma, 2011).
Zhang (2010) mentions that the problem with this type of classification is the fact that
entirely centralized systems are really rare. Many field elements do some type of
processing and therefore relieve some of the processing burden from the central
controller. Hence the classification is not strict and may vary. In the figure below an
example of a centralized control system is shown.
Figure 1: Example of a centralized control system with multiple operator stations
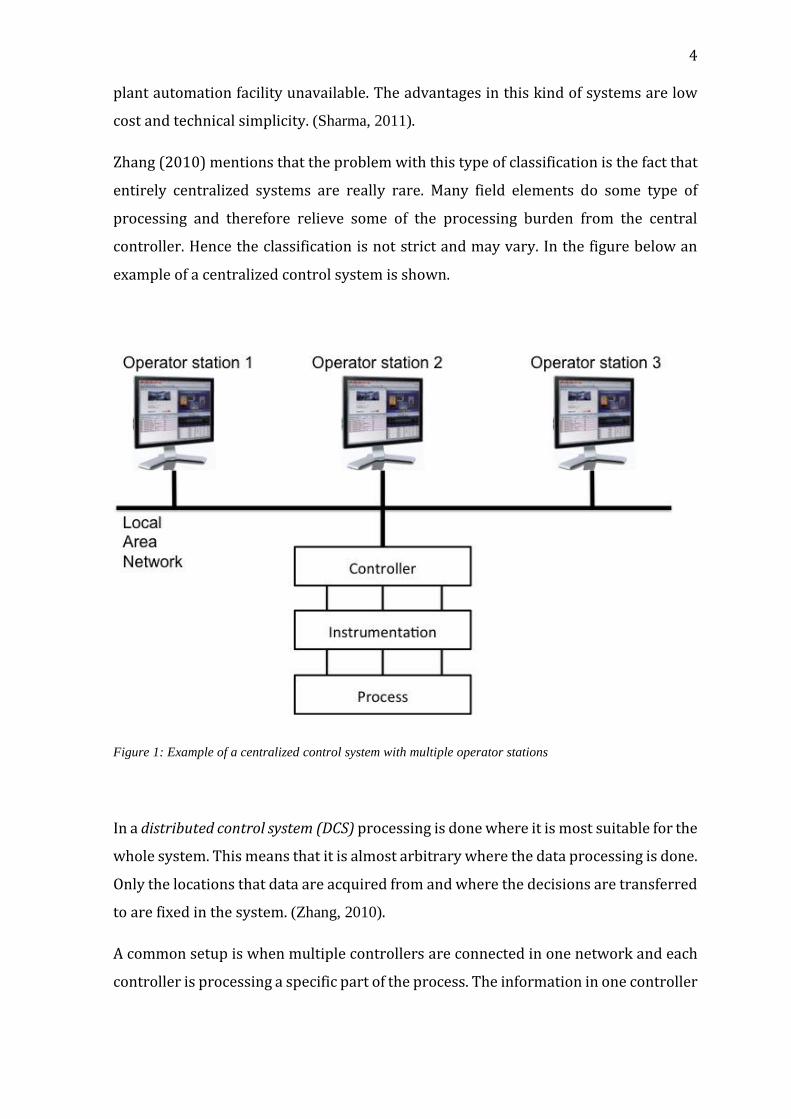
In a distributed control system (DCS) processing is done where it is most suitable for the
whole system. This means that it is almost arbitrary where the data processing is done.
Only the locations that data are acquired from and where the decisions are transferred
to are fixed in the system. (Zhang, 2010).
A common setup is when multiple controllers are connected in one network and each
controller is processing a specific part of the process. The information in one controller
5 can be shared to other devices in the network. (Zhang, 2010). Figure 2 illustrates an
example of a DCS.
DCSs are considered more expensive and technically more complex than centralized
control systems. The advantages are the possibility to handle larger and more widely
spread out processes and in case of a single controller failure, it affects only one
function or one part of the process. (Sharma, 2011).
Figure 2: Example of a distributed control system with multiple controllers and operator stations
2.1.2 Distributed process
A distributed process consists of several localized sub processes that are spread out
over a large physical area. The control center is physically away from the sub processes
and the controller is connected to the operation station through a remote
communication line. An example of this type of process is a 20kV distribution network.
In this section small remote control systems and large network control systems are
presented.
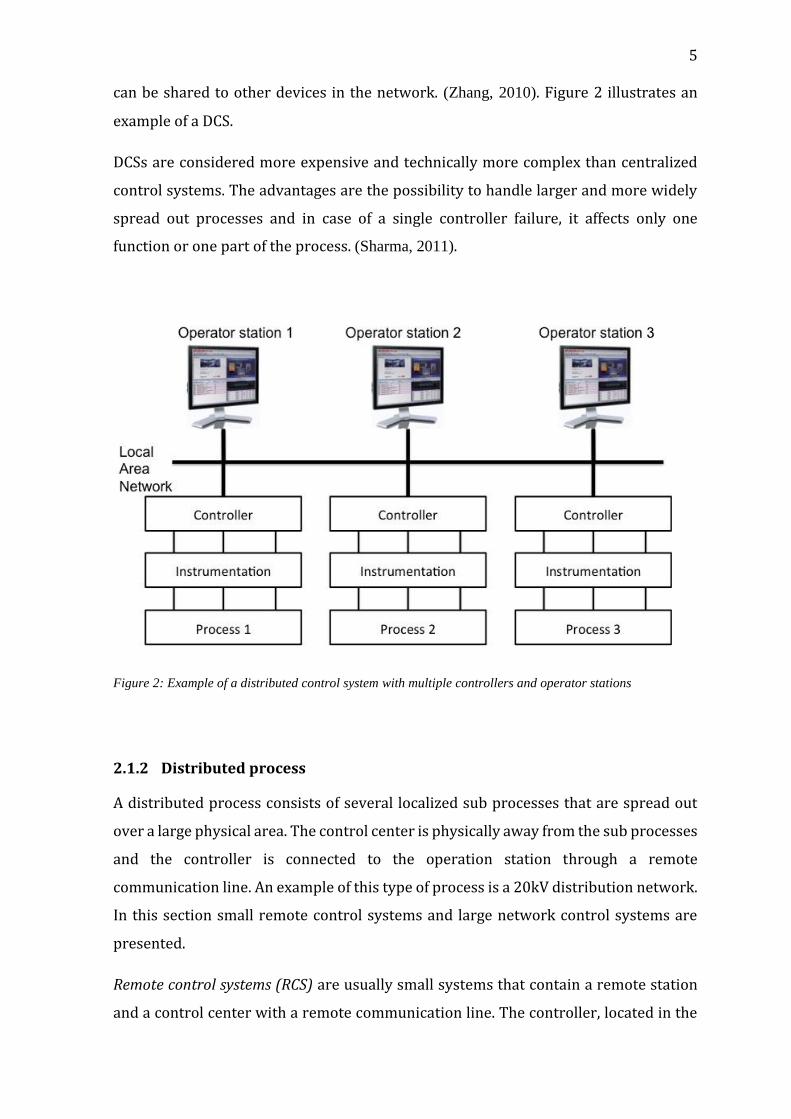
Remote control systems (RCS) are usually small systems that contain a remote station
and a control center with a remote communication line. The controller, located in the
6 remote station, is connected to the instrumentation and the process. All the automation
functions are performed locally by the controller, which also communicates with the
operations station in the control center. The operation station only monitors and, if
needed, sends manual control commands to the controller. This type of automation
system is shown in the figure below. (Sharma, 2011).
Figure 3: Example of a remote control system.
A network control system (NCS) works similarly as a RCS, but in addition it monitors
many distributed localized processes from one control center. Controllers distributed
geographically perform automation functions locally and communicate with the
operation station in the control center over a remote communication line. The
controllers cannot communicate directly with other controllers in the network, thus all
communication goes trough the control center. The control center monitors and
supervises the overall automation of the whole distributed process. An NCS is
illustrated in the figure below. (Sharma, 2011).

7
Figure 4: Example of a network control system.
2.2 Automation system elements
An automation system consists of different elements that can be classified according to
Zhang (2010) in three categories: Hardware components, Software modules and
Network models. Cegrell and Sanberg (1994) take elements from all of these categories
and present five blocks that define a control system. These five blocks are: process
interface, local system, communication system, central system and human-machine
interface. It is good to remember that these blocks, illustrated in the figure below, can
be physically separate or be included in one physical component. In the following
subchapters these blocks are discussed.

8
Figure 5: Blocks that define a control system.
2.2.1 Process interface
The process interface or the instrumentation provides an interface between the
process and the rest of the automation system. The interface contains different
instrumentation devices (analog and digital) with two main functions: Information
acquisition and control execution. Instrumentation devices collect data from the
process and convert physical signals to electronic signals that can be sent to and
handled by other parts of the control system. Control signals sent from the control
system are converted to physical signals suitable for the process. (Sharma, 2011).
2.2.2 Local system
The local system collects data sent from instrumentation devices and sends control
signals to other instrumentation devices. The local system usually consists of one or
several PLCs but can also include other IEDs (Intelligent Electronic device), protection
relays and RTUs (Remote terminal units). These units perform control functions that
are most suitable to locate close to the process, e.g. control functions that require
speed. (Cegrell & Sandberg, 1994).

9 2.2.3 Communication system
The communication system transports data, events and alarms between local and
central systems. The type of communication system depends on process and operator
requirements according to Granö et al. (1998). As many automation systems are
physically widely spread, an effective communication system is essential. In many
systems Ethernet is used as a local area network protocol. It supports bus and star
topology and a transfer rate up to 10 Mbps. Carrier sense multiple access/collision
detect (CSMA/CD) is used to monitor network traffic and to handle simultaneous
demands. Fieldbus, e.g. PROFIBUS®, is a communication protocol used to communicate
between instrumentation devices and control systems. Automation systems can also
include protocols like control area network (CANbus), control network (ControlNet),
LON, IEC61850 etc. (Zhang, 2010, p.33).
2.2.4 Central system
In most automation systems a central system is needed to store data and perform tasks
and functions. Central systems consist of system servers with different responsibilities.
Typical functions placed in the central system are functions that require high
calculation capacity, functions that need data from different parts of the plant or
functions designed to serve the operator in control room. Central system may also be
used to store data from the whole process for both security and reporting purposes.
(Cegrell & Sandberg, 1994).
2.2.5 Human-machine interface
Human-machine interface (HMI), also referred to as human-system interface (HSI) or
operator interface, is the means by which an operator interacts with the process. The
basic functions of the HMI are to allow operators to monitor the process and to perform
manual control commands. Other functions of an HMI are to display alarms and events,
show trends in real-time, show historical data, display status of communication
between different devices and possibly allow operators to override the device logic.
Operator stations today usually consist of multiple screens with graphics and graphical
user interface (GUI) windows. (Zhang, 2010, p.32).

10
3 Symphony Plus
Symphony Plus is a distributed control system (DCS) that ABB presented in April 2011.
Symphony Plus is the latest generation of ABB´s Symphony product family of control
systems. It is one of the world´s largest installed bases of DCS with over 6000 systems
worldwide. Symphony Plus is originally originated from the Elsag Baily design starting
with Network 90 and evolving to Infi90, Infi90 Open, Symphony and now finally to
Symphony Plus. (Ruebeck, n.d.). Symphony Plus includes many former Power
Generation products e.g. Power Generation Portal (PGP), Power Generation
Information Management (PGIM), Melody and Harmony.
In the release note of Symphony Plus Franz-Josef Mengede, head of ABB´s power
generation business mentions that Symphony Plus will provide “total plant automation
that is simple, scalable, seamless and secure”. This is a summary of what ABB wants to
achieve with Symphony Plus. It is planned to meet a broad range of plant
configurations especially in power and water industries. It will be able to handle the
needs of both small server-less applications and large multi-server architectures. ABB
promises that Symphony Plus is fully compatible with older generations of Symphony
and therefore commits to protect the customer´s long-term investment. (ABB, 2011a).
3.1 Symphony Plus elements
The most important parts of the control system are S+ Operations, S+ Engineering and
S+ Controllers and I/O. S+ Operations is the human-machine-interface and it will be
presented in the next chapter (chapter 4).
S+ Engineering provides a unified tool to manage Symphony Plus components. It
provides functionality to engineer, configure, administrate, secure, commission and
maintain the components. S+ Engineering was not used in this thesis work.
S+ Controllers and I/O includes the hardware (and software to these devices) in the
Symphony Plus product family. It includes PLCs like HPC800, Melody AC870P, AC800M
and AC500. AC500 has been used in this thesis work and is described in the next
subchapter.
11
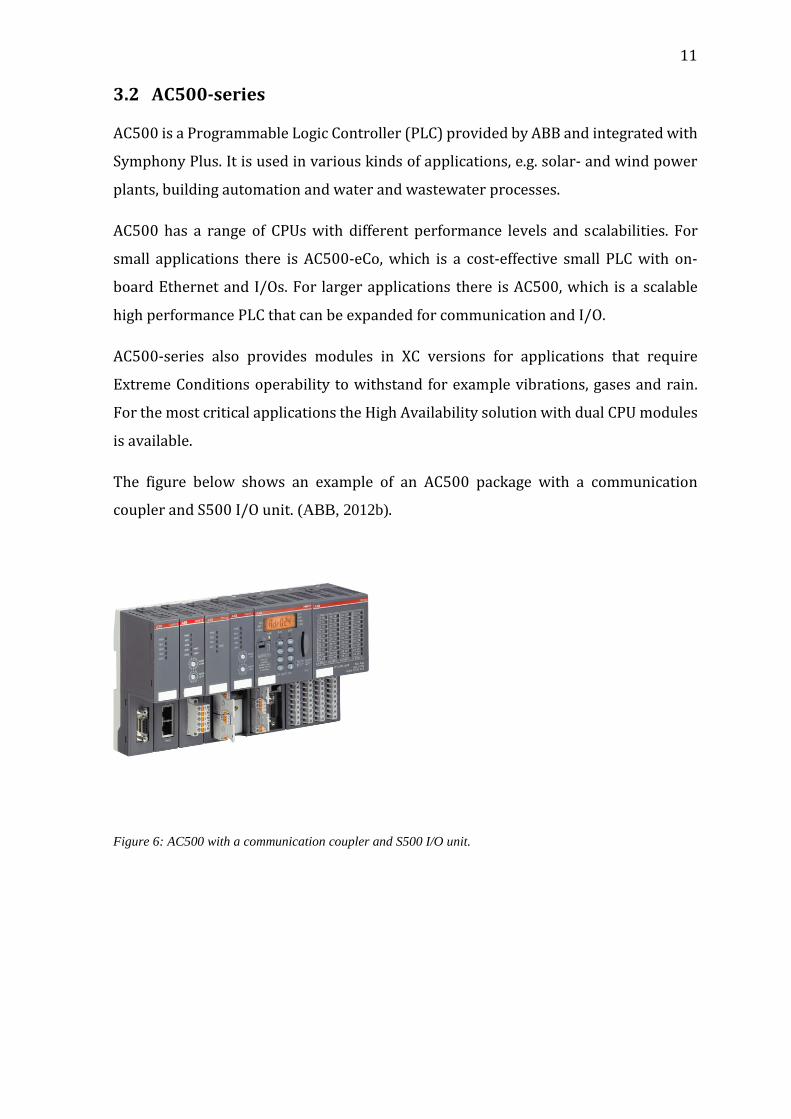
3.2 AC500-series
AC500 is a Programmable Logic Controller (PLC) provided by ABB and integrated with
Symphony Plus. It is used in various kinds of applications, e.g. solar- and wind power
plants, building automation and water and wastewater processes.
AC500 has a range of CPUs with different performance levels and scalabilities. For
small applications there is AC500-eCo, which is a cost-effective small PLC with on-
board Ethernet and I/Os. For larger applications there is AC500, which is a scalable
high performance PLC that can be expanded for communication and I/O.
AC500-series also provides modules in XC versions for applications that require
Extreme Conditions operability to withstand for example vibrations, gases and rain.
For the most critical applications the High Availability solution with dual CPU modules
is available.
The figure below shows an example of an AC500 package with a communication
coupler and S500 I/O unit. (ABB, 2012b).
Figure 6: AC500 with a communication coupler and S500 I/O unit.

12
4 S+ Operations
S+ Operations is the human-machine-interface in ABB´s Symphony Plus family (see
chapter 3). It is the newest revision of Power Generation Portal (PGP) with Power
Generation Information Management (PGIM) integrated (ABB, 2013b). In this chapter
some of the core functions and tools are presented.
4.1 System architecture
One of the most important features in S+ Operations is the architecture. The open
architecture makes it possible to meet and design the system according to the
customer´s specific needs. ABB DCS products are fully integrated with S+ Operations
and also a wide range of protocols and drivers are included to make connection to other
field devices possible. Even non-standard communications can be used by developing
a new driver for the purpose with S+ Operations API. This makes it possible to extend
the system´s reach to all plant areas and that is why ABB calls it “total plant automation”
(ABB, 2011a). Here are some examples of different architectures possible with S+
Operations:
Server-less architecture is a simple architecture with stand-alone nodes. Servers and
clients are included in every workplace and data is acquired from controllers
connected to the workplaces. Workplaces may acquire data from other workplaces and
also work with redundant information. An example of a server-less architecture may
be seen in the figure below.

13
Figure 7: Server-less architecture with five S+ Operations Workplaces (S+ Operations 2.0, 2013e).
Server based architecture is the most flexible type of architecture and can be used for
all sorts and sizes of plants. In this type of architecture a server acquires data from the
whole plant or from a specific plant area and if needed also from other servers. Clients
are usually connected to only one server but if the server is not available the client can
connect to the next server. The figure below shows server based architecture.
Figure 8: Server-based architecture with three servers acquiring data from the plant (S+ Operations 2.0,
2013e).
SPlus Operations Configuration Guide SYSTEM OVERVIEW
24 2VAA001148E
2.4.2 Server-based architecture
S+ Operations server-based architecture configuration combines dedicated servers with separate clients for the workstations. This type of architecture offers the biggest amount of flexibility. Server-based architectures are used for all sorts and sizes of plants.
Within a simple server-based architecture every server acquires data from the whole plant or from the related plant area. Other data may be acquired from other servers. Clients are typically connected to one server – if this server is not available the client may connect to the next server.
2.4.3 Distributed architecture
The use of distributed system architecture configurations takes the simple server-based system architecture to the next level. S+ Operations facilitates segregated architectures as well as composite server architectures or multi-system tiered architectures. The use of redundant servers and N+N server capabilities allows creating the operations environment for plants of all sizes and requirements.
S+ Operations servers may operate as individual stations, each one independent from any other, except for client interconnection, or they may operate in a distributed architecture where all servers are interconnected from a configuration and an operational point of view.
The distributed architecture is based on the inter-operability among different S+ Operations server nodes to accomplish a consistent configuration and operation environment in the whole system. Similar to the standard client/server architecture, each client being part of a distributed architecture can be connected to one or more servers.
2.4.4 Segregated architecture
Segregated system architecture is recommended when independent servers are required for plant units or areas. Clients are typically connected to one server, but graphical pages my contain data from other servers.
Each server only acquires and maintains data from the related plant area (unit)
Clients are logically connected to one server set
Graphical pages can include tags from other servers:
S+ Control S+ Control S+ Control S+ Control S+ Control
S+ Operations Workplace
S+ Operations Workplace
S+ Operations Workplace
S+ Operations Workplace
S+ Operations Workplace
Client Layer
Server Layer
Unit 1 Unit 2 Unit 3

14 Distributed architecture is based on the server-based architecture. A client can be
connected to one or more servers similar to client/servers in server-based
architecture. Looking from an operational point of view all servers are connected to
each other. To accomplish configuration and operation of the whole system the inter-
operability among S+ Operations server nodes is high.
If a certain plant unit or area requires an independent server, segregated architecture
is recommended. A server acquires and maintains data from the related plant
unit/area and a client is logically connected to one of these server sets. Graphical pages
may contain data also from other servers. A segregated architecture is illustrated in the
figure below.
Figure 9: Segregated architecture where each server acquire data from a related plant area (S+ Operations
2.0, 2013e).
SPlus Operations Configuration Guide SYSTEM OVERVIEW
2VAA001148E 25
Client 1 is logically connected to the server unit 1
If tags are addressed by name only (e.g. TIC401), its value is the one available in the connected server (server unit 1)
If tags are addressed by a fully qualified name (e.g. Server Unit 2\TIC401), its value is fetched from server 2 by server 1 and made available to the client
2.4.5 Composite architecture
Composite architecture may be chosen, when each server is required to maintain the complete database. In a composite architecture, each server acquires data from the related plant unit (controllers). Data from other units is acquired from other servers (network).
• Every server maintains a complete plant database
• Each server acquires data from the related plant area through connected controllers. Tags from other plant areas are acquired through the Server network
• Clients are logically connected to one server. From that server they can see tags for all plant areas
2.4.6 Multi system tiered architecture
Multi system tiered architecture is recommended, when plant areas need dedicated servers and/or workstations and there is a central control room with access to whole plant.
In multi system tiered architecture each area server acquires data from the related plant area through the connected controllers. The central plant server acquires tags from the area servers through the network. The area clients are connected to the area servers; the plant clients are connected to the plant server.
• Plant unit/areas have dedicated servers and clients
• Central control room clients can have access to multiple areas
• Each area server acquires data from the related plant area through the connected controllers.
• Central plant server acquires tags from area servers through proprietary InterServer protocol
• Area clients are logically connected to the corresponding area server
• Plant clients are logically connected to the plant server
Client Layer
Server Layer
15 If each server needs to maintain the complete database, composite architecture may be
chosen. As in segregated architecture a server is related to and acquires data from a
certain plant area. To acquire tags from other plant areas, servers communicate
through the Server network.
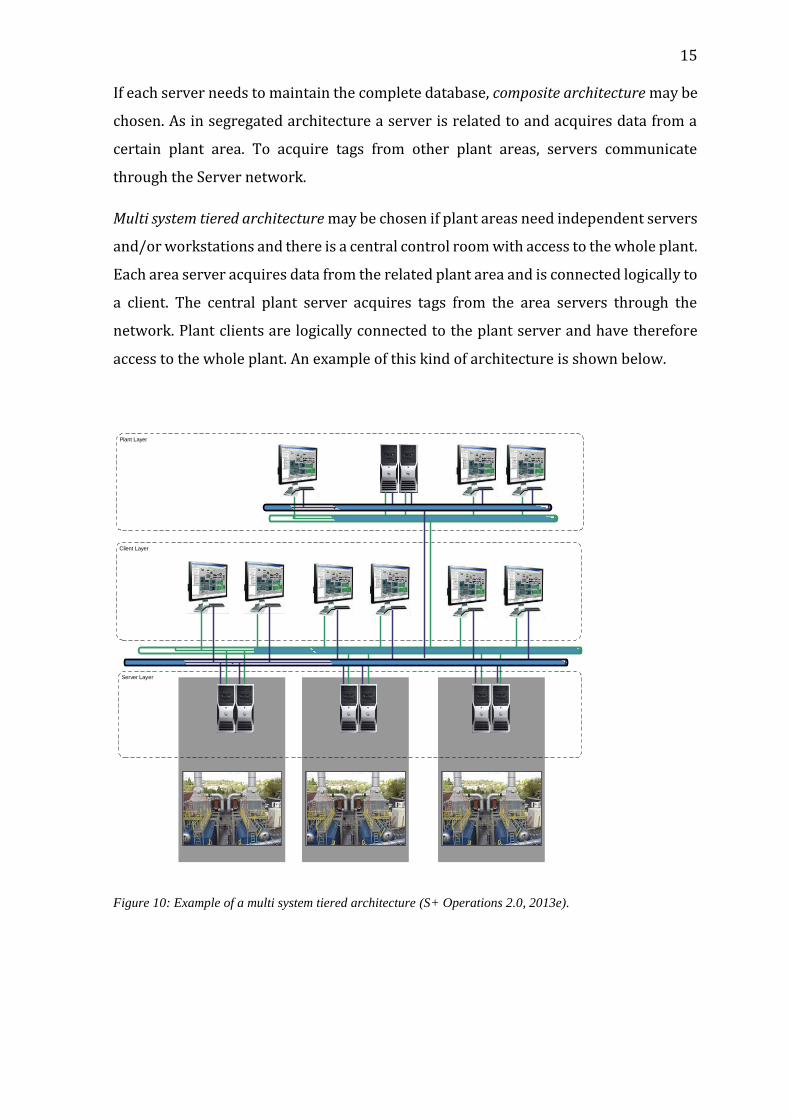
Multi system tiered architecture may be chosen if plant areas need independent servers
and/or workstations and there is a central control room with access to the whole plant.
Each area server acquires data from the related plant area and is connected logically to
a client. The central plant server acquires tags from the area servers through the
network. Plant clients are logically connected to the plant server and have therefore
access to the whole plant. An example of this kind of architecture is shown below.
Figure 10: Example of a multi system tiered architecture (S+ Operations 2.0, 2013e).
SPlus Operations Configuration Guide SYSTEM OVERVIEW
26 2VAA001148E
2.4.7 SCADA Architecture
SCADA architectures are a mixture from all of the above architectures. Typically SCADA deals with many different protocols and can have a hierarchical structure.
Client Layer
Server Layer
Plant Layer
Distribution network
Water network central operations
OPC
Large number of PLC controllers or RTUs (>50)
Modbus RTU
Modbus TCP or IEC60870-5-104
PN800Modbus TCP or IEC60870-5-104
Ethernet TCP/IP
Ethernet TCP/IP
Ethernet TCP/IP Ethernet TCP/IP
Ethernet TCP/IP
S+ Operations workplaces
Waste water treatment plant
PN800Modbus TCP or IEC60870-5-104
Water treatment plant
Large number of PLC controllers or RTUs (>50)
Large number of PLC controllers or RTUs (>50)
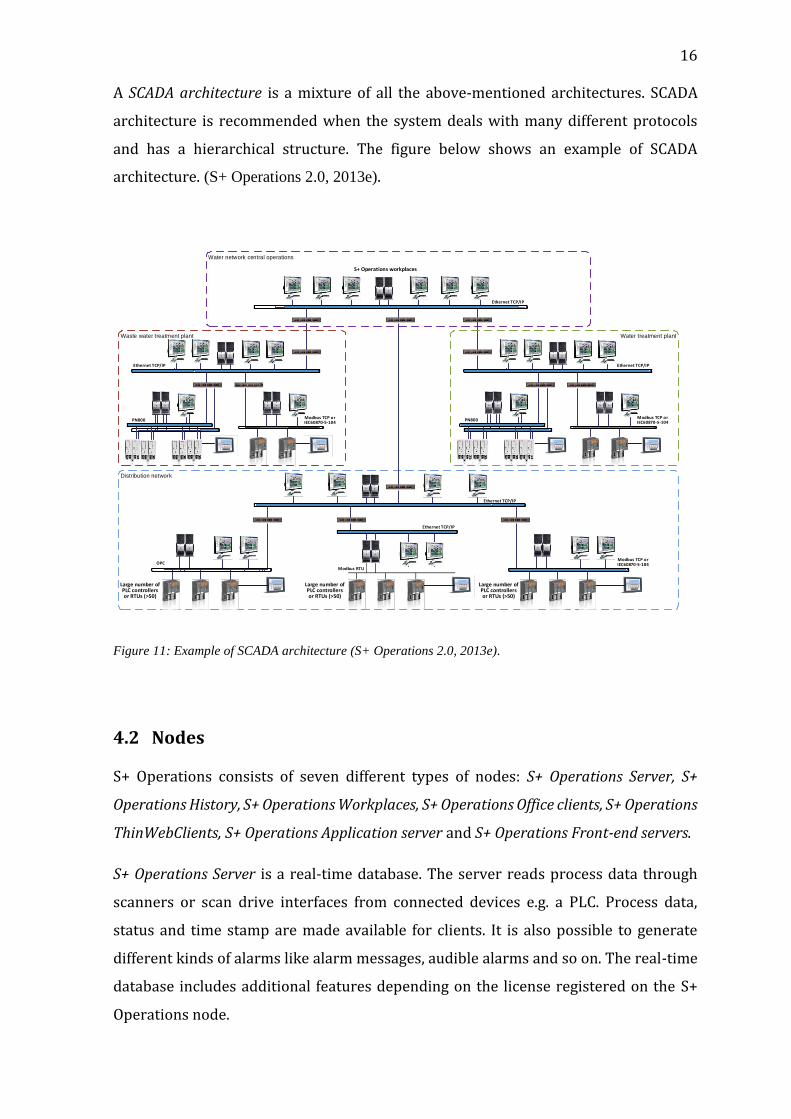
16 A SCADA architecture is a mixture of all the above-mentioned architectures. SCADA
architecture is recommended when the system deals with many different protocols
and has a hierarchical structure. The figure below shows an example of SCADA
architecture. (S+ Operations 2.0, 2013e).
Figure 11: Example of SCADA architecture (S+ Operations 2.0, 2013e).
4.2 Nodes
S+ Operations consists of seven different types of nodes: S+ Operations Server, S+
Operations History, S+ Operations Workplaces, S+ Operations Office clients, S+ Operations
ThinWebClients, S+ Operations Application server and S+ Operations Front-end servers.
S+ Operations Server is a real-time database. The server reads process data through
scanners or scan drive interfaces from connected devices e.g. a PLC. Process data,
status and time stamp are made available for clients. It is also possible to generate
different kinds of alarms like alarm messages, audible alarms and so on. The real-time
database includes additional features depending on the license registered on the S+
Operations node.
SPlus Operations Configuration Guide SYSTEM OVERVIEW
26 2VAA001148E
2.4.7 SCADA Architecture
SCADA architectures are a mixture from all of the above architectures. Typically SCADA deals with many different protocols and can have a hierarchical structure.
Client Layer
Server Layer
Plant Layer
Distribution network
Water network central operations
OPC
Large number of PLC controllers or RTUs (>50)
Modbus RTU
Modbus TCP or IEC60870-5-104
PN800Modbus TCP or IEC60870-5-104
Ethernet TCP/IP
Ethernet TCP/IP
Ethernet TCP/IP Ethernet TCP/IP
Ethernet TCP/IP
S+ Operations workplaces
Waste water treatment plant
PN800Modbus TCP or IEC60870-5-104
Water treatment plant
Large number of PLC controllers or RTUs (>50)
Large number of PLC controllers or RTUs (>50)
17 S+ Operations History stores process data with status and timestamp that come from
an S+ Operations Server. The history server can be a separate node or additionally
installed on the same node as S+ Operations Server.
S+ Operations Workplaces can be either a local client or a remote client. Local clients
operate on the same node as an S+ Operations Server. Remote clients are separate
nodes used as standard workplaces.
S+ Operations Office clients are clients that can only access data from History Server and
are therefore not able to control the plant. These workplaces are made for office users
that need functions such as report generation, calculations and long-term trends.
S+ Operations ThinWebClients are browser-based clients. These clients do not need any
software to be installed on the client side; a web-browser is all that is needed. The client
gains access to process graphics with dynamic values, trends, reports and alarm and
event messages. Clients like this are typically used by office users to be informed about
plant status.
S+ Operations Application server is a node that can be used for various tasks. Generating
reports, hosting web servers and giving applications API (Application programming
interface) to read/write data to the Symphony Plus system are examples of what
Application servers are used for.
S+ Operations Front-end Server is almost like a regular S+ Operations Server but it does
not have an interface to local or remote clients. The Front-end server has an unlimited
amount of tags and is typically used to read process data from a DCS by a specific
scanner and then sends this data to an S+ Operations Server. (S+ Operations 2.0, 2013e).
4.3 Alarm management
Alarm management in S+ Operations follows guideline EEMUA 191 and standard ISA
18.2. EEMUA was published in 1999 and it is a guideline explaining how the quality of
alarm systems should be managed. One of the main points in EEMUA 191 is that an
operator can only handle a limited amount of events at a time and should therefore not
be overloaded with alarms. ISA 18.2 standard was published in 2009 with the heading
“Management of Alarm Systems for Process Industries”. ISA 18.2 defines practices for

18 alarm systems including design, installation, operation, maintenance, modification and
recommended work processes.
According to the standard ISA 18.2 “An alarm is an audible and/or visible means of
indicating to the operator an equipment malfunction, process deviation, or abnormal
condition requiring a response.” (S+ Operations 2.0, 2013d). In other words, all events
that do not need any action from the operator should not be considered as alarms. This
can be complicated in practice and to create a high-quality alarm system requires
experience. However S+ Operations delivers tools to make this possible.
S+ Operations stores all events in a Microsoft SQL Server database and provides tools
to analyse and manage alarms. Reports like alarm frequency, alarms over time, alarm
priority distribution and alarm duration help the operator to analyse and make the
right decision when creating an alarm system. (S+ Operations 2.0, 2013d).
4.4 History Server and Client
S+ Operations History is a Process Information Management System (PIMS), which
means that it is a tool to evaluate process data in one interface. Core functionalities are
management of long-term data collection, alarms archive, trends visualization and
report generation. S+ Operations History is the new name of a product formerly known
as Power Generation Information Manager (PGIM). A PC with Windows operating
system is used as the platform for S+ Operations History. The system structure is
modular, which means that it can be adapted to the needs of the customer. It is possible
to include S+ Operations and S+ Operations History Server and Client, all on the same
hardware.
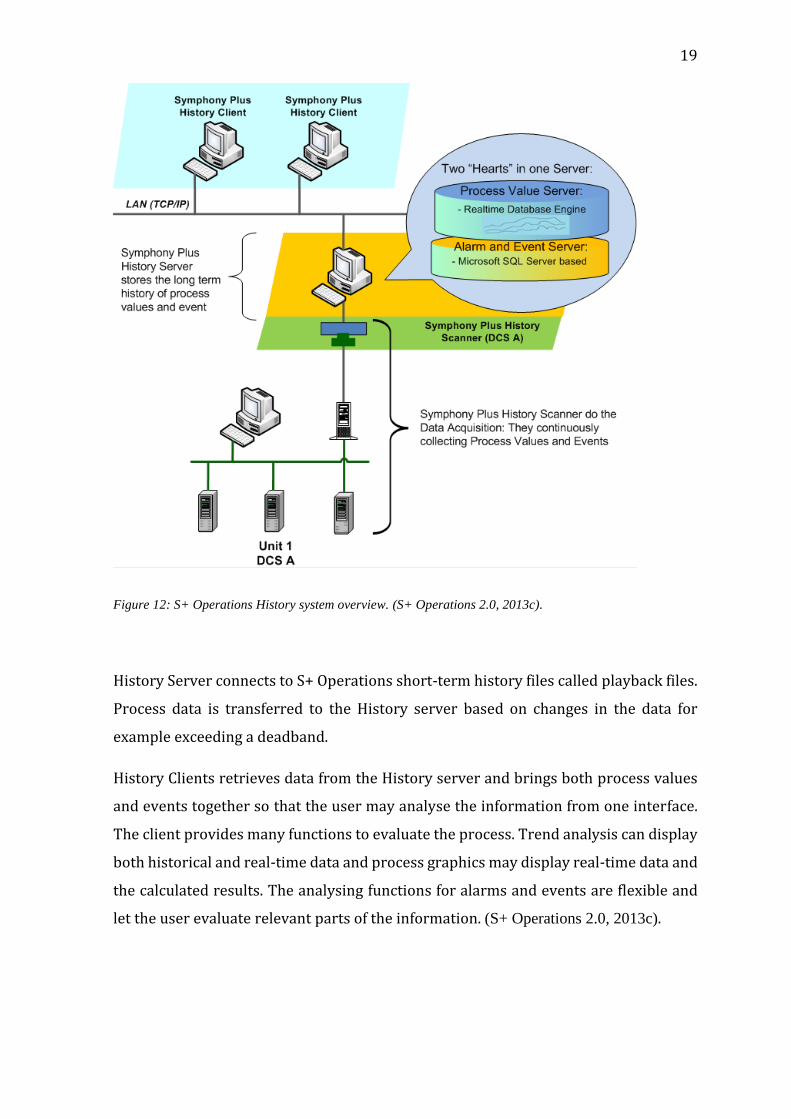
History server consists of two databases: real-time or process database and event
management or alarm and events server. The real-time database stores analog and
binary data points along with time stamp and quality. Event management stores alarm
and event messages. S+ Operations History scanners collect both process data and
events from the connected DCS. A system overview can be seen in the figure below.
19
Figure 12: S+ Operations History system overview. (S+ Operations 2.0, 2013c).
History Server connects to S+ Operations short-term history files called playback files.
Process data is transferred to the History server based on changes in the data for
example exceeding a deadband.
History Clients retrieves data from the History server and brings both process values
and events together so that the user may analyse the information from one interface.
The client provides many functions to evaluate the process. Trend analysis can display
both historical and real-time data and process graphics may display real-time data and
the calculated results. The analysing functions for alarms and events are flexible and
let the user evaluate relevant parts of the information. (S+ Operations 2.0, 2013c).
20 4.4.1 History tools and applications
S+ Operations History includes several applications with which you can configure,
manage and visualize data from the History server. The most important tools are
described in this chapter.
Navigator is a tool that manages logs, technical calculations, process graphics and trend
analysis. It serves as a starting point for other History applications. All trends, graphics,
reports and calculations are presented in a Windows tree-like file structure and it can
be customized to meet the needs of the user.
SignalExplorer shows all available signals in S+ Operations History. It has a drag-and-
drop function that makes it possible to add signals to other applications, e.g. signals
from a valve are listed in SignalExplorer and drag-and dropped to a report template.
SignalExplorer may also be used as a tool to configure the S+ Operations History
system. The user can for example modify properties of signals from the connected
History system.
Trend analysis is another basic History application. It is a tool to visualize signals over
time. An unlimited number of signals can be added to a trend display and modified
according to needs. Functions like average value, maximum and minimum value,
differential and integral representation can also be visualized in trend displays.
S+ History Reports is based on Microsoft Excel and therefore it provides a platform to
make almost any kind of reports. A user may define and customize reports according
to individual needs. However, S+ Operations History also provides some template
reports, e.g. daily, weekly and monthly reports. Reports may be generated manually or
automatically with Report Scheduler, which is running as a Windows service. Reports
generated by Report Scheduler are either time- or event-trigged.
Event Management is actually a set of applications that can analyse disturbance based
on process messages. Messages from all kinds of sources are filtered, arranged into
groups and listed. Graphical event statistics are used to visualize the number of a
specific event-message over time or for a specific signal. It is also possible to combine
messages and create new information that is stored in a long-time archive. (S+
Operations 2.0, 2013c).
21
4.5 Additional applications
S+ Operations includes several applications for both configuration of the system and
for operating with the system. The most important tools and applications in addition
to history tools and applications (see chapter above) are described in the following
subchapters.
4.5.1 S+ Explorer
S+ Explorer (PowerExplorer) is the operator workplace and the main window of S+
Operations. It is the environment from which the operator monitors and controls the
process. From the workplace an operator has access to all needed functions like alarms,
trend displays, faceplates and reports. The layout of the workplace may be adjusted
according to user and process specific needs. S+ Explorer can have a single or multi-
screen setup and the operator keyboard is usually a standard PC keyboard with a
mouse. (S+ Operations 2.0, 2013g).
4.5.2 System Setup
System Setup (SysSetup) is a system configuration interface included in S+ Operations.
System Setup lists registers related to S+ Operations and allows the user to configure
them. However, if for some reason the user wants to modify the structure of the
registry list, it has to be done by using Windows regedit application.
In order to configure the system for desired operations, data from external files is
transferred trough System Setup to the internal database of S+ Operations. The
transfer is done by running specific “builders” within System Setup. The same builders
are also able to export data from S+ Operations database to Excel files (.xls, .xlsx). The
figure below shows how the S+ Operations database is managed and how
configurations go through System Setup. (S+ Operations 2.0, 2013e).

22
Figure 13: S+ Operations database management.
4.5.3 Interactive Database builder
Interactive Database builder (Ibdbase) is a tool for online configuration of S+
Operations database. It is a client interface that gives access to S+ Operations database
and allows the user to make changes directly to the database. Ibdbase is mostly used
for minor changes in the database when most of the configurations are already done
using SysSetup. In the figure above Ibdbase is shown in relation to SysSetup. (S+
Operations 2.0, 2013e).
4.5.4 Tag summaries
Tag summaries (rtsumm) is an application that provides on-line information from the
real-time database. As default it shows tag name and description, current tag value
(analog tags) or current status (digital tags) and quality attribute. Value and quality
attribute of the tags are periodically updated. It is used to get an overview of all the tags
and it provides a possibility to search and filter tags according to value and quality. (S+
Operations 2.0, 2013g).
23 4.5.5 Display Builder
Display builder is an application used to create and modify static and dynamic objects.
These objects can for example be displays that an operator uses to monitor a process,
or faceplates used to control a certain device. With Display Builder objects may be
created manually using just basic functions or by using libraries with ready-made
objects and figures.
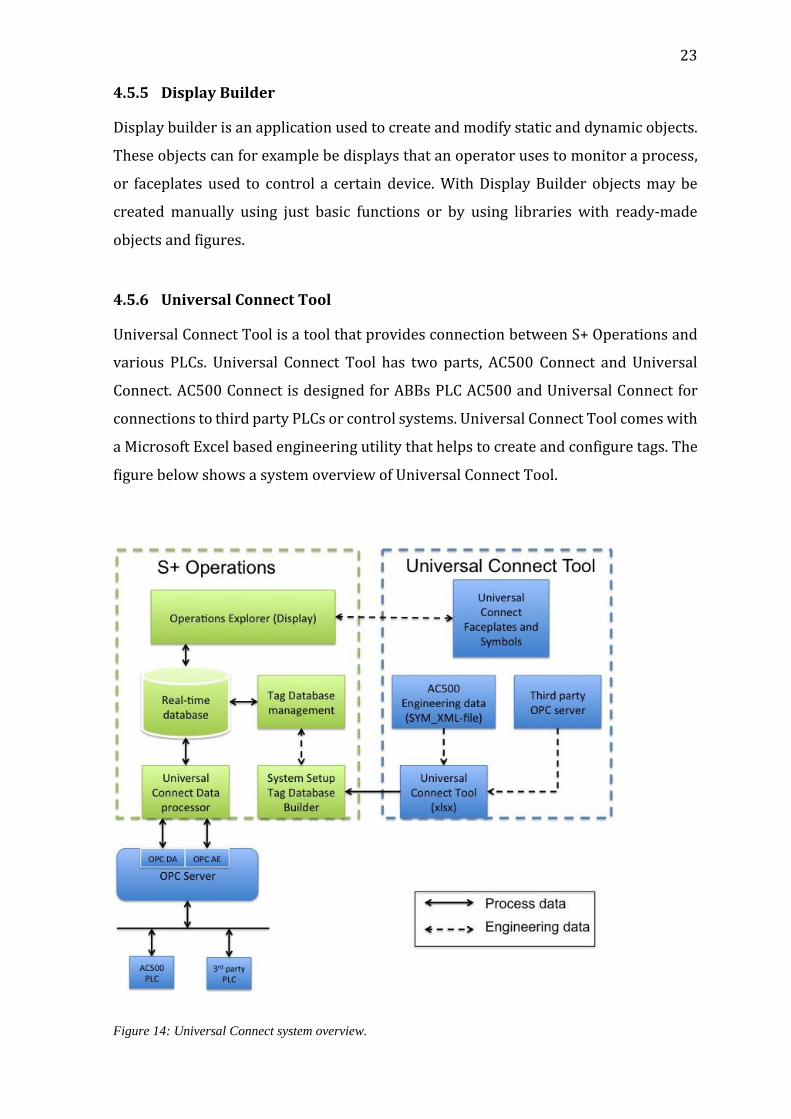
4.5.6 Universal Connect Tool
Universal Connect Tool is a tool that provides connection between S+ Operations and
various PLCs. Universal Connect Tool has two parts, AC500 Connect and Universal
Connect. AC500 Connect is designed for ABBs PLC AC500 and Universal Connect for
connections to third party PLCs or control systems. Universal Connect Tool comes with
a Microsoft Excel based engineering utility that helps to create and configure tags. The
figure below shows a system overview of Universal Connect Tool.
Figure 14: Universal Connect system overview.
24 AC500 Connect uses the above-mentioned Excel utility to import tag files created with
AC500 Control Builder Plus to S+ Operations database. It provides components to
faceplate mapping and Alarm and Events Configuration. It also comes with a library of
faceplates, displays and graphic symbols that suit tags created with AC500 Connect.
5 OLE for Process Control
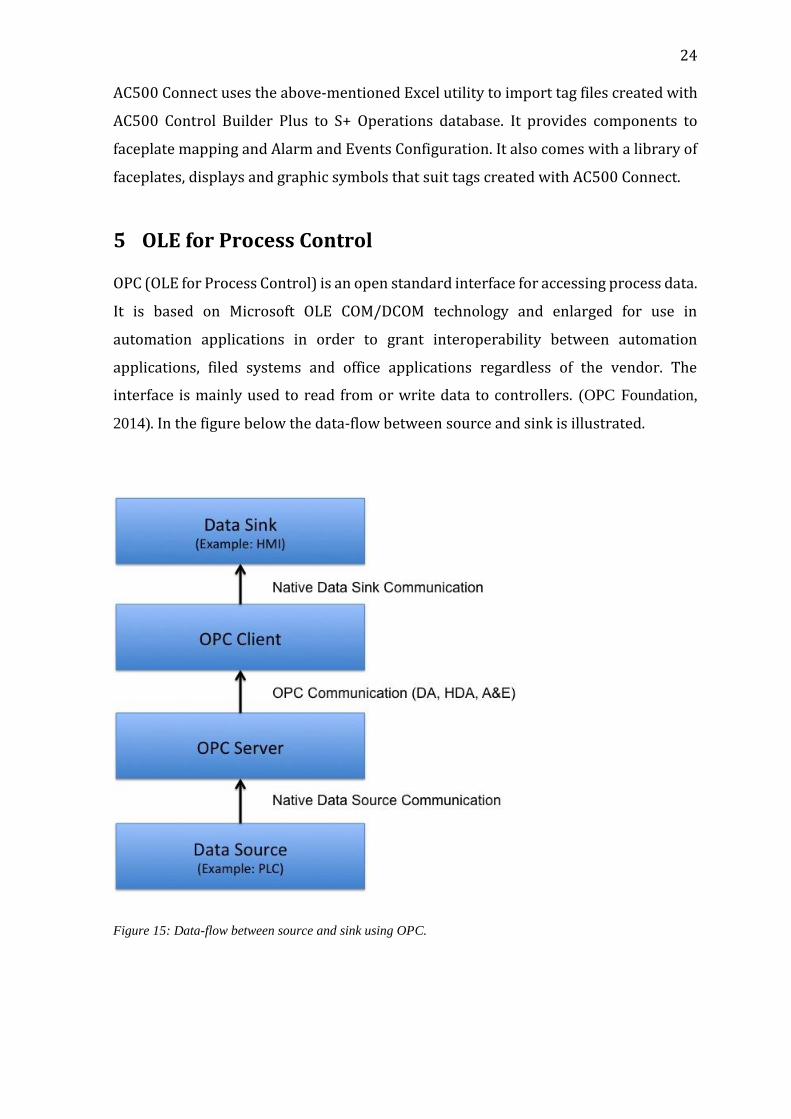
OPC (OLE for Process Control) is an open standard interface for accessing process data.
It is based on Microsoft OLE COM/DCOM technology and enlarged for use in
automation applications in order to grant interoperability between automation
applications, filed systems and office applications regardless of the vendor. The
interface is mainly used to read from or write data to controllers. (OPC Foundation,
2014). In the figure below the data-flow between source and sink is illustrated.
Figure 15: Data-flow between source and sink using OPC.
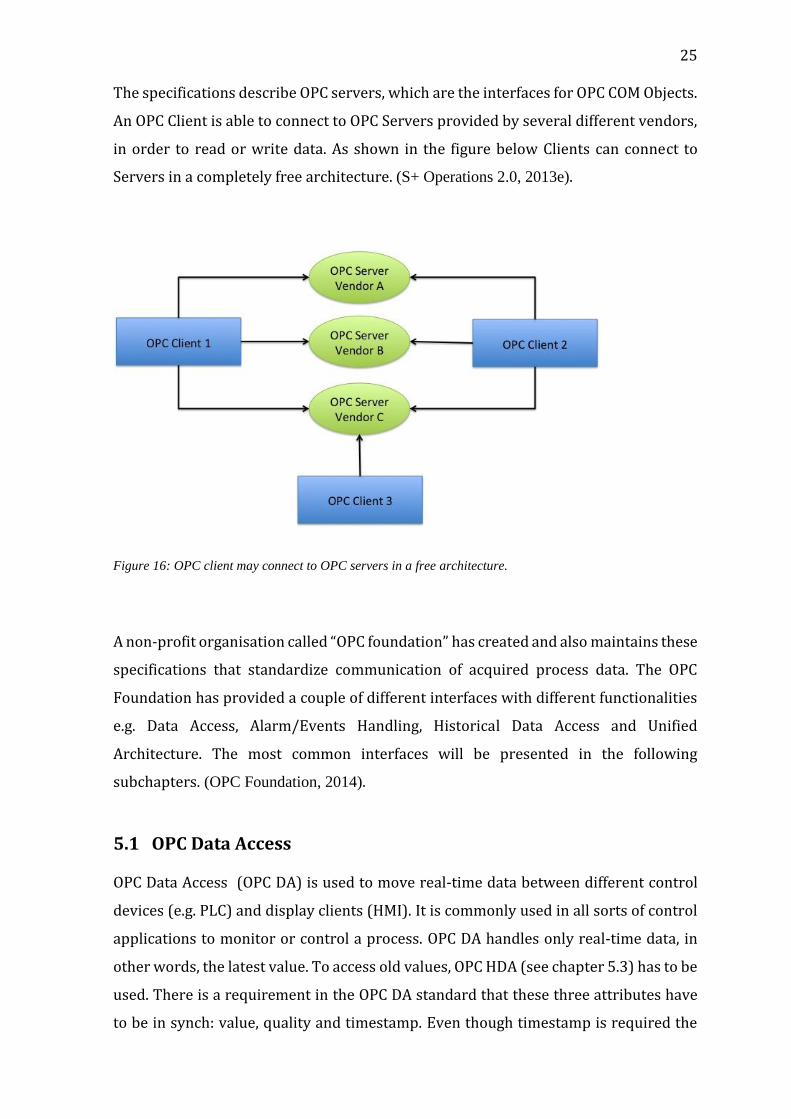
25 The specifications describe OPC servers, which are the interfaces for OPC COM Objects.
An OPC Client is able to connect to OPC Servers provided by several different vendors,
in order to read or write data. As shown in the figure below Clients can connect to
Servers in a completely free architecture. (S+ Operations 2.0, 2013e).
Figure 16: OPC client may connect to OPC servers in a free architecture.
A non-profit organisation called “OPC foundation” has created and also maintains these
specifications that standardize communication of acquired process data. The OPC
Foundation has provided a couple of different interfaces with different functionalities
e.g. Data Access, Alarm/Events Handling, Historical Data Access and Unified
Architecture. The most common interfaces will be presented in the following
subchapters. (OPC Foundation, 2014).
5.1 OPC Data Access
OPC Data Access (OPC DA) is used to move real-time data between different control
devices (e.g. PLC) and display clients (HMI). It is commonly used in all sorts of control
applications to monitor or control a process. OPC DA handles only real-time data, in
other words, the latest value. To access old values, OPC HDA (see chapter 5.3) has to be
used. There is a requirement in the OPC DA standard that these three attributes have
to be in synch: value, quality and timestamp. Even though timestamp is required the

26 standard does not specify where it should come from. This means it depends on the
vendor of the OPC Server if timestamp comes from the PLC or if the OPC Server
provides its own timestamp.
OPC Data Access is the first OPC standard and was a result of the collaboration between
Microsoft and some of the leading worldwide automation suppliers. It is still the most
common of all OPC specifications. This interface has also been used for this thesis work.
(OPC Foundation, 2014).
5.2 OPC Alarms & Events
OPC Alarm & Events (OPC A&E) provides, in contrast to OPC DA, alarm and event
notifications on demand instead of a continuous data flow. The data to be moved may
consist of process alarms, operator actions, informational messages and so on. OPC
A&E is a separate specification that complements other OPC specifications and
especially OPC DA. An “alarm” in this particular meaning, is an abnormal condition of
an OPC Event Server, or one of its objects, which is of interest to the OPC Client. An
“event” is a detectable occurrence that matters to the OPC Event Server, the connected
device and the OPC Client. An Event is not necessarily associated with a condition. OPC
A&E is supported in S+ Operations and will be discussed in chapter 7.2.2. (OPC
Foundation, 2014) (S+ Operations 2.0, 2013e).
5.3 Other interfaces
Other common interfaces in addition to the two mentioned before are OPC Historical
Data Access and OPC Unified Architecture. OPC Historical Data Access is a standard that
provides access to historical data. It is typically used to collect data for analysis,
optimization etc. (OPC Foundation, 2014).
OPC UA (Unified Architecture) is the newest OPC-specification that is not just a new
standard, but also a completely new architecture. In the future OPC UA is meant to
replace all the old specifications, which means that it includes all the functionalities
from specifications like DA, A&E, HDA and so on. This will be helpful, especially to OPC
Vendors when implementing new OPC servers. OPC UA is no longer based on Microsoft
COM, which means that it can be implemented on non-Microsoft systems including

27 embedded systems. This interface is not supported in S+ Operations. (OPC Foundation,
2014).
6 Demo process
To achieve the goals set at the beginning of the thesis (see chapter 1.2) a process
simulation had to be done. The only requirement of the process is that it should be
suitable for testing different functions in S+ Operations.
A simple process with two water tanks was chosen to be implemented. The figure
below shows a principal layout of the process. A PID controller that is set to keep the
level in tank 1 on a chosen level regulates the inflow to the first tank. Inflow to tank 2
is the same as the outflow from tank 1. When the water level in tank 1 reaches the high
alarm limit, a valve in the bottom of the tank opens and a pump starts to empty the
tank. The outflow from tank 2 is counted and presented.
Figure 17: Principal layout of the process.
The implementation of this simulation is done by Mr Daniel Hummel as a part of his
Bachelor´s thesis.

28
7 Implementation of an S+ Operations system
The practical part of this thesis is presented in this chapter. The system was
implemented on a simulated process of water tanks (see chapter 6) to demonstrate the
functions of S+ Operations. The chapter is divided into three main parts: Installation
and configuration of S+ Operations, communication with OPC, and process specific
configurations.
7.1 Installation and configuration
This chapter discusses the installation and configuration of S+ Operations. The chapter
is divided into five parts starting from pre-requirements, installation of S+ Operations,
system and real time database configuration. The last two subchapters present history
server and web server configurations.
7.1.1 Pre-requirements
System configuration and installation start with identifying the project specific needs
and requirements. The goal of this thesis work is to develop a demo solution with S+
Operations combined with AC500, which means there are no requirements regarding
architecture or size of the system. Due to costs and practical reasons a server-less
architecture was chosen. A server-less architecture (see chapter 4.1) is simple and
allows all parts of S+ Operations to be installed on a single node. This means that the
node will include S+ Operations Server, Client, History Server and Webserver.
The software itself requires a PC with Windows Server 2008 R2 (x64) or Windows 7
(x64) operating system. Even if the installation guide (S+ Operations 2.0, 2013e) does
not require Windows 7 Professional, it is highly recommended since the use of
Windows Home edition leads to the fact that some functions do not work properly.
Microsoft Office 2010 (32-bit) is also required when the node includes History server.
Dell Precision T3600 is the hardware used for this thesis work. It is provided with
Windows 7 Professional as operating system and Microsoft Office 2010 Ultimate.
After these basic requirements some more specific configurations have to be done
before the installation starts. Proper regional settings like language, date, time and time
zone have to be configured. Time synchronization between computers has to be done
29 if the system includes more than one computer. The installation of Webserver requires
Internet Information Service (IIS) to be installed and activated. Firewall and services
are configured according to Symphony Plus Hardening Manual (2011b). This is to make
the system secure, reliable and also to grant proper functionality. (S+ Operations 2.0,
2013e)
7.1.2 Installation and post-installation settings
When all the pre-requirements (see chapter 7.1.1) are done properly the actual
installation is handled by an installation wizard. The only thing that has to be chosen
manually is the type of profile to install on the node. In this case S+ Operations Server
with Historian server is chosen. This profile will install S+ Operations server, History
Server, Webserver and clients for both S+ Operations and History. No additional
profiles need to be installed, since this profile includes all the parts that were specified
before.
S+ Operations is dependent on some third party software like Microsoft SQL Server,
and Microsoft .NET Framework. However the installation wizard automatically installs
the needed third party software. It should be noticed that it may cause some
unexpected errors if some other versions of the mentioned third party software have
already been installed.
After the installation is completed some post-installation settings have to be done.
Firewall configurations are done automatically by executing proper batch files. At this
stage of the installation S+ Operations has to be activated by inserting a license to the
system. The license is connected to a USB dongle or a network card Mac address and it
defines what features can be used on the current installation. For this thesis a training
license with access to all features was entered. Training license means that it is only
valid for three months and has to be renewed after that.
The last step before starting to configure S+ Operations is to define Windows users and
groups. These groups are mandatory since they will be used by different S+ Operations
applications and also associated with S+ Operations internal groups. The management
of users will also be a lot easier with predefined groups, each with their specific
permissions. At this point a domains server is configured, if it is to be used. The
30 different groups are granted access to some folders and registers according to the
System Configuration Guide (S+ Operations 2.0, 2013e).
In this project the system contains a single node and hence only local users and groups
are defined. The following groups were defined:
SPlusOUsers SPlusOAdmins SPlusIMEventRedaer SPlusIMEventWriter SysAdmin
And these users:
SPOperations (Administrator), member of all the groups defined above. ABB, member of SPlusOUsers, SPlusIMEventRedaer.
7.1.3 General configuration
Configuration of S+ Operations can be done either with Composer Operations or locally
as an off-line configuration. Composer Operation is a part of S+ Engineering and it has
to be installed on a separate node that does not contain S+ Operations Server.
Composer operations is highly recommended when the system includes several nodes
since all configurations may be done just once on Composer Operations node and then
deployed to all the other nodes. It is noticeable that all local configurations are
overwritten when new configurations are deployed from Composer Operations. In this
project Composer Operations was not used, but instead all the configurations were
made locally on the target node. Off-line configuration does not differ a lot from
configuring with Composer Operations, except for the absence of some graphical user
interfaces (GUI). The configuration can roughly be divided into two parts: configuring
of different registers and transferring plant-relating data from external files into S+
Operations database. Registry configurations are mainly done with System Setup
application (see chapter 4.5.2) and the same application is used to transfer data from
so called “definition files”, commonly XML, XLS or dbf files.
The first configurations that have to be done are settings to do with the sizing of the
system. At this point, if it is not done earlier, the system size has to be evaluated more
exactly. Number and type of nodes, total number of digital and analog tags, database
structure and number of OPC items are some of the settings that have to be done. As
31 the system in this project is simple and will only include a small number of tags, the
sizing of the system was done by keeping default values.
The following configurations are not dependent on each other and can therefore be
performed in any order. All of these settings are not mandatory, but in order for the
system to work properly these settings are typically done.
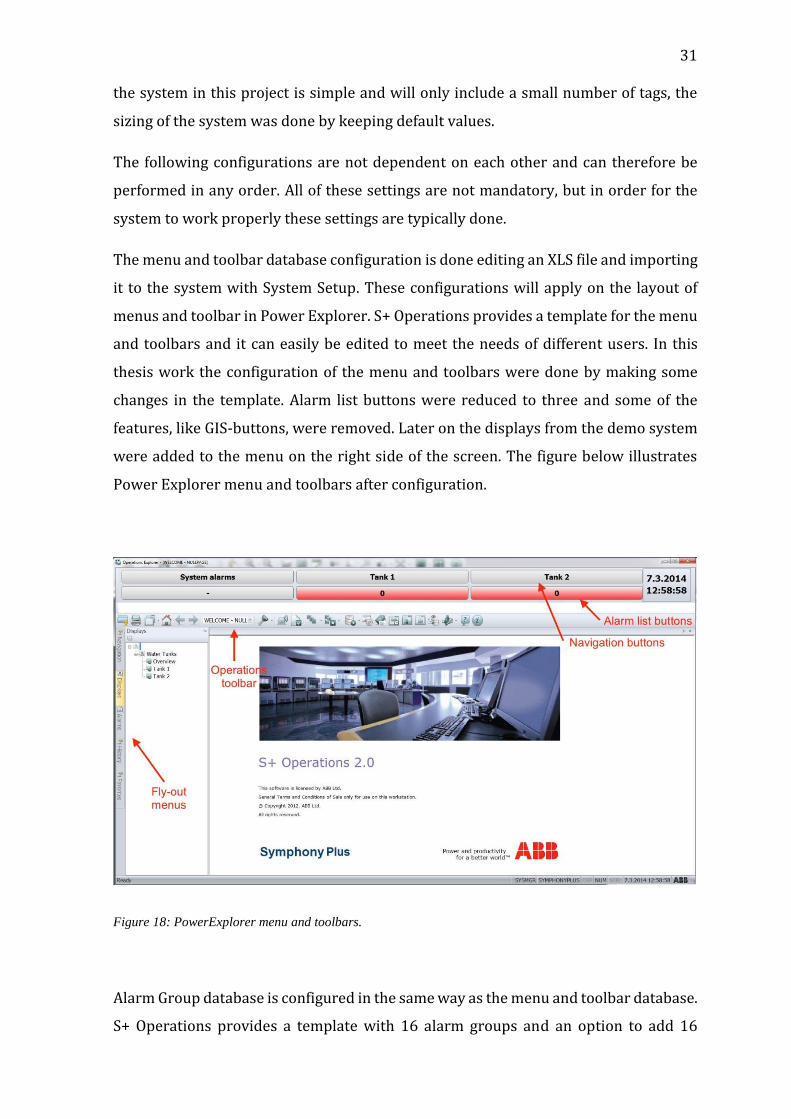
The menu and toolbar database configuration is done editing an XLS file and importing
it to the system with System Setup. These configurations will apply on the layout of
menus and toolbar in Power Explorer. S+ Operations provides a template for the menu
and toolbars and it can easily be edited to meet the needs of different users. In this
thesis work the configuration of the menu and toolbars were done by making some
changes in the template. Alarm list buttons were reduced to three and some of the
features, like GIS-buttons, were removed. Later on the displays from the demo system
were added to the menu on the right side of the screen. The figure below illustrates
Power Explorer menu and toolbars after configuration.
Figure 18: PowerExplorer menu and toolbars.
Alarm Group database is configured in the same way as the menu and toolbar database.
S+ Operations provides a template with 16 alarm groups and an option to add 16
32 subgroups to each group. Due to the small size of our system only three alarm groups
were needed. The first alarm group is called System alarms and it is for alarms that
affect the whole system, such as communication errors. The two other groups are for
the two water tanks and the surrounding devices.
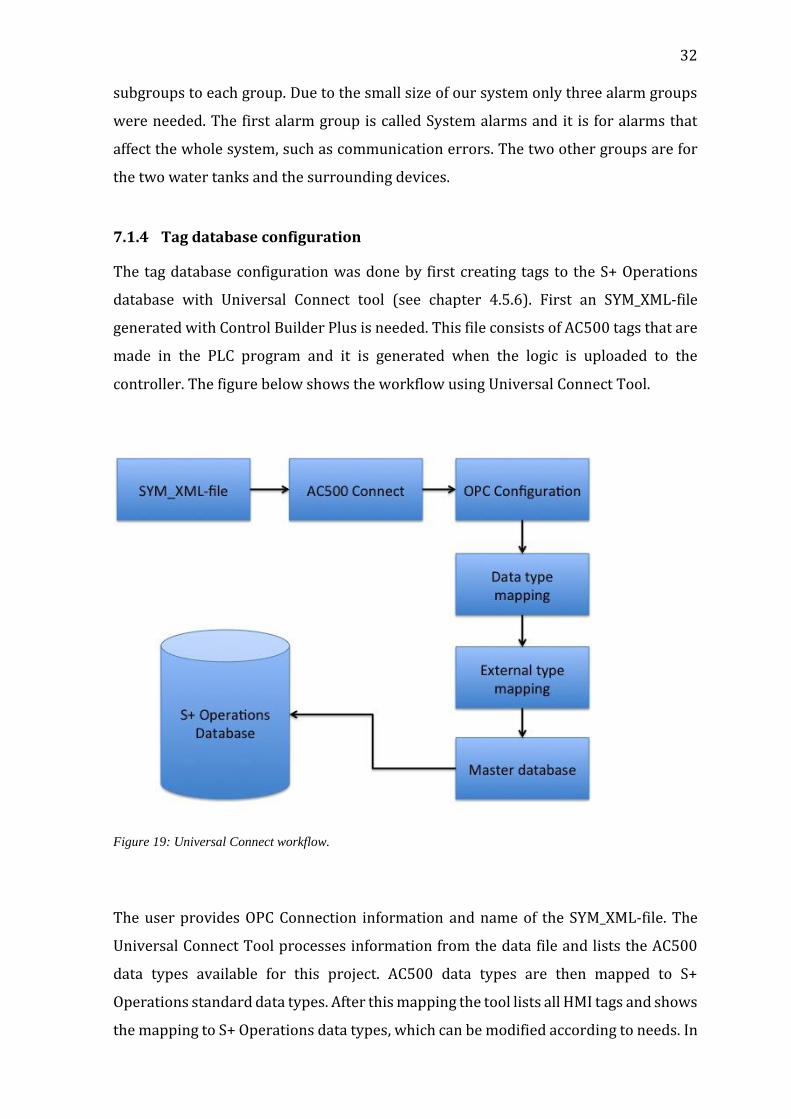
7.1.4 Tag database configuration
The tag database configuration was done by first creating tags to the S+ Operations
database with Universal Connect tool (see chapter 4.5.6). First an SYM_XML-file
generated with Control Builder Plus is needed. This file consists of AC500 tags that are
made in the PLC program and it is generated when the logic is uploaded to the
controller. The figure below shows the workflow using Universal Connect Tool.
Figure 19: Universal Connect workflow.
The user provides OPC Connection information and name of the SYM_XML-file. The
Universal Connect Tool processes information from the data file and lists the AC500
data types available for this project. AC500 data types are then mapped to S+
Operations standard data types. After this mapping the tool lists all HMI tags and shows
the mapping to S+ Operations data types, which can be modified according to needs. In
33 the final step the Universal Connect Tool lists all tags created and ready to be saved as
a tag file (.xls) that can be imported to the S+ Operations database. At this point the
user may evaluate and possibly modify the tags created by Universal Connect.
When tags are created with Universal Connect Tool, most of the tag configurations are
done automatically and manual configuration of tags is not necessary. The tags are
linked to a standard AC500 faceplate provided by S+ Operations, configured for OPC
connection and with default values on the rest of the settings.
However, some additional configurations were made within this thesis work. Tags that
were considered important, such as like process values, valve positions and controller
settings, were configured to be stored in the History Server (see chapter 7.1.5). Alarm
processing was done internally within S+ Operations, which means that remote alarm
processing (alarm processing via OPC AE) was disabled.
With all the configurations done, the tag-file was imported with System Setup into the
S+ Operations database. Additional configuration of tags is done either on-line with
Ibdbase (see chapter 4.5.3) or by configuring the tag-file and importing it with System
Setup.
7.1.5 History server configuration
History server configuration includes many steps that are described in S+ Operations
– History Reference guide (S+ Operations 2.0, 2013c) and in S+ Operations System
Configuration Guide (S+ Operations 2.0, 2013e). This subchapter gives an overview of
what to consider and how History Server was configured during this thesis work.
When installing S+ Operations History Server the package includes a Microsoft SQL
server, which is a pre-requirement before any other configurations can be done. The
main configurations are done with a tool called Symphony Plus History System
Configurator. First the Event database is created and the path and database size are
chosen. The Event database was sized for approximately 1 million events, which means
1.2 GB of disk space. With the same tool dependent services can be started and set to
start automatically. In most of the settings Symphony Plus History System Configurator
provides default values that can be used if there are no specific requirements on the
History server. The following step is to configure access rights to Microsoft SQL Server.
Here user groups, defined earlier (see chapter 7.1.2), may be used. For normal users an

34 access profile is made with limited rights and for administrators a profile with full
rights.
With these basic configurations History server should be ready to start. In order to
ensure that all History applications will work properly, all services associated with
History Server should be started. To check the status of History Server a normal web
browser is used. By entering the address “localhost:89” on the web browser a status
page, as seen in the figure below, is shown.
Figure 20: Status page of the History server.
To activate the connection between S+ Operations and S+ Operations History Server
some flags in the tag database should be activated. In those tags that a user wants to
store in History server, parameters are configured as follows:
35
History long term archive – activated. History archive deadband – variation limit for archiving is set. History archive lifetime – data archive time length is set.
When these parameters are configured the History server returns a History archive
index and an identifier. These returned parameters ensure that the connection
between S+ Operations Server and History Server is working properly. In the thesis
project all analog value tags are stored and also some of the digital inputs.
7.1.6 Web server configuration
The web server provided by S+ Operations is a part of History Application Server. All
the needed files should have been installed during the installation of S+ Operations (see
chapter 7.1.2).
The only things that have to be configured are the authentication of web applications
and the starting of an executable program. Windows authentication has to be enabled
for PlaCoWebClient and PgimAlarmAnalysis using the Windows administration tool
Internet Information Service (IIS) Manager. The program tntxml.exe has to be executed
and it is recommended to launch the program at every startup (this can be set to be
done automatically). (S+ Operations 2.0, 2013e).
The webserver can be accessed with a web browser through the following address:
localhost/placowebclient. In the picture below the webserver shows a process display
for Tank 1.

36
Figure 21: Webserver showing a process display for Tank 1.
7.2 Communication via OPC
Communication between the controller and S+ Operations is done trough an OPC
interface. OPC interface gives the user a possibility to use a broad range of different
controllers. In this thesis work ABB´s AC500 PLC was used and programmed with
CoDeSys. Hence the OPC server to be used was CoDeSys OPC server V3.
CoDeSys OPC server V3 is not a part of S+ Operations and therefore it has to be installed
separately. During the installation the OPC Server V3 is registered as COM service. To
ensure that the OPC server works correctly the user account for the OPC server has to
be configured through Windows Component Services (ABB, 2012a).
7.2.1 OPC DA
When the installation is ready the actual configuration of the OPC server can be done.
CoDeSys provides the user with two configuration tools, OPCconfig.exe for the OPC DA
server and AEconfiguration.exe for the OPC AE server.
The OPC DA server is configured with OPCconfig in three steps. First settings for the
OPC Server are defined. At this point only the update rate for OPC Server is configured
and set to 200 ms, which is considered as a good default value.

37 The next step is to configure settings for the PLCs. This thesis project includes two PLCs
and both of them get the same settings. The communication interface is chosen to be
GATEWAY because the PLC project is created with CoDeSysV2.3 which only supports
GATEWAY interface. The rest of the settings are configured according to the guidelines
in CoDeSys AC500 Online help (2013a).
The last step in OPCconfig is to configure connection settings for the PLC. In this section
it is important to make sure that these settings match settings done in in Control
Builder Plus for the PLC. In this thesis the IP address and port number are defined as
follows: IP 192.168.0.10 and port 1201 for PLC_1 and IP 192.168.0.11 and port 1201
for PLC_2.
In S+ Operations OPC connections are configured in a file called Alias.xml. In this file
the OPC DA server name is set to CoDeSys.OPC.DA according to the name given by the
OPC server vendor (CoDeSys OPC Server V3, 2011). Additionally S+ Operations creates
automatically an OPC client instance if some of the tags in the database builder are
configured for OPC connection (see chapter 7.1.4). These settings found in System
Setup should be checked and ensured to match settings done in Alias.xml.
7.2.2 OPC A&E
OPC A&E is configured in S+ Operations in the same way as the OPC DA server.
Alias.xml and Client instance settings should be configured and the server name
CoDeSys.OPC.AE inserted.
CoDeSys OPC AE server is configured with AEconfigurator.exe. With this tool the user
may create alarms and alarm messages and link them to OPC DA items. For digital tags
the user can create digital alarms that activate either when the tag value is true or when
it is false. For analog tags a limit alarm can be created with four different alarm levels
(LowLow, Low, High and HighHigh). Specific messages may be given to these alarms.
(3S - Smart Software Solution GmbH, 2009).
CoDeSys AE server timestamp source cannot be chosen. The timestamp comes from PC
by default which means that the use of OPC A&E server does not provide any
information of interest to S+ Operations. For this reason alarm and event was chosen
to be handled within S+ Operations and OPC A&E was disabled.

38
7.3 Process specific configurations
After the configurations explained in chapters 7.1 and 7.2 the system should be up and
running. The remaining configurations are more about adjusting the system to process
and operator specific needs. This chapter also describes how the system was adjusted
to the water tank process used for this thesis.
7.3.1 Displays and faceplates
Displays and faceplates are the means by which the process is visualized to the
operator. Displays are graphical representations of the process with dynamical
symbols buttons and bars. Faceplates are usually pop-up windows to monitor and
control a specific object or device. Standard AC500 faceplates were used in this project,
so there was no need to create any new ones or to adjust these faceplates.
Three displays were created with Display Builder to graphically present the process to
the operator. The first display is an overview of the whole process. This display
illustrates all the core components as dynamical symbols, for example the valve symbol
changes according to the current position the valve is in (open, between or closed). The
most critical parts in the process are the tank levels. These levels are represented with
a dynamic bar and display with the values shown in per cent. The purpose of this
display is to get an overview of the process and ensure that all parts in the process are
working correctly. If the operator wants more information of a specific object, a click
on the symbol opens a faceplate for the current object and gives a possibility to control
the device. The picture below shows the display with a faceplate for Valve 1.

39
Figure 22: Process overview display and a faceplate for Valve 1 opened in PowerExplorer.
The additional two displays are for Tank 1 and Tank 2. The level in Tank 1 is regulated
with a PID-controller that controls Valve 1. The tank has a constant outflow to Tank 2.
The display for Tank 1 gives the operator a closer look at the tank and the devices
surrounding it. Important values like the valve position and PID-values (set point,
process and output value) are made visible for the operator. A trend display showing
the set point and the tank level is also a part of the display. At the end of the tank
outflow pipe there is a navigation button that opens a display for Tank 2. The display
for Tank 1 is shown in the figure below.
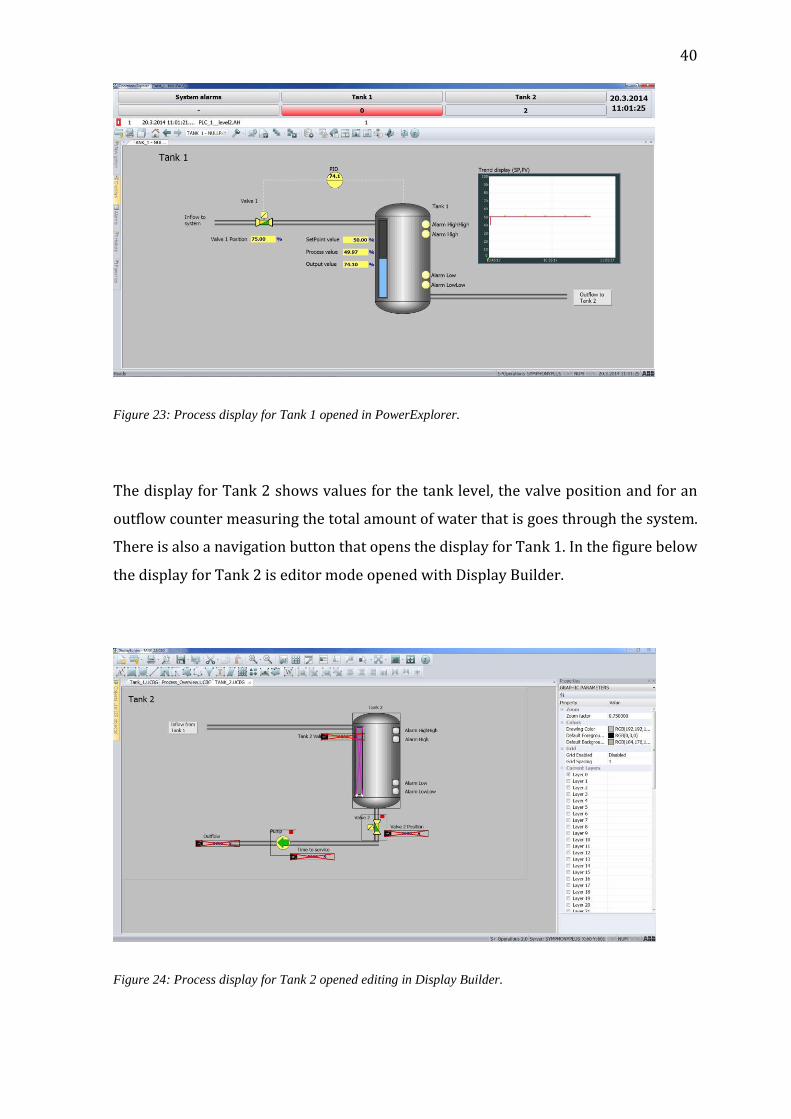
40
Figure 23: Process display for Tank 1 opened in PowerExplorer.
The display for Tank 2 shows values for the tank level, the valve position and for an
outflow counter measuring the total amount of water that is goes through the system.
There is also a navigation button that opens the display for Tank 1. In the figure below
the display for Tank 2 is editor mode opened with Display Builder.
Figure 24: Process display for Tank 2 opened editing in Display Builder.

41 7.3.2 Reports
To give an example of what a report in S+ Operations could look like, a daily report for
both Tank 1 and Tank 2 was created. The reports show average, minimum and
maximum values for different signals during a day. The report for Tank 1 includes the
following signals: Tank 1 level, set point, PID-output value and Valve 1 position. The
report for Tank 2 is a similar one as for Tank 1 and it includes the following signals:
Tank 2 level and Valve 2 position. Examples of these reports can be found in appendix
1.
Both reports are created automatically with an application called ReportScheduler.
ReportScheduler runs in the background as a Windows service and is configured to
create new reports automatically once a day.
7.3.3 Trends
An example trend was made to illustrate some possible functions in S+ Operations. The
example trend was made to illustrate the tank levels during a time span of six hours. In
the figure below, the blue line represents the level in Tank 1 and the red line represents
the level in Tank 2. Adding additional signals to the trend display is easily done by
dragging a signal from Signal Explorer to the trend display. In the picture below is a
trend display for PID signals with the set point (red), the process value (green) and the
output value (blue) shown.
Figure 25: Trend display for a PID-controller. The red line is the set point, green line is the process value and
the blue line is the output value.

42
8 Results
The result of this thesis is a functional demo environment with S+ Operations
combined with AC500. This solution provides the user with a possibility to test and
develop different functionalities in S+ Operations.
S+ Operations is implemented as a server-less architecture on a PC connected to the
PLC through Ethernet. The solution uses OPC to communicate between S+ Operations
and AC500. To be able to test functionalities in S+ Operations a simulation of a simple
water tank process is running on the PLC. In this chapter advantages and potential
improvement areas are presented.
8.1 Advantages
The connection between AC500 and S+ Operations is easily made with the Universal
Connect tool. The tool creates tags automatically according to information provided by
the user. Most of the tag configurations are also done automatically with Universal
Connect, e.g. tags are linked automatically to OPC items and standard AC500 faceplates.
These AC500 faceplates are license free and included in a basic installation of S+
Operations.
S+ Operations provides a powerful tool with which reports are created. In this thesis
an example of a daily report was created. The report is automatically generated every
day at a given time. Reports are made in Microsoft Excel and are easily configured to
meet the user´s needs. With ReportScheduler the user can decide how and when
reports are generated.
S+ Operations History is the old PGIM which is commonly used with 800xA. This means
that most of the functionalities are familiar to those who have used PGIM with 800xA
or with some other control system. An advantage compared to 800xA is that no
additional license is needed for S+ History.
The webserver included in S+ Operations gives office users a possibility to get access
to process displays, reports and trends. The process displays are updated periodically
and gives the user a possibility to follow the process in real-time. All navigation buttons
in the displays are working correctly but all control functions like faceplates are
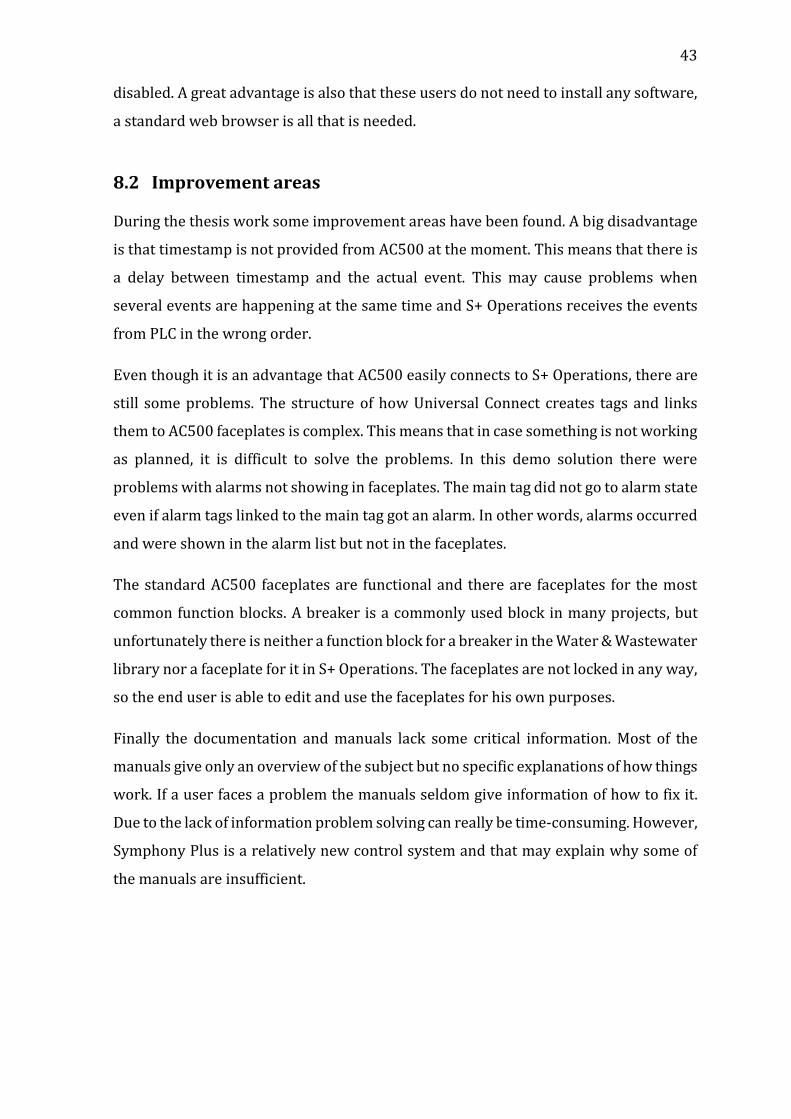
43 disabled. A great advantage is also that these users do not need to install any software,
a standard web browser is all that is needed.
8.2 Improvement areas
During the thesis work some improvement areas have been found. A big disadvantage
is that timestamp is not provided from AC500 at the moment. This means that there is
a delay between timestamp and the actual event. This may cause problems when
several events are happening at the same time and S+ Operations receives the events
from PLC in the wrong order.
Even though it is an advantage that AC500 easily connects to S+ Operations, there are
still some problems. The structure of how Universal Connect creates tags and links
them to AC500 faceplates is complex. This means that in case something is not working
as planned, it is difficult to solve the problems. In this demo solution there were
problems with alarms not showing in faceplates. The main tag did not go to alarm state
even if alarm tags linked to the main tag got an alarm. In other words, alarms occurred
and were shown in the alarm list but not in the faceplates.
The standard AC500 faceplates are functional and there are faceplates for the most
common function blocks. A breaker is a commonly used block in many projects, but
unfortunately there is neither a function block for a breaker in the Water & Wastewater
library nor a faceplate for it in S+ Operations. The faceplates are not locked in any way,
so the end user is able to edit and use the faceplates for his own purposes.
Finally the documentation and manuals lack some critical information. Most of the
manuals give only an overview of the subject but no specific explanations of how things
work. If a user faces a problem the manuals seldom give information of how to fix it.
Due to the lack of information problem solving can really be time-consuming. However,
Symphony Plus is a relatively new control system and that may explain why some of
the manuals are insufficient.

44
9 Discussion
This thesis has been a part of a project with a goal to investigate and create a control
system solution with ABB´s products S+ Operations and AC500. It resulted in a demo
process simulated in the PLC and monitored and controlled with S+ Operations. In this
chapter the whole thesis with the result included will be discussed and some
suggestions for further studies will be presented.
9.1 Thesis work process
During the meeting of 4 October 2013 when the subject of this thesis was introduced,
the focus was on how S+ Operations and AC500 could suit engine power plants. The
original goal was to make a copy of an existing engine power plant project. At a quite
early phase of the project the goal was considered a bit unrealistic and therefore
modified in discussions with my supervisor Mr Daniel Fröjdö and Mr Daniel Hummel´s
supervisor Mr Frank Redlig. The final goal (see chapter 1.2) was to build a solution with
a simple demo process that enables the user to test different functionalities in S+
Operations.
The subject of this thesis is quite broad and prior knowledge from many different areas
is beneficial. The theoretical part of the thesis could have included several other
relevant topics, but was narrowed into a general chapter of automation systems and
some chapters introducing the user to Symphony Plus in general and S+ Operations in
particular. Reading Zhang´s (2010) and Sharma´s (2011) descriptions of different kinds
of control systems gave a better understanding of how flexible the architecture of S+
Operations is. Almost all the types of automation systems mentioned in chapter 2.1
could be implemented with S+ Operations.
With no earlier experience of control systems it took a great amount of time to
understand how the system works. S+ Operations includes many different applications
so just getting to know how the applications work was a challenge. The main approach
during the practical part of the thesis work was “trial and error”. Due to a lack of
information in some manuals a lot of time was consumed in testing how different
functionalities work. This forced me to dig deeper into some of the functionalities and
it gave me a better understanding of how things work in S+ Operations.

45 During the project there were some problems in choosing the platform on which S+
Operations was going to be installed. First a virtual machine was used but due to some
license problems it was changed to a standard PC. The problem with the PC was that it
only had Windows Home-version installed. This was not really a problem until it
became clear that the webserver did not work properly on a Home-version of
Windows. This meant that the hardware was changed a second time and now
implemented on a PC with Windows Professional installed (described in chapter 7.1.1).
A lot of time could have been saved if the project had been done on a proper platform
meeting all the requirements from the beginning. However, thanks to the problems
that occurred I learnt a lot about S+ Operations and also about computers in general.
The demo solution with the simulated process works properly and fulfils its function.
The process is simple and also really fast. A fast process gives the opportunity to test
many different functions in a short time. On the other hand it is sometimes too fast,
which means that slower functions are hard to recognize. There are lots of possibilities
to further develop the demo process and the whole operating environment depending
on what is of interest, e.g. the solution could be made more suitable for presentation.
The purpose of this thesis was to find advantages and improvement areas of S+
Operations in combination with AC500. Since I had no prior knowledge of control
systems and therefore nothing to compare S+ Operations to, it was difficult to list any
concrete advantages or disadvantages. My supervisor Mr Daniel Fröjdö gave me the
references of what to compare with and in discussion with him the main advantages
and disadvantages became clear.
9.2 Conclusion
Summing up the advantages and improvement areas presented in chapter 8, it seems
like a solution with S+ Operations in combination with AC500 fits best to water and
wastewater projects and some small power plants. Due to the lack of support of
timestamp from PLC it reduces the possibility to use the solution in some kinds of
projects. Hence it would be of great interest to develop support of timestamp from PLC.
My thesis work has been a challenging but a truly rewarding experience. It has been
inspiring to work with a relevant subject, and something that will benefit the
commissioner. With the experience gained from this work my understanding of

46 industrial control systems in general and ABB´s Symphony Plus product family in
particular has increased significantly.

Bibliography
3S - Smart Software Solution, 2009. User Guide: Alarm and Events Configurator. [pdf] 3S - Smart Software Solution GmbH.
ABB, 2011a. ABB launches new Symphony Plus control system. [Online] Available at: http://www.abb.com/cawp/seitp202/ca29f23e21098410c1257877003d3d3a.aspx [Accessed 10 March 2014].
ABB, 2011b. Symphony Plus Hardening Manual. [pdf] ABB.
ABB, 2012a. Release Notes OPC-Server V3 Alarm Event for High Availability. [pdf] Heidelberg: ABB.
ABB, 2012b. S+ Control: AC500 series - AC500 overview. [Presentation] ABB.
ABB, 2013a. CoDeSys AC500 - Online Help. ABB.
ABB, 2013b. Symphony Plus Evolution. [Presentation] ABB.
ABB, 2014. ABB Group. [Online] Available at: http://www.abb.com [Accessed 11 March 2014].
Cegrell, T. & Sandberg, U., 1994. Industriella Styrsystem. Borås: Responstryck.
CoDeSys OPC Server V3, 2011. CoDeSys OPC Server V3 - Installation and Usage. [pdf] 3S-Smart Software Solution Gmbh.
Granö, N., Elfving, G., Bergqvist, M., Bohm, O. and Eriksson, N-O., 1998. ABB Industrial Manual. Lund: ABB AB.
OPC Foundation, 2014. [Online] Available at: http://www.opcfoundation.org [Accessed 11 March 2014].
Ruebeck, F., n.d. Heritage of Bailey Controls. [Online] Available at: http://www.classicautomation.com/Bailey-Heritage.aspx [Accessed 20 February 2014].
S+ Operations 2.0, 2013a. S+ Operations 2.0 - Database Reference Guide. [pdf] ABB.
S+ Operations 2.0, 2013b. S+ Operations 2.0 - Display Builder User Guide. [pdf] ABB.
S+ Operations 2.0, 2013c. S+ Operations 2.0 - History Reference Guide. [pdf] ABB.
S+ Operations 2.0, 2013d. S+ Operations 2.0 - History User Guide. [pdf] ABB.
S+ Operations 2.0, 2013e. S+ Operations 2.0 - System Configuration Guide. [pdf] ABB.
S+ Operations 2.0, 2013f. S+ Operations 2.0 - Universal Connect Guide. [pdf] ABB.
S+ Operations 2.0, 2013g. S+ Operations 2.0 - User Guide. [pdf] ABB.
Sharma, K., 2011. Overview of Industrial Process Automation. London: Elsevier.

Shell, R.L. & Hall, E.L., 2000. Handbook of Industrial Automation. New York: CRC Press. E-book.
Zhang, P., 2010. Advanced Industrial Control Technology. Oxford: Elsevier.

Appendix 1 1 (2)

Appendix 1 2 (2)


![symphony Plus life.ppt€¦ · · 2015-04-25HPG800 or BRC400 modules ... Bulk Import / Export tool ... symphony Plus life.ppt [Compatibility Mode]](https://static.fdocuments.us/doc/165x107/5af647dc7f8b9a92719006a5/symphony-plus-lifeppt-2015-04-25hpg800-or-brc400-modules-bulk-import-export.jpg)