Symantec i™ for PeopleSofteval.symantec.com/.../ent-whitepaper_i3_peoplesoft... · Application...
30
Confidence in a connected world. WHITE PAPER: APPLICATION PERFORMANCE MANAGEMENT Application Performance Management: Symantec i 3 ™ for PeopleSoft
Transcript of Symantec i™ for PeopleSofteval.symantec.com/.../ent-whitepaper_i3_peoplesoft... · Application...
Confidence in a connected world.
WH
ITE
PA
PE
R: A
PP
LIC
AT
ION
PE
RF
OR
MA
NC
E M
AN
AG
EM
EN
T
Application Performance
Management:
Symantec i3™ for PeopleSoft


Contents
Executive summary. . . . . . . . . . . . . . . . . . . . . . . . . . . . . . . . . . . . . . . . . . . . . . . . . . . . . . . . . . . . . . . . . . 4
Introduction . . . . . . . . . . . . . . . . . . . . . . . . . . . . . . . . . . . . . . . . . . . . . . . . . . . . . . . . . . . . . . . . . . . . . . . . 5
The typical PeopleSoft environment . . . . . . . . . . . . . . . . . . . . . . . . . . . . . . . . . . . . . . . . . . . . . . . . . . . 6
Performance management challenges . . . . . . . . . . . . . . . . . . . . . . . . . . . . . . . . . . . . . . . . . . . . . . . . . 8
The Symantec i3 for PeopleSoft methodology . . . . . . . . . . . . . . . . . . . . . . . . . . . . . . . . . . . . . . . . . . 11
Symantec i3 for PeopleSoft . . . . . . . . . . . . . . . . . . . . . . . . . . . . . . . . . . . . . . . . . . . . . . . . . . . . . . . . . . 12
Symantec i3 for PeopleSoft features . . . . . . . . . . . . . . . . . . . . . . . . . . . . . . . . . . . . . . . . . . . . . . . . . . 14
StartPoint (Site Map) . . . . . . . . . . . . . . . . . . . . . . . . . . . . . . . . . . . . . . . . . . . . . . . . . . . . . . . . . . . . . . . . 14
Proactive management by exception . . . . . . . . . . . . . . . . . . . . . . . . . . . . . . . . . . . . . . . . . . . . . . . . . . . 15
Correlated end-to-end view. . . . . . . . . . . . . . . . . . . . . . . . . . . . . . . . . . . . . . . . . . . . . . . . . . . . . . . . . . . 16
Expert analysis . . . . . . . . . . . . . . . . . . . . . . . . . . . . . . . . . . . . . . . . . . . . . . . . . . . . . . . . . . . . . . . . . . . . . 19
SmarTune—automatic analysis and recommendations . . . . . . . . . . . . . . . . . . . . . . . . . . . . . . . . . . . 20
Long-term analysis. . . . . . . . . . . . . . . . . . . . . . . . . . . . . . . . . . . . . . . . . . . . . . . . . . . . . . . . . . . . . . . . . . 21
A dashboard for PeopleSoft operations. . . . . . . . . . . . . . . . . . . . . . . . . . . . . . . . . . . . . . . . . . . . . . . . . 22
Putting all the pieces together—a typical scenario . . . . . . . . . . . . . . . . . . . . . . . . . . . . . . . . . . . . . . . 23
Benefits of Symantec i3 for PeopleSoft. . . . . . . . . . . . . . . . . . . . . . . . . . . . . . . . . . . . . . . . . . . . . . . . 27
Summary . . . . . . . . . . . . . . . . . . . . . . . . . . . . . . . . . . . . . . . . . . . . . . . . . . . . . . . . . . . . . . . . . . . . . . . . . 28
White Paper: Application Perfomance Management
Application Performance Management:
Symantec i3™ for PeopleSoft

Application Performance Management: Symantec i3™ for PeopleSoft
4
Executive summary
Experienced PeopleSoft personnel recognize the need to include application performance best
practices throughout the entire application lifecycle, from development to deployment and
operation. The most significant challenges facing PeopleSoft administrators today are defining a
systematic process to understand application behavior, usage patterns, and service levels; alerting
the right people of problems before they can affect business users; and helping those people drill
down to the root cause of the problem. Another major challenge is measuring the actual service
being delivered to the end user and then determining the end-to-end service time contributors.
These measurements are needed not only to make the appropriate tuning, design, or architectural
changes, but also to successfully integrate the PeopleSoft application with other legacy or third-
party applications.
Addressing these challenges has become even more important with the advent of PeopleSoft
8, which introduces new technologies such as Web servers, J2EE servlets, and Jolt. Paradoxically,
these new technologies demand more responsiveness and round-the-clock high performance than
PeopleSoft 8’s less-complex client/server applications. The process of rolling out an application
from development to production is a tedious and time-consuming activity that may result in
business dissatisfaction if proper application performance management practices are not
employed.
Symantec i3 for PeopleSoft is one of the industry's first solutions to define application
performance management in a way that quickly and efficiently captures and correlates PeopleSoft
application metrics (such as user-activated URLs, invoked J2EE servlets, called Jolt APIs to the
Tuxedo services, and database SQL statements) across the entire PeopleSoft infrastructure.
Symantec i3 for PeopleSoft presents these important metrics in a manner that promotes
crisp communication and rapid problem detection, correction, and verification throughout the
application lifecycle. This paper describes this unique approach.

5
Application Performance Management: Symantec i3™ for PeopleSoft
Introduction
By their very nature, PeopleSoft applications are highly complex and mission-critical. They run
on a complex, multitiered environment where high performance and effective performance
management are a must. After all, the service you provide to your PeopleSoft business users is
only as good as your performance.
Organizations require 7x24 access to their PeopleSoft applications from anywhere.
PeopleSoft has provided Web access through the introduction of the new Pure Internet
Architecture (PIA). Now, customers can access their traditional PeopleSoft applications using a
Web browser. While this provides for faster deployment time and lower total cost of ownership
(TCO), it also introduces an element of unpredictable load on the system: Users can now access
their information from anywhere at any time.
Web access brings with it new components such as Web servers, J2EE servlets, and Jolt.
Performance management in these environments is more difficult because there are more
devices involved, more potential points of failure, and more technologies that must interact not
only among themselves, but with other applications as well. For the end user, these components
mean more functionality and convenience, but for PeopleSoft administrators, they mean more
responsibility and complexity.
Moreover, the current economic climate is leaving many IT departments increasingly
overworked and understaffed. As many companies rush to finish their PeopleSoft implementation
phase, which includes customization and changes, they are paying less attention to critical issues
such as performance, scalability, and load. When the system “goes live,” serious performance
problems often appear. Unfortunately, by this time those problems have become very expensive to
find and fix. If more attention had been paid to critical performance, scalability, and load issues
earlier in the cycle, the performance problems could have been detected and corrected before
end users were affected, thereby preventing any business losses stemming from poor PeopleSoft
performance.
Symantec has developed an application performance management solution for PeopleSoft
that spans the entire PeopleSoft IT infrastructure, including the new PeopleSoft Internet
Architecture (PIA). This paper discusses the challenges, solutions, and benefits that Symantec i3
for PeopleSoft provides for performance management of PeopleSoft applications.
Application Performance Management: Symantec i3™ for PeopleSoft
6
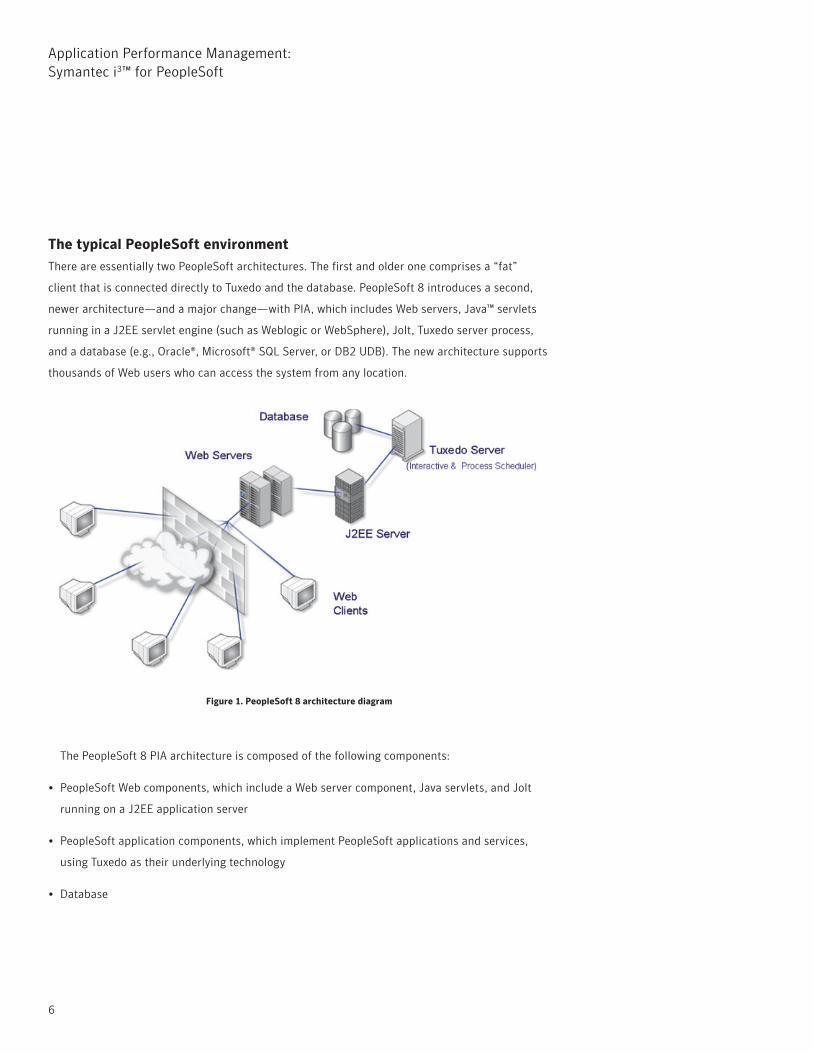
The typical PeopleSoft environment
There are essentially two PeopleSoft architectures. The first and older one comprises a “fat”
client that is connected directly to Tuxedo and the database. PeopleSoft 8 introduces a second,
newer architecture—and a major change—with PIA, which includes Web servers, Java™ servlets
running in a J2EE servlet engine (such as Weblogic or WebSphere), Jolt, Tuxedo server process,
and a database (e.g., Oracle®, Microsoft® SQL Server, or DB2 UDB). The new architecture supports
thousands of Web users who can access the system from any location.
The PeopleSoft 8 PIA architecture is composed of the following components:
• PeopleSoft Web components, which include a Web server component, Java servlets, and Jolt
running on a J2EE application server
• PeopleSoft application components, which implement PeopleSoft applications and services,
using Tuxedo as their underlying technology
• Database
Figure 1. PeopleSoft 8 architecture diagram
7
Application Performance Management: Symantec i3™ for PeopleSoft
Each application component can be deployed on a different tier or, alternatively, several
components can occupy the same tier. In figure 1, we have the following tiers:
• Web server
• J2EE server, which includes the servlet engine and servlets such as PSP, PSC, and CS along with
the Jolt component
• Application server, which runs the different Tuxedo services such as PSAPPSRV
• Database server
A typical usage scenario starts with a user connecting to the PeopleSoft Web server to
request a page (or “PeopleSoft panel”):
• The Web server anticipates the request and forwards it to a J2EE servlet, which is responsible
for building the answer page.
• The servlet creates a Jolt message that is sent to Tuxedo.
• Tuxedo, upon receiving the request, looks at the service being called and sends it to the
appropriate Tuxedo server process running that service.
• The activated Tuxedo service fetches the required data from the database using SQL
statements.
• Tuxedo returns a response to the activating servlet, again through Jolt, which in turn builds an
answer page and sends it back to the user.
The new generation of PeopleSoft 8 applications adds new functionality as well as new
components/tiers to manage. Managing such environments presents many formidable challenges.
Application Performance Management: Symantec i3™ for PeopleSoft
8
Performance management challenges
Spreading PeopleSoft applications across multiple tiers makes it hard to pinpoint the source of
any performance problem. Among the many challenges are:
• Finding a comprehensive, yet straightforward way to measure the end-user experience by
geographic location
• Defining, measuring, and committing to organizational business objectives and service-level
objectives (SLOs)
• Collecting performance metrics in real time across the PeopleSoft infrastructure, 7x24, with
very low overhead
• Correlating large amounts of performance metrics to quickly isolate a problematic component
(network, Web server, J2EE servlet, Jolt, Tuxedo or the database)
• Analyzing large amounts of data, if available, to pinpoint performance issues and recommend
solutions
• Coping with unpredictable load periods and handling massive transaction and data volumes
• Proactively managing the system to be sure it can maintain satisfactory service levels even
when deviations from normal behavior occur
• The ability to find PeopleSoft users and transactions that have a direct impact on
performance—and those that are most vulnerable to performance degradation
• Being able to define normal and abnormal application usage behavior through baselines to
identify problem patterns before the end user is affected
• Monitoring external Java or Tuxedo interfaces between PeopleSoft and legacy and third-party
applications
• Maintaining historical data for trending, exception reporting, and capacity planning

9
Application Performance Management: Symantec i3™ for PeopleSoft
These challenges are not covered by system management frameworks, by synthetic robots
testing the system from multiple locations, or by “stovepipe” snapshots from individual servers
along the application path.
System frameworks are extremely well suited for determining system availability.
Unfortunately, they do not focus on the end-user experience, activity, and usage. Therefore, if all
system parameters look acceptable, how can we tell that location X or certain users suffer from
poor response time, or why certain PeopleSoft URLs are slow? Moreover, if we don’t collect and
correlate activities across tiers, how can we tell if the problem is due to a poor Tuxedo service or a
problematic SQL statement?
Robots provide external samples of synthetic transactions. They reflect neither the real
load on the application and its distribution, nor the real transactions that are executed. Real
application traffic could vary dramatically from simulated traffic; for example, you may have
distributed robots at three locations but today, unbeknownst to you, most of the traffic is coming
from a fourth location—or users may continue to suffer from bad response times for certain
transactions while a robot is simulating other transactions. Moreover, synthetic activity is only
activated periodically, which causes a gap in continuous 7x24 data collection of performance
metrics. What happens between one synthetic sample and the next one?
Robots can actually create more unnecessary work on the system and may compete directly
with your end users for critical resources. Additionally, any simulated transactions that perform a
commit to the database need to be removed from the system.
The stovepipe approach, which takes snapshots from individual servers—such as J2EE,
Tuxedo, and Oracle—do not provide an answer to the problem either. Snapshots provide very
coarse information, generic statistics taken separately from each tier, and no correlation across
tiers. For example, you can look at Java servlets and Tuxedo or Oracle metrics and still not
understand which component of a problematic transaction is causing the bottleneck. By following
the real end-user transaction across the PeopleSoft tiers, we discover that a Tuxedo service is
running long because of long-running SQL statements in the database. Snapshots would tell you
that the average Java servlets, Tuxedo, and SQL response times are acceptable, but they cannot
tell which Tuxedo services or SQL statements belong to which transactions; therefore, they cannot
help much in isolating the problem.

Application Performance Management: Symantec i3™ for PeopleSoft
10
Metrics for end-to-end application analysis must be captured by agents having application
knowledge and visibility. They must also reflect the end user’s experience. Real-time performance
metrics should be collected 7x24 and correlated across the PeopleSoft application infrastructure
path, enabling both problem isolation and root cause identification.
Data collected from different tiers and application components must be correlated—for
example, Java servlets correlated with requested Jolt messages and Tuxedo calls, and Tuxedo
correlated with SQL statements sent to the database. Without this correlated data, it may take
an exorbitant amount of time and effort to isolate the problem and find its root cause due to
granularity, activity, and parallelism. For example, we have detected that all users executing a
specific PeopleSoft transaction or a specific URL suffer from long response times. Where is the
problem? Is it the network, the Web server, the Java servlet, Tuxedo, or the database? Without
correlating granular metrics across tiers we would not be able to isolate and solve the problem. In
our example, looking at a correlated view reveals immediately that the problem is Tuxedo. Drilling
down into Tuxedo shows that there is a long queue. The solution is simple: launch an additional
Tuxedo server process.
Collecting performance metrics 7x24 and correlating them is mandatory, but it is not enough
to provide a useful PeopleSoft performance management solution that directly addresses the
challenges mentioned earlier. Collected data must be kept for long-term analysis, exceptions,
baselines, trending, and capacity planning. Based on this historical data, we can calculate the
typical PeopleSoft behavior. For example, there are peaks each Monday morning and at the end
of each month. Knowing this behavior, we can generate exceptions for abnormal behavior or set
the right SLA thresholds. We could also use historical data to calculate database table growth and
allocate enough space in advance, or to create appropriate indexes to reduce fetch times.
As we have seen, infrastructure frameworks provide critical system and network management
“bottoms-up” detail but do not look at end-user and transaction activity. Robots provide external
samples of synthetic transactions, and the stovepipe approach looks at each tier separately and
provides generic statistics for that tier only. These approaches lack the power to find, isolate, and
focus on the root causes of performance degradation as well as the real end-user response-time
experience. Symantec i3 for PeopleSoft fills this gap by providing the actual end-user experience
and detailing the applications’ end-to-end response-time contributions. This enables PeopleSoft
administrators to “see” how their applications are performing from the perspective of their end

11
Application Performance Management: Symantec i3™ for PeopleSoft
users and to correlate that experience with the underlying application components in terms of
end-to-end performance contribution. This is a very powerful combination.
The Symantec i3 for PeopleSoft methodology
It is vital for all organizations to understand the importance of a systematic approach to managing
performance issues and to realize the inherent ineffectiveness of ad-hoc problem-solving. The
foundation of the Symantec i3 for PeopleSoft solution is a methodology designed to facilitate
the rapid detection, isolation, analysis, correction, and verification of application performance
problems. All organizations can benefit from the discipline that Symantec i3 for PeopleSoft brings
to the performance management process. The Symantec performance management methodology
enables you to use a proven process, as well as proven supporting solutions, to implement
effective performance management within your organization. The Symantec performance
management methodology comprises five stages:
1. Detect—Proactively identify the symptoms that could indicate a performance problem
2. Find—Identify the problematic tier and application component
3. Focus—Discover the root cause of the problem
4. Improve—Take the steps required to improve performance
5. Verify—Make sure the steps taken have achieved the desired goal
These stages combine to form a process that provides a systematic approach to finding and
resolving all kinds of performance issues, both predictable and unforeseen.
For example the methodology begins with an automated proactive detection (Detect)
through baselines and SLAs, using built-in alert capabilities. Alerts can be directed to the
appropriate infrastructure framework, organization, or administrator based on what was detected.
Alternatively, the appropriate person in your organization could periodically detect some long
service times while reviewing the performance trends of elements such as J2EE servlets, Tuxedo
services, database calls, etc.

Application Performance Management: Symantec i3™ for PeopleSoft
12
Depending on the issue detected, the PeopleSoft application manager can view the
application, end to end, and isolate (Find) the problematic tier and the application component
that is the source of the degradation. Problems may be caused by network delays, long-running
servlets, Jolt, long-running Tuxedo services, or long database access times. The process of
finding the problematic component is end-user focused, so that we actually follow the end-
user transaction or the interfaced application all the way from the time the user activates the
transaction.
After finding the problematic component, an in-depth analysis of that component must be
done to focus on the root cause of the problem (Focus). For example, if we have found that Tuxedo
is the problematic component, we would like to understand which Tuxedo service is causing the
problem, and whether of the cause is long queue wait time or processing time. If, on the other
hand, the problem concerns the Java servlets, we would like to look at the different methods
called, including Jolt and Tuxedo calls through Jolt, to understand whether of the problem is due
to a specific method or long-running Tuxedo calls.
After focusing on the problem’s root cause, the next step is the actual fixing of the problem
(Improve). If we continue with our earlier Tuxedo example, launching additional Tuxedo server
processes fixes a long queue time waiting for a Tuxedo service.
Once the fix has been applied, we should verify (Verify) that the problem has indeed been
fixed and that it will not reappear. Utilizing long-term information kept in the Performance
Warehouse, we can examine service time before and after the fix was applied. This shows whether
or not we fixed the problem and if service times are as expected.
Symantec i3 for PeopleSoft
Symantec i3 for PeopleSoft focuses on providing your organization with the ability to measure
and monitor your application performance end to end—from the browser and Web server to the
Java servlets, Jolt, the Tuxedo server processes, the database, and even the physical storage.
Conceptually, Symantec i3 for PeopleSoft is composed of Symantec Insight, Indepth, and Inform
functionality. Figure 2 depicts the architectural components of Symantec i3 for PeopleSoft.

13
Application Performance Management: Symantec i3™ for PeopleSoft
Symantec Insight provides the agents and logic required to enable your IT organization
to see the end-to-end response time contributions across the client, the network, the Web,
J2EE, Tuxedo, and the database servers and to isolate the components that are responsible for
slowdowns and performance bottlenecks. The whole process starts by examining the end-user
experience, measuring the actual Web-user response time at the application, transaction, or,page
level. Then, upon detection of a response-time objective (RTO) or baseline breach, the problematic
tier and component are found, as described earlier in the methodology section.
Symantec Indepth provides in-depth drill-down capability to identify the root causes of
performance problems by collecting and correlating detailed component information, including
J2EE servlet-specific information and methods, database resource consumption breakdowns, and
the slowest SQL statements.
Figure 2. Symantec i3 for PeopleSoft architecture diagram

Application Performance Management: Symantec i3™ for PeopleSoft
14
Symantec Inform provides real-time and near-time alerts that are driven by exceptions to
the baseline and defined thresholds. It also includes the reporting components of the overall
solution. This rich set of reporting capabilities enables the presentation of ad-hoc reports as well
as scheduled reports. These reports are particularly useful for tracking service levels, trending,
and conducting management by exception.
Symantec i3 for PeopleSoft also includes the Symantec Performance Warehouse, which
provides a common repository for long-term historical data collected by the different Symantec
i3 for PeopleSoft agents along the PeopleSoft application path (such as Web servers, servlets,
Tuxedo services, databases, and storage devices). This facilitates trend analysis, long-term
capacity planning, and baseline calculations.
Symantec i3 for PeopleSoft features
StartPoint (site map)
StartPoint enables a full end-to-end view of the PeopleSoft environment components, from the
Web client to the Web server, J2EE server, Tuxedo server, and Oracle database. StartPoint provides
an alert overview of the various components by category (e.g., performance or load alerts at the
Oracle database). The next step is to launch one of the Symantec i3 for PeopleSoft components.
A typical scenario may start with a user launching Symantec Insight to get an overall view of the
PeopleSoft environment or receiving a proactive alert indicating that a service-level threshold has
been exceeded. Long-term trend analysis and top resource consumers can be obtained by using
the long-term metrics stored in the Performance Warehouse. Easy access to the Performance
Warehouse information is accomplished via Symantec Inform for Foresight, which generates the
relevant reports.

15
Application Performance Management: Symantec i3™ for PeopleSoft
The sections that follow describe the main features of Symantec i3 for PeopleSoft. The last
section will put all the pieces together by providing an example of a typical scenario.
Proactive management by exception
Managing a large PeopleSoft application infrastructure with hundreds or thousands of users is
difficult at best. The only way to do so effectively is by working proactively rather than reactively.
Symantec i3 for PeopleSoft provides the way to do so through the use of exceptions, based on
service-level objectives (SLOs) and baselines. Figure 4 shows an alert generated on the Tuxedo
tier. Alerts can be generated on the end-user client tier, breaching an SLA, as well as on other tiers
across the PeopleSoft infrastructure.
Figure 3. Symantec i3 for PeopleSoft StartPoint, showing a PeopleSoft 8 environment

Application Performance Management: Symantec i3™ for PeopleSoft
16
End users are of the utmost importance. If they are satisfied, then application managers are
satisfied. Symantec i3 for PeopleSoft provides a way to measure exact response times as seen by
end users and to define SLA thresholds based on those metrics.
Correlated end-to-end view
Launching Symantec Insight provides an end-to-end view of the different tiers and components.
This view is correlated across components “from URL to SQL,” which means that you are able
to view, for example, the SQL statements executed by a specific Java servlet or Tuxedo server
process. Figure 5 is an example of such an overview screen. On the upper left side, Service Time
Comparison, we see the different tiers, Web server, J2EE, Tuxedo, and Oracle. In this example, we
immediately identify that Tuxedo and Oracle are the main contributors to response-time delays
Figure 4. Inform/Alerts showing a Tuxedo alert
17
Application Performance Management: Symantec i3™ for PeopleSoft
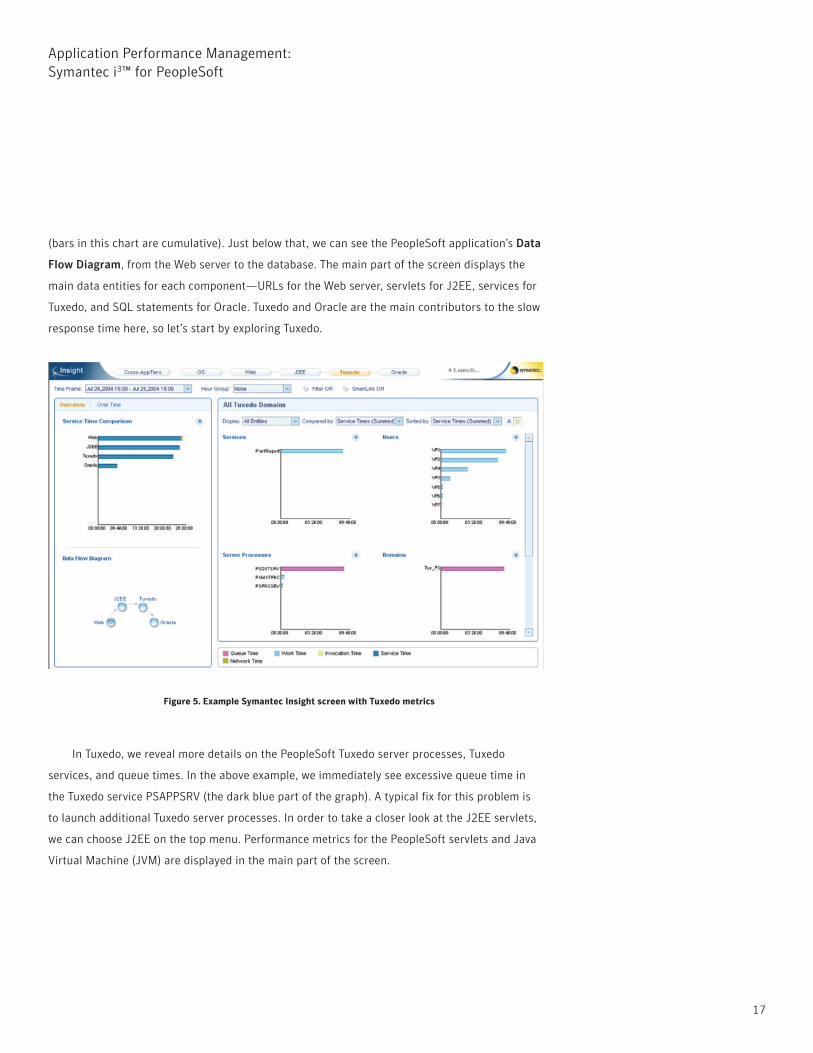
(bars in this chart are cumulative). Just below that, we can see the PeopleSoft application’s Data
Flow Diagram, from the Web server to the database. The main part of the screen displays the
main data entities for each component—URLs for the Web server, servlets for J2EE, services for
Tuxedo, and SQL statements for Oracle. Tuxedo and Oracle are the main contributors to the slow
response time here, so let’s start by exploring Tuxedo.
In Tuxedo, we reveal more details on the PeopleSoft Tuxedo server processes, Tuxedo
services, and queue times. In the above example, we immediately see excessive queue time in
the Tuxedo service PSAPPSRV (the dark blue part of the graph). A typical fix for this problem is
to launch additional Tuxedo server processes. In order to take a closer look at the J2EE servlets,
we can choose J2EE on the top menu. Performance metrics for the PeopleSoft servlets and Java
Virtual Machine (JVM) are displayed in the main part of the screen.
Figure 5. Example Symantec Insight screen with Tuxedo metrics

Application Performance Management: Symantec i3™ for PeopleSoft
18
While Symantec Insight is very useful for getting an idea of the response-time contribution
of each application tier and for identifying problematic tiers, Symantec Insight SmartLink can
even go further by allowing us to track PeopleSoft transactions, from the PeopleSoft panel or
menu being called on a Web page all the way down to the SQL statement that is finally executed
on the database. SmartLink is the correlation technology that relates transactions from across
the separate technology tiers of an application. It also provides the net response time for those
transactions, precisely broken down to all PeopleSoft application tiers. Working that way, we can
immediately pinpoint a performance bottleneck (such as a slow SQL statement) and start focusing
on resolving the issue. Figure 6 shows an example screenshot of a Symantec Insight SmartLink.
Figure 6. Symantec Insight SmartLink allows for end-to-end tracking of PeopleSoft activity

19
Application Performance Management: Symantec i3™ for PeopleSoft
Expert analysis
For experts, even more details can be obtained by using one of the Symantec Indepth products
for J2EE or Oracle, which can be launched from Symantec Insight or Symantec Insight SmartLink.
Expert analysis provides very detailed performance data for each specific tier. For example, we
can look in more detail at each one of the Java servlets, including the Jolt methods it invokes.
At the Oracle level, detailed resource consumption breakdown, SQL statements, execution
plan, users, and programs are provided. Moreover, a unique feature correlates an SQL statement
with the appropriate PeopleSoft user name, easily identifying which user is responsible for
generating problematic statements.
Figure 7. Jolt method response-time analyis with Symantec Indepth for J2EE

Application Performance Management: Symantec i3™ for PeopleSoft
20
SmarTune—automatic analysis and recommendations
Symantec i3 for PeopleSoft also provides a powerful automatic analysis component for the
PeopleSoft servlets, Jolt, and the connection to Tuxedo, which ranks the possible reasons for
the bottlenecks and provides explanations. This capability, SmartLink, is an excellent tool for
inexperienced personnel, or even experienced ones who would like to save time and get right to
the source of the problem. On the database tier, there is an index-tuning advisor that helps to
create indexes, as well as an additional component that can simulate the impact of indexes before
they are actually created.
Figure 8. Analyzing PeopleSoft SQL statements with Symantec Indepth for Oracle

21
Application Performance Management: Symantec i3™ for PeopleSoft
Long-term analysis
Performance metrics collected from the client tier, Web server, J2EE servlets, Tuxedo, and the
database are kept in a long-term repository called the Performance Warehouse. These metrics can
be used for trending and capacity planning. Symantec i3 for PeopleSoft provides a mechanism that
uses the Performance Warehouse to generate hundreds of out-of-the-box “smart” reports.
Figure 9. SmarTune recommedations example

Application Performance Management: Symantec i3™ for PeopleSoft
22
A dashboard for PeopleSoft operations
The Symantec Application Service Dashboard is a new way to access Symantec i3 for PeopleSoft
through a portal-based GUI infrastructure. It relies on open standards and provides a highly
customizable dashboard. It aggregates data from multiple sources (such as database, storage,
J2EE, and Web products) across the Symantec i3 for PeopleSoft product suite to deliver next-
generation performance management capabilities on a single console. The Application Service
Dashboard comes with a set of predefined PeopleSoft portlets that can be used to configure
customized and personalized PeopleSoft application views, meeting the requirements of the
different roles involved in PeopleSoft management and operations, such as monitoring and
PeopleTools and database administration. With Application Service Dashboard, key application
stakeholders can see what they need to see in the way they want to see it. The figure below shows
an example of a PeopleSoft dashboard view.
Figure 10. Example of an Application Service Dashboard view of PeopleSoft

23
Application Performance Management: Symantec i3™ for PeopleSoft
Putting all the pieces together—a typical scenario
Now that we have familiarized ourselves with the features of Symantec i3 for PeopleSoft, let’s
look at a typical scenario. Proactively monitoring the system, we receive a few alerts indicating
that end-user service levels have been exceeded. The Symantec Inform Alerts capability makes
us aware of a problem with the Web server instance WebSrvP3 (see figure 11). A service-level
agreement assigned to PeopleSoft menu “ENTER_BILLING_INFORMATION” was violated.
To get more information, we decide to take a closer look at the Web tier by launching
Symantec Indepth for Web (by clicking on “Indepth” in the upper right corner of the Alerts screen).
We get directed to the activity workspace of Symantec Indepth for Web, where we drill down to the
ENTER_BILLING_INFORMATION menu. Now we can see that, recently, response times have been
deteriorating rapidly. We also notice (by looking at the graph on the upper left side of figure 12)
that the vast majority of the response time has been spent on the server side because the client
Web browser has to wait a very long time for the first byte of the PeopleSoft page to arrive—and,
apparently, no issues exist at the network layer.
Figure 11. SLA violation at the PeopleSoft Web server tier

Application Performance Management: Symantec i3™ for PeopleSoft
24
In order to isolate the offending PeopleSoft application tier (Web, J2EE, Oracle, or Tuxedo)
and to quickly identify the root cause, we bring up Symantec Insight SmartLink. (See figure 13
for details.) Our issue is primarily associated with the Web component INTFC_BI_N_VW, which is
being invoked by the PeopleSoft menu ENTER_BILLING_INFORMATION. Therefore, we pick this
application path in Symantec Insight SmartLink. We can now directly see what J2EE, Jolt, and
Tuxedo activities as well as SQL statements get invoked by INTFC_BI_N_VW, along with their share
of end-to-end response time. It becomes obvious, that more than 81% of the total response time
is spent in a single SQL statement.
Figure 12. Symantec Indepth for Web indicates server-side issues

25
Application Performance Management: Symantec i3™ for PeopleSoft
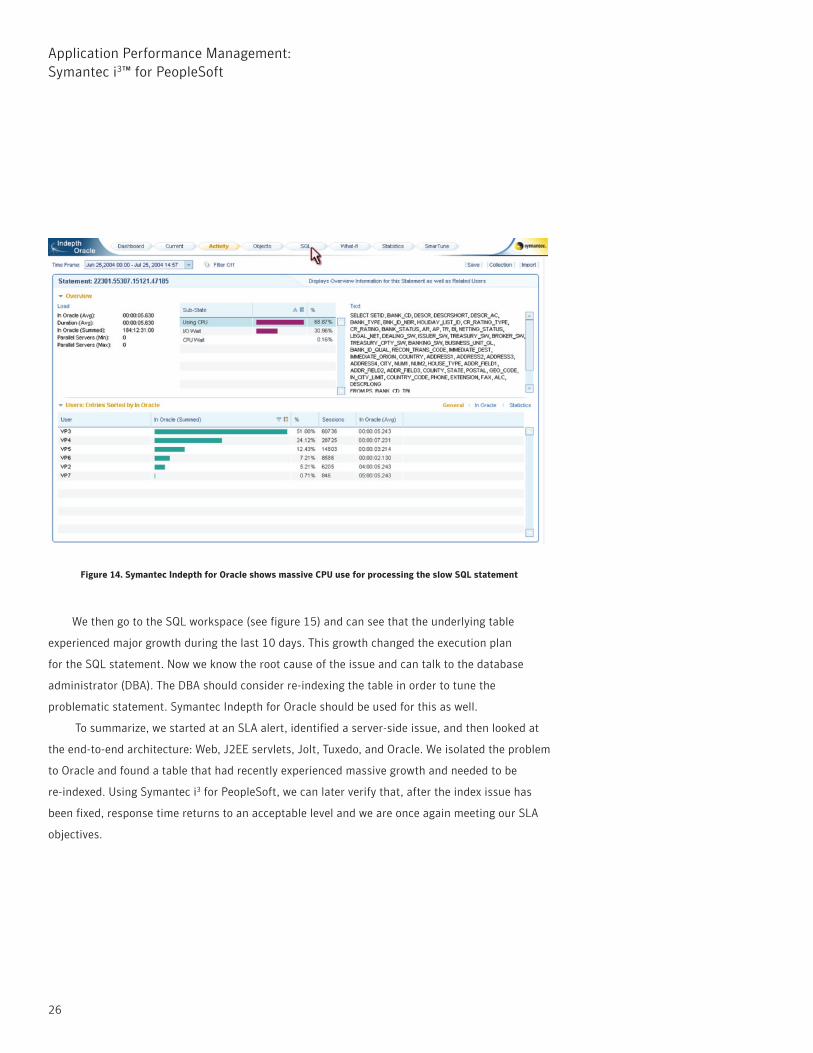
We select the slow SQL statement and click on “Indepth” in the upper right corner of the
screen to launch Symantec Indepth for Oracle in order to get to the root cause of the issue. We
first notice that this statement consumes a lot of CPU time and doesn’t suffer too much from wait
conditions (see figure 14).
Figure 13. Symantec Insight SmartLink shows a SQL statement as the primary contributor to the slow response time
Application Performance Management: Symantec i3™ for PeopleSoft
26
We then go to the SQL workspace (see figure 15) and can see that the underlying table
experienced major growth during the last 10 days. This growth changed the execution plan
for the SQL statement. Now we know the root cause of the issue and can talk to the database
administrator (DBA). The DBA should consider re-indexing the table in order to tune the
problematic statement. Symantec Indepth for Oracle should be used for this as well.
To summarize, we started at an SLA alert, identified a server-side issue, and then looked at
the end-to-end architecture: Web, J2EE servlets, Jolt, Tuxedo, and Oracle. We isolated the problem
to Oracle and found a table that had recently experienced massive growth and needed to be
re-indexed. Using Symantec i3 for PeopleSoft, we can later verify that, after the index issue has
been fixed, response time returns to an acceptable level and we are once again meeting our SLA
objectives.
Figure 14. Symantec Indepth for Oracle shows massive CPU use for processing the slow SQL statement

27
Application Performance Management: Symantec i3™ for PeopleSoft
Benefits of Symantec i3 for PeopleSoft
From a business perspective, Symantec i3 for PeopleSoft can significantly reduce PeopleSoft
slowdowns, achieving fast return on investment (ROI) while maintaining low total cost of
ownership (TCO). Symantec i3 for PeopleSoft helps organizations to:
• Optimize end-user response time and improve overall quality of service
• Reduce rollout time for their PeopleSoft 8 upgrade projects
• Eliminate "blamestorming" through the use of SmartLink correlation technology
• Find the definitive root cause of performance degradation in minutes
Figure 15 Massive table growth along with a change of the SQL execution plan caused the exception
Application Performance Management: Symantec i3™ for PeopleSoft
28
• Resolve problems faster using SmarTune's expert advice
• Proactively detect potential problems before they can impact end-users
• Improve end-user satisfaction
• Increase ROI—detect, find, and solve problems more quickly
• Effectively manage and tune the application
• Defer equipment and associated software licenses and support costs until they are actually
needed
• Understand capacity requirements, based on current PeopleSoft application usage and growth
patterns
In summary, Symantec i3 for PeopleSoft is an excellent vehicle for measuring and improving
performance objectives, providing all the necessary mechanisms to realize significant savings in
cost and effort while effectively managing application performance.
Summary
Managing the performance of PeopleSoft applications is a unique challenge that requires a unique
solution. PeopleSoft applications have become an essential part of many organizations. This trend
continues to grow with the introduction of PeopleSoft 8 applications, architecture, functionality,
and technology. While PeopleSoft 8 provides a great advance for end users by improving business
efficiency, productivity, and satisfaction, it also imposes significant challenges for PeopleSoft
administrators.
Experience has shown a direct correlation between the service levels an organization delivers
and both its productivity (internal) and its revenue (external). There is also a direct correlation
between the targeted service levels and the expenses incurred to achieve those service levels.
The penalty for not meeting users’ performance expectations may be loss of business, loss of
opportunity, or failure to realize a ROI for the effort and operational expenses.

29
Application Performance Management: Symantec i3™ for PeopleSoft
Delivering the right level of service is fundamentally more difficult due to the inherent
complexity introduced by multiple tiers, a mixture of new and old technologies in the path (such
as J2EE servlets and Tuxedo services), database calls, and storage access.
Symantec i3 for PeopleSoft addresses these challenges and actually simplifies the
deployment and management of PeopleSoft applications. Using Symantec i3 for PeopleSoft helps
companies manage service levels, contain costs, maximize the efficiency of the operational
investment, and improve the service levels experienced by the end users.
Symantec i3 for PeopleSoft is the industry’s first solution to provide a way to quickly and
efficiently capture and correlate PeopleSoft application metrics such as URLs, J2EE servlets,
Jolt, Tuxedo services, and SQL statements across the PeopleSoft infrastructure. It presents these
important metrics in a manner that enables crisp communication, rapid proactive or reactive
detection, correction, and verification throughout the application lifecycle.
Symantec i3 for PeopleSoft sets a new milestone in PeopleSoft performance management by
delivering a comprehensive, integrated software solution that addresses the major performance
challenges of PeopleSoft multitiered application components. This solution:
• Provides proactive management through exceptions, SLAs, and baselines
• Provides a way to define and measure organizational business objectives and SLAs
• Provides an integrated and correlated view of performance across tiers
• Continuously monitors real users, real data, and real PeopleSoft transactions, as opposed to
simulated or synthetic activity monitoring
• Isolates the problematic component: network, Web server, Java servlet, Jolt, Tuxedo, database,
or inefficient access to storage devices
• Identifies the root cause right down to the J2EE method, Tuxedo service, and SQL statement
• Provides best practices corrective actions and recommendations
• Provides a long-term performance repository for analysis, trending, and capacity planning
• Operates in a production environment with minimal overhead
• Fits all phases of the application lifecycle
For specific country offices and
contact numbers, please visit
our Web site. For product
information in the U.S., call
toll-free 1 (800) 745 6054.
Symantec Corporation
World Headquarters
20330 Stevens Creek Boulevard
Cupertino, CA 95014 USA
+1 (408) 517 8000
1 (800) 721 3934
www.symantec.com
About Symantec
Symantec is a global leader in
infrastructure software, enabling
businesses and consumers to have
confidence in a connected world.
The company helps customers
protect their infrastructure,
information, and interactions
by delivering software and services
that address risks to security,
availability, compliance, and
performance. Headquartered in
Cupertino, Calif., Symantec has
operations in 40 countries.
More information is available at
www.symantec.com.
Copyright © 2007 Symantec Corporation. All rights reserved. Symantec, the Symantec logo, i3, and Indepth are trademarks or registered trademarks of Symantec Corporation or its affiliates in the U.S. and other countries. Microsoft is a registered trademark of Microsoft Corporation in the United States and other countries. Oracle is a registered trademark of Oracle Corporation and/or its affiliates. Java is a trademark or registered trademark of Sun Microsystems, Inc. in the United States and other countries. Other names may be trademarks of their respective owners.09/07 12875758