Syllabus for CHEM 3281 Fall Semester, 2003 Faculty: Dr. Richard F. Browner
26
Syllabus for CHEM 3281 Fall Semester, 2003 Faculty: Dr. Richard F. Browner Boggs Chemistry & Biochemistry, Rm. B-20 (404) 894-4020 [email protected] Lab Coordinator: Dr. Robert Braga TAs: Lecture: MWF 12-110 p.m. (Boggs 2-28) Laboratory: W 2:00-5:00 p.m. ( Boggs 1-72) Required Text: "Chemical Analysis: Modern Instrumentation, Methods and Techniques" F. Rouessac and A. Rouessac, Wiley & Sons, Chichester, 2001 Recommended: “Analytical Instrumentation: Performance, Characteristics and Quality” G. Currell, Wiley & Sons, Chichester, 2000
description
Syllabus for CHEM 3281 Fall Semester, 2003 Faculty: Dr. Richard F. Browner Boggs Chemistry & Biochemistry, Rm. B-20 (404) 894-4020 [email protected] Lab Coordinator: Dr. Robert Braga TAs: Lecture: MWF 12-110 p.m. (Boggs 2-28) - PowerPoint PPT Presentation
Transcript of Syllabus for CHEM 3281 Fall Semester, 2003 Faculty: Dr. Richard F. Browner

Syllabus for CHEM 3281Fall Semester, 2003 Faculty: Dr. Richard F. Browner
Boggs Chemistry & Biochemistry, Rm. B-20 (404) [email protected]
Lab Coordinator: Dr. Robert Braga
TAs:
Lecture: MWF 12-110 p.m. (Boggs 2-28) Laboratory: W 2:00-5:00 p.m. ( Boggs 1-72) Required Text: "Chemical Analysis: Modern Instrumentation, Methods and
Techniques" F. Rouessac and A. Rouessac, Wiley & Sons, Chichester, 2001
Recommended: “Analytical Instrumentation: Performance, Characteristics and Quality” G. Currell, Wiley & Sons, Chichester, 2000

Objectives:
Survey of analytical instrumentation and techniques specifically for engineering students
Goal: to provide engineering students with a fundamental understanding of chemical analysis and appropriate figures of merit (sensitivity, selectivity, limit-of-detection, etc.) enabling them to communicate effectively with analytical chemists and properly interpret analytical results presented to them.
Lecture topics/readings provide the student with the theoretical basis for each week’s experiments.
The laboratory will provide the student the opportunity to become acquainted with a particular laboratory instrument and use it to perform a specific analysis.
The course grade will equally weight the student’s performance in lab and lecture.*
Final grades will be given based on the following scale: A (100 – 80%)B (79 – 70%)C (69-60%)D (59-50%)F (below 50%)
There will be two (2) one-hour Exams and a Final Comprehensive Exam, covering all the course lecture material (see Calendar). Each one-hour exam will be worth 15%, and the final exam will be worth 20%.
As the final exam is comprehensive, your grade on the final exam, if it is higher than your average course grade, including one-hour exams and labs., will determine your overall final grade.
Objectives (cont’d):
* To pass the course as a whole, a passing grade (i.e >50%) is required in both lab and lecture.

Lectures will be devoted to both theoretical and practical aspects of the analytical procedures encountered in the laboratory. Lecture topics, exam dates, and suggested readings are available on the WebCT site for this course.
Attendance at laboratory is required of all students. Students must be on time for each lab meeting since the laboratories are tightly scheduled and there is very little free time available. The lab will not be open at hours other than those scheduled. Students may not under any circumstances work in the laboratory without supervision.
Wearing safety eyewear in the laboratory is absolutely mandatory! You will be asked to leave the lab and obtain safety eyewear if you are found without it. There will be no exceptions to this rule.
Each student is required to keep and maintain the equipment in working order. Instructions for each laboratory experiment are available on-line under WebCT.
Each student is required to maintain a laboratory notebook. The notebook must have a sewn-in binding with the ability to make a carbon copy of each page. A carbon copy of the notes and data you obtained must be turned into the TA at the completion of each lab experiment.
General Information and Policies:

Initial Tasks:
Prior to beginning laboratory work each student must:
Sign and date two copies of the Safety Notes page, retaining one copy for your records.
Maintain a $50 balance on your Buzz Card for replacement of lost or broken lab equipment.
Purchase a laboratory notebook (with carbon copy pages) and safety goggles.
Lab begins this week with Experiment #1.

This is your eye!

This is your eye after attack by caustic.

This is your eye after attack by acid.

This is your eye after attack by foreign objects.
Is it worth the risk?

What you can expect from Experiment #1?

Pellet # Black1 5.47302 5.68813 5.51884 5.61045 5.28346 6.13587 6.02428 5.28079 4.4559
10 5.554811 5.6031
Max 6.1358Mean 5.5117Min 4.4559S.D. 0.4387
What conclusions can be drawn?
RepeatedMeasurement
5.68815.68805.68835.68845.6882
Mean = 5.6882S.D. = 0.0002
?

Rejecting Outliers - The Q-test
Y1
d
range
Discard outlier if and only if Qcalc > Qcrit. Q-test may be used to reject only one data point per set.
Qcalc = d/range Critical Values of Q

Measurement Precision vs.Sampling Variance
Pellet#
White
1 5.93402 5.60963 5.88754 5.40405 5.41876 5.73577 5.40658 5.40279 5.367010 5.585311 5.8508
Max 5.9340Mean 5.6002Min 5.3670S.D. 0.2186
RepeatedMeasurement
5.60965.60925.60975.60995.6094
Mean = 5.6096S.D. = 0.0003
What conclusions can be drawn?

Y1
Are the two sets of data significantly different?
Y1
The null hypothesis is disproved when tcalc > tcrit. There exists a significant difference
between the two data sets. When tcalc < tcrit the null hypothesis cannot be rejected and no significant difference between the two sets exists.
Hypothesis testing

Testing the Null Hypothesis
Student’s t test
The null hypothesis is disproved only when
tcalc > tcrit
and the alternate hypothesis is accepted.
Critical Values of t
tolerateaccept reject

Note: The overall variance of an analysis is a function of the precision of the measurement and the variability of the sample.

Figures of Merit for Analytical Methods
Precision - absolute or relative standard deviation, variance, coefficient of variation
Accuracy (or bias) – absolute or relative error
Sensitivity – calibration or analytical sensitivity
Detection limit – limit of detection, limit of quantitation
Concentration range – linear dynamic range
Selectivity – coefficient of selectivity

Precision vs. Accuracy
Low accuracy High accuracy
Low precision
High precision
Accuracy
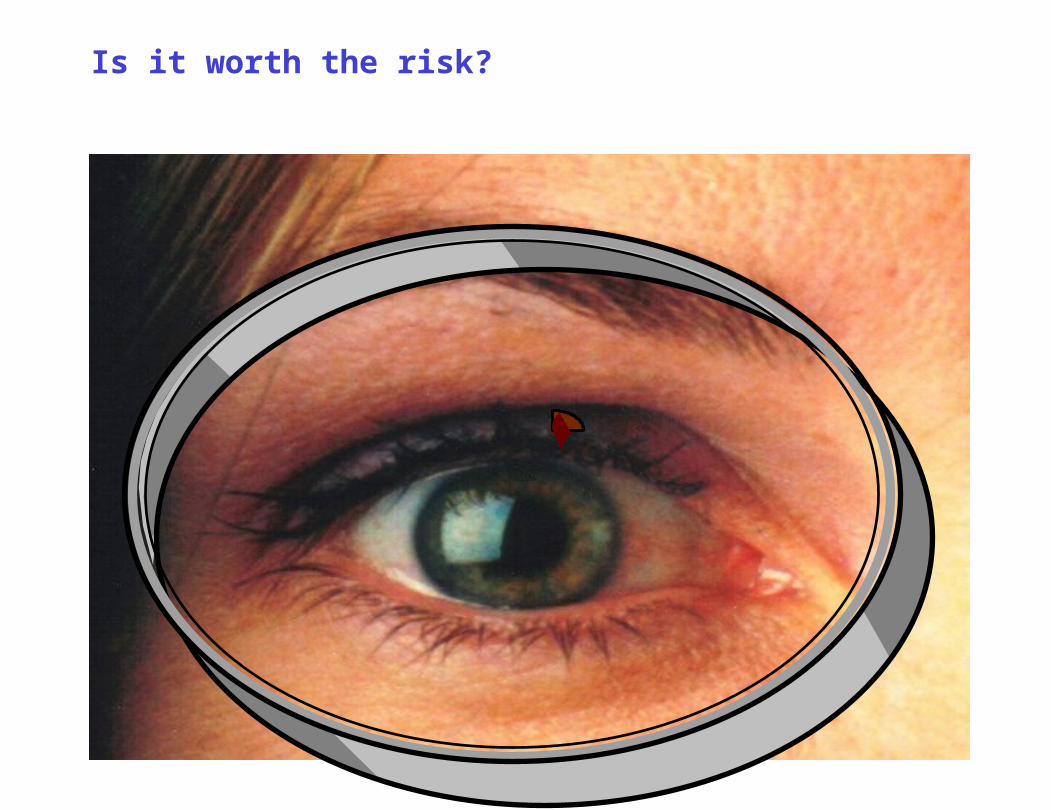
Error – difference between your answer and the “true” one.
absolute error = observed value – true value
relative error = 100 * absolute error/true value
Types of Error:
Systematic – all measurements deviate from the true value by the same magnitude and direction indicating a problem with the method
Random – random variations in measurement that can be treated statistically
Blunders - human error in performing method that prevent acquisition of reliable measurement


What do you do when you don’t know the true value?
Precision establishes repeatability of measurement, not accuracy

Sensitivity
R = mX + b + residual
sensitivity = slope

Detection

Concentration Range
Linear dynamic range = # orders of magnitude in concentration that response is linear

Selectivity
For a sample containing an analyte A as well as potential interfering species B and C, the instrument signal, S, will be:
S = mACA + mBCB + mCCC + Sblank
The selectivity coefficient for A w/r B is:
kB,A = mB/mA
Thus, B interferes when mB is > 0
When selectivity coefficients are known for interferences in a sample matrix, the concentration of the unknown can still be determined using the following equation:
S = mA (CA + kB,ACB + kC,ACC) + Sblank
Note: if the presence of C suppresses the value of mA, the sign of kC,A will be negative.


![[CHEM] Chem Nomenclature](https://static.fdocuments.us/doc/165x107/577dabac1a28ab223f8ccaec/chem-chem-nomenclature.jpg)