
Sybcom Business Economics
244
2042 S.Y.B.Com. BUSINESS ECONOMICS - II (w.e.f. academic year 2014-15 at IDOL)
Transcript of Sybcom Business Economics

2042
S.Y.B.Com.
BUSINESS ECONOMICS - II
(w.e.f. academic year 2014-15 at IDOL)

© UNIVERSITY OF MUMBAI
ipin EnterprisesTantia Jogani Industrial Estate, Unit No. 2,Ground Floor, Sitaram Mill Compound,J.R. Boricha Marg, Mumbai - 400 011
Published by : Professor cum Director
Institute of Distance and Open Learning ,
University of Mumbai,
Vidyanagari, Mumbai - 400 098.
DTP Composed : Ashwini ArtsGurukripa Chawl, M.C. Chagla Marg, Bamanwada,Vile Parle (E), Mumbai - 400 099.
Printed by :
August 2014, S.Y.B.Com., Business Economics - II
Programme and Course Co-ordinator : Ms. Rajashri Pandit
Asst. Prof-cum-Asst. Director, IDOL,University of Mumbai
Course Writer : Dr. K.L.N. SastryChetana's H.S. College of Commerce & Eco.Bandra (E), Mumbai - 400051
: Prof. Krishan NandelaDr. T.K. Tope Arts & Commerce College,Parel, Mumbai - 400012
: Dr. Vijay N. GummaPES's Bhausaheb Nene College of Arts,Science and Commerce,Pen, Raigad - 402107
Dr. Rajan Welukar Prin. Dr. Naresh ChandraVice Chancellor, Pro-Vice Chancellor,University of Mumbai University of Mumbai Dr. Dhaneswar Harichandan Professor-Cum-Director IDOL, University of Mumbai
CONTENTS
Unit No. Title Page No.
Module 1 :
1. Macro Economics : Theory of Income and Employment 1
2. Business Cycles 13
3. Theory of Multiplier 25
Module 2 :
4. Monetory Economics 39
5. Demand for Money 47
6. Inflation 61
7. Philips Curve 79
Module 3 :
8. Banking and Integration of Product and Money Markets 93
9. Monetary Policy - Objectives and Instruments 103
10. Fiscal Policy - Instruments and Objectives 119
11. IS & LM Framework 135
Module 4 :
12. Basic Issues in Economic Development 149
13. Inclusive Growth and Human Development in India 163
Module 5 :
14. Agriculture, Industry and Services Sector 180
15. India's Industrial Economy 195
16. Competition Act 2002 and Service Sector in the
Indian Economy 207
Module 6 :
17. Banking and Monetary Policy Since 1991 219
18. RBI's Monetary Policy 231
I
S.Y.B.ComBusiness Economics II
(w.e.f. academic year 2014-15 at IDOL)
SECTION - I
Macroeconomics : Theory and Policy
Objectives :
This course is designed to present an overview ofmacroeconomic issues and introduces preliminary models for thedetermination of output, employment, interest rates, and inflation.Monetary and fiscal policies are discussed to illustrate policyapplication of macroeconomic theory.
Module 1 Macroeconomics : Theory of Income & Employment :
Circular Flow of Income : Closed (two and three sectormodels) and Open Economy Models - Trade Cycles : Features andPhases - Concept of Aggregate Demand - Keynes’ Theory ofIncome Determination - Theory of Multiplier - Acceleration Principle- Super - multiplier.
Module 2 Monetary Economics :
Supply of Money : Concept, Constituents and Determinantsof Money Supply - Velocity of Circulation of Money : Meaning andFactors Determining - Demand for Money : Keynes’ Theory ofDemand for Money - Liquidity Preference Theory of Rate of Interest- Inflation : Concept and Rate of Inflation - Demand Pull and CostPush Inflation - Phillips Curve - Causes, Effects and Measures toControl Inflation.
Module 3 Banking and Integration of Product and MoneyMarket Equilibrium :
Commercial Banking : Assets and Liabilities of a CommercialBank - Tradeoff between Liquidity and Profitability - MoneyMultiplier - Money Policy : Objectives and Instruments - FiscalPolicy : Objectives and Instruments - IS-LM Model : Framework,Impact of Fiscal and Monetary Policy Changes.

II
SECTION - II
Recent Issues of Indian Economy
Objectives :
This course is designed to present an overview of recentissues of Indian Economy. It provides a comprehensive anddescriptive analysis of developments in various sectors of theIndian economy, since the reforms period. It particularly focuses onrecent reform measures and its impact on national income growth,human development, agriculture, industry, services, banking andmonetary policy.
Module 4 Basic Issues in Economic Development :
New Economic Policy 1991 : Rationale and Key Changes -Trends in National Income and Per Capita Income - SectoralComposition of National Income and Occupational Structure -Inclusive Growth - Progress of Human Development Index in India(Post 1991) : Health, Gender Related Development and EconomicIndicators - Government Policy with respect to Education andHealth - Recent Trends in Employment - Problems ofUnemployment.
Module 5 Agriculture, Industry and Service Sectors :
Trends in Agricultural Production and Productivity - NewAgricultural Policy, 2000 and Recent Policy Measures - PublicDistribution System and Food Security - WTO and IndianAgriculture - Industrial Development since 1991 : Growth andDiversification - MRTP and Competition Act - ComprehensivePolicy Package for SSIs, 2000 and Recent Policy Measures -Service Sector : Growth & Performance since 1991.
Module 6 Banking and Monetary Policy Since 1991 :
Banking Sector Reforms since 1991 : Rationale andMeasures - Structure of Banking in India - Performance ofCommercial Banks - Developmental and Promotional Functions ofRBI - RBI’s Recent Measures of Money Supply - Inflation : Trendsand Causes - Recent Changes in Monetary Policy in India.

III
Reference :
1. Dornbusch, Fischer and Startz, Macroeconomics, McGraw Hill,11th Edition, 2010.
2. N. Gregory Mankiw, Macroeconomics, Worth Publishers, 7th
Edition, 2010.
3. Olivier Blanchard, Macroeconomics, Pearson Education, Inc.,5th edition, 2009.
4. Richard T. Froyen, Macroeconomics, Pearson Education Asia,2nd edition, 2005.
5. Andrew B Abel and Ben S. Bernanke, Macroeconomics,Pearson Education, Inc., 7th edition, 2011.
6. Errol D’Souza, Macroeconomics, Pearson Education, 2009.
7. Dwivedi D. N., Macroeconomics : Theory and Policy, TataMcGraw.
8. Misra S. K. and Puri V. K. Indian Economy, Himalaya Publishinghouse, 29th Edition, 2011, PP. 5-7, 20-26, 164-169, 189-198,240, 241-246, 250-252, 34-327, 355-356, 378-383, 426-429,447-451, 573-576, 591-595, 598-608, 785-793, 797-799.
9. Datt Ruddar and Sundharam K. P. M, Indian Economy, S.Chand Publication, 58th Edition, 2008, PP. 3-13, 32-7, 66-79,83-87, 231-241, 298-299, 385-387, 472-479, 498-505, 614-616,665-671, 792-795, 827-833, 835-843, 885, 887-893.
10.Shukla M. B. Indian Economy, Taxman Publisher, 2012.
11.Deepashree, Indian Economy, Ane Books Pvt. Ltd.

1
1
Module 1
MACRO ECONOMICS: THEORY OFINCOME AND EMPLOYMENT
Unit Structure :
1.0 Objectives
1.1 Meaning
1.2 Circular flow of income
1.3 Circular Flow of Income and Expenditure in a Two –Sector Economy Model
1.4 Circular Flow of Money in a Two Sector Economy withSavings and Investment
1.5 Circular Flow of Income in a Three Sector Economy
1.6 Circular Flow of Money with the Foreign Sector ORCircular Flow of Money in Four Sector Open Economy
1.7 Importance of Circular Flow of Income
1.8 Summary
1.9 Questions
1.0 OBJECTIVES
To understand the process of income generation in aneconomy.
1.1 MEANING
The circular flow of money refers to the process wherebymoney payments and receipts of an economy flow in a circularmanner continuously over a period of time. The variouscomponents of money payments and receipts are saving,investment, taxation, loans, government purchases, exports,imports, etc. These are shown on diagram in the form of currentand cross-current in such a manner that the total money paymentsequals the total money receipts in the economy.

2
1.2 CIRCULAR FLOW OF INCOME
The modern economy is a monetary economy, where moneyis used in the process of exchange. The modern economyperforms economic activities such as production, exchange,consumption and investment. In order to carry out these economicactivities people are involved in buying and selling of goods andservices. The transactions take place between different sectors ofthe economy. The process of production and exchange generatestwo kinds of flows.
1. Product or real flow, that is the flow of goods and services, and
2. Money flow.
Product and money flow in opposite direction in a circularway. The product flow consists of a) factor flow, that is flow of factorservices and b) goods flow that is flow of goods and services. In amonetized economy the flow of factor services generates moneyflows in the form of factor payments which take the form of moneyflows. The factor payments and expenditure on consumer goodsand services take the form of expenditure flow. Expenditure flow isin the form of money flow. Both income and expenditure flow in acircular manner in opposite direction. The entire economic systemcan therefore be viewed as circular flows of income andexpenditure. The magnitude of these flows determines the size ofnational income. We can explain how these flows are generatedand how they make the system work.
The economists, however use simplified models to explainthe circular flow of income and expenditure dividing the economyinto four sectors namely, I) Household sector, II) Business or Firmssector , III) Government sector, and IV) Foreign sector. Thesesectors are combined to make the following three models for thepurpose of showing the circular flow of income.
I) Two- sector model including the household and businesssectors;
II) Three- sector model including the household, business andgovernment sectors; and
III) Four- sector model including the household, business,government and the foreign sectors.
3
1.3 CIRCULAR FLOW OF INCOME ANDEXPENDITURE IN A TWO – SECTOR ECONOMYMODEL
We begin with a simple hypothetical economy where thereare only two – sectors, the household and business firms whichrepresent a closed economy and there is no government and noforeign trade. The household sector owns all the factors ofproduction that is land, labour, capital and enterprise. This sectorreceives income in the form of rent, wages, interest and profit, byselling the services of these factors to the business sector. Thebusiness sector consists of producers who produce goods and sellthem to the household sector. The household sector consists ofconsumers who buy goods produced by the business sector.
Thus in the first instance, money flows in the form of suchincome payments as rent, wages, interest and profits from thebusiness sector to the household sector when the former buys theservices of the factors of production to produce goods. Money soreceived is, in turn, spent by the household sector to buy goodsproduced by the business sector. In this way money flows in acircular manner form the business sector to the household sectorand from the household sector to the business sector in theeconomy.
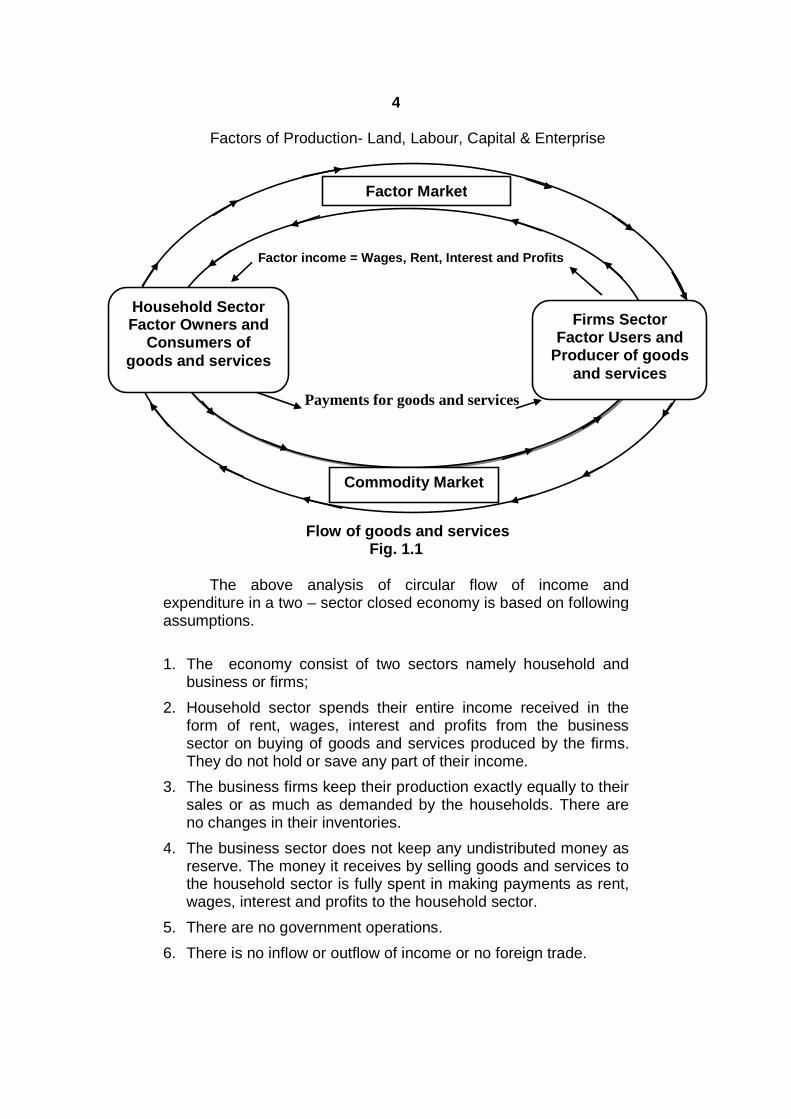
The circular flow in a two sector economy is depicted in Fig.1.1 where the flow of money as income payments from thebusiness sector to the household sector is shown in the form of anarrow in the upper portion of the diagram. On the other hand, theflow of money as consumption expenditure on the purchase ofgoods and services by the household sector is shown to go thebusiness sector by an arrow in the lower portion of the diagram. Aslong as income payments by the business sector for factor servicesare returned by the household sector to purchase goods, thecircular flow of income payments and consumption expendituretends to continue indefinitely. Production equals sales or supplyequals demand, and the economy will continue to operate at thislevel in a circular flow of money.
4
Factors of Production- Land, Labour, Capital & Enterprise
Flow of goods and servicesFig. 1.1
The above analysis of circular flow of income andexpenditure in a two – sector closed economy is based on followingassumptions.
1. The economy consist of two sectors namely household andbusiness or firms;
2. Household sector spends their entire income received in theform of rent, wages, interest and profits from the businesssector on buying of goods and services produced by the firms.They do not hold or save any part of their income.
3. The business firms keep their production exactly equally to theirsales or as much as demanded by the households. There areno changes in their inventories.
4. The business sector does not keep any undistributed money asreserve. The money it receives by selling goods and services tothe household sector is fully spent in making payments as rent,wages, interest and profits to the household sector.
5. There are no government operations.
6. There is no inflow or outflow of income or no foreign trade.
Factor income = Wages, Rent, Interest and Profits
Payments for goods and services
Household SectorFactor Owners and
Consumers ofgoods and services
Firms SectorFactor Users and
Producer of goodsand services
Factor Market
Commodity Market
5
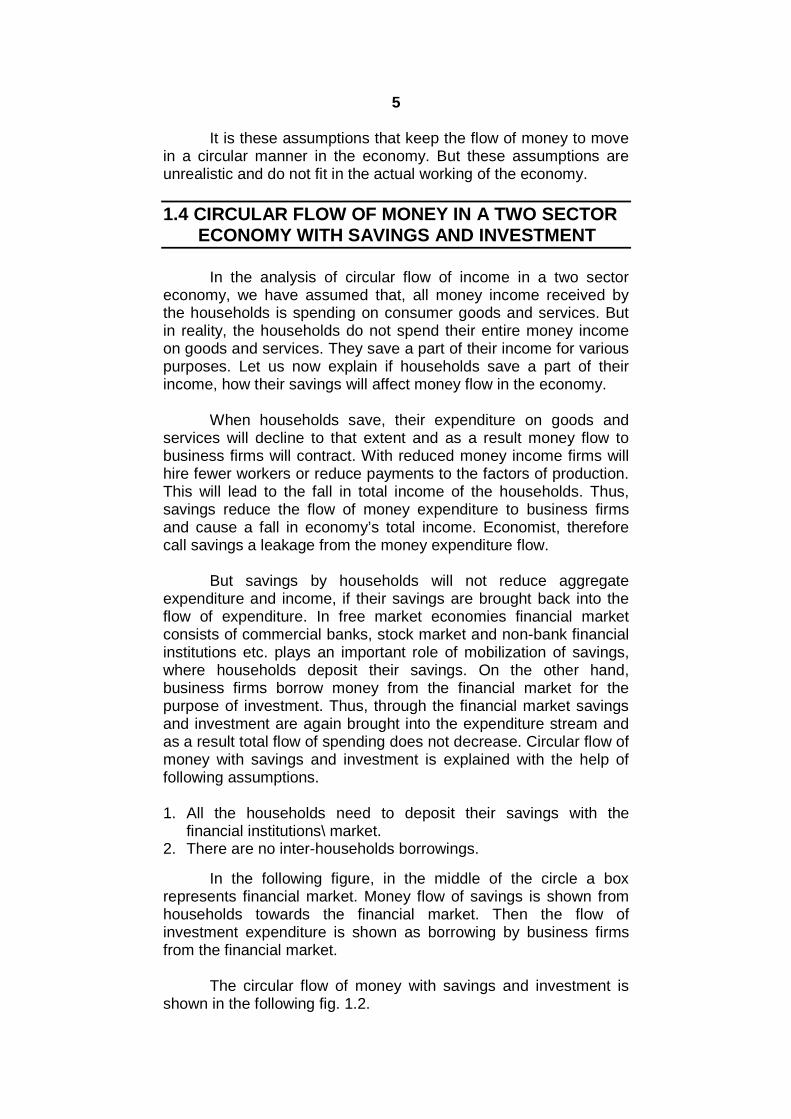
It is these assumptions that keep the flow of money to movein a circular manner in the economy. But these assumptions areunrealistic and do not fit in the actual working of the economy.
1.4 CIRCULAR FLOW OF MONEY IN A TWO SECTORECONOMY WITH SAVINGS AND INVESTMENT
In the analysis of circular flow of income in a two sectoreconomy, we have assumed that, all money income received bythe households is spending on consumer goods and services. Butin reality, the households do not spend their entire money incomeon goods and services. They save a part of their income for variouspurposes. Let us now explain if households save a part of theirincome, how their savings will affect money flow in the economy.
When households save, their expenditure on goods andservices will decline to that extent and as a result money flow tobusiness firms will contract. With reduced money income firms willhire fewer workers or reduce payments to the factors of production.This will lead to the fall in total income of the households. Thus,savings reduce the flow of money expenditure to business firmsand cause a fall in economy’s total income. Economist, thereforecall savings a leakage from the money expenditure flow.
But savings by households will not reduce aggregateexpenditure and income, if their savings are brought back into theflow of expenditure. In free market economies financial marketconsists of commercial banks, stock market and non-bank financialinstitutions etc. plays an important role of mobilization of savings,where households deposit their savings. On the other hand,business firms borrow money from the financial market for thepurpose of investment. Thus, through the financial market savingsand investment are again brought into the expenditure stream andas a result total flow of spending does not decrease. Circular flow ofmoney with savings and investment is explained with the help offollowing assumptions.
1. All the households need to deposit their savings with thefinancial institutions\ market.
2. There are no inter-households borrowings.
In the following figure, in the middle of the circle a boxrepresents financial market. Money flow of savings is shown fromhouseholds towards the financial market. Then the flow ofinvestment expenditure is shown as borrowing by business firmsfrom the financial market.
The circular flow of money with savings and investment isshown in the following fig. 1.2.

6
Factors of production- Land, Labour, Capital & Entrepreneurship
Flow of goods & servicesFig.1.2
The necessary condition for the constant flow of income issavings must be equal to investment. As mentioned above, savinga part of income is not spent on consumer goods and services. Inother words, saving is withdrawal of some money from the incomeflow. On the other hand, investment means some money is spenton buying new capital goods to expand production capacity. Inother words, investment is injection of some money in circular flowof income. But savings and investments in an economy need notnecessarily be equal.
If planned savings is more than planned investmentexpenditure, income, output and employment will fall and therefore,flow of money will decline. On the contrary, if planned investmentexpenditure is more than planned savings, income, output andemployment will rise and therefore, flow of money will increase.Thus, the economy will be in equilibrium if planned savings is equalto planned investment expenditure.
It is clear from the above analysis that, the flow of money willcontinue at a constant level only when the condition of equalitybetween planned savings and planned investment is satisfied.
Factor Incomes- Rent, Wages, Interest & Profit
Consumer Expenditure
Savings Investment
Payments for goods & services
Households Business Firms
Consumer Expenditure
7
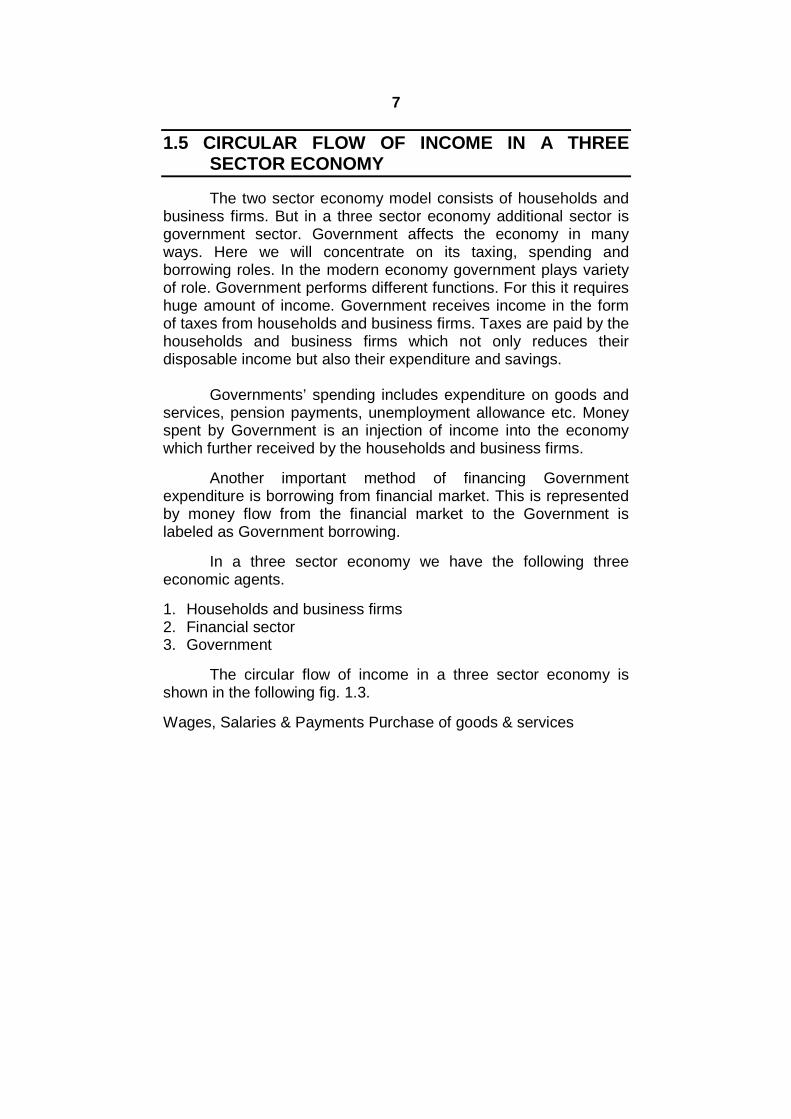
1.5 CIRCULAR FLOW OF INCOME IN A THREESECTOR ECONOMY
The two sector economy model consists of households andbusiness firms. But in a three sector economy additional sector isgovernment sector. Government affects the economy in manyways. Here we will concentrate on its taxing, spending andborrowing roles. In the modern economy government plays varietyof role. Government performs different functions. For this it requireshuge amount of income. Government receives income in the formof taxes from households and business firms. Taxes are paid by thehouseholds and business firms which not only reduces theirdisposable income but also their expenditure and savings.
Governments’ spending includes expenditure on goods andservices, pension payments, unemployment allowance etc. Moneyspent by Government is an injection of income into the economywhich further received by the households and business firms.
Another important method of financing Governmentexpenditure is borrowing from financial market. This is representedby money flow from the financial market to the Government islabeled as Government borrowing.
In a three sector economy we have the following threeeconomic agents.
1. Households and business firms2. Financial sector3. Government
The circular flow of income in a three sector economy isshown in the following fig. 1.3.
Wages, Salaries & Payments Purchase of goods & services

8
Taxes
TaxesFig. 1.3
The above figure clearly shows that, income received by theGovernment in the form of taxes from households and businessfirms is used for spending in the form of wages, salaries,allowances, pension, subsidies and purchases of goods andservices from them. Money spent by the Government is received bythe households and business firms.
Thus, the leakages (withdrawal) in the form of savings andtaxes arise in the circular flow of income. The savings and taxesare further get injected back into the circular flow of income in theform of investment and Government spending. When theseleakages (withdrawal) are equal to injections in the form ofinvestment and Government spending the flow of money in theeconomy operates smoothly.
The inclusion of the Government sector significantly affectsthe overall economic situation. Total expenditure flow in theeconomy is the sum of consumption expenditure (C), investmentexpenditure (I), and Government expenditure (G).
Thus, it is symbolically expressed as,
Total expenditure (E) = C + I + G
Factors of Production
Fl
Factor Income (W+R+I+P)
Flow of good
Flow of goods & services
S I
Payments for goods & services
Business FirmHouseholds
Government
Government
Financial Market
9
Total income (Y) received is allocated to consumption (C),savings (S) and taxes (T).
Thus, symbolically expressed as,
Y = C + S + T
Since expenditure (E) made must be equal to the incomereceived (Y) from equation above we have
C + I + G = C + S + T
Since C occurs on both sides of the equation and willtherefore be cancelled out, we have
I + G = S + TBy rearranging we obtain
G – T = S – I
This equation is very significant because it shows whatwould be the consequences if Government budget is not balanced.If Government expenditure (G) is greater than the tax (T), theGovernment will have a budget deficit. To finance the budgetdeficit, the Government will borrow from the financial market. Forthis purpose, then private investment by business firms must beless than the savings of the households. Thus Governmentborrowing reduces private investment in the economy.
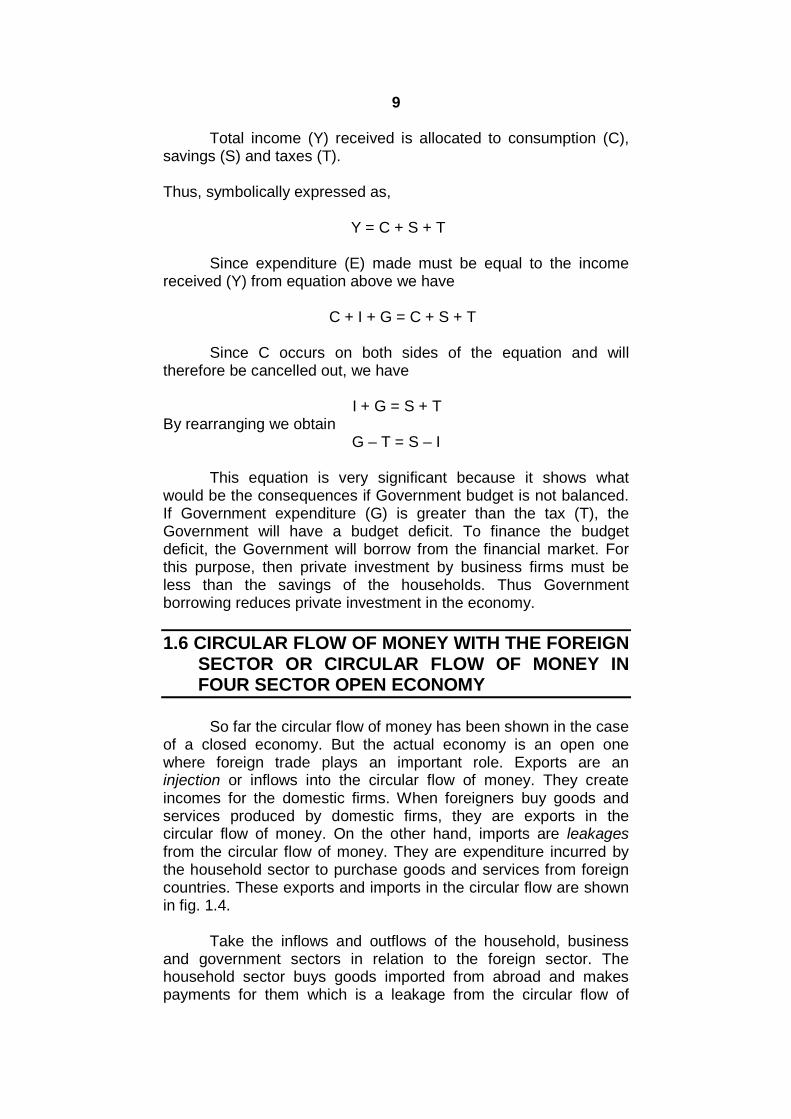
1.6 CIRCULAR FLOW OF MONEY WITH THE FOREIGNSECTOR OR CIRCULAR FLOW OF MONEY INFOUR SECTOR OPEN ECONOMY
So far the circular flow of money has been shown in the caseof a closed economy. But the actual economy is an open onewhere foreign trade plays an important role. Exports are aninjection or inflows into the circular flow of money. They createincomes for the domestic firms. When foreigners buy goods andservices produced by domestic firms, they are exports in thecircular flow of money. On the other hand, imports are leakagesfrom the circular flow of money. They are expenditure incurred bythe household sector to purchase goods and services from foreigncountries. These exports and imports in the circular flow are shownin fig. 1.4.
Take the inflows and outflows of the household, businessand government sectors in relation to the foreign sector. Thehousehold sector buys goods imported from abroad and makespayments for them which is a leakage from the circular flow of

10
money. The householders may receive transfer payments from theforeign sector for the services rendered by them in foreigncountries.
On the other hand, the business sector exports goods toforeign countries and its receipts are an injection in the circular flowof money. Similarly, there are many services rendered by thebusiness firms to foreign countries such as shipping, insurance,banking etc. for which they receive payments from abroad. Theyalso receive royalties, interest, dividends, profits, etc. for investmentmade in foreign countries. On the other hand, the business sectormakes payments to the foreign sector for imports of capital goods,machinery, raw materials, consumer goods and services fromabroad. These are the leakages from circular flow of money.
X – M (Exports - Imports)
X – MFig.1.4
Like the business sector, modern governments also exportand import of goods and services, and lend to and borrow fromforeign countries. For all exports of goods, the government receivespayments from abroad. Similarly, the government receivespayments from foreigners when they visit the country as touristsand for receiving education, etc. and also when the governmentprovides shipping, insurance and banking services to foreignersthrough the state-owned agencies. It also receives royalties,interests, dividends, etc. for investments made abroad. These areinjections into the circular flow of money. On the other hand, theleakages are payments made to foreigners for the purchase ofgoods and services.
F CA Taxation Govt. Spending O SavingsC NT SO UR MI PN Taxation Govt. Spending T InvestmentsC IO OM NE
Household Sector
Business Sector
WorldEconomy
FinancialSector
Government

11
Figure 1.4 shows the circular flow of money in four sectoropen economy with saving at the right hand and taxes and importsat the left hand shown as leakages from the circular flow on theupper side of the figure, and investment, and government purchase(spending) on the right hand side and exports as injections into thecircular flow, on the lower level left hand side of the figure. Further,imports, exports and transfer payments have been shown to arisefrom the three domestic sectors- the household, the business andthe government. These outflows and inflows pass through theforeign sector which is also called the ‘Balance of PaymentsSector.’
Thus Figure 1.4 shows the circular flow of money wherethere are inflows and outflows of money, receipts and paymentsamong the business sector, the household sector, the governmentsector, and the foreign sector in current s and cross- currents.
1.7 IMPORTANCE OF CIRCULAR FLOW OF INCOME
1. To understand the functioning of the economy - Money beingthe life blood of a modern economy, its circular flow gives aclear picture of the economy. We can know from its studywhether the economy is working smoothly of there is anydisturbance in its smooth functioning. The circular flow of moneyis important for studying the functioning of the economy and forhelping the government in formulating polity measures.
2. To understand the link between producers and consumers –The circular flow of money establishes a link between producersand consumers. It is through money that producers buy theservices of factors of production from the household sector andin turn household sector purchases goods and sector from theproducers.
3. To find out the leakages in circular flow of income – Leakagesor injections in the circular flow of money disturb the smoothfunction of the economy. For example, saving is a leakage outof the expenditure stream. If saving increases, this contracts thecircular flow of money. This tends to reduce employment,income and prices thereby leading a deflationary process in theeconomy. On the other hand, consumption expenditure andinvestment are injections in the circular flow of money whichhelp to increase employment, income, output and prices andthus lead to inflationary tendencies.
4. Highlights the importance of monetary and fiscal policies – Thestudy of the circular flow of money also highlights theimportance of monetary policy in bringing about the equalitybetween savings and investment through the capital market.Similarly, it also points out the importance of fiscal policy in

12
bringing about the equality between saving plus taxes andinvestment plus government expenditure.
To conclude, the circular flow of money possesses muchtheoretical and practical significance in an economy.
1.8 SUMMARY
1. The circular flow of money refers to the process whereby moneypayments and receipts of an economy flow in a circular mannercontinuously over a period of time.
2. In the Two sector economy money flows in a circular mannerform the business sector to the household sector and from thehousehold sector to the business sector in the economy.
3. In a three sector economy we have the following threeeconomic agents, Households and business firm, Financialsector, and Government.
4. The circular flow of money where there are inflows and outflowsof money, receipts and payments among the business sector,the household sector, the government sector, and the foreignsector in current s and cross- currents.
1.9 QUESTIONS
1. Explain the process of income generation in a two sectoreconomy.
2. Explain how income is generated in an open economy.
13
2
BUSINESS CYCLES
Unit Structure :
2.0 Objectives
2.1 Introduction
2.2 Features of Business Cycles
2.3 Phases of Business Cycles
2.4 Keynesian Theory of Income Determination
2.5 Summary
2.6 Questions
2.0 OBJECTIVES
To understand the meaning, different features of a businesscycle.
To understand the different phases of a trade cycle.
To understand the determination of the equilibrium of income.
2.1 INTRODUCTION
Almost all economies of the world have suffered fromeconomic fluctuations at different stages of their economic growth.An important feature of a capitalist economy is the existence ofbusiness cycle. The business cycle is associated with fluctuationsin macro economic activity. It may be noted that these fluctuationsas ‘cycle’ are periodic and occur regularly. Cyclical fluctuations arewave like movements found in the aggregate economic activity of anation. A business cycle is characterized by recurring phases ofexpansion and contraction in economic activity in terms ofemployment, output and income.
The period of high income, output and employment has beencalled the period of expansion, upswing or prosperity, and theperiod of low income, output and employment has been called theperiod of contraction, recession, downswing or depression. Thesealtering periods of expansion and contraction in economic activity
14
have been called business cycle. They are also known as tradecycle. Trade cycle has been defined by different economist indifferent ways.
According to J.M. Keynes, “A trade cycle is composed ofperiods of good trade characterized by rising prices and lowunemployment percentages with periods of bad trade characterizedby falling prices and high unemployment percentages.”
In the words of Haberler, “The business cycle may bedefined as an alternation of periods of prosperity and depression ofgood and bad trade.”
According to Schumpeter, “the business cycle representswave like fluctuations in level of business activity from theequilibrium.”
According to Fredric Benham, “A trade cycle may be definedrather badly, as a period of prosperity followed by a period ofdepression. It is not surprising that economic process should beirregular, trade being good at some time and bad at others.”
2.2 FEATURES OF BUSINESS CYCLES
Though different business cycles differ in duration andintensity they have some common features which can explainbelow.
1. A business cycle is a wave like movement in macro economicactivity like income, output and employment which showsupward and downward trend in the economy.
2. Business cycles are recurrent and have been occurringperiodically. They do not show some regularity.
3. They have some distinct phases such as prosperity, recession,depression and recovery.
4. The duration of business cycles may vary from minimum of twoyears to a maximum of ten to twelve years.
5. Business cycles are synchronic. That is they do not causechanges in any single industry or sector but are of all embracingcharacter. For example, depression or contraction occurssimultaneously in all industries or sectors of the economy.Recession passes from one industry to another and chainreaction continues till the whole economy is in the grip ofrecession. Similar process is at work in the expansion phase orprosperity.

15
6. There are different types of business cycles. Some are minorand others are major. Minor cycles operate for a period of threeto four years and major business cycles operate for a period offour to eight years. Though business cycles differ in timing, theyhave a common pattern of sequential phases.
7. Expansion and contraction phases of business cycle arecumulative in effect.
8. It has been observed that fluctuations occur not only in level ofproduction but also simultaneously in other variables such asemployment, investment, consumption, rate of interest and pricelevel.
9. Another important feature of business cycles is that downswingis more sudden than the changes in upswing.
10. An important feature of business cycles is profits fluctuate morethan any other type of income. The occurrence of businesscycles causes a lot of uncertainty for business and makes itdifficult to forecast the economic conditions.
11. Lastly, business cycles are international in character. That isonce started in one country they spread to other countriesthrough trade relations between.
2.3 PHASES OF BUSINESS CYCLES
Business cycles have shown distinct phases, the study ofwhich is useful to understand their fundamental causes. Generally,a business cycle has four phases.
1. Prosperity (Expansion, Boom, or Upswing)2. Recession (upper turning point)3. Depression (Contraction or Downswing) and4. Revival or Recovery (lower turning point)
The four phases of business cycle are shown in the followingfigure. It starts from trough or lower turning point when the level ofeconomic activity is at the lowest level. Then it passes throughrecovery and prosperity phase, but due to the causes explainedbelow the expansion cannot continue indefinitely, and afterreaching peak, recession and depression or downswing starts. Thedownswing continues till the lowest turning point and reaches totrough. It is important to note that no phase has any definite timeperiod or time interval. Similarly any two business cycles are notthe same.
The prosperity starts at trough and ends at peak. Therecession starts at peak and ends at trough. One complete periodof such movement is called as a trade cycle.

16
Fig. 2.1
Four phase of trade cycles are briefly explained as follows.
1. Prosperity – Prosperity is ‘a stage in which the money income,consumption, production and level of employment are high or risingand there are no idle resources or unemployed workers.’
This stage is characterized by increased production, highcapital investment, expansion of bank credit, high prices, highprofit, a high rate of interest, full employment income, effectivedemand, inflation MEC, profits, standard of living, full employmentof resources, and overall business optimism etc.
The prosperity comes to an end when forces become weakand therefore, bottlenecks start to appear at the peak of prosperity.Due to high profit, inflation and over optimism make theentrepreneurs to invest more and more. But because of shortage ofraw material and scarcity of factors of production prices of goodsand services rises. As a result there is fall in demand and profit,business calculations go wrong. Thus their over optimism isreplaced by over pessimism. Thus prosperity digs its own grave.
2. Recession- When the phase of prosperity ends, recessionstarts. Recession is an upper turning point. This is a phase ofcontraction or slowing down of economic activities. Recession isgenerally of a short duration.
After boom, demand falls, production becomes excess andinvestment results in over investment. Finally, it leads to recession.
During this phase profit, investment and share prices fallssignificantly, Because of lack of investment the demand for bankcredit, rate of interest, income employment, and demand for goodsand services falls.
If recession continues for a long period of time then finally, itreaches to the phase of depression.
17
3. Depression – It is a period in which business or economicactivity in a country is far below the normal. Depression is ‘a stagein which the money income, consumption, production and level ofemployment falls, idle resources and unemployment increases.’
It is characterized by a sharp reduction of production, massunemployment, low employment, falling prices, falling profits, lowwages, and contraction of credit, fall in aggregate income, effectivedemand, MEC, a high rate of business failure and atmosphere of allround pessimism etc. The depression may be of a short duration ormay continue for a long period of time.
After a period of time, moderate increase in the demand forgoods and services helps to increase in investment, production,employment, income and effective demand. Finally, it leads torecovery.
4. Recovery – Depression phase is generally followed by recovery.Various exogenous and endogenous factors are responsible forreviving the economy. When the economy enters the phase ofrecovery, economic activity once again gathers momentum in termsof income, output, employment, investment and effective demand.But the growth rate lies below the steady growth path.
Thus, a recovery phase starts which is called the lowerturning point. It is characterized by improvement in demand forcapital stock, rise in demand for consumption good, rise in pricesand profits, improvement in the expectations of the entrepreneurs,slowing rising MEC, slowly increasing investment, rise inemployment, output and income, rise in bank credit, stock marketbecomes more sensitive and revival slowly emerges etc.
The phase of recovery once started, it slowly takes theeconomy on the path of expansion and prosperity. With this thecycle repeats itself.
Check your Progress :1. What is a business cycle? What are its different features?2. What is a business cycle? Explain the different phases of a trade
cycle.

18
2.4 KEYNESIAN THEORY OF INCOMEDETERMINATION
The concept of aggregate demand has propounded by J.M.Keynes in his famous book, ‘The General Theory of Employment,Interest and Money’ published in 1936. The analysis of Keynesiantheory of effective demand is the analysis of aggregate demand.
In the Keynesian model of income determination he hasassumed that, price level in the economy remains unchanged.Therefore, in the Keynesian theory which dealt with the short run,the level of income of the country will change as a result of changesin the level of employment.
The higher the level of employment, the higher will be thelevel of income. As the level of employment is determined byaggregate demand and aggregate supply, the level of income isalso determined by aggregate demand and aggregate supply.
We shall now explain how the equilibrium level of income isdetermined through the interaction of aggregate demand andaggregate supply and changes in the equilibrium level of incomeand employment.
Aggregate demand/ Equilibrium level of income in a Two –Sector Economy-
The two sector model includes only households and firms.An economy is said to be in equilibrium when the aggregatedemand is equal to the aggregate supply during a given period oftime. Let us study the aggregate demand and aggregate supply asfollows.
Aggregate demand (AD) –
Aggregate demand is the total demand of the community forall goods and services produced in the economy. In a two sectoreconomy, it comprises demand for consumer goods (C) andinvestment (capital) goods (I). Aggregate demand curve isrepresented by AD.
It is symbolically expressed as, AD = C+ IWhere C = consumption expenditure, I = Investment expenditure.
Aggregate demand is affected by many factors such as, thelevel of income, the rate of interest, the marginal efficiency ofcapital, the exchange rate, expected inflation, Govt. policy andbusiness expectations etc.

19
Consumption expenditure depends upon the level of incomewhich is symbolically expressed as,
C = f (Y).
It shows that consumption expenditure increases with increase inthe level of income. Consumption function is stated as,
C = a + b Y.
In consumption function, C = aggregate consumption expenditure;Y = total disposable income. Intercept a is a positive constant. Itdenotes the level of consumption at zero level of income. Theconsumption at zero level of income is called autonomousconsumption. In equation b is a positive constant. It denotes aconstant MPC = ΔC/ΔY. The MPC is less than one or unity but greater than zero, that is O < b >1.
The saving function is the counterpart of the consumptionfunction. It states that the relationship between income and saving.Therefore, saving is also the function of disposable income. That is,
S = f (Y)
Saving is that part of the residual income which is not spenton consumption. We know that, Y = C + S. Income is equal toconsumption plus saving. Saving function is stated in the form ofequation as,
S = Y – C
Saving is a function of income. At zero income, saving isnegative. As the level of income increases, savings also increases.Amount of saving depends upon marginal propensity to save.
Aggregate Supply (AS) –
As mentioned above, in the short run the level of nationalincome and employment in a free market economy depends uponthe equilibrium between aggregate demand and aggregate supply.Now we shall turn to explain the aggregate supply and the factorson which it depends.
The aggregate supply means, ‘the total money value of allthe goods and services produced in an economy in a year.’
There are two important components of aggregate supply.They are-
1. The supply or output of final consumer goods and services in ayear and
2. The output of capital goods / investment goods.

20
It is important to note that, aggregate supply is the samething as national product (National Output). The aggregate supplyof all goods in an economy depends upon factors like,- the stock ofcapital, the amount of labour used and the state of technology. Inthe short run the stock of capital and the state of technology remainconstant and therefore, output can be increased by increasing theamount of labour employed. Aggregate supply is symbolicallyexpressed as, Y = (N, K, and T)
Where Y is national output,K = is the constant amount of capital stock and
T = is the constant state of technology.N = is the amount of labour employed which is a variable
factor.
Equilibrium level of National Income –Now we shall explain how the equilibrium level of national
income is determined by the interaction of aggregate demand andaggregate supply with the help of following diagram.
Fig. 2.2
In the above diagram, C+I is the aggregate demand curveand 450 OZ line is the aggregate supply curve. These two curvesintersect each other at point ‘E’. At this equilibrium point aggregatedemand is equal to aggregate supply. At this equilibrium point theequilibrium level of national income is determined as OY.
Now national income cannot be in equilibrium at less thanOY level of income. Because at any other level aggregate supply isless than OY, aggregate demand is more than aggregate supplysince aggregate demand curve C+I lies above 450 line (AS curve).This excess demand will lead to decline in inventories of goodsbelow the desired level. This fall in inventories will induce the firm toexpand their output of goods and service (AS) till national incomelevel OY is reached.
On the contrary, the level of national income cannot be morethan OY because aggregate demand is less than aggregate supply.
21
This will lead to increase in inventories and will induce the firm tocut down production (to keep their inventories at the desired level)until the national income level OY is reached where AD (C+I) isequal to the value of AS. Thus, OY is the equilibrium level ofnational income.
Aggregate demand/ Equilibrium level of income in a Three– Sector Economy-
In a two sector economy we have explained how theequilibrium level of national income is determined by theconsumption function and autonomous investment expenditure. Ina three sector economy Government’s expenditure with all itseconomic activities plays an important role in the determination ofequilibrium level of national income. It is important to note that, themagnitude of Government expenditure on highways, public parks,education, and health services is governed by the promotion ofsocial welfare, employment and growth in the economy.
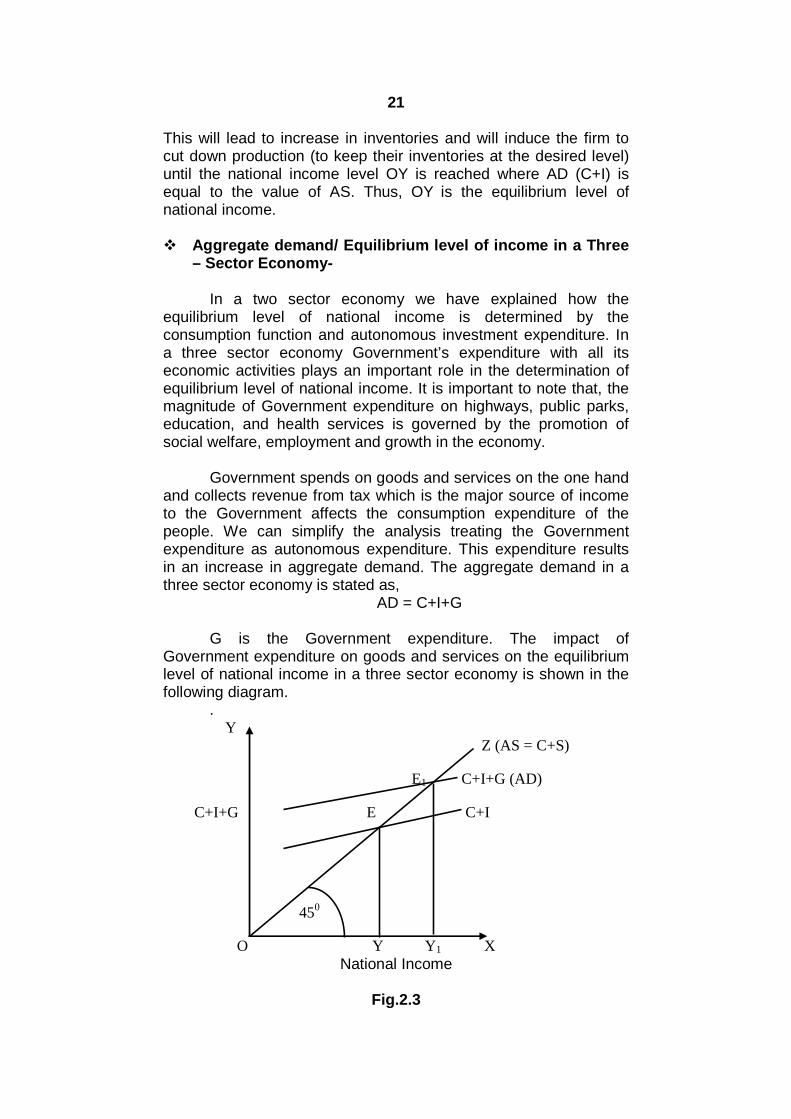
Government spends on goods and services on the one handand collects revenue from tax which is the major source of incometo the Government affects the consumption expenditure of thepeople. We can simplify the analysis treating the Governmentexpenditure as autonomous expenditure. This expenditure resultsin an increase in aggregate demand. The aggregate demand in athree sector economy is stated as,
AD = C+I+G
G is the Government expenditure. The impact ofGovernment expenditure on goods and services on the equilibriumlevel of national income in a three sector economy is shown in thefollowing diagram.
.Y
Z (AS = C+S)
E1 C+I+G (AD)
C+I+G E C+I
450
O Y Y1 XNational Income
Fig.2.3

22
In the above diagram C+I is the original aggregate demandcurve in a two sector economy. C+I+G is the new aggregatedemand curve in a three sector economy. C+I+G aggregatedemand curve intersect OZ aggregate supply curve at ‘E1’ point. Atthis point the equilibrium level of national income is OY1. It will beobserved form the above diagram that, at less than OY1 level ofnational income aggregate demand is more than aggregate supply.This implies decline in inventories of goods which will induce thefirm to increase the production to the level of OY1.
On the contrary, at the level of national income greater thanOY1, the aggregate demand is less than aggregate supply. Thisdeficiency of demand for goods will lead to increase in inventoriesand will induce the firm to cut down production till the nationalincome level OY1 is reached where AD (C+I+G) is equal to the AS.
Aggregate demand/ Equilibrium level of income in a Four –Sector Economy-
The analysis of the determination of equilibrium level ofnational income in two sector and three sector economy is limitedonly to a closed economy. But in reality no country can remainisolated from the rest of the world. Almost every economy has aforeign relation in respect of export, import, foreign investment,lending and borrowing which affect the level of national income.The exports (X) represent foreign demand and generate income forthe exporting country. On the other hand, imports (M) represent thedemand for foreign goods by the importing country and generateincome for the people of other countries. Therefore, nationalincome will depends upon the net earnings from foreign trade whichis expressed as net exports (NX). However, in incomedetermination exports and imports are considered as autonomous.
The increase in aggregate demand due to exports anddecrease in aggregate demand due to imports depends on the netexports. If the net exports are positive, there will be an increase inaggregate demand of a country which shows shifts the AD curveupward to the right. This increase in aggregate demand results inan increase in national income. On the other hand, if the netexports are negative, there will be decrease in aggregate demand(expenditure) shifting the AD curve downwards. This will reduce thenational income.
The aggregate demand or equilibrium level of nationalincome in an open economy is stated as, AD = C + I + G + NX
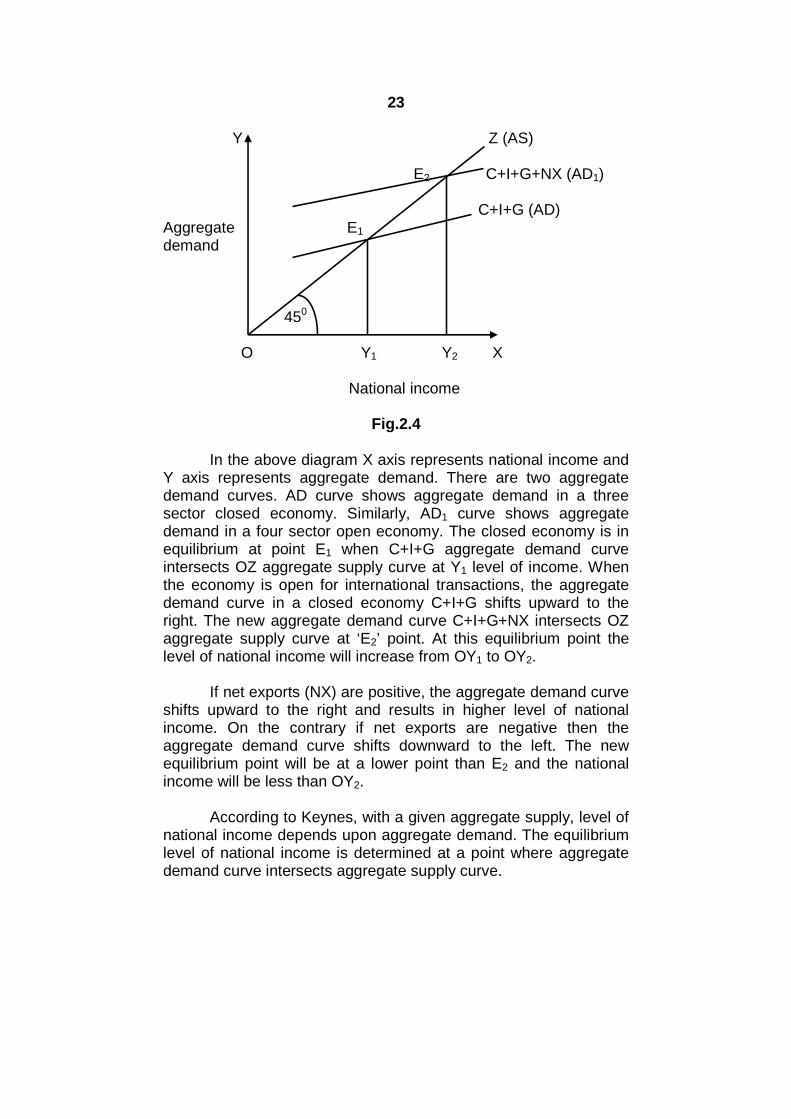
The determination of equilibrium level of national income in an openeconomy is graphically presented as follows.
23
Y Z (AS)
E2 C+I+G+NX (AD1)
C+I+G (AD)Aggregate E1
demand
450
O Y1 Y2 X
National income
Fig.2.4
In the above diagram X axis represents national income andY axis represents aggregate demand. There are two aggregatedemand curves. AD curve shows aggregate demand in a threesector closed economy. Similarly, AD1 curve shows aggregatedemand in a four sector open economy. The closed economy is inequilibrium at point E1 when C+I+G aggregate demand curveintersects OZ aggregate supply curve at Y1 level of income. Whenthe economy is open for international transactions, the aggregatedemand curve in a closed economy C+I+G shifts upward to theright. The new aggregate demand curve C+I+G+NX intersects OZaggregate supply curve at ‘E2’ point. At this equilibrium point thelevel of national income will increase from OY1 to OY2.
If net exports (NX) are positive, the aggregate demand curveshifts upward to the right and results in higher level of nationalincome. On the contrary if net exports are negative then theaggregate demand curve shifts downward to the left. The newequilibrium point will be at a lower point than E2 and the nationalincome will be less than OY2.
According to Keynes, with a given aggregate supply, level ofnational income depends upon aggregate demand. The equilibriumlevel of national income is determined at a point where aggregatedemand curve intersects aggregate supply curve.

24
2.5 SUMMARY
1. A business cycle is characterized by recurring phases ofexpansion and contraction in economic activity in terms ofemployment, output and income.
2. A business cycle has four phases:a) Prosperity (Expansion, Boom, or Upswing)b) Recession (upper turning point)c) Depression (Contraction or Downswing) andd) Revival or Recovery (lower turning point)
3. The analysis of the determination of equilibrium level of nationalincome in two sector and three sector economy is limited only toa closed economy. But in reality no country can remain isolatedfrom the rest of the world. Almost every economy has a foreignrelation in respect of export, import, foreign investment, lendingand borrowing which affect the level of national income.
4. According to Keynes, with a given aggregate supply, level ofnational income depends upon aggregate demand. Theequilibrium level of national income is determined at a pointwhere aggregate demand curve intersects aggregate supplycurve.
2.6 QUESTIONS
1) What is the equilibrium level of income? How is the incomedetermined?

25
3
THEORY OF MULTIPLIER
Unit Structure :
3.0 Objectives
3.1 Theory of multiplier
3.2 The Principle of Acceleration
3.3 Super Multiplier
3.4 Summary
3.5 Questions
3.0 OBJECTIVES
To understand the relationship between in the consumption,investment and the aggregate level of income.
To understand the fluctuations in the aggregate level of income.
3.1 THEORY OF MULTIPLIER
The theory of multiplier was first developed by Prof. R.F.Kahn in 1931. It explains the effects of initial increase in investmenton aggregate employment. Kahn’s multiplier was thus known as‘employment multiplier.’
J.M. Keynes used the concept of multiplier to analyze theeffects of change in investment on income via changes inconsumption expenditure. Thus this multiplier came to be known asthe investment multiplier. It may be defined as “the ratio of thechange in income to the change in investment.” It is symbolicallyexpressed as, K = ΔY/ ΔI.
Where K = Stands for Multiplier, ΔY = change in income and ΔI= change in investment.
In an economy, when there is a small increase ininvestment, there would be multiplier increase in national income.For example, if the investment is increased by Rs. 4 cro. and if as aresult, the national income increases by Rs. 20 cro. the value of ‘K’(multiplier) will be 5. In other words, investment multiplier points out

26
that, national income will rise much more than the initial increase ininvestment. A part of this additional income is spent onconsumption goods. Since, one man’s expenditure is anotherman’s income. The consumption expenditure of the people at thefirst round would become income of the people at the second roundand so on.
Graphical Presentation -The multiplier is depends upon the marginal propensity to
consume (MPC). If the MPC is higher, the size of multiplier wouldbe higher and vice versa. The concept of multiplier can beexplained with the help of following diagram.
YConsumptionExpenditure, NSavings &Investment E2 C+I1
} ΔIC+I
E1
450 ΔY
O Income Y1 Y2 X
Fig. 3.1
In the above diagram, OX axis represents income and OYaxis represents investment, consumption expenditure and savings.450 line is known as consumption line. C+I is the initial investmentcurve which intersects ON line at E1 point. When the investment isC+I the national income is OY1. When there is an increase ininvestment from C+I to C+I1 the national income would rise fromOY1 to OY2.
Working of the Multiplier -
The working of ‘K’ is explained as under. The following tableshows how there would be a multiplication in income according toincome propagation assuming that MPC is half or 50% of theincome with the initial investment of Rs. 200 crores.

27
RoundsInitial
investmentΔY ΔC ΔS
1st 200 cro. 200 100 100
2nd 100 50 50
3rd 50 25 25
4th 25 12.50 12.50
5th 12.50 6.25 6.25
6th 6.25 …. ….
Finally 200 400 200 200
The above table shows that the initial investment of Rs. 200crores is the income of the people. Out of 200 crores 50% i.e. Rs.100 crores is spent on consumption and remaining amount of Rs.100 crores is saved. The consumption expenditure of the people atthe first round would become income of the people at the secondround. Again out of Rs. 100 crores Rs. 50 crores is spent onconsumption and remaining Rs. 50 crores is saved. Theconsumption expenditure of the people at the second round wouldbecome income of the people at the third round. Again 50% of theincome is spent on consumption and remaining 50% is saved. Thisprocess will go on and on till the initial income of Rs. 200 croreswould not become zero.
Calculation of the Multiplier -The value of ‘K’ or multiplier is equal to reciprocal of 1- MPC.
It is symbolically expressed as, K = or K =
If MPC is 4/5 then,
K =
K = , K = 5. The value of ‘K’ will be 5.
The following table would indicate the different values of ‘K’ atdifferent MPC figures.
MPC MPS Value of ‘K’
0 1 1
1/2 1/2 2
2/3 1/3 3
3/4 1/4 4
4/5 1/5 5
28
1/3 2/3 1
3/5 2/5 2
8/9 1/9 9
9/10 1/10 10
99/100 1/100 100
1 0 Infinity
So from this schedule it is clear that larger the MPC thegreater would be the value of ‘K’ and vice versa.
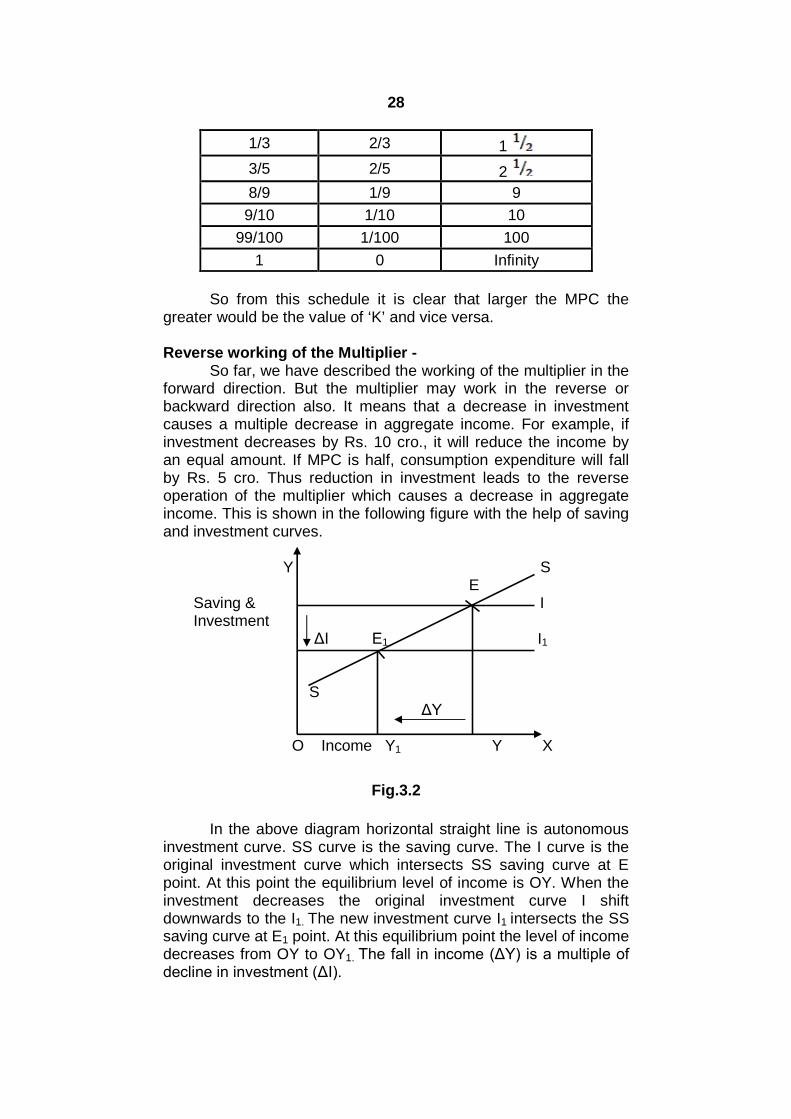
Reverse working of the Multiplier -So far, we have described the working of the multiplier in the
forward direction. But the multiplier may work in the reverse orbackward direction also. It means that a decrease in investmentcauses a multiple decrease in aggregate income. For example, ifinvestment decreases by Rs. 10 cro., it will reduce the income byan equal amount. If MPC is half, consumption expenditure will fallby Rs. 5 cro. Thus reduction in investment leads to the reverseoperation of the multiplier which causes a decrease in aggregateincome. This is shown in the following figure with the help of savingand investment curves.
Y SE
Saving & IInvestment
ΔI E1 I1
S ΔY
O Income Y1 Y X
Fig.3.2
In the above diagram horizontal straight line is autonomousinvestment curve. SS curve is the saving curve. The I curve is theoriginal investment curve which intersects SS saving curve at Epoint. At this point the equilibrium level of income is OY. When theinvestment decreases the original investment curve I shiftdownwards to the I1. The new investment curve I1 intersects the SSsaving curve at E1 point. At this equilibrium point the level of incomedecreases from OY to OY1. The fall in income (ΔY) is a multiple of decline in investment (ΔI).

29
Thus in a community with lower MPC, the initial decline ininvestment will have greater adverse effect on the level of incomeand employment. However, MPC is less than one but greater thanzero. This implies that people neither spend the full amount of extraincome nor reduce consumption by the full decrement of income.Hence income and employment cannot continue to decline till tozero. This otherwise, reverse working of the multiplier would imply acomplete collapse of the economy.
Assumptions-The concept of multiplier is based on the following
assumption.
1. The value of multiplier depends upon increase in investment.
2. It is assumed that the increase in investment has not furtherindirect effects on investment.
3. The calculation of multiplier depends on the assumption of aclosed economy.
4. The MPC is constant.
5. There exists unemployment in the economy.
6. There is absence of multiplier period.
7. Keynes has assumed that, change in investment is ofautonomous and not induced type.
8. It is assumed that the consumer goods are regularly madeavailable.
Leakages in Multiplier Process –
The size or value of multiplier is reduced by the leakages inincome stream on account of the following factors.
1. Savings- In actual life the people does not spend the entireincrease in income on consumer goods. On the contrary theysave a part of it. The saved portion of increased income doesnot get converted in investment. This limits the value of ‘K’.Thus higher the propensity to save of the people lower shall bethe value of ‘K’.
2. Repayment of old debts – The income recipients may repaytheir old debts to lenders instead of spending their income onconsumer goods. The value of ‘K’ is reduced if lenders whoreceive this money from the borrowers do not spend it.
3. Accumulation of idle cash deposits- A part of increased incomemay be saved in the form of idle bank deposit instead ofspending their income on consumer goods. The value of ‘K’ isreduced if the bankers who receive this money do not spend onconsumer goods.

30
4. Purchase of old assets – The income recipients may buy oldassets such as shares and securities from the people who maynot increase their consumption. This will reduce value of ‘K’.
5. Excess of import – The import of foreign goods may be increasethis will not help the domestic employment. This is becausemoney is spent on foreign goods resulting in a net outflow offunds to foreign countries. This would reduce value of ‘K’.
6. Inflation – The rise in prices would reduce additional moneyexpenditure even to buy same amount of goods and services.Hence actual consumption may not increase. This will reducevalue of ‘K’.
7. High taxes – High rate of taxes may lead to decline inconsumption expenditure and the value of ‘K’.
Limitations -
1. Availability of consumer goods – The theory assumes thatmultiplier depends upon the availability of consumer goods. Theshortage of consumer goods will not increase the consumptionexpenditure. Ultimately it will reduce the magnitude of multiplier.
2. Full employment level – The multiplier works in the economywhere the level of income is low and unemployment is high.Once the economy reaches the level of full employment themultiplier fails to work. At this level any increase in investmentwill not increase aggregate output and employment. This willlimit the value of ‘K’.
3. Multiplier period – According to Keynes, when income of thepeople increases they spend a part of it on consumption andremaining amount is saved. But in reality there is time gapbetween the receipt of increased income and the expenditure onconsumption. This time gap is called as multiplier period. Thevalue of multiplier depends upon the multiplier period of the timegap. Longer the time gap, the smaller will be the value of ‘K’ andthe smaller the time gap, the larger will be the value of ‘K’.
4. Availability of resources – The concept of multiplier depends onthe availability of resources for the production of consumergoods. But the shortage of resources will adversely affect theworking of the multiplier and thus it will reduce the value ofmultiplier.
3.2 THE PRINCIPLE OF ACCELERATION
The principle of acceleration was propounded first by aFrench Economist Albert Aftalion in 1909. The principle is generallyassociated with the name of an American Economist J.M. Clark in1917.
31
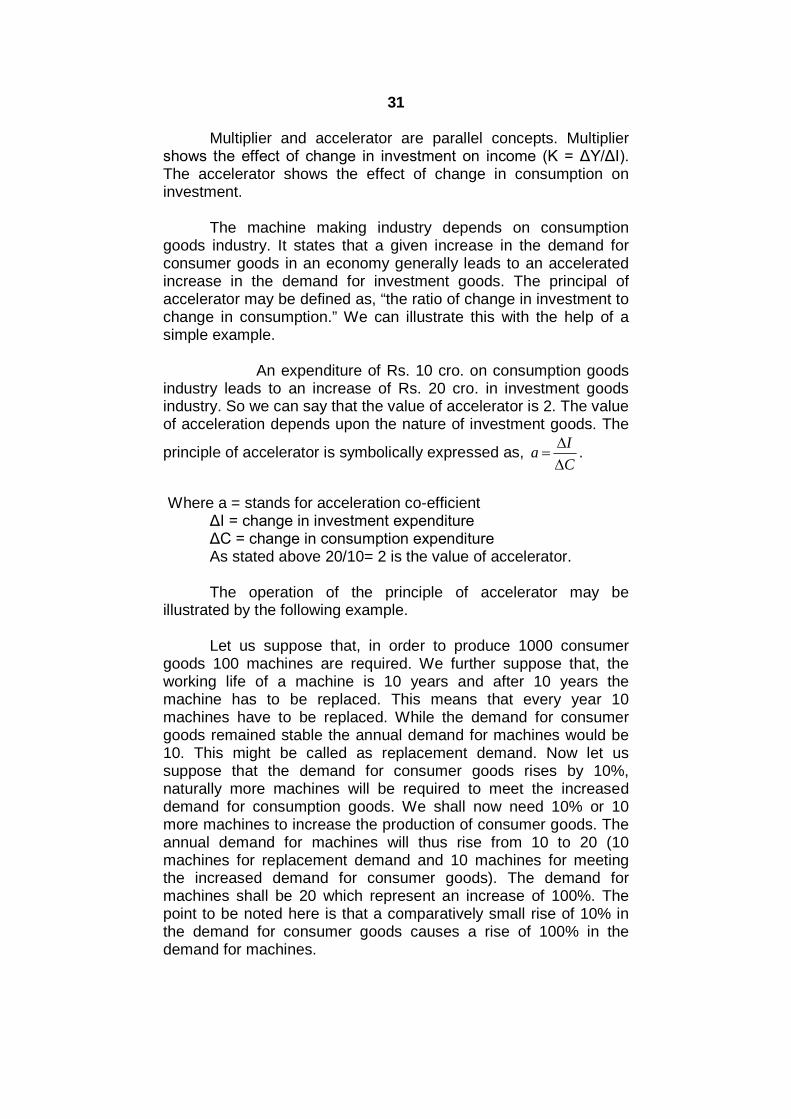
Multiplier and accelerator are parallel concepts. Multipliershows the effect of change in investment on income (K = ΔY/ΔI). The accelerator shows the effect of change in consumption oninvestment.
The machine making industry depends on consumptiongoods industry. It states that a given increase in the demand forconsumer goods in an economy generally leads to an acceleratedincrease in the demand for investment goods. The principal ofaccelerator may be defined as, “the ratio of change in investment tochange in consumption.” We can illustrate this with the help of asimple example.
An expenditure of Rs. 10 cro. on consumption goodsindustry leads to an increase of Rs. 20 cro. in investment goodsindustry. So we can say that the value of accelerator is 2. The valueof acceleration depends upon the nature of investment goods. The
principle of accelerator is symbolically expressed as,I
aC
.
Where a = stands for acceleration co-efficientΔI = change in investment expenditureΔC = change in consumption expenditureAs stated above 20/10= 2 is the value of accelerator.
The operation of the principle of accelerator may beillustrated by the following example.
Let us suppose that, in order to produce 1000 consumergoods 100 machines are required. We further suppose that, theworking life of a machine is 10 years and after 10 years themachine has to be replaced. This means that every year 10machines have to be replaced. While the demand for consumergoods remained stable the annual demand for machines would be10. This might be called as replacement demand. Now let ussuppose that the demand for consumer goods rises by 10%,naturally more machines will be required to meet the increaseddemand for consumption goods. We shall now need 10% or 10more machines to increase the production of consumer goods. Theannual demand for machines will thus rise from 10 to 20 (10machines for replacement demand and 10 machines for meetingthe increased demand for consumer goods). The demand formachines shall be 20 which represent an increase of 100%. Thepoint to be noted here is that a comparatively small rise of 10% inthe demand for consumer goods causes a rise of 100% in thedemand for machines.

32
Accelerator states that, the changes in the demand forinvestment goods are larger than the changes in the demand forconsumer goods industries.
The principle of accelerator can be explained with the help offollowing diagram.
Y SI1
Saving, CE1
Investment B II1
and AI E
Consumption
O S M M1 M2 X
Income LevelFig.3.3
In the above diagram, SS is the saving line slopes upwardfrom left to right. II and I1I1 are investment curves. OX axisrepresents savings, investment and consumption. In this diagram IIinvestment curve intersects SS saving curve at point ‘E’. At thisequilibrium point OM is the equilibrium level of income and savingsand investment both are equal to each other (OA). However ABincrease in investment is exogenous investment. An increase ininvestment from OA to OB pushes the income level from OM toOM1. An increase in investment from II to I1I1, the new investmentcurve I1I1 intersects SS saving line at point E1. At this equilibriumpoint, the equilibrium level of income is OM2 and OC is the savingand investment. An increase in investment from OB to OC isinduced investment. As a result, income level rises from OM1 toOM2. MM1 portion of increase in income is due to multiplier effectand M1M2 increase in income is due to accelerator effect. Thisincrease in income is because of induced investment.
In short, the principle of accelerator shows the change ininvestment to the change in consumption.

33
Working of the Accelerator –
The working of the accelerator is explained by a hypotheticalexample based on the following assumptions.
1. Current demand for consumption goods is 1000 units.
2. To maintain a constant flow of 1000 consumer goods, 100machines (capital goods) are required.
3. The capital output ratio remains constant and is equal to 1: 10.The acceleration co-efficient is 1.
4. The average life of a machine is 10 years. After 10 yearsmachines have to be replaced means 10 machines are neededa very year.
5. Any increase in demand for consumer goods will requireadditional machines besides replacement demand.
Working of the Accelerator
Period Consumptiongoods units
Capitalrequired
Replacementinvestment
Inducedinvestment
Totalinvestment
0 1000 100 10 0 10
1 1000 100 10 0 10
2 1100 110 10 10 20
3 1200 120 10 10 20
4 1300 130 10 10 20
5 1500 150 10 20 30
6 1700 170 10 20 30
7 1900 190 10 20 30
8 2000 200 10 10 20
9 1900 190 10 -10 0
The above table shows total output of consumption goods,net capital investment and total investment. When consumptiondemand rises by 10% in period 2, total investment rises to 20 that is100% increase in investment. In period 3 and 4 the demand forconsumption goods rises by 10% but total investment remains at20. It shows that the total output of consumption goods rises at thesame rate. In period 5, 6 and 7the absolute increase in output ofconsumption goods is higher than the earlier periods. The totalinvestment rises further to 30 units of capital. In period 8, thedemand for consumption goods rises by 10% only. As a result, thetotal investment falls to 20 units because the absolute increase in
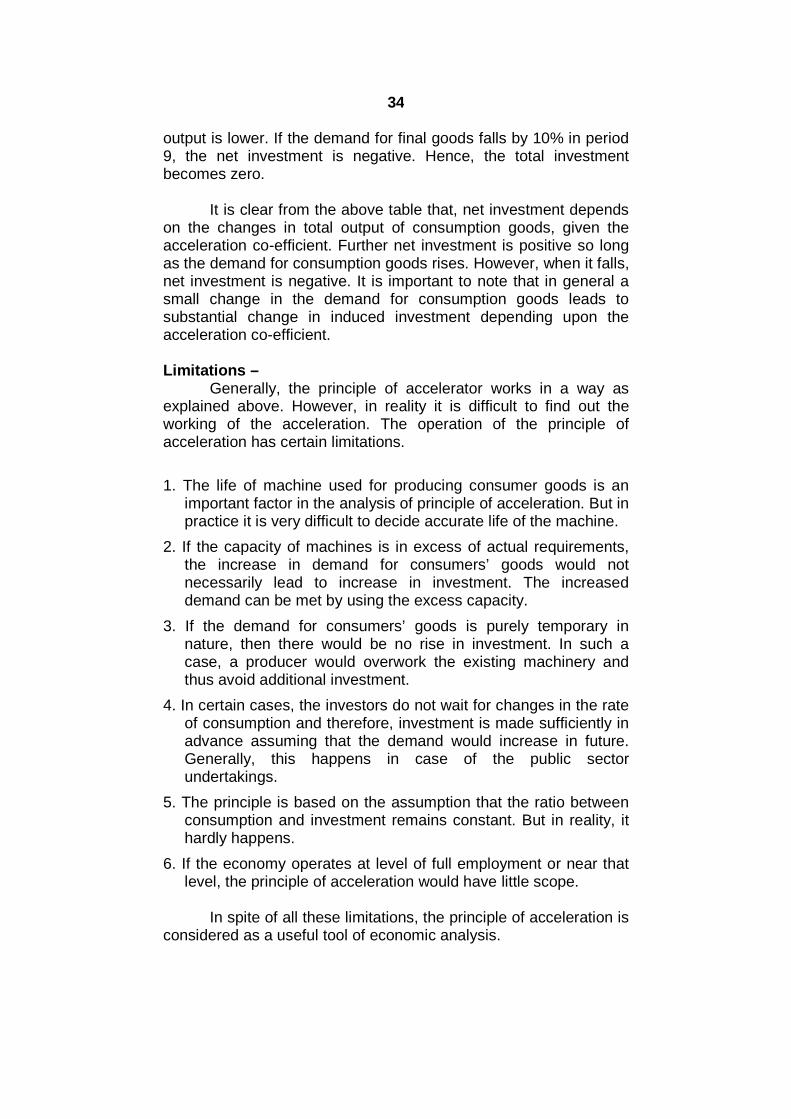
34
output is lower. If the demand for final goods falls by 10% in period9, the net investment is negative. Hence, the total investmentbecomes zero.
It is clear from the above table that, net investment dependson the changes in total output of consumption goods, given theacceleration co-efficient. Further net investment is positive so longas the demand for consumption goods rises. However, when it falls,net investment is negative. It is important to note that in general asmall change in the demand for consumption goods leads tosubstantial change in induced investment depending upon theacceleration co-efficient.
Limitations –Generally, the principle of accelerator works in a way as
explained above. However, in reality it is difficult to find out theworking of the acceleration. The operation of the principle ofacceleration has certain limitations.
1. The life of machine used for producing consumer goods is animportant factor in the analysis of principle of acceleration. But inpractice it is very difficult to decide accurate life of the machine.
2. If the capacity of machines is in excess of actual requirements,the increase in demand for consumers’ goods would notnecessarily lead to increase in investment. The increaseddemand can be met by using the excess capacity.
3. If the demand for consumers’ goods is purely temporary innature, then there would be no rise in investment. In such acase, a producer would overwork the existing machinery andthus avoid additional investment.
4. In certain cases, the investors do not wait for changes in the rateof consumption and therefore, investment is made sufficiently inadvance assuming that the demand would increase in future.Generally, this happens in case of the public sectorundertakings.
5. The principle is based on the assumption that the ratio betweenconsumption and investment remains constant. But in reality, ithardly happens.
6. If the economy operates at level of full employment or near thatlevel, the principle of acceleration would have little scope.
In spite of all these limitations, the principle of acceleration isconsidered as a useful tool of economic analysis.

35
3.3 SUPER MULTIPLIER
Combined Effects of Multiplier and Accelerator –
The principles of multiplier and accelerator are useful forunderstanding the dynamic process of income generation. Theprinciple of multiplier explains the effect of change in initialinvestment on final increase in income. On the other hand, theprinciple of accelerator explains the effect of change inconsumption on the level of investment and further on income andemployment. This clearly shows that, the principle of multiplierexplains only one aspect of income generation. But the principle ofaccelerator revels two important aspects namely- income andemployment. Hence, in order to measure the total effect of initialinvestment on national income it is necessary to combine theeffects of multiplier and accelerator.
The combined working shows that on the one hand theautonomous investment raises income through consumptionexpenditure as a result of multiplier effect. This inducedconsumption expenditure further leads to an increase in inducedinvestment. This generates more income as a result of acceleratoreffect. Again multiplier works because of increase in investmentand similarly, expands the increase in income and employment.This leads to a flow of induced investment.
This effect of combined operation of the multiplier andacceleration is called the ‘Leverage Effects’ or the super multiplier.This leverage effects brings about the accelerated change inincome and employment.
The process of income propagation by way of the multiplierand accelerator principles can be explained with the help offollowing example. Let us suppose that, the MPC is half or 50%.The acceleration co-efficient is 2 e. i. capital-output ratio is 2:1 andthe initial investment expenditure is `. 100 crores.
The Following table shows that the initial investmentexpenditure of `. 100 cro. generates an equal amount of increase inincome i.e. ` 10 cro. The induced consumption expenditure in thefirst period from this increased income will be ` 50 crores becauseMPC is half and the induced investment is ` 100 crores. Theacceleration co-efficient is 2 and income increases to ` 250 crores(100 + 50 +100 = 250).
36
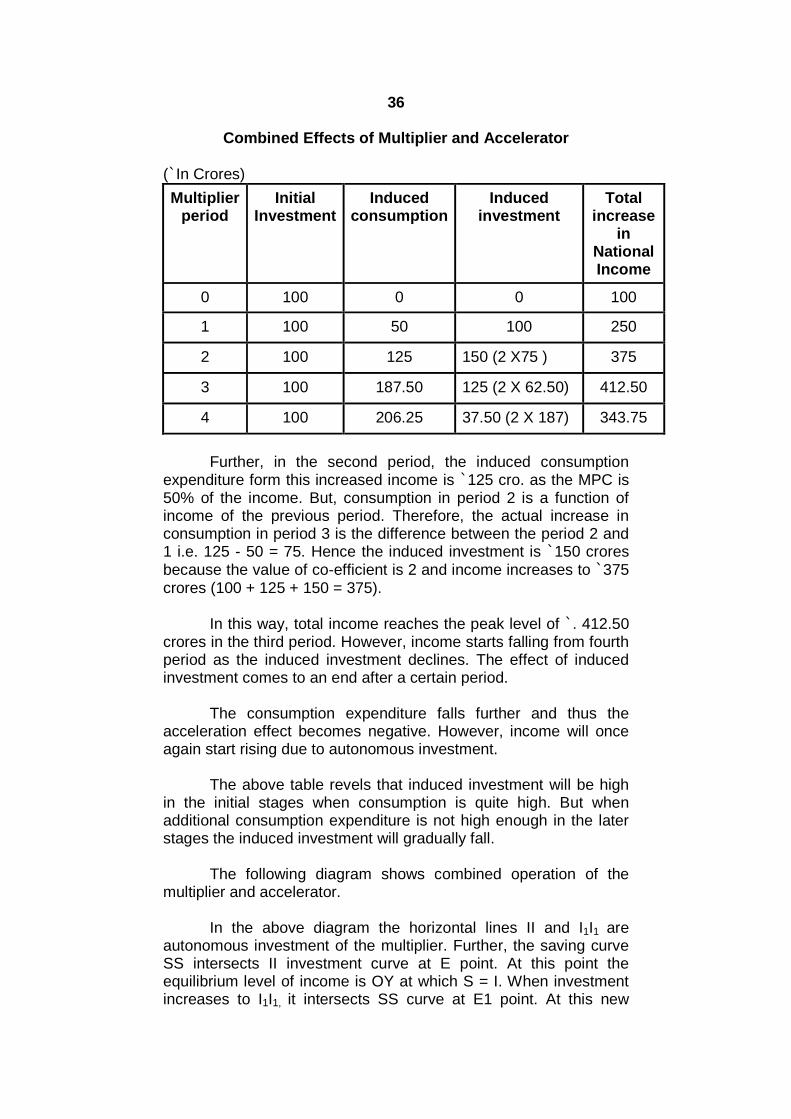
Combined Effects of Multiplier and Accelerator
(`In Crores)
Multiplierperiod
InitialInvestment
Inducedconsumption
Inducedinvestment
Totalincrease
inNationalIncome
0 100 0 0 100
1 100 50 100 250
2 100 125 150 (2 X75 ) 375
3 100 187.50 125 (2 X 62.50) 412.50
4 100 206.25 37.50 (2 X 187) 343.75
Further, in the second period, the induced consumptionexpenditure form this increased income is `125 cro. as the MPC is50% of the income. But, consumption in period 2 is a function ofincome of the previous period. Therefore, the actual increase inconsumption in period 3 is the difference between the period 2 and1 i.e. 125 - 50 = 75. Hence the induced investment is `150 croresbecause the value of co-efficient is 2 and income increases to `375crores (100 + 125 + 150 = 375).
In this way, total income reaches the peak level of `. 412.50crores in the third period. However, income starts falling from fourthperiod as the induced investment declines. The effect of inducedinvestment comes to an end after a certain period.
The consumption expenditure falls further and thus theacceleration effect becomes negative. However, income will onceagain start rising due to autonomous investment.
The above table revels that induced investment will be highin the initial stages when consumption is quite high. But whenadditional consumption expenditure is not high enough in the laterstages the induced investment will gradually fall.
The following diagram shows combined operation of themultiplier and accelerator.
In the above diagram the horizontal lines II and I1I1 areautonomous investment of the multiplier. Further, the saving curveSS intersects II investment curve at E point. At this point theequilibrium level of income is OY at which S = I. When investmentincreases to I1I1, it intersects SS curve at E1 point. At this new
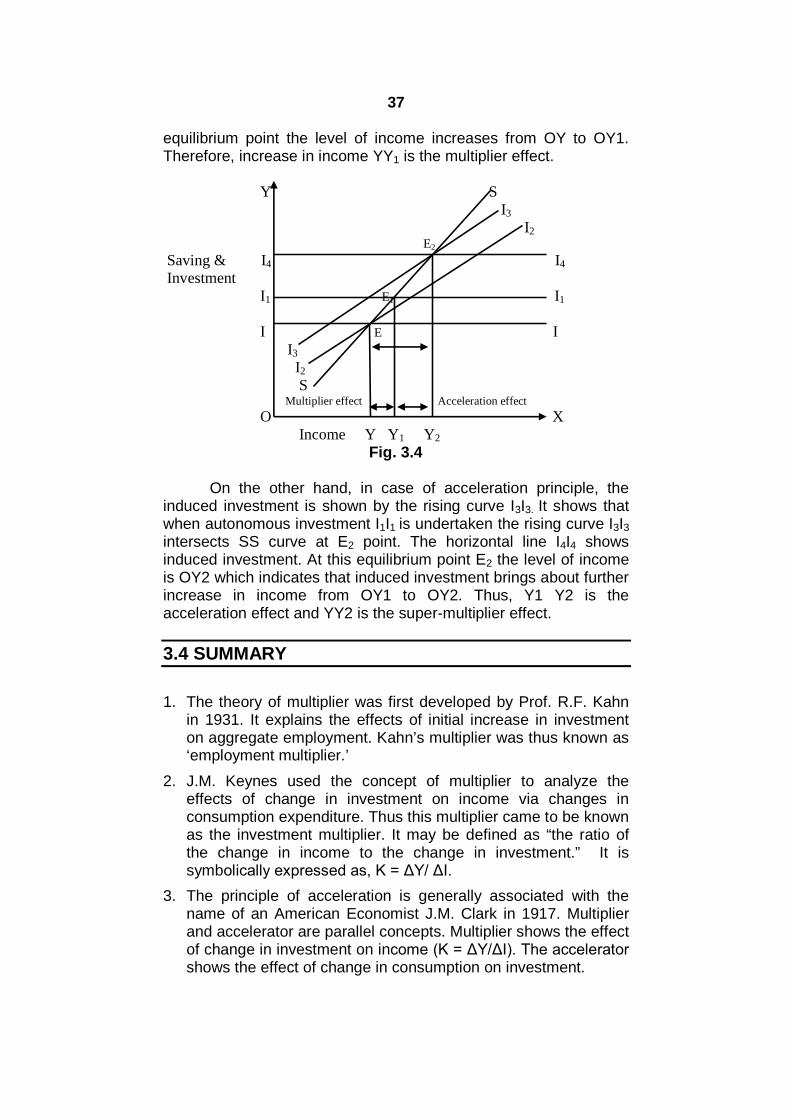
37
equilibrium point the level of income increases from OY to OY1.Therefore, increase in income YY1 is the multiplier effect.
Y SI3
I2
E2
Saving & I4 I4
InvestmentI1 E1 I1
I E II3
I2
SMultiplier effect Acceleration effect
O XIncome Y Y1 Y2
Fig. 3.4
On the other hand, in case of acceleration principle, theinduced investment is shown by the rising curve I3I3. It shows thatwhen autonomous investment I1I1 is undertaken the rising curve I3I3intersects SS curve at E2 point. The horizontal line I4I4 showsinduced investment. At this equilibrium point E2 the level of incomeis OY2 which indicates that induced investment brings about furtherincrease in income from OY1 to OY2. Thus, Y1 Y2 is theacceleration effect and YY2 is the super-multiplier effect.
3.4 SUMMARY
1. The theory of multiplier was first developed by Prof. R.F. Kahnin 1931. It explains the effects of initial increase in investmenton aggregate employment. Kahn’s multiplier was thus known as‘employment multiplier.’
2. J.M. Keynes used the concept of multiplier to analyze theeffects of change in investment on income via changes inconsumption expenditure. Thus this multiplier came to be knownas the investment multiplier. It may be defined as “the ratio ofthe change in income to the change in investment.” It issymbolically expressed as, K = ΔY/ ΔI.
3. The principle of acceleration is generally associated with thename of an American Economist J.M. Clark in 1917. Multiplierand accelerator are parallel concepts. Multiplier shows the effectof change in investment on income (K = ΔY/ΔI). The accelerator shows the effect of change in consumption on investment.

38
4. The effect of combined operation of the multiplier andacceleration is called the ‘Leverage Effects’ or the supermultiplier. This leverage effects brings about the acceleratedchange in income and employment.
3.5 QUESTIONS
1. What is investment multiplier? Explain the working of investmentmultiplier.
2. What do you understand by ‘acceleration principle’? Explain theworking of accelerator.
3. How is super multiplier defined? Examine the working of supermultiplier in explaining the business cycles.
39
4
Module 2
MONETARY ECONOMICS
Unit Structure
4.0 Objectives
4.1 Concept of Money Supply
4.2 Constituents of Money Supply
4.3 Determinants of Money Supply
4.4 Velocity of Circulation of Money
4.5 Summary
4.6 Questions
4.0 OBJECTIVES
To study the concept of money supply
To understand the constituents of money supply
To study various determinants of money supply
To study the concept of velocity of circulation of money andits factor determinants
4.1 CONCEPT OF MONEY SUPPLY
Money supply refers to the amount of money which is incirculation in an economy at any given time. It is the totalstock of money held by the people consisting of individuals,firms, State and its constituent bodies except the Statetreasury, Central Bank and Commercial Banks. The cashbalances held by the Federal and federating governments with theCentral Bank and in treasuries are not considered as part of moneysupply because they are created through the administrative andnon-commercial operations of the government. Further moneysupply refers to the disposable stock of money. Therefore moneysupply is stock of money in circulation. Money supply can belooked at from two points of views, namely, money supply as astock and money supply as a flow. Thus at a given point of time,the total stock of money and the total supply of money is different.

40
Money supply viewed at a point of point is the stock of money heldby the people on a given day whereas money supply viewedovertime is viewed as a flow. Units of money are spent and re-spent several times during a given period. The average numberof times a unit of money circulates amongst the people in agiven year is known as Velocity of Circulation of Money. Theflow of money is measured by multiplying the stock of money withthe coefficient of velocity of circulation of money.
4.2 CONSTITUENTS OF MONEY SUPPLY
There are two approaches to the constituents of money supply.They are the traditional and the modern approaches.
1. Traditional Approach: According to the traditional approach,the money supply consists of currency money consisting ofcoins and notes and bank money consisting of checkabledemand deposits with commercial banks. The currency moneyis considered high powered money because of the legal backingof the State. The Central Bank of a country issues currencynotes and coins because it has the monopoly of note and coinissue. The supply of money in a country depends upon thesystem of note issue adopted by the country. For instance,India adopted the Minimum Reserve System in 1957. Underthis system, the Reserve Bank of India has to maintain aminimum reserve of `.200 Crores consisting of gold and foreignsecurities. Out of this, the value of gold should not be less than`.115 Crores. With this reserve, the Reserve Bank of India hasthe power to issue unlimited amount of currency in the country.
Checkable demand deposits of commercial banks are used inthe settlement of debt. Payments made through checks changethe volume of demand deposits by creating derivative deposits.The creation of demand deposits is determined by the creditcreation activities of the commercial banks. Bank money isconsidered as secondary money whereas cash money is knownas high powered money. Thus according to the traditionalapproach, the total supply of money is the sum of high poweredmoney and secondary money or currency and bank money.The ratio of bank money to currency money depends upon theextent of monetization, banking habits and bankingdevelopment in a country. In advanced countries, ratio of bankmoney to currency money is high whereas in poor countries theratio of currency money to bank money is high.
2. The Modern Approach: According to the modern approach,money supply includes currency money and near money.Money supply therefore consists of coins, currency notes,
41
demand deposits of commercial banks, time deposits ofcommercial banks, financial assets, treasury bills andcommercial bills of exchange, bonds and equities.
RESERVE BANK OF INDIA’S APPROACH TO THEMEASUEMENT OF MONEY SUPPLY:
According to the Reserve Bank of India since its inception in1935, money supply in the narrow sense of the term was the sumof currency with the people and demand deposits with thecommercial banking system. Narrow money was denoted by theRBI by M1. In 1964-65, the concept of broad money or aggregatemonetary resources was introduced. Broad money was consideredequal to M1 + Time deposits with commercial banks. In March,1970 the RBI accepted the report of the Second Working Group onMoney Supply. This report was published in the year 1977 and itgave a broad definition of money supply. Accordingly, fourmeasures of money supply were brought into effect.These four measures are as follows:
1. M1 = Currency with the public + Demand deposits with thecommercial Banks + Other deposits with the RBI.
2. M2 =M1 + Post Office Savings Bank Deposits.
3. M3 =M1 + Time deposits with the commercial banks.
4. M4 =M3 + Total Post Office Deposits (excluding NSCs).
The Reserve Bank of India gives importance to narrowmoney (M1) and broad money (M3). Narrow money excludes timedeposits because they are not liquid and are income earning assetswhile broad money includes time deposits because some liquidity isinvolved in it as these assets earns interest income in future. Sincetime deposits have become convertible in recent times, they havebecome more liquid than what they were before. The M2 and M4
measures of money supply include post office savings and otherdeposits with the post offices.
The third working group on money supply recommended thefollowing measures of monetary aggregates through theirreport submitted in 1998:
1. M0 =Currency in circulation + Bankers’ deposits with the RBI +Other deposits with the RBI. (M0 is compiled on weeklybasis).
2. M1 =Currency with the public + Demand deposits with thebankingSystem + Other deposits with the RBI = Currency

42
with the public + Current deposits with the banking system+ Demand liabilities Portion of Savings Deposits with thebanking system + other Deposits with the RBI.
3. M2 = M1 + Time liabilities portion of saving deposits with thebanking System + Certificates of deposits issued by thebanks + Term Deposits [excluding FCNR (B) deposits] witha contractual maturity of up to and including one year withthe banking system =Currency with the public + currentdeposits with the banking System + Savings deposits withthe banking system + CertificatesOf Deposits issued by thebanks + Term deposits [excluding
FCNR (B) deposits] with a contractual maturity up to and Includingone year with the banking system + other deposits with the RBI.
4. M3 = M2 + Term deposits [excluding FCNR (B) deposits]with a Contractual maturity of over one year with thebanking system +Call borrowings from Non-depositoryfinancial corporations by the Banking system. (M1, M2
& M3 are compiled every fortnight).
In addition to the monetary measures stated above, thefollowing liquidity aggregates to be compiled on monthly basis werealso recommended by the working group:
1. L1 =M3 + All deposits with the Post Office Savings Banks(excluding National Savings Certificates).
2. L2 = L1 + Term deposits with Term lending institutions andrefinancing Institutions (FIs) + Term borrowing by FIs + Certificatesof Deposits issued by FIs.
3. L3 =L2 + Public deposits of Non-banking Financial Companies.(L3 is compiled on quarterly basis).
4.3 DETERMINANTS OF MONEY SUPPLY
Currency in circulation and demand deposits are the mainconstituents of money supply. While the demand deposits arecreated by the commercial banks, currency is issued by the CentralBank and the Government. The supply of money is determined bythe following factors:
1. Size of the Monetary Base: Money supply depends upon thesize of the monetary base. The monetary base refers to thegroup of assets which empowers the monetary authorities toissue currency money. Money supply changes with changes in

43
the monetary base. The monetary base of an economy consistsof monetary gold stock, reserve assets such as governmentsecurities, bonds and bullion, foreign exchange reserve with thecentral bank and the amount of central bank’s creditoutstanding. In the present times, gold stock is not consideredas part of the monetary base.
2. Community’s Choice: The relative amount of cash anddemand deposits held by the people also influences the supplyof money. If the people prefer to make check payments muchmore than cash payments, the total money supply maintainedby a given monetary base would be larger and vice versa.Since money deposited in commercial banks generatesderivative deposits and expand the supply of bank moneythrough the credit multiplier, people’s preference of bank moneyto cash would increase the supply of money. However, thechoice of the community is determined by factors such asbanking habits, per capita income, availability of bankingfacilities and the level of economic development. If thesefactors are developed, the money supply would be larger andvice versa.
3. Extent of Monetization: Monetization refers to the use ofmoney as a medium of exchange. The choice of the communityfor money as a liquid asset depends upon the extent ofmonetization of the economy. If monetization is high, demandfor money would be high and vice versa.
4. Cash Reserve Ratio: The Cash Reserve Ratio refers to theratio of a bank’s cash holdings to its total deposit liabilities. Itdetermines the coefficient of the credit multiplier. The CRR isdetermined by the Central Bank of a country. The creditmultiplier (m) is determined as the reciprocal of the CRR (r).Therefore m = 1/r. Excess funds with the commercial banksmultiplied by the credit multiplier will give us the extent of creditcreation by the commercial banks. Lower the CRR, greater willbe value of the credit multiplier and therefore greater will be thesupply of bank money and vice versa.
5. Monetary Policy of the Central Bank: Monetary policy isdefined as the policy of the Central Bank with regard to the costand availability of credit in the economy. The monetary policy ofthe Central Bank of any country will be according to the macro-economic conditions. Thus under inflationary conditions, theCentral Bank may follow restrictive monetary policy and therebyreduce the supply of bank money by pursuing both qualitativeand quantitative measures of controlling money supply.Similarly under recessionary conditions the Central Bank mayfollow expansionary monetary policy and thereby raise thesupply of money in the economy.

44
6. Fiscal Policy of the Government: Fiscal Policy is defined as apolicy concerning the income and expenditure of thegovernment. While the government raises revenue throughvarious sources like different types of taxes, borrowing andthrough deficit financing, it spends the money raised for variousdevelopmental and non-developmental purposes. When thegovernment raises revenue by imposing fresh taxes or byraising the existing level of taxes, it helps to reduce moneysupply. Similarly, market borrowing by the government reducesmoney supply and raises the market interest rates. This isknown as the crowding out effect of government borrowing.When the government spends the money so raised, moneysupply increases. However, when the government runs adeficit budget, it adds to the existing stock of money supply andthus raises the supply of money in the economy. The oppositewill be the impact of a surplus budget but surplus budgets are ararity in modern times.
7. Velocity of Circulation of Money: Velocity of circulation ofmoney refers to the average number of times a unit of money asa medium of exchange changes hands during a given year.Money supply is measured as total money in circulationmultiplied by the velocity of circulation (MV). Thus higher thevelocity of circulation of money, higher will be the money supplyand vice versa.
4.4 VELOCITY OF CIRCULATION OF MONEY
The velocity of circulation of money determines the flow ofmoney supply in an economy in a given period of time, normallysuch a period is one year. The average number of times a unit ofmoney changes hands is known as the velocity of circulation ofmoney. The supply of money in a given period is obtained bymultiplying the money in circulation with the coefficient of velocity ofcirculation i.e., M V where M refers to the total amount of moneyin circulation and V refer to the velocity of circulation of money inthe given period.
Factors Determining Velocity of Circulation of Money: Thevelocity of circulation of money is determined by the followingfactors:
1. Time Unit of Income Receipts: The more frequently peoplereceive income, the shorter will be the average time period ofholding money and greater will be the velocity of circulation ofmoney. Thus if in a given society large number of peoplereceive income on daily basis, the velocity of circulation ofmoney would be higher than the one in which people receiveincome on weekly, fortnightly or monthly basis.
45
2. Method and Habits of Payment: The velocity of circulationof money would be high if large number of people prefers tomake payment on installment basis. As a result, the same unitof money will change hands more often than when paymentsare made in full.
3. Regularity of Income Receipts: If in a society people receiveincome on a regular basis, they will spend their current incomewithout bothering about future and hence the velocity ofcirculation of money would be high. However, if future incomereceipts are uncertain, people will not spend more money inthe present and hence the velocity will be less.
4. Saving Habits of the People: If the marginal propensity tosave is high in a society, then the people will be spending lessin the present and hence the velocity will be less. Similarly, ifthe marginal propensity to consume is high the people willspend more and the velocity of circulation of money will behigh.
5. Income Distribution: Income distribution may be more equalor more unequal in a society. If inequalities of income are highin a society with the top 20 % taking away a major portion ofthe national income, velocity of circulation of money would below because the richer sections of the society will be holdingmore idle cash balances. However, if income distribution ismore equal or less unequal, the bottom 40% of the people willreceive more incomes and spend more thereby increasing thevelocity of circulation of money.
6. Development of Banking and Financial System: If thebanking and financial institutions in a country are welldeveloped, mobilization of savings can be effectively carriedout and more credit made available to the needy. This notonly prevents hoarding of cash balances but also increasesthe velocity of circulation of both currency and bank money.
7. Business Cycle: During the prosperity phase of the businesscycle, investment, output, income, employment and pricesrise. Thus the velocity of circulation of money would be highduring the prosperity phase. However, during the downturn ofthe business cycle, investment, output, income, employmentand prices begin to decline thereby reducing the velocity ofcirculation of money.
8. Liquidity Preference of the People: If the liquidity preferenceof the people is high i.e., if they wish to hold a greater part oftheir income in the form of idle cash balances, the velocity ofcirculation of money would be low and vice versa.

46
9. Speedy Clearance of Checks and Transfer of Funds: Amore advanced banking system would help speedy clearanceof checks and transfer of funds from one account to anotheraccount, thereby increasing the velocity of circulation ofmoney.
4.5 SUMMARY
1. Money supply refers to the amount of money which is incirculation in an economy at any given time. It is the total stockof money held by the people consisting of individuals, firms,State and its constituent bodies except the State treasury,Central Bank and Commercial Banks.
2. There are two approaches to the constituents of money supply.They are the traditional and the modern approaches.
3. The supply of money is determined by the following factors: Sizeof monetary base, Community’s choice, Extent of monetization,Cash Reserve Ratio, Monetary policy of the Central Bank,Fiscal policy of the Government, Velocity of circulation ofmoney.
4. The velocity of circulation of money determines the flow ofmoney supply in an economy in a given period of time, normallysuch a period is one year.
5. Factors determining velocity of circulation of money: Time unitof income receipts, Method and habits of payment, Regularity ofincome receipts, Saving habits of the people, Incomedistribution, Development of banking and financial system,Business cycle, Liquidity preference of the people, Speedyclearance of cheques and transfer of funds.
4.6 QUESTIONS
1. What is Money Supply?
2. Explain the approaches to the constituents of money supply.
3. Explain the determinants of money supply.
4. What is Velocity of Circulation of Money and explain thedeterminants of velocity of circulation of money?

47
5
DEMAND FOR MONEY
Unit Structure
5.0 Objectives
5.1 Meaning and functions of money
5.2 Keynes’ Theory of Demand for Money
5.3 Liquidity Preference Approach to the theory of Interest
5.4 Summary
5.5 Questions
5.0 OBJECTIVES
To understand the meaning and functions of money
To study the Keynes’ Theory of Demand for Money
To study the Liquidity Preference Approach to the theory ofinterest
5.1 MEANING OF MONEY
Money is defined in Economics as ‘anything that isgenerally accepted in payment for goods and services as amedium of exchange.’ Money consists of currency and checkabledemand deposits. Money is different from income and wealth.While income refers to a flow of purchasing power which is used tomake payments for the services obtained from the factors ofproduction, wealth is a stock of accumulated purchasing power.While income is a flow variable that is measured over a givenperiod of time, wealth is a stock variable that is measured at agiven point of time. While income is generally in the form of moneyand income in the form of money is known as nominal income,income in the form of goods and services is known as income inkind or real income. Real income is also measured in terms ofconstant prices. Wealth can be held in the form of monetaryassets. Saving is the primary source of wealth. Money is the mostliquid asset. The liquidity of assets refers to the ease with which anasset can be converted into a medium of exchange. Assets areclassified as either financial assets or real assets and are ranked
48
according to their liquidity. Currency, checkable deposits, savingsdeposits are the examples of liquid financial assets. Stocks andbonds are relatively less liquid financial assets. Precious metalslike silver, gold, platinum etc are liquid real assets. Artwork,machinery and real estate are the examples of less liquid realassets. The liquidity of an asset is determined by the followingfactors:
1. Existence of a well established market in which the assetcan be quickly sold.
2. Size of transaction costs (brokers fees, time costs)3. Stability of the asset’s price.
The price of a rupee is always a rupee. The prices of otherassets measured in terms of money generally fluctuate. However,the value of a rupee is not fixed as it is measured in terms ofpurchasing power. For instance, at current prices a potato vadawould cost you Rupees Ten a piece. In 1974 when I was studyingin the fifth standard, Rupees Ten would fetch me 100 pieces ofpotato vada and with that money I could have arranged a potatovada party for 100 students. (The value of money: Vm = 1/P, where‘P’ stands for price level.
FUNCTIONS OF MONEY:Money is a matter of functions four: medium, measure,
standard and store. Money therefore has four important functions.
1. Medium Of Exchange: Money functions as a medium ofexchange and hence permits a time interval between buyingand selling goods and services. Money replaces barter wheregoods or services are traded directly for other goods orservices. Barter does not provide a time interval between buyingand selling goods and services. Money eliminates the need fora double coincidence of wants. For instance, a farmer who hasjowar in his stocks and wants to trade it for wheat must find aperson who has wheat and also wants to trade wheat for jowar.Money greatly improves the efficiency of transactions byreducing transactions costs. In a barter economy, transactioncosts would include cost of search. The cost of search iseliminated in a monetary economy. In a monetary economy, thefarmer only needs to find a person who wants to buy jowar andhas the purchasing power to pay for it. The farmer need not bebothered if the person has wheat and is willing to trade wheatfor jowar. The need for double co-incidence of wants iseliminated in a monetary economy.
2. Unit of Account: A unit of account is a standard numerical unitof measurement of the market value of goods, services andother transactions. It is also known as a "measure" or "standard"
49
of relative worth and deferred payment. Money as a unit ofaccount is essential for entering into commercial agreementsthat involve debt and future payments. Money is divisible intosmall units without destroying its value. Precious metals can becoined from bars and melted down to bars again. Money isfungible, i.e., one unit or piece must be perceived as equivalentto any other commodity or service. Hence diamonds or works ofart are not suitable as money. A specific weight, or measure, orsize must be verifiably countable. For instance, coins are oftenmade with ridges around the edges so that any removal ofmaterial from the coin leading to fall in its intrinsic value will beeasy to detect. The unit of account is the unit in which valuesare stated, recorded and settled. Money is a means ofmeasuring and recording value. Wheat is measured inkilograms. Distance is measured in kilometers. Value ismeasured in units of money. In barter, the value or price ofevery good and service must be measured in terms of the valueof every other good and service. In a barter economy with only100 goods there would be: [(N(N-1))/2] = 4950 prices. However,in a monetary economy with only 100 goods, there would beonly 100 prices. At current prices, a kilogram of wheat would beaccounted in the range of Rs.25 to Rs.35 and a kilogram of ricewould be accounted in the range of Rs.30 to Rs.50.
3. Store of Value: Since money, as a medium of exchange,represents purchasing power, it can be stored and used in thefuture. Money is a store of value but it is not usually a goodstore of value. During inflation, money looses its value. Thevalue of money is inversely related to the price level. Higher theprice level, lower will be the value of money and vice versa.Symbolically, the value of money can be found out with thefollowing formula:
Vm=1/P
Assuming the price level to be 100, the value of Rs. 100 wouldbe 100. If the price level goes up to 200, the value of Rs. 100would be only 50. Money may therefore not be acceptable as astore of value during periods of high inflation. Instead, peoplemay prefer to store value in the form of gold and real estate.
4. Standard of Deferred Payments: Deferred payment meansfuture payments. Money is used as a standard of deferredpayments and hence debt contracts are signed in monetaryterms. Loans and future payments are agreed and contractedin monetary terms as money units are accepted as the means ofsettling future accounts. However, during periods of very highinflation, money may not be used as a standard of deferredpayments because the future value of present money is

50
inversely related to the general price level i.e. when the pricelevel goes up, the value of money falls. Thus during inflationaryperiods, money may be used as a medium of exchange but notas a standard of deferred payments.
5.2 KEYNES’ THEORY OF DEMAND FOR MONEY
Keynes put forward his theory of demand for money in hisfamous work “The General Theory of Employment, Interest andMoney” (1936). According to Keynes, people hold cash balanceson account of three reasons or motives. These are the transactionmotive, the precautionary motive and the speculative motive.Accordingly the demand for money can be separated into threeparts namely transaction demand, precautionary demand andspeculative demand for money. The total demand for money orcash balances can be divided into two namely; active and idle cashbalances.
Active Cash Balances:
Demand for active cash balances is divided into transactionand precautionary demand for money. The transaction demandfor money arises due to the fact that money is a medium ofexchange. Further receipts and payments do not take placesimultaneously. There is always a time gap between twosuccessive receipts and payments are an ongoing affair in theroutine course. Hence people need to hold cash balances to payfor their regular transactions. According to Keynes, transactionmotive for holding money is the need of cash for the currenttransactions of personal and business expenditure. Therefore,households and firms hold money on account of the transactionmotive. Their respective transactions motives can be referred to asincome and business motives. The income motive refers to thetransaction motive of households. Families hold cash balances toexecute routine transactions. Household demand for moneydepends upon the following factors:
1. The Level of Income: Transaction demand for money by thehouseholds is directly related to the level of income, i.e. higherthe level of income, higher will be the transaction demand formoney and vice versa.
2. The Price Level: Higher the price level, higher will be thetransaction demand for money and vice versa. When pricesrise, more money will be required to purchase the same quantityof goods and services and hence the transaction demand formoney would rise when prices rise.

51
3. The Spending Habits: If the people in a society are thrifty,they would require less money for transactions purposes.However, if large number of persons in a society is spendthrift,they would require more money for transaction purposes.
4. The Time Interval: If the time interval between two successiveincome receipts is big, then the people will hold larger cashbalances under transaction motive and vice versa.
Similarly, firms need cash balances to pay for raw materials,transport, wages and salaries and other payments. Cash balanceheld by firms to satisfy these requirements is the money held underbusiness motive. The quantum of money held under businessmotive is directly related to the turnover of firms i.e. larger theturnover, larger will be the amount of money held under businessmotive.
Transactions demand for money is therefore the sum of moneyheld under income motive and business motive. It is incomedetermined and remains stable in the short run because incomechange takes place only in the long run. Transactions demand formoney is an increasing function of income. Symbolically, thetransactions demand for money function can be stated as follows:-
Lt = f (Y)Where; Lt = Liquidity preference under transactions motive.
Y = Level of national income.
People also hold cash balances to provide for unforeseenrequirements. The amount of cash balances held by people toprovide for unforeseen requirements is referred to as precautionarydemand for money or money held under precautionary motive.Sickness, unemployment, death, accidents etc are some of theunforeseen events which may take place in the lives of people.The precautionary demand for money depends upon uncertainty offuture receipts. It is directly related to income and relatively stable.The precautionary demand for money is interest inelastic andchanges in response to changes in uncertainty. Symbolically, theprecautionary demand for money can be stated as follows:
Lp = f (Y)
Where; Lp = Liquidity preference under precautionarymotive.
The transaction and precautionary demand for moneycannot be easily separated in practice and since both the moneydemand functions are income determined and also interestinelastic, they are collectively known as active balances.Symbolically, the demand for active balances can be stated asfollows:
L1 = Lt + Lp
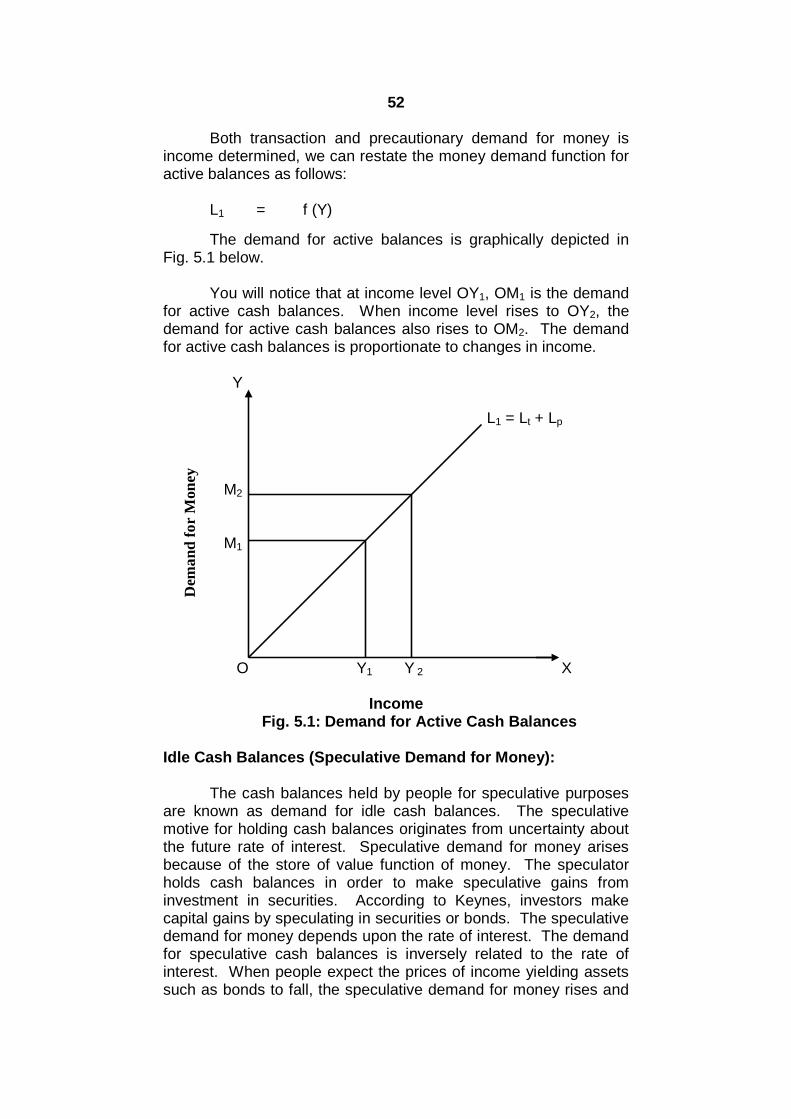
52
Both transaction and precautionary demand for money isincome determined, we can restate the money demand function foractive balances as follows:
L1 = f (Y)
The demand for active balances is graphically depicted inFig. 5.1 below.
You will notice that at income level OY1, OM1 is the demandfor active cash balances. When income level rises to OY2, thedemand for active cash balances also rises to OM2. The demandfor active cash balances is proportionate to changes in income.
Y
L1 = Lt + Lp
M2
M1
O Y1 Y 2 X
IncomeFig. 5.1: Demand for Active Cash Balances
Idle Cash Balances (Speculative Demand for Money):
The cash balances held by people for speculative purposesare known as demand for idle cash balances. The speculativemotive for holding cash balances originates from uncertainty aboutthe future rate of interest. Speculative demand for money arisesbecause of the store of value function of money. The speculatorholds cash balances in order to make speculative gains frominvestment in securities. According to Keynes, investors makecapital gains by speculating in securities or bonds. The speculativedemand for money depends upon the rate of interest. The demandfor speculative cash balances is inversely related to the rate ofinterest. When people expect the prices of income yielding assetssuch as bonds to fall, the speculative demand for money rises and
Dem
an
dfo
rM
oney

53
vice versa. Symbolically, the speculative demand for money canbe stated as follows
L2 = f (i)
Where; L2 = Speculative demand for money.
i = Rate of interest.
The opposite relationship between rate of interest andspeculative demand for money is shown in Fig.5.2 below:
Y
20%
2% Liquidity Trap L2
O XSpeculative Demand for Money
Fig. 5.2: Demand for Idle Cash Balances
You will notice that the speculative demand for money isinversely related to the rate of interest. When the rate of interestfalls, the speculative demand for money rises and vice versa.Speculative demand for money is therefore highly interest elastic.However, at a very low interest rate, the speculative demand formoney becomes perfectly elastic i.e., the entire income is held inthe form of idle cash balances. This is due to the fact that bondprices and interest rates move in opposite directions. When theinterest rate rises, the bond or security prices fall and vice versa.The speculative demand for money is also income determining andnot income determined as in the case of transaction andprecautionary demand for money. When the interest rate isexpected to rise, people prefer to hold cash balances at the currentinterest rate so that they can take advantage of a rise in interestrate in the future. When speculative demand for money is rising, itindicates a greater preference for liquidity.
Rat
eof
Inte
rest

54
The Concept of Liquidity Trap:At a very low rate of interest, the speculative demand for
money is perfectly elastic i.e., the entire income is held by people inthe form of cash balances for speculative purposes. In the situationof liquidity trap, percentage change in the demand for money inresponse to a percentage change in the rate of interest is equal toinfinity. Symbolically, the liquidity trap situation can be stated asfollows:
M i M i
You will notice that the L2 curve in Fig.5.2 shows the liquiditypreference under the speculative motive at different rates ofinterest. At a very high interest rate of 20%, the speculativedemand for money is very low and vice versa. However, when theinterest rate is only 2%, the speculative demand for moneybecomes perfectly elastic. At this point, any increase in moneysupply or income will be held by the people in the form of idle cashbalances. In the diagram, the liquidity trap situation is shown byhighlighting the horizontal segment of the liquidity preference curve.The liquidity trap situation arises because at very low rate ofinterest, the opportunity cost of holding cash balances is negligibleand that in future the opportunity cost of holding cash balances isexpected to rise.
Aggregate Demand for Money:The aggregate or total demand for money is the sum of
transaction, precautionary and speculative demands for money.Symbolically, the aggregate demand for money can be stated asfollows:
L=L1 L2
Where; L=Aggregate demand for money.
The functional relationship between aggregate demand formoney and the determining variables: nominal level of aggregateincome and the rate of interest can be stated as follows:
L=f (Y, i)
The liquidity preference schedule of a community can beobtained by superimposing the L1 curves at each level of income onthe L2 curves. The liquidity preference schedule of a community isshown in Fig.5.3 below.
In Fig.5.3, Panel (A) shows the schedule of active balances(the sum of transaction and precautionary demand for money) heldby people at different levels of income. The demand for activebalances is perfectly inelastic to changes in interest rate in the shortrun and changes proportionately to the changes in the level of

55
income. Accordingly, L1 (Y1) shows the demand for active cashbalances at Y1 level of income and so on and so forth. The L1
curves are vertically sloping because they are interest-inelastic. InPanel (B), the L2 curves shows demand for idle cash balances orspeculative demand for money. You will recall that speculativedemand for money is interest-elastic and inversely related to therate of interest. Hence the L2 curve is downward sloping.However, at a very low rate of interest, it becomes horizontalindicating that the entire income is held in the form of idle cashbalances. In Panel (C), the liquidity preference curve indicatingtotal demand for money is shown. It is the result of super-impositionof the L1 curves on the L2 curves. Accordingly, the curves L(Y1),L(Y2) and L(Y3) are obtained and they represent the liquiditypreference schedules of the community at various levels of interestrates and national income.
YL(Y1 to Y3)
Y YL1(Y1) L1(Y2) L1(Y3)
L2
O O O
(A) (B) (C)
Fig. 5.3: Total Demand for Money
THE LIQUIDITY PREFERNECE THEORY OF INTEREST
5.3 THE LIQUIDITY PREFERNECE THEORY OFINTEREST
According to Keynes, the rate of interest is determined bythe demand for and supply of money. Interest is the reward forlending liquidity or temporarily giving up cash balances held by thepeople. Symbolically, the rate of interest can be stated as follows:
Ri = f (DM, SM)
Where, Ri = Rate of interest.
DM = Demand for money, and
SM = Supply of money.
Demand for Money
Rat
eo
fIn
tere
st
56
The demand for money can be expressed in the form of aliquidity preference schedule. Further, the demand for money asstated earlier is the sum of demand for active and idle cashbalances. While the demand for active cash balances isdetermined by the transaction and precautionary motives, thedemand for idle cash balances is determined by speculative motive.There is a direct relationship with the demand for active cashbalances and the level of income. Whereas, the demand for idlecash balances is inversely related to the rate of interest. The totaldemand for money can be symbolically stated as follows:
L = L1 L2
Where; L = Aggregate demand for money.
L1 = Demand for active cash balances.
L2 = Demand for idle cash balances.
The total demand for money can therefore be symbolically re-statedas follows:
L = f (r, y)
WhereL = Aggregate demand for money.r = Rate of interest.y = Level of national income.
DETERMINATION OF THE RATE OF INTERST:
The equilibrium rate of interest is determined by theintersection between the demand curve for and supply curve ofmoney. The supply of money is determined and controlled by themonetary authority and the banking system. At any time, the stockof money is fixed. The supply of money is a stock rather than aflow. Hence, it is represented by a vertical straight line. The moneyheld by all the people in the country is the total supply of moneyheld as shown in Figure 5.4. In this figure, OM is the supply ofmoney. SM is the vertical supply curve of money and LP is thedemand or liquidity preference curve. They intersect with eachother at point E. EM or OR is the equilibrium rate of interest. Itshows that the demand for money is exactly equal to the supply ofmoney. Any change in the demand or supply of money will bringabout a change in the rate of interest. If the supply of money aloneincreases, the equilibrium rate of interest would fall and vice versa.This is shown in Figure 5.5. It can be seen in this figure that theoriginal equilibrium rate of interest is OR. The original supply ofmoney is OM. When the supply of money alone increases to OM1,the equilibrium rate of interest would fall to OR1 and vice versa. On
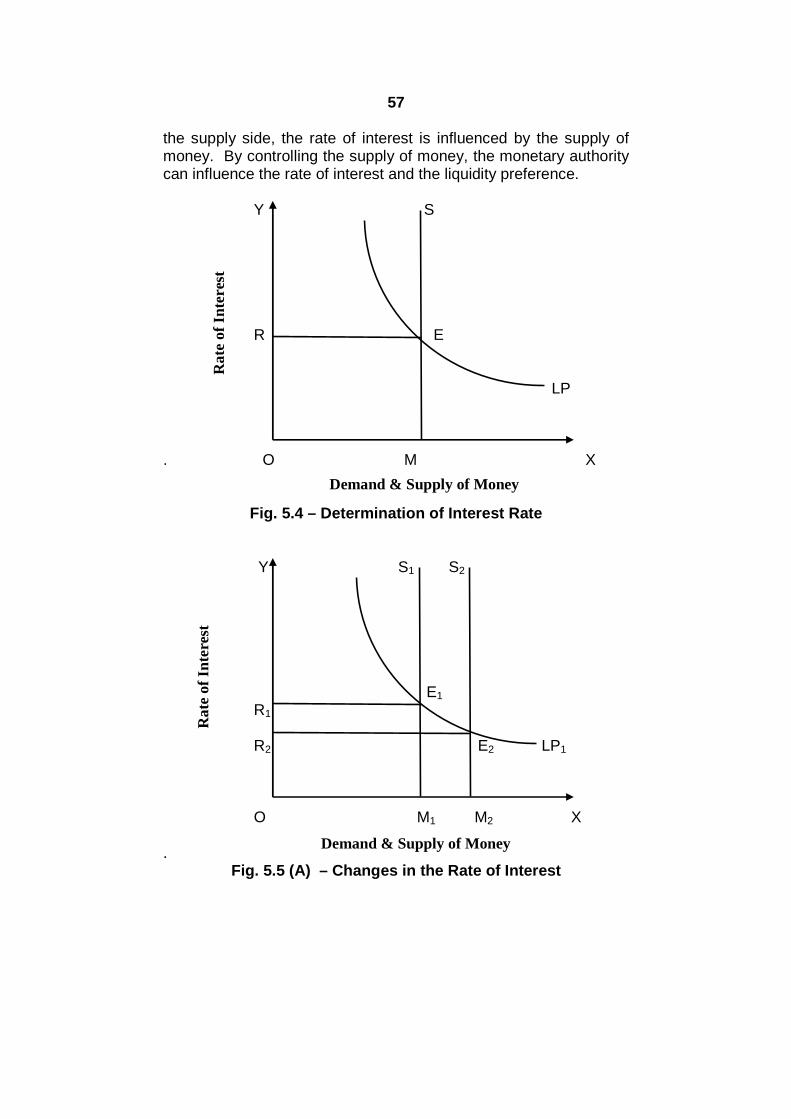
57
the supply side, the rate of interest is influenced by the supply ofmoney. By controlling the supply of money, the monetary authoritycan influence the rate of interest and the liquidity preference.
Y S
R E
LP
. O M X
Fig. 5.4 – Determination of Interest Rate
Y S1 S2
E1
R1
R2 E2 LP1
O M1 M2 X
.Fig. 5.5 (A) – Changes in the Rate of Interest
Ra
teo
fIn
tere
stR
ate
of
Inte
rest
Demand & Supply of Money
Demand & Supply of Money

58
YS1
R2 E2
R1 E1 LP2
LP1
O M1 X.
Fig. 5.5 (B) – Changes in the Rate of Interest
CRITICAL ANALYSIS OF THE LP THEORY OF INTEREST:
The Keynesian theory of interest has been criticized byHansen, Robertson, Knight, Hazlitt, Hutt and others. The followingare the main criticisms:
1. The theory lacks in realism and comprehensiveness:Speculative demand for money is the most importantcomponent which determines interest rate according to Keynes.The theory assumes that people will hold more money by sellingbonds when the rate of interest falls and hold less cash butmore bonds in the case of the rise in the interest rate. However,Robertson does not regard bonds as the only alternative tomoney. The theory is therefore not realistic and lackscomprehensiveness.
2. Methodologically Inadequate: A change in the quantity ofmoney would tend to change the price of the good in the sameproportion but not the price of bonds. There is no functionalrelationship between the price level and the rate of interest.Monetary changes do not have direct or lasting effect on therate of interest. By assuming a functional relationship betweenthe quantity of money and the rate of interest, the Keynesiantheory is found to be methodologically inadequate.
3. Only Speculative Demand for money is considered to berewarding: Keynes believed that money held as a store ofwealth does not bear any fruit whereas money held for
Demand & Supply of Money
Ra
teof
Inte
rest
59
speculative purpose yields rate of interest as a reward.According to WH Hutt, money is as productive as all otherassets and the demand for money assets is a demand forproductive resources.
4. Saving is Essential for Liquidity: Keynes believed that therate of interest is the reward for parting with liquidity and not forsaving. Saving is essential for making investments. Accordingto Viner, “Without saving there can be no liquidity to surrender.The rate of interest is the return for saving without liquidity”.
5. Liquidity Trap does not exist: In reality the liquiditypreference schedule may be perfectly inelastic at a low rate ofinterest. It is wrong to assume that people will expect the rate ofinterest to go up in a depression.
6. Incomplete Theory: Hicks, Hansen, Somers, Lerner andothers says that the rate of interest along with the level ofincome is determined by four factors, namely: the investmentdemand function or MEC, the saving function or theconsumption function, the liquidity preference function and thequantity of money function. Keynes did not bring all thesefactors in his interest theory and therefore failed to provide anintegrated and determinate theory of interest.
5.4 SUMMARY
1. According to Keynes, people hold cash balances on account ofthree reasons or motives. These are the transaction motive, theprecautionary motive and the speculative motive.
2. According to Keynes, transaction motive for holding money isthe need of cash for the current transactions of personal andbusiness expenditure.
3. The amount of cash balances held by people to provide forunforeseen requirements is referred to as precautionarydemand for money or money held under precautionary motive.
4. The transaction and precautionary demand for money cannot beeasily separated in practice and since both the money demandfunctions are income determined and also interest inelastic, theyare collectively known as active balances.
5. The cash balances held by people for speculative purposes areknown as demand for idle cash balances. The speculativemotive for holding cash balances originates from uncertaintyabout the future rate of interest.
6. At a very low rate of interest, the speculative demand for moneyis perfectly elastic i.e., the entire income is held by people in the

60
form of cash balances for speculative purposes. In the situationof liquidity trap, percentage change in the demand for money inresponse to a percentage change in the rate of interest is equalto infinity.
7. The equilibrium rate of interest is determined by the intersectionbetween the demand curve for and supply curve of money. Anychange in the demand or supply of money will bring about achange in the rate of interest.
5.5 QUESTIONS
1. Explain the meaning and functions of money.2. Explain the Keynesian approach to demand for money.3. Critically examine the Liquidity Preference theory of interest.

61
6
INFLATION
Unit Structure :
6.0 Objectives
6.1 Meaning of Inflation
6.2 Demand Pull Inflation, Cost Push Inflation
6.3 Causes of Inflation
6.4 Effects of Inflation
6.5 Measures to Control Inflation
6.6 Summary
6.7 Questions
6.0 OBJECTIVES
To understand the meaning of inflation
To study different causes of inflation
To study effects of inflation in an economy
To study measures to control inflation
6.1 MEANING OF INFLATION
A sustained rise in the general price level over a period oftime is known as inflation. Conversely, a sustained fall in thegeneral price level would be known as deflation. Inflation ismeasured in terms of a price index. For instance in India, we havethe wholesale price index (WPI) and the consumer price index(CPI). The Price Index is based on a basket of goods and services.Within a given basket, the prices of some goods and services mayrise or fall. However, when there is a net increase the price of thebasket, it is called inflation.
Inflation is a rate of change in the price level. The rate ofchange is measured with reference to the base year so that a longterm perspective is obtained with regard to price rise. For allpractical purposes, inflation rate is measured on yearly basis.However, in recent years, the inflation rate is also measured onmonthly and weekly basis. The rate of inflation can be measured

62
as: P = (P1 P0) P0 100. For example, the price indexbased on the Wholesale Prices in India for the year 2003-04 was180.3 and in 2004-05, it was 189.5. The rate of inflation for theyear 2004-05 was 5.1 per cent. Inflation rate measured on thebasis of wholesale price index (WPI) for the period 2005-06 to2012-13 in India is given in Table 6.1.
TYPES OF INFLATION BASED ON RATES OF INFLATION
On the basis of the rate of price rise, inflation is classifiedinto five categories. They are creeping or moderate inflation,walking, running, galloping and hyper inflation. When the rateof price rise is less than three per cent per annum, it is calledcreeping inflation. An inflation rate of about three per cent perannum is considered creeping. When prices creep upwards at amoderate rate, inflation serves as an incentive to investment. As aresult, the rate of investment, employment, output and aggregatedemand rises in the economy and the economy moves into theprosperity phase.
When inflation rate crosses the three per cent mark andremains within single digits i.e. below the 10 per cent mark, itbecomes walking inflation. Walking inflation leads to a much rapidfall in the purchasing power of money. However, the negativeconsequences of single digit inflation are not widely felt and henceit is considered within the tolerable limits. However, both monetaryand fiscal policies are swung into action to control the rate ofinflation and keep it within single digits.
When inflation rate is in double digits, it is known as runninginflation. When prices begin to rise by more than 10 per cent perannum and the rate of inflation accelerates, money begins to flowaway from productive activities into unproductive or speculativeactivities. As a result, the supply of goods and services fall in the
Table 6.1Inflation Rate based on Wholesale Price Index (WPI)
in India for the period 2005-06 to 2012-13.
Year WholesalePrice Index
Inflation Rate (%)P = (P1 P0) P0 100
2005-06 104.5 -2006-07 111.4 111.4 – 104.5/104.5 100 = 6.6%2007-08 116.6 116.6 –111.4/111.4 100 = 4.6%2008-09 126.0 126.0 – 116.6/116.6 × 100 = 8.062009-10 130.8 130.8 – 126.0/126.0 × 100 = 3.802010-11 143.3 143.3 – 130.8/130.8 × 100 = 9.552011-12 156.1 156.1 – 143.3/143.3 × 100 = 8.932012-13 164.8 164.8 – 156.1/156.1 × 100 = 5.57

63
economy and their prices begin to rise more rapidly. Thuscommodity prices rise rapidly for want of investment and prices ofgold, real estate and stocks rise more rapidly because more andmore money is diverted from the productive sector to theunproductive sector.
When prices rise by about 100 per cent annum, the situationis known as galloping inflation and when the inflation rate is over1000 per cent a year, it is called hyper inflation. Both galloping andhyper inflation signals the collapse of the economy. Productiveactivity is at an all time low, people lose confidence in the currencyand the economy looks like more of a barter economy. Duringworld war one, countries like Austria, Hungary, Germany, Polandand Russia experienced hyper inflation. For instancebetween1920-23, the German price index rose from one to onebillion. In 1994, the inflation rate in Georgia was 15000 per centper annum. In 2008, the inflation rate in Zimbabwe was 11.2million per cent. In such situations, the paper on which money isprinted become more valuable than the money itself i.e. the intrinsicvalue of even paper money becomes greater than the face value.Thus if you sell money by kilograms you may get more money inreturn than by exchanging money in the market for goods andservices.
6.2 DEMAND PULL, COST PUSH AND STRUCTUALINFLATION
Broadly speaking, there are three types of inflation whichconstitutes the causes of inflation. Demand side factors will causedemand pull inflation, supply side factors will cause cost pushinflation and structural factors will cause structural inflation. Here inthis section, we will analyze these three major types of inflation.
1. Demand -pull Inflation: Demand pull inflation takes place dueto rise in aggregate demand. Aggregate demand may rise due tocombined effect of higher demand from the various sectors of theeconomy such as the firms, households and the government.According to Keynes, inflation arises when there is an inflationarygap in the economy. Inflationary gap arises when aggregatedemand is greater than aggregate supply at full employment levelof output. Keynes explained inflation in terms of demand pullforces. When the economy is operating at the full employmentlevel of output, supply cannot increase in response to increase indemand and hence prices rise.

64
AS
P4
P3 AD4
AD3
P2
P1 AD2
AD1
O Y1 Y2 Y3
Aggregate Demand & Supply
Fig. 6.1: Demand Pull Inflation
Demand pull inflation is depicted in Fig.6.1. You may notethat aggregate demand and supply curves are measured along theX-axis and the general price level is measured along the Y-axis.The aggregate supply curve AS rises upward in the beginning andbecomes vertical when full employment level of output is achievedat point OYf. This is because the supply of output cannot beincreased once full employment level of output is achieved. Whenthe aggregate demand curve is AD1, the equilibrium is less than fullemployment level and the price level OP1 is determined. Whenaggregate demand increases to AD2, the price level rises to OP2
due to excess demand at price level OP1. Since the economy isoperating at less than full employment level, the real sector of theeconomy responds to rise in prices and hence the output increasesto OY2. When the aggregate demand further rises to AD3, the pricelevel rises to OP3 followed by increase in output to OYf. When theaggregate demand further rises to AD4, the aggregate supply doesnot respond to remain constant at OYf and only the price level risesto OP4. After the full employment level of output the aggregatesupply curve becomes perfectly inelastic and parallel to the Y-axis.
2. Cost-push Inflation:In the absence of rise in aggregate demand, prices may rise
due to increase in cost in terms of higher wages, higher input costsand higher profits. These are known to be autonomous increases incosts. Inflation on account of rise in costs is known as Cost pushinflation.
Pri
ceL
evel
65
a) Wage-push Inflation: Powerful trade unions may bargain forhigher wages and also get it even when the cost of living hasnot changed or the general price level is constant and there isno change in the productivity of labor. When employers haveno choice but to yield to the demands of the trade union, theymay pass on the higher costs to the consumers by charginghigher prices on the goods and services produced. Such asituation leads to Cost-push inflation. In case of Cost-pushinflation, the aggregate demand curve shifts to the left leading tofall in output and rise in the price level. Cost push inflation isalso known as stagflation. Cost-push inflation is depicted inFig. 6.2
b) Profit-push Inflation: Firms operating under imperfect marketconditions such as monopoly, monopolistic and oligopolymarkets may hike their profit margins either autonomously orthrough collusion. When prices rise on account of hike in profitmargins, it is called profit-push inflation. Profit push inflationmay lead to cost push inflation if the products are used as inputsby other firms. When prices of capital goods, intermediategoods and raw materials are increased to increase the profitmargin by firms operating under imperfect competition andwhen these goods are used as inputs by other firms, the costof production of these firms go up, thereby leading to cost pushinflation.
c) Input Cost Inflation: Supply shocks leading to rise in inputcosts is an important cause of input-cost inflation. For instance,the oil price shocks of 1970s. The sharp rise in world oil pricesduring 1973-75 and in 1979-80 created supply shocks and cost-push inflation. Recent increases in the prices of crude oil alsocaused the inflation rate to go up. For instance, the weeklyinflation rate in India was 12.34% during the second week ofSeptember 2008 as a result of sharp increase in theinternational prices of crude oil to $150 per barrel. Thegovernment of India took monetary and fiscal measures to bringdown the prices. Fortunately, the crude oil prices also fell belowthe $50 per barrel mark in January 2009 and the weekly inflationrate in India also fell down to 6.4 per cent from the high of 12.34per cent in September 2008.
d) in January 2009 and the weekly inflation rate in India also felldown to 6.4 per cent from the high of 12.34 per cent inSeptember 2008.

66
AS2
AS1
P2 E2
P1 E1
AD
O Y2 Y1
Aggregate Output
Fig. 6.2 Cost-push Inflation
AS3
AS2
AS1
P3 E3
P2 E2
P1 E1
AD
O Y3 Y2 Y1
Aggregate Output
Fig. 6.3 Cost-push Inflation & Direct and IndirectEffects of Supply Shocks
Cost push inflation as a result of rise in input prices isdepicted in Fig. 6.3. Oil price shocks and rise in the price of otherinputs have direct and indirect effects on the price level. When
Pri
ceL
evel
Pri
ceL
evel

67
prices actually rise due to rise in input costs, the workers revisetheir price expectations upward. With upward price expectations,real wage rate declines and hence less labor is supplied at thegiven nominal wage rate. With the upward revision in the expectedprice level, the aggregate supply curve shifts to the left. This isknown as the indirect effect of an expected upward price revision.In Fig.6.3, you will notice that the AS1 curve shifts to the left to AS2
and the price level rises to P2 on account of oil price shock. This isknown as the direct effect of a rise in the input cost. Now that theprice level has gone up, the workers will revise the expected pricelevel to P2 . This pushes the AS curve further left to AS3 and furtherrise in price level to P3. The movement from AS2 to AS3 is knownas the indirect effect of oil price shock.
6.3 CAUSES OF INFLATION
The causes of inflation are classified into two categories.They are demand side and supply side factors. These factors arediscussed in this section.
Demand side Factors Causing Inflation:
Inflation is caused by a rise in aggregate demand overaggregate supply. Factors causing in aggregate demand overaggregate supply are as follows.
1. Increase in Public Expenditure: Public expenditure has beenincreasing by leaps and bounds since the emergence of theWelfare State in the second half of the 20th century. Particularlyin mixed economies with a pre-dominant public sector, the risein public expenditure has been phenomenal. The interventionistrole of the State has increased over time and the governmentsare seen to be responsible for building social and economicinfrastructure.
For instance, Government expenditure has regularly increasedin India. The Government expenditure in India has continuouslyincreased since the beginning of economic planning. Risinggovernment expenditure has been an important cause ofinflation in India. The government or public expenditure was15.3 per cent of GDP in 1960-61 and since then it has been ona continuous rise. In 1990-91, it was 31 per cent of the GDP. Itfurther rose to 31.2 per cent in 2000-01. About 48% of thepublic expenditure in India is on non-developmental activities.Expenditure on defense, interest payments and governmentalmachinery constitutes non-developmental expenditure.Expanding governmental machinery, rising defenseexpenditure, expenditure on subsidies and growing public

68
borrowing has contributed to the rise in non-developmentalexpenditure. While non-developmental expenditure increasesaggregate demand in the economy, it does not increaseaggregate supply and hence price rise.
2. Deficit Financing: There is no surplus or even a balancedbudget. Governments do not spend according to their incomes.Government budgets are always deficit budgets which means,government expenditure is always greater than income.Increasing fiscal deficit is a general feature of the governmentbudgets of developing countries. In order to finance the budgetdeficit, governments take recourse to public borrowing and alsoborrowing from their Central Banks. In order to raise resourcesfor repaying public debt, governments may raise the existing taxrates or raise new taxes. Deficit financing leads to rise in publicexpenditure and hence rise in aggregate demand, therebycausing inflation.
For example, the expenditure of the government of India hasbeen more than its income. The gap between expenditure andincome or the deficit is filled through deficit financing. Thedeficit is financed by borrowing funds from the banking system.If the borrowed funds are used for unproductive purposes, theywill give rise to inflation. The government of India has used theborrowed funds for non-developmental purposes in a carelessmanner. The fiscal deficit during the year 2002-03 wasRs.145072 crore and in the year 2007-08, it was Rs.150948crore.
3. Increase in Money Supply: Increase in money supply overand above the quantity of output produced in the economywould result in price rise. Irving Fisher’s quantity theory ofmoney explains how increase in money supply without aproportionate increase in output leads to rise in prices and fall inthe value of money. Commenting on the effect of money supplyon prices, Dr. C Rangarajan, former Governor of the ReserveBank of India states that “Money has an impact on both outputand price. The process of money creation is a process of creditcreation. Money comes into existence because credit is giveneither to the government or the private sector or the foreignsector. Since credit facilitates the production process, it hasfavorable impact on output. But at the same time the increasedmoney supply raises the demand with an upward pressure onprices”. Dr. Rangarajan has therefore accepted the fact inIndia, price effect of money supply is greater than output effect.
If increase in money supply was the only reason for rising pricesthen the rise in prices should be equal to the difference betweenthe increase in money supply and increase in output. In the
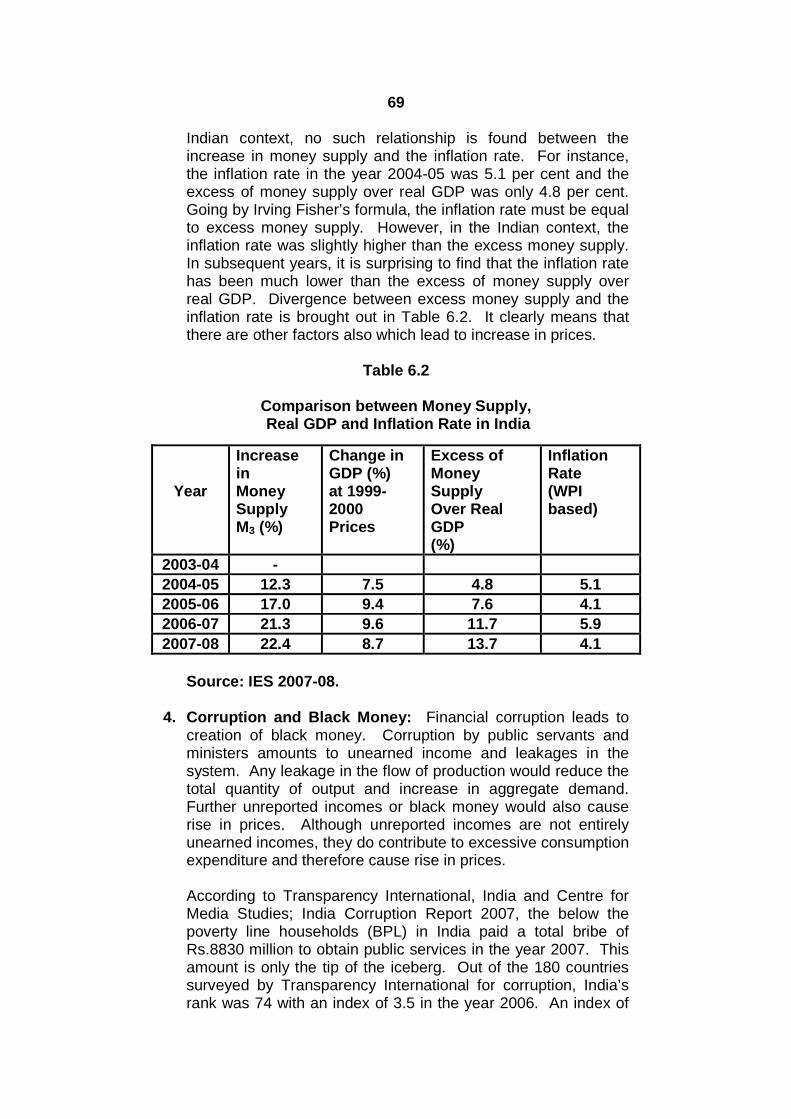
69
Indian context, no such relationship is found between theincrease in money supply and the inflation rate. For instance,the inflation rate in the year 2004-05 was 5.1 per cent and theexcess of money supply over real GDP was only 4.8 per cent.Going by Irving Fisher’s formula, the inflation rate must be equalto excess money supply. However, in the Indian context, theinflation rate was slightly higher than the excess money supply.In subsequent years, it is surprising to find that the inflation ratehas been much lower than the excess of money supply overreal GDP. Divergence between excess money supply and theinflation rate is brought out in Table 6.2. It clearly means thatthere are other factors also which lead to increase in prices.
Table 6.2
Comparison between Money Supply,Real GDP and Inflation Rate in India
Source: IES 2007-08.
4. Corruption and Black Money: Financial corruption leads tocreation of black money. Corruption by public servants andministers amounts to unearned income and leakages in thesystem. Any leakage in the flow of production would reduce thetotal quantity of output and increase in aggregate demand.Further unreported incomes or black money would also causerise in prices. Although unreported incomes are not entirelyunearned incomes, they do contribute to excessive consumptionexpenditure and therefore cause rise in prices.
According to Transparency International, India and Centre forMedia Studies; India Corruption Report 2007, the below thepoverty line households (BPL) in India paid a total bribe ofRs.8830 million to obtain public services in the year 2007. Thisamount is only the tip of the iceberg. Out of the 180 countriessurveyed by Transparency International for corruption, India’srank was 74 with an index of 3.5 in the year 2006. An index of
Year
IncreaseinMoneySupplyM3 (%)
Change inGDP (%)at 1999-2000Prices
Excess ofMoneySupplyOver RealGDP(%)
InflationRate(WPIbased)
2003-04 -
2004-05 12.3 7.5 4.8 5.1
2005-06 17.0 9.4 7.6 4.1
2006-07 21.3 9.6 11.7 5.9
2007-08 22.4 8.7 13.7 4.1

70
10 indicates complete freedom from corruption and an index ofzero indicates total corruption. Countries like Finland, Denmarkand New Zealand with a CPI (corruption perception index) scoreof 9.4 were found to be least corrupt. Countries with a CPI scoreof less than five are considered to have serious problem. Indiais therefore one of the most seriously corrupted countries in theworld. Myanmar and Somalia with a CPI score of two were themost corrupt countries of the world.
Supply Side Factors Causing Inflation:
Supply lags in the economy causes aggregate supply to fallshort of aggregate demand and cause price rise. These supplyside causes are as follows.
1. Fluctuating Agricultural Growth: The rate of growth of outputof food grains must be equal to the rate of growth of demand forfood grains. Demand for food grains increases due to rise inincomes and rise in population. In poor countries, the incomeelasticity of demand for food grains is high. In poor countries,the agricultural sector is under-developed and largelydependent on nature. Thus when the agricultural sector fails toproduce adequate output, the prices of agricultural goods rise.
In the Indian context, population growth rate and the rate ofgrowth of agricultural output has remained the same in the lasttwenty years. Indian agriculture is dependent on monsoons.Thus bad and poor monsoons mean crop failure and rise in foodprices leading to rise in the general price level in the country. Inthe year 2004-05, food production fell by seven per cent. In thesubsequent two years, food production was by 5.2 and 4.2 percent but once again fell to 0.9 per cent in the year 2007-08. Thegrowth in real national income was much higher than the rise infood production thereby causing the prices to rise.
2. Hoarding of Essential Goods: When the agricultural sectorfails, food pries begin to rise more rapidly than non-food prices.The problem of food price rise is compounded by hoarding ofagricultural goods by traders. Artificial scarcity is created byboth whole-sellers and retailers. As a result, there is muchgreater increase in prices than what is justified by realshortages. In the Indian context, both the big farmers andagricultural traders indulge in hoarding of agricultural goodsduring the periods of crop failure. In times of food scarcity,hoarding of food grains and other food products only helps theprices to rise further.
3. Inadequate Rise in Industrial Production: In the prosperityphase of the business cycle, there is a sustained rise in
71
investment demand which causes a sustained rise in demandfor industrial goods. If the capital goods industry fails torespond to the rise in demand, the prices of industrial goods willrise and when the prices of industrial goods goes up, the pricesof consumer goods also rise. In the Indian context, during theperiod 1995-96 to 2001-02, the industrial sector registered slowgrowth. Inadequate increase in industrial production has alsobeen an important cause of inflation in India.
6.4 EFFECT OF INFLATION
EFFECT OF INFLATION ON PRODUCTION AND ECONOMICGROWTH, DISTRIBUTION OF INCOME AND WEALTH ANDCONSUMPTION AND ECONOMIC WELFARE
Inflation is a theft of income of the unprotected segments ofthe society. Inflation is therefore a crime against the poor whoexperience a fall in their real incomes during a period of sustainedprice rise. Inflation affects the three most important functions of aneconomy namely; production, consumption and distribution in anadverse manner.
(A)Effect of Inflation on Production and Economic Growth:
In economies where labor is largely unorganized, single digitor creeping inflation will increase profitability and therefore lead togreater investment, employment, output, income, demand andprices. This is because the wages of unorganized labor is notindexed to inflation. The real wages of unorganized labor willalways fall overtime during inflation whether anticipated or not. Inthe case of unanticipated inflation, the real wages of organizedlabor will also fall and may be compensated with a time lag. Thefirms will gain during the intervening period between unanticipatedprice rise and its compensation to labor. Thus from the point ofview of production and economic growth, single digit inflation has apositive impact.
(B)Effect of Inflation on Distribution of Income and Wealth:
The impact of inflation with regard to distribution of incomeand wealth is not even on all sections of the society. In case oflabor, the section that is protected from inflation is the organizedlabor whose wages and salaries are indexed to inflation. Butunorganized labor is not protected from inflation and therefore theirreal incomes decrease on account of inflation. Similarly debtorswho have borrowed money on fixed interest gain on account ofinflation because real interest rate falls during a period of risinginflation while creditors lose because at times the real interest rate

72
may be zero and even negative. Similarly people holdingownership capital like equity shares, balanced and growth fundsmake capital gains because of rising profits of business enterpriseswhile people holding creditor capital like bonds, debentures, fixeddeposits and income funds lose due to the fall in real interest rates.Broadly speaking, during an inflationary period, households loseand firms gain. Hence it is said that during inflation the richbecome richer and poor become poorer.
(C)Effect of Inflation on Consumption and Economic Welfare:
Inflation is known as a poor man’s tax. It reduces thepurchasing power of money earned by the poor people and hencetheir economic welfare. The workers who do not get compensatedfor the increase in price rise, experience reduction in real incomesbecause their nominal income remains constant over a long periodof time. Even those workers who get compensated for the pricerise lose purchasing power during the intervening period betweenthe rise in prices and the compensation in price rise. For instance,the Central and State Government employees in India getcompensated for inflation twice in a year and there is always a lagof six months before such compensations are given. Economicwelfare depends upon consumption of goods and services andduring a period of sustained rise in prices, the people are able toconsume less goods and services. As a result, there is a loss ofeconomic welfare.
6.5 MEASURES TO CONTROL INFLATION
Inflation is the result of excess demand over the supply ofgoods and services. Inflation management, however, needs bothdemand and supply management as well. Both monetary andfiscal measures can be adopted to control inflation.
Attempt to control inflation in India was made for the firsttime in the early sixties after experiencing rapid rise in prices duringthe second five year plan. However, measures taken by thegovernment were not effective to control inflation. Prices continuedto rise throughout the planning era except the first five year plan.One of the important tasks of the government was to maintain pricestability under the new economic policy. Accordingly, thegovernment undertook various measures to control inflation in thecountry. These measures were as follows:
(A)MONETARY POLICY MEASURES:
The Central Bank’s policy with regard to cost and availability ofcredit is known as monetary policy. The RBI can raise the rate ofinterest and increase the cost of credit and also reduce the
73
availability of credit. Quantitative instruments of credit control suchas the bank rate, the cash reserve ratio and the statutory liquidityratio can be used to reduce aggregate demand in the economy.Increase in the bank rate by the RBI will increase the marketinterest rate in the country. This will reduce the demand for creditand further lead to reduction in aggregate demand. Similarly, if theCRR and SLR are increased, the banks will have less money attheir disposal to give loans and advances to the borrowers.Monetary expansion due to rising foreign exchange reserves wascontrolled by sterilization of foreign exchange reserves.Commenting on the effect of money supply on prices, Dr. CRangarajan, former Governor of the Reserve Bank of India statesthat “Money has an impact on both output and price. Since creditfacilitates the production process, it has favorable impact on output.But at the same time the increased money supply raises thedemand with an upward pressure on prices”. Dr. Rangarajan hastherefore accepted the fact in India that price effect of moneysupply is greater than output effect.
1. The Bank Rate: Bank rate is the rate at which Reserve Bankprovides loans to the commercial banks in the country. It is alsocalled the discount rate because the Central Bank provides finance tocommercial banks by rediscounting bills of exchange. The bankrate in India was 10 per cent in the 1980s. It was raised to 12 percent in October 1991. The bank rate was not a very effective incontrolling money supply in the pre-reform period. However, in thepost reform period, the bank rate has been made more effective andin keeping with the objective of low inflation and high economicgrowth, the bank rate was reduced to 6 per cent in April 1998 and itcontinued to be retained at 6 per cent until July 2010. The bank ratehowever went up to 9.5 % as on 29th March 2012 on account ofinflationary pressures in the Indian economy. Thereafter, the bankrate was brought down to 8.25% in view of recessionary trend in theIndian economy. However, due to sustained inflationary pressures,the bank rate was raised to 10.25% in July 2013.
2. The Repo and Reverse Repo Rates: The bank rate as acredit control instrument is losing importance. The repo andreverse repo rates are becoming important in deciding interestrate trends in the Indian economy. The Repo (sale andrepurchase agreement) is a swap deal involving the immediatesale of securities and simultaneous purchase of those securitiesat a future date at a predetermined price. These swap dealstake place between the RBI and financial institutions. The repoor the repurchase rate is the rate at which the Central Bankprovides funds to banks. Continuing with its anti-inflationarymonetary policy stance, between March, 2010 and April, 2011,the RBI has raised the policy rates six times. The repo rate was5% in March 2010 and in April, 2011 the repo rate went up to6.75%. The repo rate was further raised to 8.5 % on 25th
October, 2011 on the occasion of the Second Quarter Review of

74
the Monetary Policy for the year 2011-12. The reverse reporate is the rate at which the Central Bank takes funds frombanks and the reverse repo rate in March 2010 was 3.5% and inApril, 2011 was 5.75 per cent. In October, 2011, the reverserepo rate was raised to 7.5 per cent. In June 2013, the reporate was 7.25 and the reverse repo rate was 6.25%. Until July2013, these rates have been retained by the RBI.
3. Open Market Operations: Open market operations means thebuying and selling of securities by the central bank. The sale ofsecurities leads to contraction of credit and purchase ofsecurities lead to credit expansion. The RBI uses switchoperations for buying and selling government securities. Switchoperations involve purchase of one loan against sale of another.The use of switch operations prevents unrestricted increase inmoney supply. Recently, in January 2011, when the SLR wasreduced from 25% to 24%, the RBI neutralized the excessliquidity through OMOs. The SLR was further reduced to 23%in the year 2012 and continues to remain at 23%. The RBIconducted Open Market Sales of Government of IndiaSecurities of Rs.12,000 crore on July 18, 2013.The RBI,however, could gain Rs. 2,532 crore from the auction, as rest ofthe bids received had quoted yield rates higher then acceptableto the RBI.
4. The Cash Reserve Ratio: The CRR is an effective instrumentof credit control. It refers to the cash which the banks have tomaintain with the Reserve Bank as a certain percentage of theirdemand and time liabilities. Changes in the CRR bring aboutchanges in the loanable resources of the banks, particularly thecommercial banks. In the late 1980s, there was a rapid growthin money supply and hence the CRR was raised from 10 percent to 15 per cent. In the post reform period, the CRR wasbrought down according to the recommendation of theNarasimham Committee to below the 10 per cent level.However, in August 1994, the CRR was raised to 15 per cent tocontrol the inflationary trends in the economy. Since theninflationary pressures were reduced in the economy andaccordingly the CRR was progressively reduced to 4.5 per centin June 2003. The RBI had to increase the CRR to five per centin October 2004 and further to 7.5 per cent in October 2007. InAugust 2008, the CRR was raised to nine per cent. As part ofthe anti-recessionary policy in the wake of global financial crisisof 2008-09, the CRR was reduced to five per cent in January,2009. It was raised to 5.75 per cent in February, 2010 andfurther to six per cent in April 2010 as inflationary pressuresstarted building in the economy on account of the huge fiscalstimulus that was given by the government in the aftermath ofthe financial crisis of 2008-09 and its negative impact on
75
economic growth in India. In the first quarter review of themonetary policy for the year 2010-11, released in July 2010, theCRR was retained at 6 per cent by the RBI. Subsequently, theCRR was reduced to 4.75 per cent in March 2012 to easeliquidity conditions in the money market. In June 2013, the CRRwas 4.0% and it continues to be 4 % in July 2013.
5. The Statutory Liquidity Ratio: The Banking Regulation(Amendment) Act 1962 provides for maintaining a minimumSLR of 25% by the banks against their net demand and timeliabilities. The SLR is fixed at 25% for co-operative banks, non-scheduled banks and the regional rural banks. In case ofcommercial banks, it can be raised to 40%. The RBI has usedthis instrument quite often during the 70s and 80s. In September1990, the SLR was raised to 38.5 per cent and it remained atthis level up to January 1993. This was done to controlinflationary pressures and make larger resources available tothe government. The Narasimham Committee recommendedreduction of SLR to 25 per cent and accordingly the SLR wasreduced to 25% in a phased manner in October, 1997. InNovember 2008, the SLR was further reduced to 24 per centand in October, 2009, the SLR was restored to 25 per cent onceagain. However, in December 2010, the SLR was once againreduced to 24%. The SLR was further reduced to 23% in theyear 2012 and continues to remain at 23%.
(B)FISCAL POLICY:
The fiscal policy of a country refers to the policy of theGovernment with regard to income and expenditure. Expansionaryfiscal policy is adopted during the periods of economic stability orduring the times of recession. In contrast, a tight fiscal policy isadopted when the economy is in the grip of inflation. In order topromote growth, the government may reduce both direct andindirect taxes and increase the level of aggregate demand. Thegovernment may also increase public expenditure to increase thelevel of aggregate demand and achieve a higher economic growthrate. However, in order to control inflation, the Government mayraises taxes, add new taxes and reduce public expenditure byreducing the fiscal deficit.
The Government of India made attempts to remove fiscalimbalance from 1991-92 by bringing down fiscal deficit from 6.6 percent to 4.7 per cent of GDP. However, in 1993-94 the fiscal deficitrose to 6.4 per cent. It was 5.9 per cent in 2001-02. In 2005-06, thefiscal deficit was brought down to below the five percent mark.During the decade 1995-2005, the government has been able tokeep the average inflation rate below the five per cent level.However, between 2005-06 and 2012-13, the government had

76
failed to control inflation rate and fiscal deficit once again went up to6.0 and 6.5 % in the years 2008-09 and 2009-10. The fiscal deficitduring the year 2010-11 was Rs.3, 69,043crores and in the year2011-012, it was Rs.4, 12,817crores. The budget for 2010-11announced going back to fiscal consolidation and the projectedfiscal deficit for 2010-11, 2011-12 and 2012-13 is 5.5%, 4.8% and4.1 % respectively. The actual fiscal deficit figures in the years2010-11 and 2011-12 were below the projected figures. However,fiscal deficit in 2008-09 and 2009-10, had gone up due to fiscalintervention made by the Government of India in the wake of theGlobal Financial Crisis. Near double digit inflation and a very highfood price inflation in the last three years is the price paid by thepeople of India for the fiscal profligacy of the Government of India.
(C)SUPPLY SIDE MEASURES:
Inflation is the result of mismatch between aggregatedemand and aggregate supply. Both monetary and fiscal policiescan act on the demand and supply side through interest rates,money supply, taxation and public expenditure. However, somemeasures can directly influence the supply of goods and services.These measures are explained below.
1. Public Distribution System: The Public Distribution Systemwas established in the country to provide essential consumergoods particularly to the poor people at low prices. The entirecountry is covered by this system. However, one cannot saythat the system has been able to control price rise. Theagricultural price support policy of the government has workedagainst the objective of price stability. As a result of faultyagricultural policy, food production in India had failed to keeppace with rising demand for food. The recently enacted FoodSecurity Act by the Government of India promises cheap andheavily subsidized food for about 65 % of the population. Itremains to be seen whether this measure will bring down foodprice inflation in the coming years.
2. Import of Essential Commodities: In order to improve thesupply of essential commodities, the government of India hadallowed food imports. During 1995-96, imports of edible oils,palmolein, sugar and pulses were allowed. The FoodCorporation of India sold rice and wheat in the open market tocontrol market prices of these food grains. Excise duties on anumber of industrial products were reduced to improve thesupply of manufactured goods.
3. Capacity Utilization and Increase in Aggregate Supply: Theproductive capacity of the economy should be fully utilized.Widespread unemployment can only lead to rising price levelbecause the unemployed generates demand for goods and
77
services without contributing to their production. The productiveapparatus in the country consisting of farm lands, industries,services, forestry, fishing, mining etc must be fully utilized.Under utilization of the potential and sometimes the actualproductive capacity will lead to shortage of aggregate supplyand hence price rise.
(D) INCOME POLICY:
Income freeze is an important policy measure to counterinflation. Here income freeze refers to inflationary income.Revision in wage rates on account of payment of dearnessallowance to organized workers and revision in wage rates to allkind of workers due to rise in the cost of living is an example ofwage push inflation. Factor incomes such as rent, wages, interestand profit should reflect the marginal productivity of the givenfactor. Policy that delinks factor incomes from the price level mayhelp stabilizing the prices and may be the price level comes back tothe original level in due course. However, the policy of freezingonly wages will not be accepted by organized labor. The argumentthat wage rate must reflect the marginal productivity of labor iseconomically sound. But the same argument must be extended toother factors of production.
6.6 SUMMARY
1. A sustained rise in the general price level over a period of timeis known as inflation.
2. On the basis of the rate of price rise, inflation is classified intofive categories. They are creeping or moderate inflation,walking, running, galloping and hyper inflation.
3. Keynes explained inflation in terms of demand pull forces.When the economy is operating at the full employment level ofoutput, supply cannot increase in response to increase indemand and hence prices rise.
4. In the absence of rise in aggregate demand, prices may risedue to increase in cost in terms of higher wages, higher inputcosts and higher profits. These are known to be autonomousincreases in costs. Inflation on account of rise in costs is knownas Cost push inflation.
5. Inflation affects the three most important functions of aneconomy namely; production, consumption and distribution inan adverse manner.
6. Inflation is the result of excess demand over the supply of goodsand services. Inflation management, however, needs bothdemand and supply management as well. Both monetary andfiscal measures can be adopted to control inflation.

78
6.7 QUESTIONS
1. Explain the concept of inflation and state with example as tohow the inflation rate is measured?
2. Explain the types of inflation based on rates and its impact onthe economy.
3. Explain the concept of Demand pull inflation and the factorscausing demand pull inflation.
4. Explain the concept of Cost push inflation and the factorscausing Cost push inflation.
5. Explain the demand and supply side factors affecting inflation.
6. Explain the effects of inflation on production, distribution andconsumption.
7. Explain the measures to control inflation.
79
7
PHILIPS CURVE
Unit Structure :
7.0 Objectives
7.1 Introduction
7.2 Keynesian Explanation of the Phillips Curve
7.3 Collapse of the Phillips Curve Hypothesis
7.4 Natural Unemployment Rate Hypothesis and the theory ofAdaptive Expectations
7.5 Long Run Phillips Curve and the theory of AdaptiveExpectations
7.6 Rational Expectations and the Long Run Phillips Curve
7.7 Relationship between the Short Run and the Long Run PhilipsCurve
7.8 Summary
7.9 Questions
7.0 OBJECTIVES
To study the Keynesian explanation of the Phillips Curve
To understand the collapse of the Philips Curve Hypothesis
To study the Natural Unemployment Rate Hypothesis and theTheory of Adaptive Expectations
To study Long run Phillips Curve and the Theory of AdaptiveExpectations
To study Rational Expectations and the Long run Phillips Curve
To understand the relationship between the Short run and Longrun Phillips Curve
7.1 INTRODUCTION
Economic growth without inflation and unemployment is theobjective behind macro-economic policies of modern times.However, in the short term, there seems to be a trade-off betweeninflation and unemployment and hence macro-economic policy
80
makers need to balance between inflation, economic growth andunemployment. A low inflation rate is seen to accompany lowereconomic growth rate and higher unemployment whereas a highinflation rate is seen to accompany higher economic growth rateand lower unemployment. Here, in this chapter, we look at thePhillips curve which was the first explanation of its kind to show thenegative relationship between unemployment and inflation rate.We also look at the long run picture and see whether the negativerelationship sustains in the long run.
In 1958, AW Phillips, a professor at the London School ofEconomics published a study of wage behavior in the UnitedKingdom for the years 1861 and 1957. Phillips found an inverserelationship between the rate of unemployment and the rate ofinflation or the rate of increase in money wages. The higher therate of unemployment, the lower the rate of wage inflation i.e. thereis a tradeoff between wage inflation and unemployment. ThePhillips curve shows that the rate of wage inflation decreases withthe increase unemployment rate. Assuming Wt as the wages in thecurrent time period and Wt+1 in the next time period, the rate ofwage inflation, gw, is defined as follows:
Wt+1 - Wt
gw = ———— ……..(1)Wt
By representing the natural rate of unemployment with u*, thePhillips curve equation can be written as follows:
Gw = - ε (u – u*) ……... (2)
where ε measures the responsiveness of wages to unemployment.This equation states that wages are falling when the unemploymentrate exceeds the natural rate i.e. when u > u*, and rising whenunemployment is below the natural rate. The difference betweenunemployment and the natural rate, u – u* is called theunemployment gap. Let us assume that the economy is inequilibrium with stable prices and the level of unemployment is atthe natural rate. At this point, if the money supply increases by tenper cent, the wages and the price level must rise by ten per cent toenable the economy to be in equilibrium. However, the Phillipscurve shows that for wages to rise by ten per cent, theunemployment rate will have to fall. A fall in the unemployment ratebelow the natural level will lead to increase in wage rates andprices and the economy will ultimately return to the full employmentlevel of output and unemployment. This situation can bealgebraically stated by rewriting equation one above as follows.
Wt+1 = Wt [1 - ε (u – u*)] ……… (3)Thus for wages to rise above their previous level,
unemployment must fall below the natural rate. The Phillips curve

81
relates the rate of increase of wages or wage inflation tounemployment as denoted by equation two above, the term ‘Phillipscurve’ over a period of time came to be used to describe a curverelating the rate of inflation to the unemployment rate. Such aPhillips curve is depicted in Fig. 7.1.
You may notice that when the rate of inflation is ten per cent,the unemployment rate is three per cent and when the rate ofinflation is five per cent, the rate of unemployment increases toeight per cent. Empirical or objective data collected from otherdeveloped countries also proved the existence of Phillips Curve.Economists believed that there existed a stable Philips Curvedepicting a tradeoff between unemployment and inflation. Thistrade-off presented a dilemma to policy makers. The dilemma wasa choice between two evils, namely: unemployment and inflation.In a dilemma, you chose a lesser evil and inflation is definitely alesser evil for policy makers. A little more inflation can always betraded off for a little more employment. However, further empiricaldata obtained in the 70s and early 80s proved the non-existence ofPhillips Curve. During this period, both Britain and the USAexperienced simultaneous existence of high inflation and highunemployment. While prices rose rapidly, the economy contractedalong with more and more unemployment.
Phillips Curve10 -
9 -
8 -
7 -
6 -
5 - PC
0 1 2 3 4 5 6 7 8
Rate of Unemployment (%)
Fig.7.1 – Phillips Curve
Rat
eo
fIn
fla
tio
n(%
)

82
7.2 KEYNESIAN EXPLANATION OF PHILLIPSCURVE
The explanation of Phillips curve by the Keynesianeconomists is shown in Fig. 7.2. Keynesian economists assumethe upward sloping aggregate supply curve. The AS curve slopesupwardly due to two reasons. Firstly, as output is increased in theeconomy, the law of diminishing marginal returns begins to operateand the marginal physical product of labor (MPPL) begins todecline. Since the money wages are fixed, a fall in the MPPL leadsto a rise in the marginal cost of production because MC = W/ MPPL.
Secondly, the marginal cost goes up due a rise in the wage rate asemployment and output are increased. Following rise in aggregatedemand, demand for labor increases and hence the wage rate alsoincreases. As more and more labor is employed, the wage ratecontinues to rise and the marginal cost of firms increases. Youmay notice that in Panel (a) of Fig.7.2 that with the initial aggregatedemand curve AD0 and the given aggregate supply curve AS0, theprice level P0 and output level Y0 are determined. When theaggregate demand increases, the AD0 curve shifts to the right andthe new aggregate demand curve AD1 intersects the aggregatesupply curve at point ‘b’. Accordingly, a higher price level P1 isdetermined along with a rise in GNP to Y1 level. With the increasein the real GNP, the rate of unemployment falls to U2. Thus the risein the price level or the inflation rate from P0 to P1, theunemployment rate falls down thereby depicting an inverserelationship between the price level and the unemployment rate.Now when the aggregate demand further increases, the AD curveshifts to the right to become AD2. The new aggregate demandcurve AD2 intersects the aggregate supply curve at point ‘c’.Accordingly, the price level P2 and output level Y2 is determined.The level of unemployment now falls to U3. In Panel (b) of Figure7.2, points a, b and c are plotted and these points corresponds tothe three equilibrium points a, b and c in Panel (a) of the figure.Thus a higher rate of increase in aggregate demand and a higherrate of rise in price level are related with the lower rate ofunemployment and vice versa. The Keynesian economists werethus able to explain the downward sloping Philips curve showinginverse relation between rates of inflation and unemployment.

83
AS0
PhillipsCurve
P2 C P2 C
P1 b AD2 P1 ba a
P0 AD1 P0
AD0
0 Y0 Y1 Y2 0 U1 U2 U3
Real GNP Rate of Unemployment
Fig.7.2 – Keynesian Explanation of Phillips Curve
7.3 COLLAPSE OF THE PHILLIPS CURVEHYPOTHESIS (1971-91)
The Phillips Curve hypothesis was accepted as a cure toincrease the level of employment and income in the sixties. Itbecame a macroeconomic tool to explain the tradeoff betweeninflation rate and unemployment rate. It suggested that policymakers could choose different combinations of unemploymentinflation rates. Policy makers may choose low unemployment andhigh inflation as long as it is politically and economically expedient.However, the stable relationship between higher inflation and lowerunemployment as seen in the sixties could not be replicated in theseventies and thereafter, particularly in the United States and GreatBritain. It was seen that both inflation rate and unemployment ratehad increased on numerous occasions and the tradeoff had thusdisappeared. Further, there cannot be a long run tradeoff betweeninflation and unemployment because in the long run the aggregatesupply curve becomes vertical and any further expansion after thepoint of full employment is reached will only add to the price levelwithout adding anything to income, employment and output. Thusthere is no permanent unemployment-inflation trade-off. Dataobtained in the seventies and thereafter indicated a shift in thePhillips curve i.e. in various years, at a given rate of inflation, thePhillips curve either shifted to the left or to the right, indicatingthereby that at times, given the inflation rate, unemployment ratehas increased or decreased. The stable relationship betweeninflation rate and unemployment rate thus was proved to be non-existent.
Pri
ceL
evel
PC

84
Causes of Shift in Phillips Curve
The shifts in the Phillips curve according to Keynesians isdue to adverse supply shocks experienced in the seventies in theform of unprecedented oil price hikes. Adverse supply shocks gaverise to the phenomenon of Stagflation and the breakdown of thePhillips curve hypothesis. The impact of adverse supply shocks onnational product and the price level is depicted in Fig. 7.3. Theoriginal aggregate demand and supply curves AD0 and AS0 are inequilibrium at point E0. Accordingly, the price level P0 and nationaloutput Y0 is determined. The oil price hike initiated by the Oil andPetroleum Exporting Countries (OPEC) an oil cartel of oil producingMiddle East countries contributed to the rise in cost of production ofa large number of goods and services in which oil is used as aninput. Increase in the cost of production caused the aggregatesupply curve to shift to the left in the upward direction, therebycausing the price level to rise along with a decrease in nationaloutput. Notice that the new aggregate supply curve AS1 nowintersects the aggregate demand curve AD0 at point E1 andaccordingly the new price level P1 is determined. However, at ahigher price level P1, the national output has fallen to Y1 leading torise in unemployment. Such a situation is explained in terms ofstagflation where in both unemployment and price level increases.This new phenomenon experienced, particularly by the UnitedStates in the seventies and thereafter has caused the shift in thePhillips curve. Stagflation, thus, consigned the Phillips curvehypothesis to the pages of economic history.
AS1
AS0
P1 E1
P0 E0
AD0
O Y1 Y0
Aggregate Output
Fig. 7.3 – Adverse Supply Shock, Stagflation andRejection of the Phillips Curve Hypothesis
Pri
ceL
evel

85
7.4 NATURAL UNEMPLOYMENT RATEHYPOTHESIS AND THE THEORY OF ADAPTIVEEXPECTATIONS
Milton Friedman put forward the concept of ‘natural rate ofunemployment’ to prove that the Phillips curve phenomenon doesnot operate in the long run and that the long run Phillips curve isvertically sloping, thereby having no relationship between inflationrate and unemployment rate. However, he accepted the fact thatthere exist a short run negative relationship between inflation rateand unemployment rate. Milton Friedman says that the economy isstable in the long run at the natural rate of unemployment and anyintervention in the form of expansionary fiscal and monetarypolicies would only result in higher prices without higher output.
When current GDP is at its potential level, unemployment isnot zero or there is no full employment. The unemployment ratethat exists on account of frictional and structural reasons when theeconomy is operating at full employment level is called the naturalrate of unemployment or more appropriately NAIRU (Non-accelerating Inflation Rate of Unemployment). The natural rate ofunemployment is the rate at which in the labor market, the currentnumber of unemployed is equal to the number of jobs available.Natural unemployment exists due to frictional and structuralreasons. For example, fresh additions to the labor force may spendtime to search suitable jobs. Individuals pursuing higher educationmay actually be in the labor force but may not participate in theworkforce due to educational commitments. While the sunsetindustries may be on the decline and thereby reducing theworkforce from its rolls, the sunrise industries would be expandingand adding to its workforce. However, unemployed labor forceneeds to be trained for suitable jobs before they are recruited.Unemployment arising out of frictional and structural causes istermed as natural unemployment and the number of suchunemployed persons constitutes the natural rate of unemployment.In other words, Milton Friedman argues that if information were notto fail, there will be no divergence between full employment andactual employment. The natural rate of unemployment is estimatedin the range of four to six per cent in the developed countries.
The term ‘NAIRU’ is a more appropriate term to describe thenatural rate of unemployment because the term ‘natural rate ofunemployment’ connotes that unemployment cannot fall below thenatural rate. The Phillips curve hypothesis shows thatunemployment rate can fall below the NAIRU in the short term.Thus, when actual GDP is greater than potential GDP (Y > Y*),unemployment will be less than NAIRU (U < U*) and vice versa.When the unemployment rate is below the NAIRU, demand forces

86
put pressure on wages to rise faster than productivity. When theunemployment rate is above the NAIRU, demand forces putpressure on wages to rise more slowly than productivity or even tofall. When unemployment is at the NAIRU, demand forces exert nopressure on wages relative to productivity.
In order to prove the non-existence of Phillips curve in thelong run, Milton Friedman put forward the theory of adaptiveexpectations. People’s expectations are formed on the basis ofprevious and present rate of inflation and adapt their expectationsonly when the actual inflation rate is different from their expectedrate. The tradeoff between inflation and unemployment is thereforeonly in the short run. Milton Friedman’s theory of adaptiveexpectations and the derivation of the vertically sloping long runPhillips curve is depicted in Fig.7.4.
It is assumed that the economy is operating at point A0 onthe short run Phillips curve (SPC1) and the natural rate ofunemployment is six per cent. The actual inflation rate is four percent. The nominal wages are set on the basis of four per centinflation rate and it is expected that the inflation rate will continue tobe the same in future. When the government adopts expansionarymonetary and fiscal policies, the inflation rate goes up to six percent. Since the nominal wages are set on the basis of four per centinflation rate, the firms make additional profits equal to two per centand hence they make fresh investments, thereby increasing thelevel of employment and output. As a result of fresh investments,the unemployment rate falls below the natural rate ofunemployment and the economy moves to point A1 where thecorresponding inflation rate is six per cent and the unemploymentrate is three per cent. Thus, Milton Friedman and other monetaristsargue that there exists a short run tradeoff between inflation rateand unemployment rate.

87
SPC3 LPC
9 - SPC2
8 - ●B1 ●C0
7 - SPC1
6 - ● ● B0
A1
5 -
4 - ● A0
3 -
2 -
1 -
0 3 6Unemployment Rate
Fig.7.4 – Shift in the Short Run Phillips Curve &derivation of the Long Run Phillips Curve
7.5 LONG RUN PHILLIPS CURVE AND THETHEORY OF ADAPTIVE EXPECTATIONS
The economy after having reached point A1 does not stayput at that point because after a time lag, the workers are informedthat the current inflation rate is six per cent and that their realwages have fallen by two per cent. Organized workers willtherefore demand compensation for the inflation which is over andabove the expected rate in order to restore their real incomes.When wage compensation actually takes place, the profits levelsare also restored to the original levels and the economy returns toits original equilibrium position at point B0. However, point B0 is onthe new short run Phillips curve SPC2. Corresponding to point B0,the actual inflation rate is six per cent and the unemployment rate isback at its natural level i.e. six per cent. Now the expectedinflation rate would be six per cent and workers will continue toexpect the same rate of inflation in future. The shift in the Phillipscurve will continue as long as expansionary monetary and fiscalpolicies are adopted by the Government and the economy willmove along the points B1, C0 etc. When points such as A0, B0, C0
are joined, the long run Phillips curve is obtained. Note that theLPC is vertically sloping and the vertical slope indicates that it isneutral between inflation rate and the unemployment rate. Milton
Infl
ati
on
Rat
e

88
Friedman thus proves that there is no long run trade-off betweeninflation rate and unemployment rate. The theory of adaptiveexpectations indicate that workers adapt to the new rates ofinflation and their expected inflation rate gets adapted in duecourse i.e. after a time lag and the economy returns to its originalstatus with a higher rate of inflation.
7.6 RATIONAL EXPECTATIONS AND THE LONGRUN PHILLIPS CURVE
According to Milton Friedman’s theory of adaptiveexpectations, nominal wages lag behind changes in the price levelor the inflation rate. The adjustment lag in nominal wages to theprice level causes business profits to go up. When profits go up,business units expand their scale output and as a result the level ofunemployment in the economy falls below the natural rate.
The advocates of rational expectation theory believe thatthere is no adjustment lag involved between nominal wages andchanging price level. They argue that there is a quick adjustmentbetween nominal wages and expected changes in the price leveland hence there is no trade-off between inflation andunemployment. The rate of inflation resulting from increase inaggregate demand is well anticipated by workers and firms andgets factored in wage agreements. Such adjustments made inquick succession sometimes and sometimes in advance lead tofurther price increases. Thus, there is a rise in the price levelwithout any rise in the real output or fall in unemployment below thenatural rate. According to the Rational Expectations theorists,given the availability of resources and technology, the aggregatesupply curve is vertically sloping at the potential GDP level or at thenatural unemployment rate level. The long run Phillips curvetherefore corresponds to the long run aggregate supply curve at thenatural rate of unemployment. The long run Phillips curve istherefore a vertical straight line or vertically sloping at the naturalrate of unemployment. The derivation of the long run aggregatesupply curve is shown in Fig. 7.5 and the long run Phillips curve isdepicted in Fig. 7.6.
According to the Rational Expectations theorists, the workersand firms are rational beings and have a good understanding of theoperation of the economy. Both workers and firms can thereforefairly and correctly anticipate the consequences of the economicpolicies of the Government. Secondly, all product and factormarkets are very competitive and hence factor and product pricesare highly flexible to bring about quick and rapid adjustments.Figure 7.6 shows the argument made by Rational Expectationstheorists about the relation between inflation and unemployment.
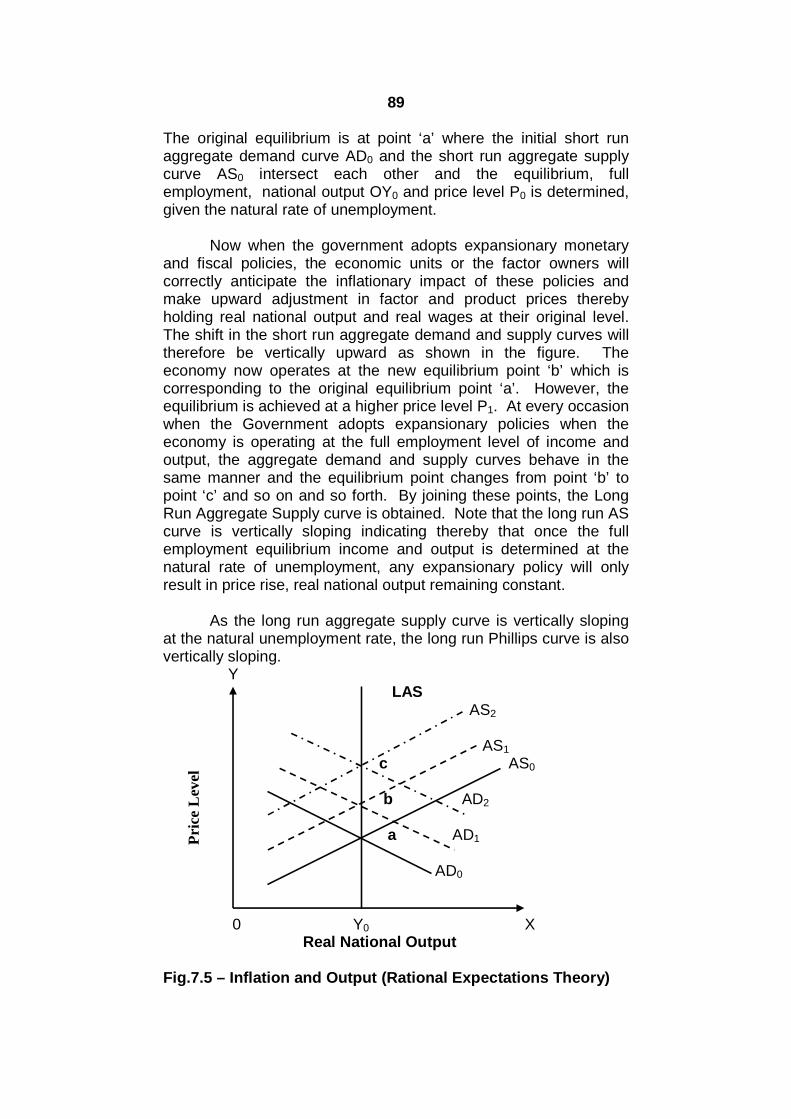
89
The original equilibrium is at point ‘a’ where the initial short runaggregate demand curve AD0 and the short run aggregate supplycurve AS0 intersect each other and the equilibrium, fullemployment, national output OY0 and price level P0 is determined,given the natural rate of unemployment.
Now when the government adopts expansionary monetaryand fiscal policies, the economic units or the factor owners willcorrectly anticipate the inflationary impact of these policies andmake upward adjustment in factor and product prices therebyholding real national output and real wages at their original level.The shift in the short run aggregate demand and supply curves willtherefore be vertically upward as shown in the figure. Theeconomy now operates at the new equilibrium point ‘b’ which iscorresponding to the original equilibrium point ‘a’. However, theequilibrium is achieved at a higher price level P1. At every occasionwhen the Government adopts expansionary policies when theeconomy is operating at the full employment level of income andoutput, the aggregate demand and supply curves behave in thesame manner and the equilibrium point changes from point ‘b’ topoint ‘c’ and so on and so forth. By joining these points, the LongRun Aggregate Supply curve is obtained. Note that the long run AScurve is vertically sloping indicating thereby that once the fullemployment equilibrium income and output is determined at thenatural rate of unemployment, any expansionary policy will onlyresult in price rise, real national output remaining constant.
As the long run aggregate supply curve is vertically slopingat the natural unemployment rate, the long run Phillips curve is alsovertically sloping.
YLAS
AS2
AS1
c AS0
b AD2
a AD1
AD0
0 Y0 XReal National Output
Fig.7.5 – Inflation and Output (Rational Expectations Theory)
Pri
ceL
evel

90
Y LPC
0 U* XUnemployment Rate
Fig.7.6 – The Long Run Phillips Curve (Rational ExpectationsTheory)
7.7 RELATIONSHIP BETWEEN SHORT AND LONGRUN PHILLIPS CURVE
The position of the short run Phillips curve passing through along run Phillips curve is determined by the anticipated or expectedinflation rate. The short run Phillips curve can be compared to theshort run aggregate supply curve because both the curves aredrawn with a given expected price level. The short run Phillipscurve drawn with an expected inflation rate shifts its position as theinflation rate changes (See figure 7.7). If the expected inflation rateis six per cent, the short run Phillips curve (SPC1) also passesthrough the corresponding point ‘A0’ on the long run Phillips curvewith natural unemployment rate of six per cent. The movementalong a short run Phillips curve is determined by changes inaggregate demand. When there is an unexpected increase inaggregate demand, the actual inflation rate is found to be morethan the expected inflation rate and the real national outputincreases causing the unemployment rate to fall below the naturalrate. The new short run equilibrium is determined at point ‘A1’which is to the left of the original equilibrium point. Conversely, ifthere is an unexpected decrease in aggregate demand, the actualinflation rate will fall below the expected rate and theunemployment rate will increase and real national output will fall. Inthis case, the movement will be downwards and to the right. Theshift in the short run Phillips curve is caused due to the divergencebetween actual and expected inflation rates and this divergence iscaused by unexpected changes in monetary and fiscal policies ofthe government. If the actual inflation rate is greater than the
Pri
ceL
evel
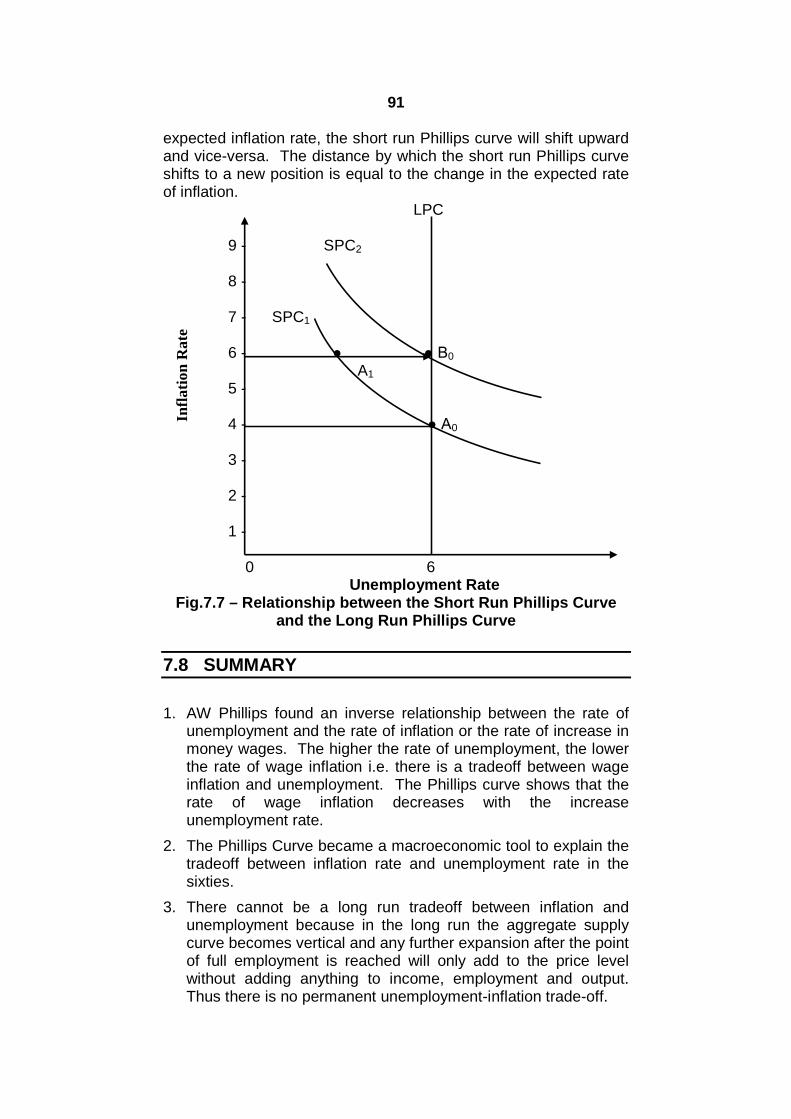
91
expected inflation rate, the short run Phillips curve will shift upwardand vice-versa. The distance by which the short run Phillips curveshifts to a new position is equal to the change in the expected rateof inflation.
LPC
9 - SPC2
8 -
7 - SPC1
6 - ● ● B0
A1
5 -
4 - ● A0
3 -
2 -
1 -
0 6Unemployment Rate
Fig.7.7 – Relationship between the Short Run Phillips Curveand the Long Run Phillips Curve
7.8 SUMMARY
1. AW Phillips found an inverse relationship between the rate ofunemployment and the rate of inflation or the rate of increase inmoney wages. The higher the rate of unemployment, the lowerthe rate of wage inflation i.e. there is a tradeoff between wageinflation and unemployment. The Phillips curve shows that therate of wage inflation decreases with the increaseunemployment rate.
2. The Phillips Curve became a macroeconomic tool to explain thetradeoff between inflation rate and unemployment rate in thesixties.
3. There cannot be a long run tradeoff between inflation andunemployment because in the long run the aggregate supplycurve becomes vertical and any further expansion after the pointof full employment is reached will only add to the price levelwithout adding anything to income, employment and output.Thus there is no permanent unemployment-inflation trade-off.
Infl
ati
on
Ra
te

92
4. The shifts in the Phillips curve according to Keynes is due toadverse supply shocks experienced in the seventies in the formof unprecedented oil price hikes. Adverse supply shocks gaverise to the phenomenon of Stagflation and the breakdown of thePhillips curve hypothesis.
5. Milton Friedman says that the economy is stable in the long runat the natural rate of unemployment and any intervention in theform of expansionary fiscal and monetary policies would onlyresult in higher prices without higher output.
6. The theory of adaptive expectations indicate that workers adaptto the new rates of inflation and their expected inflation rate getsadapted in due course i.e. after a time lag and the economyreturns to its original status with a higher rate of inflation.
7. According to the Rational Expectations theorists, given theavailability of resources and technology, the aggregate supplycurve is vertically sloping at the potential GDP level or at thenatural unemployment rate level. The long run Phillips curvetherefore corresponds to the long run aggregate supply curve atthe natural rate of unemployment. The long run Phillips curve istherefore a vertical straight line or vertically sloping at thenatural rate of unemployment.
7.9 QUESTIONS
1. Explain the trade-off between inflation and unemployment withthe help of Phillips curve analysis.
2. Explain the derivation of the Phillips curve with the KeynesianAD-AS model.
3. Write a note on the collapse of the Phillips Curve Hypothesis.
4. Explain the natural rate of unemployment hypothesis and thetheory of adaptive expectations.
5. Explain the long run Phillips curve and the theory of adaptiveexpectations.
6. Explain the theory of Rational Expectations and the long runPhillips curve.
7. Explain the relationship between the short and the long runPhillips curve.
93
8
Module 3
BANKING AND INTEGRATION OFPRODUCT AND MONEY MARKETS
Unit Structure :
8.0 Objectives
8.1 Commercial Bank – Meaning and Functions
8.2 Assets & Liabilities of Commercial Banks
8.3 Trade off between liquidity and profitability
8.4 Factors Determining Liquidity and Profitability
8.5 The Money Multiplier
8.6 Summary
8.7 Questions
8.0 OBJECTIVES
To understand the meaning and functions of a commercial bank To study assets and liabilities of commercial banks To study trade off between liquidity and profitability To study factors determining liquidity and profitability To understand the concept of money multiplier
8.1 COMMERCIAL BANK
According to the Banking Regulation Act 1949, banking isdefined as “accepting for the purpose of lending or investmentof deposits of money from the public repayable on demand orotherwise and can be withdrawn by check, draft, and order orotherwise”. A commercial bank is therefore a financial institutionwhich deals in money or credit. It accepts cash deposits from thepublic and lends the deposits to borrowers in the form of loans andadvances against collateral securities and makes profits. Thedifference between the deposit rates and lending rates is known asthe interest spread. Interest spread constitutes the major part ofthe profits of a commercial bank. The deposits in a commercialbank are used to settle debts through the instrument of check.

94
According to RS Sayers, “Banks are institutions whose debtsusually referred to as bank deposits – are commonly accepted infinal settlement of other people’s debts.” Sayers’ definitionhighlights the credit creating abilities of commercial banks which iscentral to any commercial bank also a distinguishing feature fromother financial institutions like term lending financial institutions,investment banks, insurance firms etc.
8.2 ASSETS AND LIABILITIES OF COMMERCIALBANKS
The following table contains a hypothetical balance sheet ofa commercial bank. The balance sheet contains the details of abank’s current assets and current liabilities. The balance sheetindicates the manner in which the bank has raised funds andinvested them in various kinds of assets. The liabilities of the bankare the items which are to be paid by it either to its shareholders ordepositors. The assets are those items from which the bank hopesto get income and therefore includes the entire amount owed byothers to the bank.
The Liabilities of a Commercial Bank:
The liabilities of the commercial bank show how the bankraises funds. A commercial bank gets funds in three different ways.They are: share capital, reserve fund and deposits from the public.Reserve fund and share capital put together constitute the networth of the bank.
1. Share Capital: Share capital is the contribution made by theshare holders. The commercial banks raise their share capitallike other joint stock companies. The share capital may also bepartially paid up as subscribers to the bank’s share capital mayonly be asked to make part payment. Hence the share capitalof the bank generally consists of the paid-up capital. Promotersof commercial banks decide the authorized capital. Theauthorized capital is issued in parts and according to thedevelopment requirements of the bank.
2. Reserve Fund: Reserve fund is the amount accumulated overthe years out of undistributed profits. Under the banking law,commercial banks are not allowed to distribute the entire profitin the form of dividends. A part of the profit has to be retainedby the bank as Reserve funds to meet contingencies.According to the Indian Banking Regulation Act, 1949,commercial banks are required to retain at least 20 per cent oftheir profit every year as reserve. Reserve accumulation cancontinue as long as it does not become equal to the paid upcapital of the bank.
95
3. Deposits: Deposits from the public constitute the largest sourceof the bank’s working funds. Deposits are accepted by thebanks in three different forms. They are: fixed deposits, savingsdeposits and current deposits. Current deposits are generallyoperated by firms. There are no restrictions on the number ofwithdrawals from these accounts. Banks do not pay interest oncurrent account. Current account balances are interest-freebalances. Savings deposits are operated by individuals (salaryearners), trusts etc. Banks offer low interest rates on savingsaccount deposits. Checks can be drawn on these accounts.The number of withdrawals and the maximum amount that canbe withdrawn at any time is however, restricted. The lendingbusiness of the banks depends upon deposit money. Banksaccept deposits under certain conditions and withdrawals arepermitted according to the rules and regulations of the banks.
4. Borrowings: Banks also borrow from the Central bank, otherbanks (national and foreign) and financial Corporations on atemporary basis. When the liquidity position of commercialbanks is not good enough to meet the demands made bydepositors, they have to depend upon borrowings.
5. Other Liabilities: Other items include bills payable such asdrafts, traveler’s checks; pay slips, banker’s checks etc. Theinterest accrued but not due on deposits and borrowings is alsoentered under this head.
The Assets of a Commercial Bank:
Assets of a bank are shown in the balance sheet in order oftheir liquidity. Cash is the most liquid asset and hence it assumesthe prime position. The asset side of the balance sheet indicatesthe manner in which funds received by banks are deployed.
1. Cash: The bank holds a small part of total deposits in the formof cash reserves. Cash reserves include cash with bank andcash held either with other commercial banks or with CentralBank. On a given day, the receipt of cash may be less than thepayments which the bank is required to make. Cash reservesare held by commercial banks to meet excess demand for cashby customers.
2. Money at call and short notice: It relates to short term loansto the money market which can be called back by the bank at avery short notice of one to seven days. These assets are highlyliquid and carry low interest rates. The stock brokers, dealers incommercial bills and discount houses are generally theborrowers in this segment of bank loans. Banks also borrow atshort notice from other commercial banks through what isknown as the Inter-bank Call Money Market to meet their shortterm liabilities.

96
3. Investment: Investment constitutes funds invested ingovernment securities, shares etc which are generally mediumand short term securities. Commercial banks make investmentsin securities as these investments are more profitable than banklending. Commercial bank prefers Central and Stategovernment securities because investment in these securities isnot only safe but also are eligible as collaterals for raising funds.
4. Bills discounted & Loans and Advances: Banks give loansand advances to the customers and these constitute the majorpart of their asset portfolio. Bank loans are classified into threecategories. These are ordinary loans and advances, overdraftand cash credit. Loans and advances are offered in fixedamounts repayable on demand or in installments. Loans are oftwo types. These are: demand loans and term loans. Demandloans are to be repaid when demanded by the creditor.Demand loans are mainly short term loans. Term loans areoffered for a period more than one year with a repaymentschedule. Cash credits and overdrafts are running accountsfrom which the borrower can withdraw funds as when requiredand up to the credit limit sanctioned by the banks. Cash creditis sanctioned against the security of commodity stock.Overdrafts are allowed on current accounts. Interest is chargedon the outstanding amount borrowed and not on the credit limitsanctioned.
5. Bills discounted: constitute bank funds which are used todiscount the commercial and treasury bills. The maturity periodof commercial bills of exchange is less than three months.Commercial banks can rediscount these bills from the Centralbank or can sell them in the market. Commercial banks alsobuy and sell treasury bills.
6. Other Assets: Other assets include fixed assets such aspremises which are wholly or partly owned by the bank forbusiness and residential purpose, furniture and fixtures.
Table 8.1: Assets & Liabilities of a Commercial Bank
Liabilities Assets
1. Share Capital 1. Cash in hand,
2. Reserve Funds Cash with Central bank and
3. Deposits : Cash with other banks
i) Time deposits. 2. Money at call and short notice.
ii) Demand deposits. 3. Investments.
iii) Savings deposits. 4. Bills discounted including treasurybills, Loans and Advances.
4. Borrowings
5. Other items 5. Other items.

97
8.4 TRADE-OFF BETWEEN LIQUIDITY ANDPROFITABILITY
Liquidity and profitability are principles of sound bankingsystem. Liquidity refers to the conversion of assets into cash andprofitability refers to the net return on the funds possessed by thecommercial banks. Every commercial bank is motivated by profitand profit maximization is the main objective. However, the profitmaximization motive is limited by the considerations of liquidity andsolvency criteria determined under prudential banking norms. Therequirements of profitability and liquidity are the opposing claimswhich the commercial bank has to balance. The concepts ofliquidity and profitability are explained below.
Concept of Liquidity: A bank is said to be liquid when it is able tomeet all its current demand liabilities. It is the ability of thecommercial bank to pay deposits on demand. The other type ofliquidity is loan liquidity which refers to the bank’s ability to meet allthe legitimate credit requirements of its customers. The higher thedeposit liquidity, the lower will be the loan liquidity as the bank’sability to meet the customers’ loan requirements would be reducedby the extent of cash disbursal to meet the deposit liquidity. Thedeposit liquidity depends on the composition of deposits and theirstability. The larger the demand component of deposits, thegreater is the need for deposit liquidity.
Further, the larger the instability of deposits, the greater isthe need for deposit liquidity. If the need for deposit liquidity isgreater the banks will have to keep more of their funds in cash orshort term assets like treasury bills, commercial paper and inter-bank loans. Loan liquidity depends upon the loan requirements ofbank’s customers. If the demand for loans is greater than thesupply of deposits, the commercial banks will have to keep more ofthere funds in short term assets to meet the increase in loandemands. The concepts of liquidity and solvency go hand in hand.A commercial bank should not only be liquid but also solvent toenjoy the confidence of its depositors. A commercial bank is saidto be solvent if its total assets are greater than total liabilities andpaid up capital and reserves are greater than zero. The factors thatinfluence liquidity can be listed as: statutory requirements, bankinghabits of the people, monetary transactions, nature of moneymarket, structure of the banking system, number, size and nature ofdeposits.
Concept of Profitability: Profits of commercial banks dependupon the income earning assets. The commercial banks canincrease their profitability by disbursing more long term loans.However, commercial banks have to strike a balance between

98
liquidity and profitability. While the commercial banks have to makeprofits to meet the demand of the shareholders, they also have tomaintain liquidity to meet the demands of depositors. There is atrade-off involved between liquidity and profitability i.e. moreprofitability means less liquidity and vice versa. The factors thatinfluence profitability can therefore be listed as: deployable workingfund cost of funds, rate of return on funds deployed, interestspread, operating costs, risk provisioning and competition.
8.5 TRADE-OFF BETWEEN LIQUIDITY ANDPROFITABILITY
Commercial banks must make profits for its survival andgrowth. At the same time, it must maintain a certain amount ofliquidity. In order to reconcile between the conflicting objectives ofearning more profits and maintaining liquidity, a commercial bankhas to choose a portfolio of assets that will strike a balancebetween these two opposing objectives. The cash and incomeearning assets combination which a bank chooses is its portfolio.The maturity structure of its portfolio depends on both these criteria.The longer the maturity, the greater will be the income earningability of the portfolio and the lower will be the liquidity. A higherlevel of liquidity can be held by banks only by sacrificing someincome earning assets or profits. The trade-off between liquidityand profitability is depicted in Fig.8.1 below.
Fig.8.1: Profitability and liquidity of Assets
You will notice that when OY1 is the level of liquidity, theprofitability of the assets of commercial banks is only OX1. Whenmore liabilities are converted into assets, the level of liquidity
LIQ
UID
ITY
PROFITABILITY
O
A
B
Y1
Y2
X1 X2
M
N

99
comes down to OY2. However, the profitability of assets goes up toOX2. Thus the banks have to sacrifice Y1 Y2 amount of liquidity togain more profits equal to X1 X2. This explains the trade-offbetween liquidity and profitability.
8.6 MONEY MULTIPLIER
Currency reserve ratio ‘r’ of the banks (which determines
deposit Money multiplier is the degree to which money supply is
expanded as a result of the increase in high powered money. Thus
m = M/H or M = H.m. Thus money supply is determined by the size
of money multiplier (m) and the amount of high powered money
(H). The size of the money multiplier is determined by the
multiplier) and currency deposit ratio of the public (k) which
together determines the size of money multiplier.
Size of the Multiplier
The money supply (M) consists of currency with the public(Cp) and demand deposits with the banks. Thus:
M = Cp + D …….(1)
The public hold the amount of currency in a certain ratio ofdemand deposits with the banks which is denoted by ‘k’.Therefore, Cp = kDSubstituting kD for Cp in equation (1), we get:
M = kD + D = (k + 1)D …(2)
The equation of high powered money (H) is:
H = Cp + R ……(3)
Where R represents cash or currency reserves which banks keepas a certain ratio of their deposits and is called cash reserve ratioand is denoted by ‘r’. Thus
R = rD
Substituting rD for R and kD for Cp in equation (3), we get:
H = kD + rD or
H = (k + r)D ……(4)
The money multiplier is a ratio of total money supply to the highpowered money. Therefore, equation (1) will be divided by

100
equation (4) to get the value of multiplier which is denoted by ‘m’.Thus,
Or, money multiplier
Or
Where ‘r’ = cash reserve ratio of the banks.‘k’ = currency deposit ratio of the public.
Money supply is therefore determined by the following:
1. H or the amount of high powered money.
2. ‘r’ or the cash reserve ratio of banks (i.e. ratio of currency
reserves to deposits of the banks). The CRR determines the
magnitude of deposit multiplier.
3. ‘k’ or the currency deposit ratio of the public.
A change in money supply will take place:
1. When the supply of high powered money (i.e. reserve money) H
changes.
2. When the currency deposit ratio (k) of the public changes, and
3. When the cash or currency reserve deposit ratio of the banks (r)
changes.
Cash Reserve Ratio (CRR) and the Deposit or Credit Multiplier
The deposit or the credit multiplier (dm) is the reciprocal ofthe cash reserve ratio (r). Therefore dm = 1/r. If the CRR is five percent of deposits, then dm = 1/0.05 = 20. The deposit multiplier of20 indicates that for every Rs.100 increase in cash reserves withthe commercial banks, the demand deposits of the banks willexpand by Rs.2000. This will happen only if leakage of cash to thepublic does not occur during the deposit multiplier process.
101
Currency Deposit Ratio and Multiplier
The actual expansion in bank deposits does not take placeto the extent of the deposit multiplier because there will be someleakage from the stream of derivative deposits created by thebanking system. The greater the leakage of cash, the lower will bethe money multiplier. The currency deposit ratio (k) is an importantdeterminant of the money multiplier. Thus, greater the currencydeposit ratio, lower will be the money multiplier and vice versa.Further, banks may hold cash reserves in excess of the cashreserve ratio fixed by the Central Bank. Excess cash reserves willalso reduce the size of the money multiplier.
8.7 SUMMARY
1. According to the Banking Regulation Act 1949, banking isdefined as “accepting for the purpose of lending or investment ofdeposits of money from the public repayable on demand orotherwise and can be withdrawn by check, draft, and order orotherwise”.
2. The balance sheet indicates the manner in which the bank hasraised funds and invested them in various kinds of assets. Theliabilities of the bank are the items which are to be paid by it eitherto its shareholders or depositors. The assets are those items fromwhich the bank hopes to get income and therefore includes theentire amount owed by others to the bank.
3. Commercial banks must make profits for its survival and growth.At the same time, it must maintain a certain amount of liquidity. Inorder to reconcile between the conflicting objectives of earningmore profits and maintaining liquidity, a commercial bank has tochoose a portfolio of assets that will strike a balance between thesetwo opposing objectives.
4. Money multiplier is the degree to which money supply is
expanded as a result of the increase in high powered money. Thus
m = M/H or M = H.m. Thus money supply is determined by the size
of money multiplier (m) and the amount of high powered money
(H). The size of the money multiplier is determined by the currency
reserve ratio ‘r’ of the banks (which determines deposit multiplier)
and currency deposit ratio of the public (k) which together
determines the size of money multiplier.

102
8.8 QUESTIONS
1. What is a commercial bank? Explain the Assets and Liabilitiesof Commercial Banks.
2. Explain the concepts of liquidity and profitability in the context ofCommercial Banking system. Is there a trade-off between thetwo?
3. Write a note on the money multiplier.
103
9
MONETARY POLICY –OBJECTIVES AND INSTRUMENTS
Unit Structure :
9.0 Objectives
9.1 Meaning of Monetary Policy
9.2 Objectives of Monetary Policy
9.3 Instruments of Monetary Policy
9.4 Limitations of Monetary Policy
9.5 Summary
9.6 Questions
9.0 OBJECTIVES
To understand the meaning of monetary policy
To study the objectives of monetary policy
To understand different quantitative and qualitative credit controlinstruments of monetary policy
To study the limitations of monetary policy
9.1 MONETARY POLCY
Monetary policy can be defined as a policy of theCentral Bank that seeks to influence the cost and availabilityof credit in an economy. By influencing the cost and availabilityof credit, by controlling inflation and by maintaining equilibrium inthe balance of payments, monetary policy plays an important role inincreasing the growth rate of the economy. Monetary policy is animportant macro-economic instrument through which the macro-economic objectives of a country is sought to be achieved. Thebroad objectives of monetary policy are to obtain economic growth,price stability, full employment, exchange rate stability andequilibrium in the balance of payments. Monetary policy influencesthe supply of money and the rate of interest in order to stabilize theeconomy at full employment or near full employment level bychanging the level of aggregate demand in the economy. Business
104
cycles are sought to be controlled with the help of the tools ofmonetary policy. Thus during recession, money supply is increasedand interest rates are brought down to increase the level ofaggregate demand in the economy because it is the level ofaggregate demand that determines the level of employment, outputand income in n economy. Conversely, during the times of highinflation, price rise sought to be controlled by reducing the moneysupply and raising the interest rates which brings about a fall in theaggregate demand and prices. In the context of a developingcountry l like India, monetary policy aims to achieve sustainedeconomic growth in the different sectors of the economy.
All countries have a central bank or a reserve bank whichformulates and implements the monetary policy. For instance, inIndia, it is the Reserve Bank of India which is the apex monetaryauthority of the Indian monetary system. In the United Kingdom, itis the Bank of England whereas in the United States, it is theFederal Reserve Bank, popularly known as the Fed. Theobjectives of the Fed are no different from the objectives of anyother central bank. Similar to the Reserve Bank of India, the Fed’sobjectives include economic growth according to the expansionpotential of the economy of United States, a high level ofemployment, stable prices and moderate long term interest rates.The objectives of the Reserve Bank of India as according tothe Chakravarty Committ4eee Report are economic expansionand inflation control. While economic expansion ensures growinglevels of employment, inflation control ensures price stability andmoderate interest rate. The Reserve Bank of India was establishedon 01st April, 1935. The Government of Free India felt that a State-owned Central Bank will be more conducive to pursue the macro-economic objectives of the government and hence the ReserveBank of India was nationalized on 01st January, 1949.
9.2 OBJECTIVES OF MONETARY POLICY
The basic objective of monetary policy is to achievesustained economic growth with a fair amount of price stability.The monetary policy is a part of the government’s economic policy.It is formulated and implemented to achieve the macro-economicobjectives. The macro-economic objectives depends upon thestate of the economy i.e. both the general economic conditions andthe sectoral and sub-sectoral economic environment. Suitablemonetary instruments are put to work to cater to the specificrequirements of the sectors and sub-sectors of the economy. Whilebroadly the goals of monetary policy are identical in all capitalistcountries, they may be fine tuned to the specific requirements ofdifferent countries as different countries are at different stages ofeconomic growth and development. Therefore the broad and

105
general objectives of monetary policy are economic growth, fullemployment, price stability, exchange rate stability and equilibriumin the balance of payments. These objectives are discussed below.
(A)Economic Growth
Sustained economic growth is the basic as well as the primeobjective of monetary policy in all countries; rich as well as thepoor. Sustained economic growth refers to a continuous growth inthe productive capacity of the economy resulting in a continuousgrowth in the total quantity of goods and services produced in aneconomy. Such a growth process will be reflected by a continuousrise in the national income as well as the per capita income of thecountry. To achieve sustained economic growth, the Centralbank’s monetary policy must aim at maintaining a high level ofaggregate demand in the economy. The monetary policy must alsoinduce high levels of saving and investment in the economy toachieve sustained growth. The Central bank must ensure that thegrowth in money supply is in proportion the proportionate rise in theproduction of goods and services so that inflation rates are undercontrol and below the rate of three per cent per annum.
A moderate inflation of less than three per cent per annum isconsidered as a sufficient incentive to higher investment whereashigh rates of inflation lead to more speculative activities and lessreal growth. To maintain and ensure a sustained growth inaggregate demand, saving and investment in the economy and toobtain sustained economic growth, the Central bank’s monetarypolicy must be flexible to cater to the changing requirements of theeconomy. Thus during a recessionary phase, la cheap monetarypolicy must be adopted so that money supply is increased, interestrates are brought down through a downward revision of the bankrate. Lower interest rates will encourage higher investment whichwill lead to higher level of employment, output, income and demandin the economy. During an inflationary phase, a dear monetarypolicy can be adopted and the opposite impact can be obtained.
In the Indian context, monetary policy can promoteeconomic growth by increasing the quantum of credit and byreducing the cost of credit. Firms need credit to finance theirworking capital requirements, importing raw materials andmachines and for financing investment in projects for building fixedcapital. Adequate availability of credit at low interest rates willencourage investment and economic growth. During the pre-reform period, the Reserve Bank of India followed a tight monetarypolicy thereby reducing the supply of credit and increasing the costof credit. This policy was given up in the post reforms period byderegulating interest rates, reducing CRR and SLR and therebyincreasing the supply of credit in the economy. Only lower rates of
106
inflation will lead to low interest rates, adequate credit and growinginvestment for sustained economic growth. A consensus hasbeen arrived at with regard to inflation rate i.e. inflation mustbe in the 4 to 6 per cent range and low inflation will ensureeconomic growth in the country.
(B)Full Employment
The Central Bank’s monetary policy must be geared toachieve full employment of all the available productive resources inthe economy. However, in reality, the term full employment refersto near full employment of productive resources or less than fullemployment. It has been accepted by the economists that aboutthree per cent unemployment is actually full employment and thatabsolute full employment is only a theoretical possibilitypropounded by the classical economists like JB Say and others. Bystimulating saving and investment, higher levels of employment ofavailable productive resources can be obtained. However,monetary policy will be successful only in highly organized andindustrialized economies in achieving higher or near fullemployment. In the context of developing countries like Indiawhich is predominantly agricultural from the employment point ofview, monetary policy will be irrelevant and sterile in tackling theproblems of seasonal and disguised unemployment which aresubstantially high in India. However, the problem ofunemployment; both seasonal and disguised can be tackled bybringing about a structural change from the point of view of sectoralcomposition of employment. But to bring these changes, monetarypolicy alone will be not enough. The fiscal policy, industrial policyand agricultural policy along with monetary policy can only solvethe peculiar problems of developing or under developed countrieslike India.
(C)Price Stability
A capitalist economy is vulnerable to cyclical fluctuations orbusiness cycles. Monetary policy must aim at avoiding orneutralizing both the peaks and troughs of business cycles. Themonetary authorities must prevent the economy from being caughtin n inflationary spiral and going down in deflationary spin. Bothinflation and deflation are inimical to the health of the economy.High rates of inflation or double digit inflation encouragesspeculative activity in the economy and channelizes productiveresources into un productive uses along with other attendant evilssuch a s hoarding, black-marketing, food adulteration etc.Persistent double digit inflation rapidly erodes the purchasing powerof unorganized labor in particular and results in widening of incomeinequalities. Similarly, a deflationary spin would result in fallingprices, investment, employment, output, incomes and aggregate

107
demand. However, a moderate rise in price of less than three percent per annum also known as creeping inflation will be consistentwith the objective of achieving price stability. In order to achieveprice stability and at the same time ensure economic growth, themonetary policy needs to encourage saving and investment butalso it should be anti-cyclical in character. Thus during the times ofrecession or near zero rates of inflation, the monetary policy mustbe expansionary and during the times of double digit inflation acontractionary or tight monetary policy must be pursued.
In the Indian context, Dr. C Rangarajan, former Governorof Reserve Bank of India, observed that monetary policy caneffectively achieve the goal of price stability. Higher level ofinvestment is accompanied by agricultural failures and inflation.Monetary policy therefore has to play an important role in short runmanagement of the general price level in the economy. In theIndian context, price stability refers to moderate rise in prices i.e.price rise in the range of 0 to 5 per cent per year. Inflation ratebeyond the five per cent mark has unwanted effects on theeconomy. It increases the cost of living and affects greatly theunorganized labor in the country. It increases the export price andhence demand for exports fall. During a period of rapid rise inprices, exports fall and imports rises thereby creating balance ofpayments problem. It also reduces the rate of saving because realinterest rate becomes negligible to negative and real incomes of thepeople are also falling. Falling saving rates and falling demandreduces the rate of investment and economic growth. Finally,inflation encourages unproductive investment in gold, real estateand the stock markets. Prof. Chakravarty recommended a four percent rate of inflation as reasonable.
(D)Exchange Rate Stability
Stability in the foreign exchange rate imparts internationalconfidence in the value of the domestic currency and promotes asustained growth in the international trade. A persistent fall in theexchange rate would encourage speculative activity in foreignexchange market and a break-down of international confidence inthe international value of a currency may also result in the flight offoreign capital thus plunging the economy into a currency crisis.However, to maintain exchange rate stability, internal price stabilityneeds to be maintained. A fall in the exchange rate is caused byan excess demand for foreign exchange over its supply. In otherwords, if demand for imports is greater than the demand forexports, the exchange rate will rise and the international value ofthe domestic currency will fall. To maintain stability in theinternational value of the currency, a restrictive monetary policy willhave to be adopted to bring about a reduction in money supply andthe demand for imports.

108
In India, in the pre-reform period, the Reserve Bank ofIndia pursued a policy of fixed exchange rate system anddevalued the rupee as and when required with the permissionof the IMF. But after 1991, India adopted the floating exchangerate system. Floating exchange rate system increases volatility andtransmits its effects on the other sectors of the economy. With aview to prevent volatility, the RBI has to take suitable measures tomaintain exchange rate stability. For instance when the rupeedepreciated against the dollar and reached a low of Rs.48 to adollar, the RBI took a number of measures to stop the fall of therupee. It raised the bank rate from 7 per cent to 8 per cent andincreased the CRR from 7 to 7.5 per cent. These steps increasedthe lending rates and reduced the supply of credit in the economy.Thus by increasing the cost of credit and reducing the availability ofcredit, borrowing from the banks was discouraged with a view toreduce the demand for dollars. Similarly, high domestic interestrates would discourage foreign institutional investors and domesticcorporate sector to invest abroad. The reverse action is takenwhen the rupee appreciates beyond reasonable limits. Forinstance, during 2003-04, on account of huge inflows of foreignexchange in India, the rupee appreciated to 43.50 in early 2004. Inorder to prevent the appreciation of Indian rupee, RBI startedbuying US dollars from the market and stopped the appreciatingrupee. Unwarranted appreciation and depreciation will havenegative consequences on the economy and hence Reserve Bankof India’s intervention is necessary to manage exchange ratestability.
(E) Equilibrium in the Balance of Payments
Exchange rate stability and equilibrium in the balance ofpayments are interlinked. A country having a deficit in the balanceof payments can pursue a contractionary monetary policy andcorrect the deficit in the balance of payments. A contractionarymonetary policy would reduce the money supply in the economyand thus reduce the demand for imports. Further fall in the moneysupply would also reduce domestic prices on account of reduceddomestic demand. Lesser domestic prices will lead to increase inthe demand for exports. Finally, higher domestic interest rates willattract foreign capital. Thus reduced demand for imports,increased demand for exports land inflow of foreign capital will helpcorrect the deficit in the balance of payments and bring aboutequilibrium.
(F) Developing Banking & Financial Institutions
Development of Banking and Financial Institutions in adeveloping country is required to encourage, mobilize andchannelize savings for capital formation. The Central Bank should

109
also develop money and capital markets which are required for thesuccess of development oriented monetary policy.
Debt management is one of the important functions ofmonetary policy in a developing country. It aims at proper timingand issuing of government bonds, stabilizing their prices andminimizing the cost of servicing the public debt. The primary aim ofdebt management is to create conditions in which public borrowingcan increase from year to year. Public borrowing is essential insuch countries in order to finance development programs andto control money supply. Monetary policy thus helps incontrolling inflation or achieving price stability, maintaining stableexchange rates and equilibrium in balance of payments,encouraging capital formation and promoting economic growth.
9.3 INSTRUMENTS OF MONETARY POLICY
The instruments of monetary policy available at the disposalof the Central Bank can be classified into general or quantitativeinstruments and selective or qualitative instruments. The generalinstruments are macro-economic in impact and are used to controlthe volume of credit so as to control the inflationary and deflationarypressures caused by business cycles. The general instrumentsconsist of the bank rate policy, open market operations and cashreserve ratio. The selective instruments of monetary policy areused to regulate the use of credit and hence they are sectoral inimpact. Selective instruments therefore do not affect the entireeconomy. Selective instruments are used with an objective todivert the flow of credit to their desirable and productive uses. Theselective instruments consist of margin requirements, regulation ofconsumer credit, use of directives, credit rationing, moral suasionand publicity and direct action.
(A)Quantitative or General Instruments of Monetary Policy
1. Bank Rate or the Discount Rate Policy
Bank rate or the discount rate is the interest rate charged onborrowings made by the commercial banks from the Central Bank.The Central Bank provides financial assistance to the commercialbanks by discounting eligible bills, loans and approved securities.The objective of the bank rate policy is to influence the cost andavailability of credit to the commercial banks and the borrowers atlarge in turn. The cost of credit is determined by the discount rateor the interest rate charged and the availability of the credit isdetermined by the legal requirements of making the bills eligibleand the duration of the loan. When the Central Bank changes thebank rate, the interest rates in the economy also changes.

110
Changes in the bank rate can therefore make credit cheaper ordearer and also influence the demand for and supply of credit. Arise in bank rate will result in a rise in the deposit and lending ratesof banks and vice versa. A fall in the bank rate signals anexpansionary monetary policy whereas a rise in the bank ratesignals contractionary monetary policy.
The efficacy of the bank rate policy of the Central Bank isinfluenced by factors such as the development of the moneymarket, liquidity of the banks, business cycles, development of thebill market and the elasticity of the economic system. If the moneymarket where short term loans are made available is not wellorganized or well developed and consist of different rates ofinterest, he bank rate policy will not be effective in influencing thevaried interest rates and hence realize the objective of making achange in the bank rate. Similarly, if the commercial banks do notapproach the Central Bank for rediscounting facility on account ofsurplus liquid funds, the bank rate will fail to influence the marketinterest rates. Further, in order to obtain the rediscounting facility,the commercial banks must have sufficient quantity of eligible billsand securities. In the absence of well developed bill market, thebank rate policy will not have the desired effect on the moneymarket interest rates. In the prosperity and recessionary phases ofbusiness cycles, investment demand is interest inelastic and hencechanges in the bank rate will fail to influence investment demand.During the prosperity phase when the prices are gradually rising,profitability of investment also rises. Thus as long as the rate ofreturn on investment is sufficiently greater than the market interestrates, investment demand will continue to rise. Similarly, during arecession, when prices are falling even if the bank rate falls leadingto fall in the market interest rates, investment demand will not pickup because of the poor prospects of making profits. Finally,changes in the bank rate must influence interest rates, prices, costsand trade. The economic system should be sufficiently elastic andrespond to the changes in the bank rate. Systemic rigidities will notcreate the desired impact.
2. Open Market Operations
Open market operations refer to buying and selling ofgovernment securities in the open market. By doing so, the CentralBank can increase or decrease bank reserves. W hen the CentralBank sells government securities in the open market, the bankreserves fall to the extent of the sale multiplied by the reverse creditmultiplier and vice versa. The open market operation is animportant instrument of stabilization in the general price level in thehands of the Central Bank. The Central Bank decides on itsmonetary policy options given the macro-economic conditions. Inan inflationary situation, with a view to control prices, the Central

111
Bank will decide to sell government securities i.e., treasury billswhich are short term government securities and long term bonds.By doing so, the Central Bank will reduce the bank reserves andthereby money supply will also be reduced. As a result, the interestrates in the money market will firm up, reducing investmentdemand. Reduction in investment demand will reduceemployment, output and incomes thus reducing the level ofaggregate demand in the economy. A reduction in the aggregatedemand will help controlling the price rise. Selling governmentsecurities through the open market operation indicates a tight ordear monetary policy. A cheap monetary policy will operate exactlyin the opposite direction when the Central Bank starts buyinggovernment securities in a recessionary situation.
Let us see, how exactly open market transactions ingovernment securities takes place when the Central Bank decideson a tight monetary policy. The Central Bank sells governmentbonds or securities to dealers in the open market. The dealers inturn, resell them to commercial banks, corporates, financialinstitutions and individuals. The purchases generally buygovernment securities by drawing a check in favor of the CentralBank. For instance, if the Reserve Bank of India sells Rs.10 millionworth of treasury bills to Ms. Kareena, she will draw a check onState Bank of India where she has a bank account in favor of theReserve Bank of India. The Reserve Bank of India in turn willpresent the check at the State Bank of India and when the StateBank of India pays the check, it will reduce its balance with theReserve Bank of India by Rs.10 million. By the end of the day, theState Bank of India and the entire commercial banking system willlose Rs.10 million worth of reserves at the Reserve Bank of India.Assuming a cash reserve ratio of ten per cent, the Rs.10 millionsales of government bonds will reduce money supply in theeconomy by Rs.100 million; the reverse credit multiplier being ten.This is how the money supply contracts to the extent of the salemultiplied by the reverse credit multiplier.
The success of Open Market Operation depends upon anumber of factors such as development of the securities market,the rediscounting window available at the Central bank, risk-bearingability of the Central bank, balance of payments, flow of capital,speculative activities etc. Nonetheless, open market operations areknown to be more effective in controlling credit.
3. Cash Reserve Ratio
The Cash Reserve Ratio or the legal reserve requirementsare an important part of the mechanism by which the Central bankcontrols the supply of bank money. The commercial banks arerequired to maintain a certain minimum amount of non-interest
112
bearing reserves out of its deposits with the Central bank. Thecash reserve requirements are fixed by law land the Central bankhas the statutory powers to change the reserve requirements. InIndia, the Reserve Bank of India Amendment Act, 1962 fixedreserve requirements at three per cent for all the liabilities of theCommercial banks. The Amendment Act also gave powers to theReserve bank of India to determine reserve requirements in therange of three per cent and 15 per cent. The Central Bankmaintains a higher reserve ratio in order to control money supplyand facilitate the smooth conduct of Open market Operations. Thereserve requirements above the level that banks desire and therebycontrol the short term interest rates more effectively.
The Central bank can change cash reserve requirements inorder to change the quantity of money supply. Under inflationaryconditions, the Central bank may follow a dear money policy andmay raise the reserve requirements within the given range of threeper cent to fifteen per cent. Let us see with an example howchanges in the reserve requirements bring about changes in thecredit creating capacity of the commercial banks. Assume that thetotal deposits with the commercial banks are equal to Rs.1000billion and the Cash Reserve Ratio is five per cent. Thecommercial banks will have to maintain Rs.50 billion worth reserveswith the Central Bank. The excess reserves with the commercialbanks being Rs.950 billion, the banking system will be able tocreate credit twenty times its excess reserves i.e. Rs.950 × 100 ÷ 5= Rs.19 Trillion. Pursuing a tight or dear monetary policy, if theCentral bank decides to raise the reserve requirements to ten percent, then the excess reserves will be Rs.900 billion and thebanking system will be able to create only ten times its excessreserves i.e. Rs.9000 billion. Thus when the reserve requirementsare raised, the credit creating capacity is reduced and vice-versa.However, in reality, the increase and decrease in reserverequirements is never made on a scale as stated above becausesuch large changes will lead to steep fall or rise in the interestrates. For instance, a steep hike in the Cash Reserve Ratio willlead to very high interest rates, credit rationing, huge decline ininvestment and large reduction in national income and employment.Changes in the reserve requirements are made incrementally ormarginally and in a phased manner i.e. if the current reserverequirement is 10 per cent, with tight monetary policy, the reserverequirement may be raised to 11 per cent and thereafter with a gap,it may be raised by one more percentage point to 12 per cent.Similarly, a cheap monetary policy would entail a marginal andphased reduction in the Cash Reserve Ratio.

113
(B)Selective or Qualitative Instruments of Monetary Policy
The selective instruments of monetary policy are invoked toinfluence the use and volume of credit available for particularpurposes in specific sectors of the economy. Selective instrumentsare used to discriminate between various uses of credit in thevarious sectors so that the available credit in the various sectors isput it its most desirable land productive use. Margin requirements,consumer credit regulation, directives, credit rationing, moralsuasion and direct action are the different selective or qualitative orspecific instruments of monetary policy. These instruments are asfollows.
1. Margin Requirements
Margin requirement determines the loan value of a collateralsecurity offered by the borrower. The loan value of a security is thedifference between the market value and the margin requirement.For instance, if the market value of 10 grams of gold is Rs.12000and the margin requirement is 25 per cent then the loan value of 10grams of gold as a collateral security would be Rs.9000. Equityshares, bonds, precious metals and other financial land real assetsare accepted by commercial land co-operative banks as collateralsfor granting loans. The Central Bank which is the apex monetaryauthority in a country has the power to determine marginrequirements. Increase or decrease in the margin requirementschanges the loan value of a security. Margin requirements arefixed differently for various types of securities. For instance in Indiamargin requirements for equity shares is 50 per cent of the marketvalue and for commodities it various between 20 per cent and 75per cent. Margin requirements therefore directly influence thedemand for credit without affecting the supply of loans or the rate ofinterest. It is a very instrument used to control speculative activitiesboth in the commodity market as well as money and the capitalmarkets. For instance, the Reserve Bank of India has greatly usedthe instrument of margin requirement to check the hoarding ofessential commodities and their price rise.
2. Regulation of Consumer Credit
A number of consumer durable goods such as televisionsets, washing machines, refrigerators, computers, furniture, carsetc are available on credit repayable in equated monthlyinstallments. Consumer credit is regulated by the Central Bank bydetermining the maximum period of payment i.e. the maximumequated monthly installments and the minimum down payment. Inorder to check consumer credit, the Central bank may increase theminimum down payment and reduce the maximum period ofpayment by reducing the number of equated monthly installment.
114
By doing so, the Central bank not only increases the size of theinitial payment which is known as the minimum down payment butalso the size of the installment. Such an action by the Central bankreduces the demand for consumer credit and thus regulates it.
3. Issue of Directives
The Central bank may direct the Commercial Banks orally orby a written order to control the direction and volume of credit sothat the credit policy followed by the commercial banks is inharmony with the monetary policy objectives of the Central bank.However, issue of directives may not be effective and hence moredirect instruments of monetary policy are put into effect along withthe directives.
4. Credit Rationing
Credit rationing is a qualitative instrument used to controland regulate the purpose for which credit is offered by thecommercial banks. Credit rationing is carried out in two forms,namely; the variable portfolio ceiling and the variable capital assetsratio. The variable portfolio ceiling refers to a ceiling imposed bythe Central bank on the total portfolios of the commercial banks.The ceiling is imposed to ensure that loans and advances do notexceed the given ceiling. Since the Central bank has the right tochange the ceiling, it is called variable portfolio ceiling. Similarly,the Central Bank may also decide the capital assets ratio ofcommercial banks. These measures restrict the loans andadvances made to different categories of borrowers in theeconomy.
5. Moral Suasion and Publicity
Moral suasion refers to formal persuasion and request madeby the Central Bank to the commercial banks. As opposed todirectives, it is an appeal made by the Central Bank to the moralconsciousness of the commercial banks to operate according to theobjectives of the monetary policy. For instance, the Central bankmay request the commercial banks to desist from financingspeculative activities. It is a psychological instrument of monetarypolicy. The Central bank may also exert moral pressure on thecommercial banks by going public on the unhealthy bankingpractices. The Reserve bank of India had used moral suasion forthe first time in September, 1949 by requesting the commercialbanks to exercise restraint in giving advances for speculativepurposes.

115
6. Direct Action
Direct action is a qualitative as well as a quantitativeinstrument of monetary policy. The Central Bank may stoprediscounting facility to those commercial banks whose credit policyis at divergence with its monetary policy. It may refuse to give morecredit to banks where borrowings are in excess of their capital andreserves. It may charge a higher rate of interest for the creditdemanded by commercial banks beyond a certain limit.
9.4 LIMITATIONS OF MONETARY POLICY
The limitations in monetary policy arise on account of thedifficulties encountered in pursuing the policy objectives in lessdeveloped countries and on account of the inherent contradictionsin the macro-economic objectives as discussed earlier. Themonetary policy over the years has revealed the followinglimitations.
1. Limited in Scope:
Macro-economic policy objectives cannot be tackled andachieved only with the help of the instruments of monetary policy.For instance, monetary policy has practically failed in India toachieve both the objectives of price stability and exchange ratestability. Inflation rate had been as high as 25.2 per cent in 1974-75. Even in the first half of the nineties, the rate of inflation hadbeen in double digits. While the instruments of monetary policymay influence the aggregate demand the economy, the failure insupply management will negate the very purpose of monetarypolicy. Thus a combination of policies: monetary, fiscal, exchangerate and income are needed to attack inflation.
2. Preference for Currency Money over Bank Money
In under developed economies like India, people generallyprefer currency money to bank money. Preferences for currencymoney is on account of lack of banking development, ignoranceabout the banking procedures and practices and wide spreadilliteracy in the country. Thus an expansionary money policy byway of a cut in the legal reserve requirements may not be able torealize the desired expansion in money supply. For instance a fiftypercent reduction in the legal requirements would enhance themoney supply by more than 100 per cent provided people do notwithdraw their deposits from the banks. The actual increase inmoney supply will be reduced by the extent of deposit withdrawals.Let us take an example. Let us assume that the excess reservewith the commercial banks is `.900 Billion and the cash reserve

116
ratio is 10 percent. The credit generated would be `.900 Billion ×100 ÷ 10 = `..9000 Billion. Now if the cash reserve ratio is reducedto five per cent, the credit expansion will be `..950 Billion × 100 ÷ 5= 19000 Billion. However, if people withdraw `..450 Billion from thebanking system, then the expansion of credit will be `..500 Billion ×100 ÷ 5 = `.10,000 Billion only. In under-developed economieslike India, a major portion of the money supply is held by the peoplein the form of cash and does not return to the banking system in theform of deposits. This creates a serious limitation on the ability ofthe banking system to create fresh credits on the basis of anincrease in its reserves.
3. Money Market Dualism
A contractionary monetary policy implemented by usingmonetary policy instruments such as the bank rate, the cashreserve ratio and open market operations may not have the desiredeffect if the money market is not well developed or fully integrated.While the organized money market consisting of the commercialbanks, foreign banks, co-operative banks, finance corporations etcmay operate according to the policy objectives of the Central bank,unorganized sector consisting of the unregulated non-bankingfinancial intermediaries, indigenous bankers and money lendershave no connection with the organized sector and are legallyunbound to follow the monetary policy of the Central Bank. Further,when the sub-markets of the money market like the treasury andthe commercial bill market are not well developed, there will be littlepossibility of being completely successful in realizing the monetarypolicy objectives.
4. Parallel Economy
When a monetary transaction is not officially recorded orreported it is known to be a black or an illegal transaction. In under-developed economies, the size and scale of such blacktransactions is enormous. For instance, the black or the paralleleconomy in India is estimated to be more than 50 per cent ofIndia’s national income. Dr. Suraj Gupta of the Delhi School ofEconomics conducted a study on the generation of black incomeand fond that black income was 41, 45 and 50 percent of the GDPat factor cost at current prices in the years 1980-81, 1983-84 and1987-88. In 1994-95, the Parliament Standing Committee estimatedblack money of the order of 130 percent of the GNP estimate inIndia. The black money in circulation was estimated to be `.11Trillion whereas the official GNP estimate was `.8.43 Trillion.Under such circumstances, the monetary policy instruments canbest be described as ineffective tools of monetary management.
117
5. Lack of Independence and Autonomy of the Central Bank
A Central Bank which is subservient to the policies of thegovernment and does not have the required autonomy andindependence to decide its monetary policy in accordance with thenational economic interests cannot imagine achieving its own policyobjectives. For instance, the Federal Reserve Bank which is theCentral Bank of the United States functions as a fully autonomousand independent government agency. It is directly responsible tothe government of the United States. However, in the event of anyconflict between her views and those that of the government, theFed always acts in the economic interest of the nation or in thepublic interest. This is because the decisions made by thegovernors of the Fed are totally independent and cannot beinfluenced from outside. Historical studies have proved that anindependent Central bank is more successful in controlling inflationand thereby protecting the value of a nation’s currency than thoseCentral banks who are controlled by the executive branch of thegovernment. The Reserve Bank of India is not autonomousenough to pursue an independent momentary policy. For instance,the expansion in money supply in order to meet government’sdeficit has always generated inflationary pressures in the Indianeconomy and the government of India has not allowed the Reservebank of India to control inflation because it felt that such an actionwould reduce the rate of growth of the economy. Interest rateadministration and the supply of credit to the different sectors of theeconomy had often been determined by the policy of thegovernment than the policies of Reserve bank of India. However,systemic limitations such as the primacy of government policy overthe monetary policy may vanish once the process of converting theeconomy into a free market economy is complete and the economybecomes more advanced and integrated. Monetary policy can onlybe more effective in a free market economy.
6. Less Effective in Controlling Booms and Recessions
When the economy is booming with progressively higherrates of investment, employment, output, income, demand andprices, monetary policy may not be very effective in controlling highinflation rates particularly when the rate of return on capital is muchhigher than the prevailing interest rates. It will be quite a whilebefore high interest rates starts affecting investment demand andprices. It will be only in the longer run that relatively less efficientfirms starts withdrawing their investments, thus reducingemployment, income, demand and prices. Similarly, during theperiod of depression, when the rate of return on investment is eitheruncertain or negligibly low, investment demand will not pick upeven if the money supply is increased and interest rates arelowered. In fact fiscal policy is more effective in pulling an economyout of depression.
118
7. Lack of Control on the General Liquidity in the Economy
Reduction in money supply and higher interest rates are noteffective enough to reduce the aggregate demand in the economyand therefore prices because the capacity to spend is not onlydetermined by the money supply but also the liquidity position ofindividuals and firms. The general liquidity position is determinedby factors such as cash balances, bank balance, time and savingdeposits, financial assets and the possibilities of borrowing. Thus,a more effective way of controlling prices would be controlling thegeneral liquidity in the economy.
9.5 SUMMARY
1. Monetary policy can be defined as a policy of the Central Bankthat seeks to influence the cost and availability of credit in aneconomy.
2. The broad and general objectives of monetary policy areeconomic growth, full employment, price stability, exchange ratestability and equilibrium in the balance of payments.
3. The instruments of monetary policy available at the disposal ofthe Central Bank can be classified into general or quantitativeinstruments and selective or qualitative instruments.
4. The general instruments consist of the bank rate policy, openmarket operations and cash reserve ratio. The selectiveinstruments of monetary policy are used to regulate the use ofcredit and hence they are sectoral in impact.
5. The selective instruments consist of margin requirements,regulation of consumer credit, use of directives, credit rationing,moral suasion and publicity and direct action.
6. The limitations in monetary policy arise on account of thedifficulties encountered in pursuing the policy objectives in lessdeveloped countries and on account of the inherentcontradictions in the macro-economic objectives.
9.6 QUESTIONS
1. Explain the meaning and objectives of monetary policy.
2. Explain the quantitative instruments of monetary policy.
3. Explain the qualitative or selective instruments of monetarypolicy.
4. Explain the limitations of monetary policy.
119
10
FISCAL POLICY –INSTRUMENTS AND OBJECTIVES
Unit Structure :
10.0 Objectives
10.1 Meaning of Fiscal Policy
10.2 Objectives of Fiscal Policy
10.3 Instruments of Fiscal Policy
10.4 Limitations of Fiscal Policy
10.5 Summary
10.6 Questions
10.0 OBJECTIVES
To understand the meaning of Fiscal policy
To study the objectives of Fiscal policy
To study instruments of Fiscal policy
To study limitations of Fiscal policy
10.1 MEANING OF FISCAL POLICY
The word ‘Fiscal’ is derived from the Greek word ‘fisc’meaning basket. The word ‘fisc’ was used to denote the incomeand expenditure operations of the government while the incomegenerating operations relate to taxation and government borrowing,the expenditur4e operations relates to government spending. Theincome of the government from various sources is called publicrevenue. It includes income from taxes: both direct and indirect.Direct taxes include personal income tax, corporation tax, wealthand gift taxes. Indirect taxes include custom duties, excise dutiesand sales tax. Taxes constitute the bulk of government incomes.Other sources include profits generated by public sectorenterprises, fines, fees, gifts and grants. Other sources arereferred to as non-tax revenue of the government. Similarly, thegovernment makes expenditure on various activities which includessocial and community services, economic services, general
120
services. It is referred to as public expenditure. Broadly speaking,public expenditure and public revenue constitutes the tools of fiscalpolicy which are at the disposal of the government to pursue itsmacro-economic goals.
Fiscal policy can be explained as a policy executed by thegovernment to produce desirable effects on national income outputand employment. Prof. Ursula Hicks says that “fiscal policy isconcerned with the manner in which the different elements ofpublic finance may collectively be geared to forward the aim ofeconomic policy.” Thus for Prof. Hicks, the objective of fiscalpolicy is to achieve the aim of economic policy or in other words,the macroeconomic goals of economic growth, full employment andprice stability. These macroeconomic goals are more preciselybrought out by the explanation given by Prof. Paul Samuelsonand Prof. William Nordhaus. According to them, fiscal policyserves two major economic functions, namely: (1) it sets nationalpriorities, allocates national output among private and publicconsumption and investment, and (2) it provides incentives toincrease or decrease output in the particular sectors of theeconomy. It is through the government budget that the fiscal policyinfluences the major macroeconomic goals. Thus Paul andWilliams defines fiscal policy as “the setting of taxes and publicexpenditures to help dampen the swings of business cycleand contribute to the maintenance of a growing highemployment economy, free from high or volatile inflation.”This definition clearly brings out the objectives of fiscal policy.When income and expenditure as the two broad instruments offiscal policy are used to dampen the swings of business cycle, youare trying to achieve the goal of price stability or economic stability.The goals of high employment rather than full employment whichare more realistic and sustained economic growth are explicit andobvious in the definition. The governments use budgets to planand control their fiscal affairs. The budget shows the plannedexpenditure of government programs and the expected revenuesfrom the tax systems. A budget surplus occurs when governmentincome or public revenue is greater than public expenditure.However, surplus budget has become a thing of the past given themacroeconomic goals of a modern State. A budget deficit occurswhen public expenditure is greater than income.
A deficit budget has become a characteristic feature of fiscalpolicy of all modern governments. A balanced budget occurs whenpublic expenditure is equal to public revenue which is a rarepossibility. When the government has a deficit budget, it means, itis borrowing from the public by issuing bonds which are repayableon maturity in future. The government borrowing known as publicdebt consists of total or accumulated borrowings by thegovernment. It is the money value of government bonds owned by
121
the public, households, banks, businesses, foreigners and othernon-government institutions. In the Indian context, when thegovernment borrowing programs fails to meets its targets, theReserve Bank of India simply prints more notes and fills the gapbetween actual borrowing and desired borrowing which is known asmonetized deficit. Here precisely, monetized deficit is the increasein the net RBI credit to the Government of India. It consists of thenet increase in the holdings of treasury bills of the Reserve bankand its contribution to the market borrowings of the government. Itthus indicates the amount of fiscal deficit that is monetized.Monetized deficit leads to increase in money supply and inflation.
10.2 OBJECTIVES OF FISCAL POLICY
In the foregoing section, we have discussed the meaning offiscal policy and while it was being done, the macro-economic goalsof fiscal policy have been made abundantly clear. Although, bothfiscal and monetary policies are complementary and supplementaryto each other and that their goals are almost the same, theobjective of social justice and equity can only be realized throughthe operation of fiscal policy. There is hardly any difference in themacro-economic goals of countries both highly developed and lessdeveloped or developing countries. However, under-developed,less developed or developing countries may lay greater emphasison the goal of such justice and equity, not because of wideinequalities of income but because of massive land rampantpoverty in these countries. Highly advanced countries have greaterincome inequalities than developing countries but they do notconfront the problem of poverty as much as the developingcountries. For instance, in 1997, in India 44.2% of the populationlived below the poverty line according to the internationallyaccepted measure of poverty i.e. people with less than$1 per capitaper day income whereas in the advanced countries, the problem ofpoverty measured at $1 per day per capita does not seem to exist.For instance, the standard definition of poverty in the United Statesis based on the subsistence cost of living lo family of four.Accordingly, the subsistence cost of living of a family of four wasestimated to be $ 15,569 in 1995. You will now appreciate thatinequalities of income is not a macro-economic issue in the UnitedStates whereas it is major issue in poor countries like India.
The macro-economic goals of fiscal policy of all moderncountries therefore can be stated as high employment, economicgrowth, economic stability land social justice and equity. How theoperation of fiscal policy helps to achieve these goals is explainedbelow.
122
1. High Level of Employment
While the macro-economic goal of high employment remainsthe same, the nature of unemployment differs. In developedcountries, unemployment is largely cyclical and frictional in naturewhereas in poor countries, in addition to cyclical and frictionalunemployment, there may be structural unemployment of adifferent type. For instance, in India we have a wide variety ofunemployment types. The most rampant types are disguised andseasonal unemployment in the agricultural sector. Further, there isa problem of under-employment which is also massive on accountof a faulty HRD policy. In advanced countries, cyclicalunemployment is caused due to deficiency in aggregate demandwhich can be eliminated by compensatory public spending througha deficit budget. The government can spend huge amounts ofmoney on public works programs and generate employment.Cyclical or recessionary unemployment can be corrected only byraising the level of aggregate demand. One of the importantcauses of unemployment in poor and developing countries is theinadequacy of investible resources. They are labor abundant andcapital scarce. Fiscal policy should aim at improving the level ofsavings by giving tax incentives and also promote labor intensiveindustrial growth by giving tax holidays and subsidies. The problemof disguised and seasonal unemployment can be eliminated bylarge scale public works programs on the one hand and rapidindustrialization on the other. However, fiscal policy alone cannoteliminate the problem of unemployment because of its sheermagnitude and variety. A proper agricultural policy, educationpolicy and a population policy will have to work together toeliminate the peculiar problem of unemployment in developingcountries.
2. Sustained Economic Growth
Sustained economic growth refers to a recession freeeconomic growth. The economy is said to be growing when thequantity of goods and services produced in a given year is morethan that of the previous year and when this happens year afteryear we may say that the economy is growing in a sustainedmanner. However, it is the rate of growth of national output thatdetermines the sustainability of the growth process. The rate ofgrowth of output is determined by the capital output ratio.Assuming a capital output ratio of 1:5, a sustained growth rate offive percent per annum would need an investment of 25 per cent ofthe national income year after year. This means that the savingsrate in the economy must be 25 percent per annum. Fiscal policytherefore must be geared to improve or target the savings rate inthe economy. Economic growth as a macro-economic goalremains the same in all countries. However, the process of
123
economic growth should be consistent with other macro-economicgoals such as high employment, economic stability and socialjustice. Further, the rate of economic growth should be greaterthan the rate of population growth so that along with sustainedeconomic growth, the per capital income also rises in a sustainedmanner.
3. Economic Stability
A consistent net positive growth of the economy can bereferred to as economic stability. A creeping rate of inflationbetween 0 to 3 per cent is implicit in the term economic stability. Apersistently high growth rate in the real national income isabsolutely desirable. What is not desirable along with higheconomic growth is high rate of inflation. An inflation rate of morethan five per cent per annum should be considered de-stabilizingmuch because the inflation rate is well below the three per centmark in advanced countries. It is not the fiscal deficit per se thatcauses high price rise, it is in fact the use of this deficit for non-productive purposes that leads to price rise. A moderate fiscaldeficit of less than four per cent of the GDP is consideredconsistent with economic stability. In India, the average inflationrate has been consistently closer toward the double digit markbecause of the persistently high fiscal deficit. For instance, thecombined fiscal deficit of the Centre and the States in 2000-01 was10 per cent of the GDP.
In order to impart economic stability, fiscal policy essentiallyshould be counter cyclical in nature. The upswings landdownswings of the business cycles needs to be controlled. If theprosperity phase of the business cycle is accompanied by high rateof inflation, fiscal policy must be contractionary to control inflation.Prices rise persistently because aggregate demand is persistentlyhigher than aggregate supply of goods and services. Acontractionary fiscal policy by way of reduced public spending andincrease in the taxes can reduce the level of aggregate demandand prices Similarly, in a recessionary situation i.e. when the rateof growth of the economy is consistently falling, an expansionaryfiscal policy will be essential. Increased public spending andreduced taxes will lead to expansion in aggregate demand,investment, employment, output, income and prices.
An inflationary situation is not considered al that problematicin the economy as long as inflation remains in single digit andstable and wage and salary earners, both organized and otherwiseare compensated for the price rise by dearness allowancepayment. However, a deflationary situation is considered highlyalarming because it is accompanied by fall in employment, output,income and prices. Further, a deflationary situation is compounded

124
because organized labor is rigid in terms of a downward revision inwages and salaries which may spin the deflation further down into adepression. Fiscal policy is found to be extremely effective incontrolling deflation and depression because it involves hugeincreases in government spending and raising the level ofaggregate demand in the economy.
4. Social Justice and Equity
A socially just income distribution can be ensured only if theprinciple of equity is borne in mind while determining the pattern ofincome distribution. The concept of equity has two dimensions,namely the horizontal and vertical. When equal people arecompensated or taxed equally, horizontal equity is said to beestablished. When unequal people are compensated and taxedunequally, vertical equity is said to be established. However, theobjective of vertical equity is to reduce the extent of incomeinequality between unequal people so that the undesirableconsequences of unequal incomes are reduced to the minimum.The per capita consumption of an Alsatian dog in a rich family maybe equal to that of the food consumption of a poor wage earningfamily of four. Market mechanism is inherently incapable toaddress the polarity of income distribution or consumption. Hence,State intervention is the only possible solution to reduce the extentof inequalities in income, eliminate abject or absolute poverty.Fiscal policy is effective enough to address the problem of socialjustice and income inequalities by the following measures:
a) Increasing the rate of investment and capital formation.b) Encouraging a socially optimum pattern of investment.c) Reducing income inequalities.d) Controlling inflationary pressures in the economy.
The rate of investment and capital formation can beincreased by increasing the saving- GDP ratio and by restrictingactual and potential consumption. Consumption can be controlledby imposing quantitative restriction on the availability of non-essential consumption goods. Savings can be mobilized by publicborrowing programs and supplementary taxes. The governmentcan use fiscal policy measures to redirect investment in a sociallydesirable manner. Investment in economic overheads such asinfra-structure, basic and capital goods industries and socialoverheads such as health, education and welfare will not onlygenerate huge employment opportunities but also uplift the health,hygienic and economic conditions of the masses. Incomeinequalities can be reduced by a system of progressive taxationbased on the principle of ability to pay. Thus the lowest incomebrackets must be excluded from the tax net and higher incomegroups must be taxed higher and in a progressive manner. In this

125
way, the government can mobilize tax revenue and redistribute theincome in favor of the poor by implementing poverty eradication,health improvement and employment generation programs.Inflationary forces in the economy tend to widen incomeinequalities. Firstly, there is a time gap between price rise andcompensation of the price rise. Secondly, price rise compensationin the form of dearness allowance is available only organized labor.
10.3 INSTRUMENTS OF FISCAL POLICY
Fiscal policy is an effective instrument to control businessfluctuations, both recession and inflation. There are two types offiscal policy, namely: (1) discretionary fiscal policy and, (2) non-discretionary fiscal policy of automatic stabilizers. Discretionaryfiscal policy refers to a deliberate and purposeful change in thegovernment expenditure and taxes to influence the level of nationalincome and prices by influencing the level of aggregate demand forgoods and services. Non-discretionary fiscal policy of automaticstabilizers refers to a built-in tax and expenditure mechanism thatincreases aggregate demand when there is a recession andreduces aggregate demand when there is inflation.
Discretionary Fiscal Policy
Discretionary fiscal policy is of two types, namely: (1) Anti-recessionary fiscal policy and, (2) Anti-inflationary fiscal policy.Anti-recessionary fiscal policy is also known as expansionary fiscalpolicy which is used to draw the economy out of recession.Similarly, anti-inflationary fiscal policy is known as contractionaryfiscal policy which is intended to control inflationary tendencies inthe economy. An anti-inflationary fiscal policy calls for reduction ingovernment expenditure and raising of taxes whereas an anti-recessionary fiscal policy calls for increase in governmentexpenditure and reduction in taxes. In effect, the aim of fiscalpolicy is to influence the level of aggregate demand and prices inthe economy so that the twin goals of macroeconomicmanagement, namely: economic growth and price stability areachieved. Fiscal policy is therefore a policy of demandmanagement. An expansionary or anti-recessionary fiscal policywould result in a deficit budget because the governmentexpenditure will have to be more than its income or there may be afall in government income on account of reduction in taxes. Abudget deficit may because either by increase in expenditurethough borrowing or by reduction in taxes and therefore taxrevenue or a combination of both these factors. The opposite willbe the case of a contractionary or anti-inflationary fiscal policywhereby government expenditure will be reduced and taxes raised.As a result of the reduction in government expenditure, the budgetdeficit may be relatively reduced or here may be a budget surplus.

126
1. Expansionary Fiscal Policy
A fall in aggregate demand due to a fall in private investmentis the cause of recession. A fall in private investment takes placebecause of the poor expectations of businessmen on theprofitability of investments. The fall in aggregate demand createsdeflationary gap in the economy which has to be filled bycompensatory government expenditure or by reducing taxes. Thus,we have two methods to draw the economy out of recession,namely: (a) compensating increase in government expenditure and,(b) reduction in taxes.
(a) Compensating Increase in Government Expenditure
In order to draw the economy out of recession, thegovernment through the technique of compensatory publicspending may embark on a massive public works programconstituting social and economic infrastructure. The construction ofsocial and economic infrastructure consisting of roads, nationalhighways, dams, canals, irrigation projects, electricity generation,schools, hospitals etc would generate demand for capital goodsand labor. This in turn, creates employment not only in the capitalgoods industries but also in the public works program. Additionalemployment will generate additional demand for consumptiongoods. Thus increase in government expenditure generatesdemand both for capital and consumption goods. The incomesgenerated on account of increase in government expenditure willpropagate itself through the income or the investment multiplier.The income or the investment multiplier in turn depends upon themarginal propensity to consume or the marginal propensity to save.The co-efficient of the investment multiplier is given by the formula:
1
1k
MPC
Where ‘k’ stands for the multiplier co-efficient and MPC refers to themarginal propensity to consume.
As 1 – MPC = MPS, the multiplier formula can be restated as:
1k
MPS
Assuming a marginal propensity to save of 20% or amarginal propensity to consume of 80%, an additional governmentexpenditure of Rs. One Trillion will generate an income stream ofRs.5 Trillion through the income multiplier process. Substituting thenumerical values mentioned above in the formula, the change innational income (∆Y) due to a change in investment (∆I) can be measured as follows:

127
.Y I K
Where1
kMPS
Or1
1 0.8k
i.e.1
0.2k
k = 5
Therefore the value of multiplier ‘k’ is 5. Thus ∆Y = Rs.1T X 5 = Rs.5 Trillion. The size of additional government expenditurerequired to fill the deflationary gap will be determined by theinvestment multiplier ‘k’ and the investment multiplier in turn will bedetermined by the marginal propensity to save. The effect ofincrease in government expenditure on national income andemployment can be illustrated with the help of Fig.10.1 givenbelow.
Y45o (C = Y)
C + I2 + G2
E2
D } C + I1 + G1
∆G { FE1 Deflationary Gap
1∆Y = ∆G × _____
MPS∆Y (GNP)
O Y1 Y2 X
National Income
Fig. 10.1 - Compensatory Increase in Government Expenditureas an Example of Anti-recessionary Fiscal Policy
Let us assume that the economy is operating at Y2 level ofoutput and the aggregate demand curve C + I2 + G2 is intersectingthe 45o line at point E2. Due to poor investment prospects, theaggregate private investment falls leading to a fall in the aggregatedemand. As a result, the aggregate demand curve shiftsdownwards and to a lower level i.e. (C + I1 + G1) and the economyshrinks to a lower equilibrium position E1 with Y1 level of nationalincome. The fall in national income and output will lead to open or
Ex
pen
dit
ure

128
involuntary unemployment and idle or excess production capacity inthe economy. The fall in investment E2F creates a deflationary gapand the national income shrinks by Y2Y1 via the reverse multiplier,thus creating recessionary conditions in the economy. To draw theeconomy out of recession, the government increases itsexpenditure (∆G) by E1D, shifting the aggregate demand curve toits original position C + I2 + G2 and national income to Y2. Theincrease in national income Y1Y2 is equal to:
1G
MPS where
1
MPS
However, the anti-recessionary effort of the government willfully succeed only if the rate of interest does not rise. Due toincreased government expenditure, income and employment willrise leading to a rightward shift in the demand for money. If themoney supply remains constant, a rise in demand for money willlead to higher interest rates and fall in private investment demand.The fall in private investment demand will reduce the expansionaryeffect of increased government expenditure. Thus, along with anexpansionary fiscal policy, moneys supply will have to besupplemented by an expansionary monetary policy to keep theinterest rates constant. It only means that fiscal policy alone willnot be good enough to draw the economy out of recession. Theeffect of increase in government expenditure on the transactiondemand for money and the rate of interest and the importance of anexpansionary monetary policy to supplement the governmentaleffort are shown in Fig.10.2 below.
Y
E1 E2
MD2
MD1
O MS1 MS2 X
Quantity of Money
Fig.10.2 - Expansionary monetary Policy to prevent the interestrate from rising as a result of expansionary Fiscal Policy
Rat
ep
fIn
tere
st
129
It can be seen from Fig.10.2 that the Money Demand Curveshifts towards the right as a result of rise in income andemployment. Given the money supply curve MS1 and the newdemand curve MD2, the rate of interest will rise. However, to keepthe interest rate constant, the Central Bank must increase moneysupply by MS1 – MS2. As a result of increased money supply, themoney demand curve MD2 intersects the money supply curve MS2
at point E2 and the rate of interest remains the same. Thus anexpansionary monetary policy supplements anti-recessionary fiscalpolicy and help realize the desired impact on income andemployment.
(b) Tax Reduction as an Instrument of Anti-recessionaryFiscal Policy.
Expansion in income and employment can be realized in arecessionary situation by reducing the tax levels. Obviously, areduction in taxes will increase the disposable income of the peopleland lead to an increase in the aggregate demand. The possibleexpansion in aggregate demand as a result of tax reductiondepends upon two objective factors, namely: the value of taxreduction and the marginal propensity to consume. For instance, ifthe net result of changes in the tax structure is a loss of revenue tothe government of the order of Rs. One Trillion and assuming theMPC to be 80% or that the value of MPC being 0.8, consumptiondemand in the economy will rise by `..80,000 Crores with `..20,000Crores as the savings made by the community. The increase inconsumption demand will have a multiplier effect through the taxmultiplier given by the formula:
1
MPCT
MPC
Or
1
1C
MPC
i.e.0.8
11 0.8
T
= `1 Trillion × 4 = `..4 Trillion.
Or
`80,000 Crores1
1 0.8
= `80,000 Crores × 5 = `4 Trillion.
Thus reduction in taxes will lead to increase in consumptiondemand until the tax multiplier process exhausts itself and in theprocess will also lead to increase in income and employment.However, you will notice that the expansionary effect of a policy oftax reduction is less than that of a policy of budget deficit. In our

130
earlier example, the value of investment multiplier was 5 with MPCbeing 0.8, whereas the tax multiplier is only 4 with the same MPC.
Conclusion
It is obvious from the foregoing discussion that a policy of taxreduction has a relatively less expansionary effect on income andemployment than that of a policy of increase in governmentexpenditure. Further, to obtain an identical effect on income andemployment by a policy of tax reduction, the budget deficit will haveto be proportionately higher than in the case of increase ingovernment expenditure. For instance, to bring about an identicalexpansion in income and employment by way of tax reduction, thecommunity’s disposable income will have to be increased by `1.25Trillion (`1.25 T × 4 = `5 T). The budget deficit thus will be larger incase of adopting a policy of tax reduction. However, the choicebetween the two is not all that easy. It depends upon the relativeefficiencies of the two multipliers. If it is viewed that public worksprograms re relatively less efficient and that there will be leakage inthe government initiated programs, the value of the investmentmultiplier will be reduced by the extent of leakages and the delaysin the execution of public works. In that case, a policy of taxreduction will be advisable. However, real life economics is partpolitics and part economics and hence the choice between the twowill depend upon politico-economic expediency. If politicalexpediency assumes primacy over economic expediency,government spending will be increased because the directbeneficiaries of increased government expenditure are the poorand the unemployed whereas the direct beneficiaries of taxreduction are the classes above the middle which of course in adeveloping country is relatively smaller in size.
2. Anti-inflationary or Contractionary Fiscal Policy
Inflation or price rise is the result of a persistent excessaggregate demand over aggregate supply in the economy. Therise in aggregate demand beyond the capability of the economyduring a given time to offer a matching aggregate supply wouldresult in price rise. The capability of the economy is the productivecapacity with the availability of the given productive resources. Ifthe rise in aggregate demand is on account of a large budget deficitfinanced by borrowing from the Central Bank, there will be anincrease in money supply and prices would rise. Thus, along withrise in aggregate demand, a rise in money supply would also causethe generation of inflationary forces. On account of excessaggregate demand, inflationary gap will be created which if notvacated or neutralized, prices will being to rise. The fiscal policyinstruments to control inflation are: (a) reduction in governmentexpenditure and (b) increase in taxes. Reduction in governmentexpenditure by way of reduction in the budget deficit and or by

131
increasing the taxes, the level of aggregate demand can be broughtdown. The process of decrease in government expenditure and itsimpact on the level of aggregate demand is shown in Fig.8.3. Thefigure shows that the aggregate demand curve C + I + G1 intersectthe 45o line or the line of unity ( C = Y) at point ‘E1’ and determinesequilibrium national income and output at point Y1 which is thepotential productive capacity of the economy during the given timeperiod. Beyond this point if the aggregate demand rises on accountof increase in government expenditure, financed by a budgetdeficit, the aggregate demand curve will intersect the line of unity atpoint E2. The new aggregate demand curve C + I + G2 willdetermine Y2 level of income which is greater than the productivecapacity of the economy determined at point Y1.. Thus excessaggregate demand over aggregate supply by the amount E1Ashown in the figure generates an inflationary pressure causing theprices to rise. Such a price rise or inflation is also known asDemand-pull Inflation.
The inflationary gap can be vacated or neutralized by adecrease in the level of aggregate demand. The level of aggregatedemand can be reduced by a contractionary fiscal policy using thefiscal policy instruments of reduced government expenditure andincrease in taxes. With equilibrium at point E2 and money incomebeing OY2, if the government reduces expenditure by E2 which isequal to the inflationary gap E1A, the aggregate demand curve C +I + G2 will shift downward and once again the original equilibriumlevel of aggregate demand C + I + G1 and Y1 level of nationalincome corresponding to the productive capacity of the economywill be established. You will notice that the fall in the nominalnational income Y2Y1 is much greater than the fall in governmentexpenditure E2B. This is on account of the operation of reverseincome or the investment multiplier.
Alternatively, the government can also bring about anincrease in the direct taxes and reduce the disposable income ofthe community to bring down the level of aggregate demand andprices to their desired level. In the event that the government has abalanced budget and the economy experiences inflationarytendencies, it would mean that there are supply bottleneckscreating a shortfall in supply relative to demand. In such asituation, an anti-inflationary or contractionary fiscal policy by wayof reduction in government expenditure will create a budgetsurplus. The government can vacate the budget surplus either byreducing or by impounding public debt. However, if the bduge5tsurplus is vacated by reducing public debt, the money supply willincrease and thus dampen the anti-inflationary impact of acontractionary fiscal policy. The best way to realize the full impactof a contractionary fiscal policy in the event of la budget surplus isto keep the surplus idle so that money supply does not increase

132
and dampen the deflationary impact of an anti-inflationary fiscalpolicy.
Y45o (C = Y)
C + I2 + G2
Inflationary Gap E2
A }∆G C + I1 + G1
{ B
E1
1∆Y = ∆G × _____
MPS∆Y (GNP)
O Y1 Y2 X
National Income
Fig. 10.3 – Anti-inflationary Impact of a Contractionary FiscalPolicy (Reduction in Government Expenditure)
Non-discretionary Fiscal Policy (Automatic Stabilizers) :
The non-discretionary fiscal policy of automatic stabilizers isa built-in tax and expenditure mechanism that increases aggregatedemand when there is recession and reduces aggregate demand inthe event of inflation in the economy. Thus the tax structure andthe expenditure pattern vary automatically with the changes innational income and help to maintain economic stability. The fiscalmeasures of non-discretionary fiscal policy are hence called built-inor automatic stabilizers. The automatic fiscal stabilizinginstruments are personal income tax, corporate income tax,transfer payments and corporate dividends.
1. Personal Income Tax and Corporate Income Tax
The personal income tax is structured in such a manner thata direct relationship is established between tax revenue and thelevel of income. Further, personal income tax is progressive innature i.e. people in the higher income brackets pay higher rates oftax. For instance, personal income tax ranges between 10%minimum and 30% maximum in India. Individuals with incomeabove Rs.1.5 lakh but less than Rs.2.5 lakhs, the income tax rate is10%. Between Rs.2.5 lakhs and Rs. Five lakhs, the income taxrate is 20% and above Rs. Five lakhs, the marginal or the highest
Exp
endi
ture

133
rate of income tax i.e. 30% is applicable. With rise in nationalincome and consequent rise in personal incomes, the people willhave to pay a larger percentage of their incomes in the form ofincome tax which reduces disposable incomes. Personal incometax therefore automatically reduces the consumption demand andhence the aggregate demand. The fall in aggregate demandchecks the inflationary tendencies in the economy. The reversehappens in the case of fall in national income on account ofrecession when the decline in the disposable income of the peopleis less than proportionate to the fall in national income. However,the utility and efficiency of personal income tax as an automaticstabilizer particularly in the expansionary phase of a business cyclelargely depends upon the honesty of the tax payers. Similarly,taxes on corporate or company incomes are also levied. However,in India, a flat rate of 30% corporation tax is levied unlike personalincome tax which is progressive in nature. Nonetheless, the impactof corporation tax as a built-in automatic stabilizer of business cyclewould be the same as that of personal income tax.
2. Transfer Payments
Transfer payment is a fiscal instrument which redistributesincome in favor of the poor. For instance, unemploymentallowance, subsidies on food and inputs, and other welfare orientedprograms such as free housing for the homeless etc increase thelevel of aggregate demand during a recession and thus reduce theimpact of recession on income and employment. Similarly, duringthe prosperity phase, the quantum of transfer payments re reduced,thus reducing the level of aggregate demand and inflationarytendencies.
3. Corporate Dividends
The Corporate Sector follows a stable dividend policythrough the business cycles. Hence, consumption expenditure onaccount of dividend receipts remains more or less table at all times.During a recession, people who receive dividends on their equityinvestments will have the same consumption expenditure as in thecase of an economic boom. Thus dividend earners will bespending relatively more during a recession and less during theprosperity phase. A stable dividend policy therefore has lamitigating effect on both inflation and recession.
Conclusion
To conclude with this section on discretionary and non-discretionary fiscal policy, it must be stated that the success of lanon-discretionary fiscal policy of automatic stabilizers is contingentupon a number of uncontrollable variables such as tax compliance,
134
honest declaration of incomes, a stable dividend policy and more orless transparent economic system. For instance, the paralleleconomy in India is conservatively estimated about fifty per cent ofthe national income and hence it will be difficult to say that non-discretionary fiscal policy will have any significant role in controllingbusiness cycles. By all means, the discretionary fiscal policy willhave a direct and all pervasive impact on the economy andtherefore it is found to be more effective in controlling businessfluctuations.
10.4 SUMMARY
1. Fiscal policy can be explained as a policy executed by thegovernment to produce desirable effects on national incomeoutput and employment.
2. The macro-economic goals of fiscal policy of all moderncountries therefore can be stated as high employment,economic growth, economic stability land social justice andequity.
3. Fiscal policy is an effective instrument to control businessfluctuations, both recession and inflation. There are two typesof fiscal policy, namely: (1) discretionary fiscal policy and, (2)non-discretionary fiscal policy of automatic stabilizers.
4. Discretionary fiscal policy is of two types, namely: (1) Anti-recessionary fiscal policy and, (2) Anti-inflationary fiscal policy.Anti-recessionary fiscal policy is also known as expansionaryfiscal policy which is used to draw the economy out ofrecession. Similarly, anti-inflationary fiscal policy is known ascontractionary fiscal policy which is intended to controlinflationary tendencies in the economy.
5. The fiscal measures of non-discretionary fiscal policy arehence called built-in or automatic stabilizers. The automaticfiscal stabilizing instruments are personal income tax,corporate income tax, transfer payments and corporatedividends.
10.5 QUESTIONS
1. What is fiscal policy? Explain the objectives of fiscal policy.2. Explain in detail the impact of an expansionary fiscal policy on
national income as a tool of discretionary fiscal policy.3. Explain non-discretionary fiscal policy of automatic stabilizers.

135
11
IS & LM FRAMEWORK
Unit Structure :
11.0 Objectives
11.1 Integrated Approach (The IS and the LM Model)
11.2 Goods Market Equilibrium (The derivation of the IS Curve)
11.3 Money Market Equilibrium (The derivation of the LM Curve)
11.4 The Simultaneous Equilibrium in the Goods and MoneyMarkets
11.5 Impact of Changes in Monetary and Fiscal Policies on Rateof Interest and Level of Income
11.6 Summary
11.7 Questions
11.0 OBJECTIVES
To understand the meaning of IS and LM model
To derive the IS curve in the Goods market
To derive the LM curve in the Money market
To understand the derivation of simultaneous equilibrium in theGoods and the Money market
To study the impact of changes in Monetary and Fiscal policieson the rate of interest and level of income
11.1 INTEGRATED APPROACH (THE IS & LMMODEL)
The goods and the money markets are interlinked by twoeconomic variables, namely: interest rate and national income. Inthis model, interest rate is introduced in the goods market throughinvestment demand. The goods market therefore has two variables– interest rate (i) and national income (GDP). The goods marketequation is known as the IS curve. The IS curve represents equalitybetween saving (S) and investment (I) and all points on the IScurve show goods market equilibrium at different levels of interestand national income. The money market equilibrium is determined

136
by the demand for and supply of money at various levels of interestand national income. The demand for money is a function ofincome and interest rate. The supply of money is determined bythe Central Bank (the RBI in India or the Federal Reserve in theUSA). The money market equation is known as the LM curve. TheLM curve represents equilibrium between demand and supply ofmoney at various levels of interest rates and national income.Various points on the LM curve shows equality between demandfor money (L) and supply of money (M).1
The IS-LM model shows how the equilibrium levels ofincome and interest rates are simultaneously determined by thesimultaneous equilibrium in the two interdependent goods andmoney markets. Hicks, Hansen and Johnson put forward the IS-LMmodel on the basis of Keynesian framework of national incomedetermination in which investment, national income, rate of interest,demand for and supply of money are interrelated and inter–dependent. These variables are represented by two curves,namely; the IS and the LM curves.
11.2 THE GOODS MARKET AND THE IS CURVE
The goods market is in equilibrium when aggregate demandis equal to national income. In a closed two sector economy, theaggregate demand is determined by consumption demand andInvestment demand (AD = C + I). Changes in the interest rate affectaggregate demand through changes in investment demand. Withthe fall in interest rates, the profitability of investment rises becausethe cost of investment falls. Increase in investment demand leadsto increase in aggregate demand and rise in the equilibrium level ofnational income. The IS curve shows the different combinations ofnational income and interest rates at which the goods market is inequilibrium. The derivation of the IS curve is depicted in Figure 11.1below.
In panel (A) of Fig. 11.1 you will notice that the relationshipbetween planned investment and rate of interest is depicted. It willbe obvious from the figure that planned investment is inverselyrelated to the rate of interest. When the interest rate falls, plannedinvestment rises, leading to an upward shift in the aggregatedemand function. The shift in the aggregate demand function isdepicted in panel (B) of the figure, where in, you will see that anupward shift caused in the aggregate demand function leads to ahigher level of national income in the goods market. Thus in thegoods market, the level of national income is inter-connected withthe interest rate through planned investment. The IS curve is thelocus of various combinations of interest rates and the levels ofnational income at which the goods market is in equilibrium.

137
In panel (C) of Fig. 11.1, the IS curve is depicted. It showsthat the changes in the level of national income are a function ofchanges in the level of aggregate demand, planned investment andrate of interest. At the given rate of interest r0, the level of nationalincome Y0 is plotted. When the interest rate falls to r1, plannedinvestment increases to I1 and the aggregate demand functionshifts from AD0 to AD1 and the goods market assumes equilibriumat Y1 level of national income. We therefore plot Y1 level of nationalincome corresponding to r1 level of interest rate. Similarly when theinterest rate further falls to r2, planned investment increases to I2and the aggregate demand curve shifts upward to AD2. Now thegoods market assumes equilibrium at Y2 level of national income. Inpanel (C), the equilibrium national income Y2 is shown against therate of interest r2. By repeating this process for all possible interestrates, we can trace a series of combinations of interest rates andincome levels corresponding to goods market equilibrium. Byjoining points such as E0, E1, E2 etc. in panel (C) of the diagram, weobtain the IS curve. You will notice that the IS curve so obtained isdownward sloping indicating that when the rate of interest falls, theequilibrium national income rises.
National Income
National Income
Rate
of
Inte
rest
Ag
gre
gate
De
man
d
(B)
(C)
O
O
Y
Y
X
X
450
Y0 Y1 Y2
Y0 Y1 Y2
AD0
AD1
AD2
E0
E0
E1
E1
E2
E2
I
I
Planned Investment
Rate
ofIn
tere
st
(A)
O
Y
X
I
I
r0
r0
r1
r1
r2
r2
I0 I1 I2
r
r
II
Fig. 11.1: Derivation of the IS Curve

138
THE SLOPE OF IS CURVE
The IS curve has a negative slope indicating an inverserelationship between the rate of interest and the level of aggregatedemand. A higher interest rate will lower the level of plannedinvestment and hence lower the level of aggregate demand and theequilibrium level of national income. Similarly, a lower interest ratewill raise the level of planned investment and hence higher will bethe level of aggregate demand and the equilibrium level of nationalincome.
The steepness of the IS curve is determined by the elasticityof investment demand curve and the size of the investmentmultiplier. The elasticity of investment demand shows the degree ofresponsiveness of investment expenditure to the changes in therate of interest. If the investment demand is relatively elastic, agiven fall in the rate of interest will result in a more thanproportionate change in investment demand bringing about a largershift in the aggregate demand curve and larger level of nationalincome, thus making the IS curve flatter. Conversely, if theinvestment demand is relatively inelastic, the IS curve will berelatively steep. The steepness of the IS curve is also determinedby the size of the investment multiplier. The value of the multiplier isdetermined by the size of the marginal propensity to consume.Greater the mpc, greater will be the size of the investment multiplierand greater will be the level of national income as a result ofincrease in investment. Thus making the IS curve flatter.Conversely, if the mpc is lower, the IS curve will have a steeperslope.
SHIFTS IN THE IS CURVE
Changes in autonomous expenditure causes a shift in the IScurve. Autonomous expenditure is independent of the level ofincome and the rate of interest. Autonomous expenditure mayincrease on account of increase in government expenditure,increase in autonomous consumption expenditure or increase inautonomous investment demand. Autonomous investment demandmay rise due to increase in firm’s optimism about future profits.Autonomous consumption demand may rise due to households’estimate of future incomes. Government expenditure has anautonomous component given the wide-scale use of deficitfinancing. An increase in autonomous expenditure at a giveninterest rate would shift the aggregate demand curve upwardsleading to an increase in the equilibrium level of national income.With interest rate remaining constant, an upward shift in theaggregate demand curve will cause the IS curve to shift towardsthe right indicating increase in national income at the given interestrate.
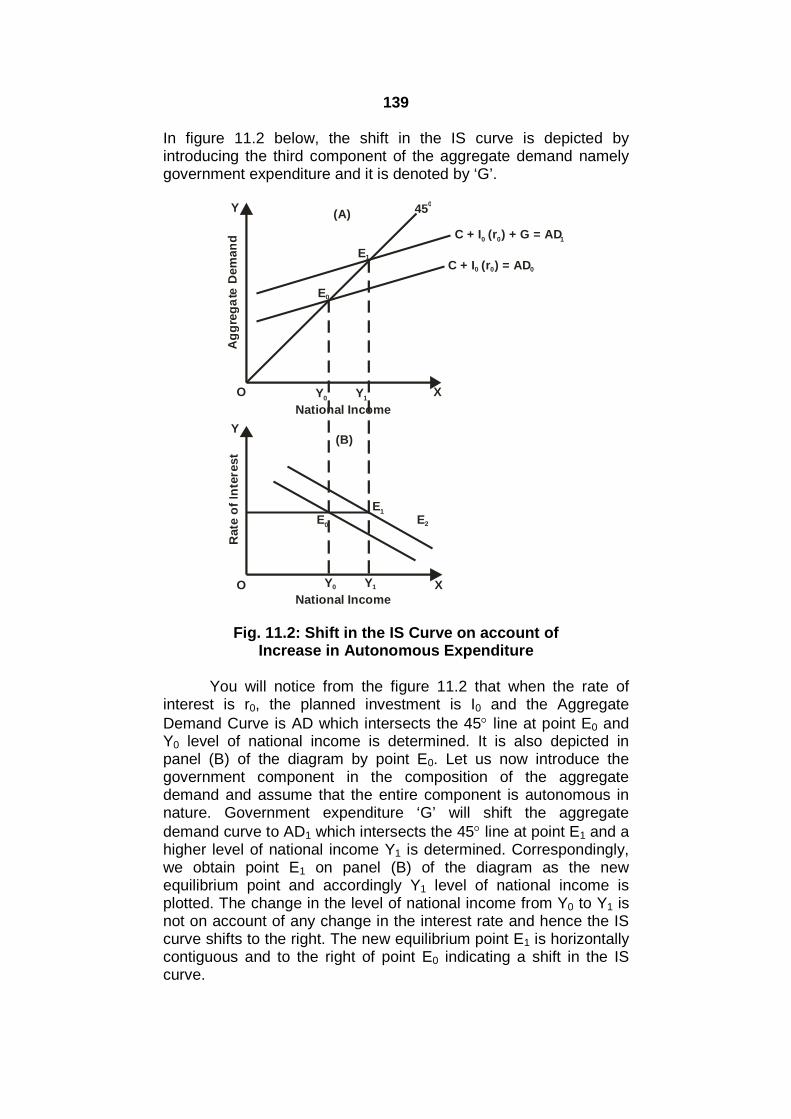
139
In figure 11.2 below, the shift in the IS curve is depicted byintroducing the third component of the aggregate demand namelygovernment expenditure and it is denoted by ‘G’.
National Income
National Income
Rate
of
Inte
rest
Ag
gre
ga
teD
em
an
d
(A)
(B)
O
O
Y
Y
X
X
450
Y0 Y1
Y0 Y1
C + I (r ) = AD0 0 0
C + I (r ) + G = AD0 0 1
E0
E0
E1
E1
E2
Fig. 11.2: Shift in the IS Curve on account ofIncrease in Autonomous Expenditure
You will notice from the figure 11.2 that when the rate ofinterest is r0, the planned investment is I0 and the AggregateDemand Curve is AD which intersects the 45 line at point E0 andY0 level of national income is determined. It is also depicted inpanel (B) of the diagram by point E0. Let us now introduce thegovernment component in the composition of the aggregatedemand and assume that the entire component is autonomous innature. Government expenditure ‘G’ will shift the aggregatedemand curve to AD1 which intersects the 45 line at point E1 and ahigher level of national income Y1 is determined. Correspondingly,we obtain point E1 on panel (B) of the diagram as the newequilibrium point and accordingly Y1 level of national income isplotted. The change in the level of national income from Y0 to Y1 isnot on account of any change in the interest rate and hence the IScurve shifts to the right. The new equilibrium point E1 is horizontallycontiguous and to the right of point E0 indicating a shift in the IScurve.

140
The movement along the IS curve indicates shifts inequilibrium income caused by shifts in the aggregate demand curveas a result of changes in interest rates. A shift in the aggregatedemand curve caused by any other factor other than interest ratemust be represented by a shift in the IS curve.
11.3 THE MONEY MARKET AND THE LM CURVE
The LM curve shows the different combinations of interestrates and incomes corresponding to equilibrium in the moneymarket. According to Keynes, liquidity preference is the sum oftransaction and speculative demand for money. The transactiondemand for money is directly related to the level of income and thespeculative demand for money is inversely related to the rate ofinterest. The total money demand function can be stated as: Md =L(Yr), where ‘Md’ stands for demand for money, ‘Y’ for real incomeand ‘r’ for rate of interest. The LM curve can be obtained bydrawing a series of money demand curves at various levels ofincome intersecting the supply curve of money as determined bythe monetary authorities. The LM curve so obtained shows variousinterest rates given the demand for and supply of money at differentlevels of income. The derivation of the LM curve is depicted in Fig.11.3 below.
National Income
(B)
O
Y
XY0 Y1
E0E0
E1
E1
LM
Quantity of Money
Rate
of
Inte
rest
(A)
O
Y
X
M (Y )d0 0
Md (Y )1
1
r1
r0
r1
r0
Ms
Fig. 11.3: Derivation of the LM Curve
In Fig. 11.3 above, panel (A) shows various money marketequilibrium points at different levels of income and panel (B) depictsthe derivation of the LM curve showing the different combinations ofinterest rates and income corresponding to money marketequilibrium. In panel (A), the Ms curve indicates the supply ofmoney as fixed by the monetary authorities. For the given incomelevel Y0, the money demand curve Md0 is drawn which intersectsthe supply curve at point E0. Point E0 indicates the initial money
141
market equilibrium. It shows that when the money demand is Md0,the interest rate is r0.
In panel (B) of the figure, the corresponding point E0 isshown. At point E0, the money market is in equilibrium with thecombination of income level Y0 and interest rate r0. At the higherincome level Y1, the demand for money will be higher at eachinterest rate. The new money demand curve Md1 at interest rate r1,intersects the supply curve at point E1. Point E1 is the new moneymarket equilibrium. At a higher income level, the quantity of moneydemanded rises but higher interest rates reduces the quantity ofmoney demanded to the original level. In panel (B), point E1 isplotted showing the new money market equilibrium with interestrate r1 and income level Y1. By considering all possible incomelevels and by plotting the money demand curves at each incomelevel and by plotting the corresponding equilibrium points in panel(B), the LM curve is derived.
THE SLOPE OF THE LM CURVE
The LM curve is upward sloping. At higher income levels, itrequires higher interest rates to maintain the money marketequilibrium with constant money supply. If the quantity demandedof money is proportionately greater than the change in the incomelevel, the interest rate will be higher and steeper will be the slope ofthe LM curve. Further, if the quantity demanded of money is lessresponsive to the rise in interest rates, greater will be the rise ininterest rate to maintain the money market equilibrium and steeperwill be the LM curve. Conversely, the more the quantity of moneydemanded responds to interest rates and the less it responds toincome, the flatter will be the LM curve.
SHIFTS IN THE LM CURVE
Given the money demand function, an increase in moneysupply will lead to fall in interest rate at the given level of income.With fixed income level the rate of interest must fall with a rise inmoney supply in order to maintain the money market equilibrium.The fall in interest rate will shift the LM curve to the right indicatinga rise in the money demand function. This is depicted in Fig. 11.4below.

142
Fig. 11.4: Shift in the LM Curve on account of Increase inMoney Supply
You will notice in panel (A) of fig. 11.4 that with the initialmoney supply Ms
0 at Y0 level of income, the money market is inequilibrium at the interest rate r0. When the money supply increasesto Ms
1 at r0 interest rate, there is excess money supply at the givenincome level Y0. In order to maintain the money market equilibrium,the interest rate must fall to r1 if the people are induced to demandmore money at the income level Y0 and the new money supply Ms
1.The new interest income combination (r1, Y0) will be on LM1 asshown in panel (B). Similarly, with the increase in money supplyfrom Ms
0 to Ms1 and with the given interest rate r0, the income must
increase to Y1 so that more money is demanded corresponding tothe new money supply Ms
1. You will notice in panel (A) that with theincrease in money supply at the given interest rate r0, the incomeincreases and raises the money demand curve to Md1(Y1) and themoney market is in equilibrium at point ‘E2’ with r0 as the interestrate and Y1 as the income level. The new interest-incomecombination (r0, Y1) is plotted on the LM1 curve in panel (B). Thusincrease in money supply will shift the LM curve to the right and ifthe money supply is reduced, it will raise the interest rate at thegiven level of income and cause the LM curve to shift to the left.
11.4 EQUILIBRIUM IN THE GOODS AND MONEYMARKETS
The equilibrium rate of interest and the level of income isdetermined at the intersection point of the IS and LM curve. Thegoods market is in equilibrium at all points on the IS curve and themoney market is in equilibrium at all points on the LM curve.Hence, only at the point of intersection between these two curves,both the money market and the goods market will be

143
simultaneously assuming equilibrium. Such an equilibrium conditionis depicted in Fig. 11.5 below.
National Income
Ra
teo
fIn
tere
st
Y
B
C
IS
D
A
E
LM
XO
r0
r1
r2
Y1 Y2Y0
Fig. 11.5: Simultaneous Equilibrium in the Goods and MoneyMarket
The simultaneous equilibrium in both the markets isdetermined at point E, whereby r0 is the interest rate determinedand Y0 is the level of national income. At interest rate r1 and incomelevel Y1, the goods market will be in equilibrium at point ‘A’ on theIS curve. But at the interest rate r1, the money market will be inequilibrium only at income level Y2 at point ‘B’ on the LM curve. Atinterest rate r1, the income level Y1 is too low for money marketequilibrium and hence the money demand is not enough to matchthe given quantity of money supply. With excess supply of money,interest rate will fall until it reaches r0 level. At r0 interest rate,aggregate demand and national income would have risensufficiently to increase money demand so that equilibrium in the twomarkets is obtained. Alternatively, at r2 interest level, the incomelevel Y2 required for goods market equilibrium at point ‘C’ is greaterthan the income level Y1 required for equilibrium in the moneymarket at point ‘D’. With income too high for money marketequilibrium, there is excess demand for money pushing the interestrates up until they reach r0 with Y0 income level where both marketsare in equilibrium.
11.5 FISCALAND MONETARY POLICIES AND THEIS-LM MODEL
The IS-LM model helps us to explain as to how changes inmonetary policy initiated by the Central Bank of a country andchanges in fiscal policy initiated by the Government of a countryinfluences the rate of interest and the level of national income in acountry.

144
FISCAL POLICY AND IS-LM MODEL
Changes in fiscal policy can be explained in terms ofchanges in government expenditure and changes in taxes imposedby the Government. We will first look at the impact of increase ingovernment expenditure on the rate of interest and the level ofnational income. This is shown in Fig. 11.6 below. Autonomousincrease in government expenditure raises aggregate demand forgoods and services produced in an economy and pushes the IScurve to the right in the upward direction. You will notice thatautonomous increase in government expenditure shifts the IS curvefrom IS1 to IS2. Here, the horizontal distance between the two IS
curves is equal to G 1
MPS which shows the increase in income
that takes place according to the Keynesian multiplier. You maynotice that with the LM curve remaining constant, the IS2 curveintersects the LM curve at point F. The IS-LM model thereforeexplains us that with the increase in autonomous governmentexpenditure (G), the equilibrium shifts from point E to point F andthe rate of interest rises from R1 to R2 and the level of nationalincome increases from Y1 to Y2. The IS-LM model thereforeexplains us that increase in autonomous government expenditureor expansionary fiscal policy helps to increase both the level ofnational income and the rate of interest.
An interesting point that IS-LM model brings to light is thedifference in the increase in national income as given by theKeynesian multiplier and the one given by this model. The increasein national income by Y1Y2 is less than what would happen giventhe Keynesian multiplier. Keynes assumed that investment is fixedand autonomous and brought out his concept of investmentmultiplier to explain changes in national income as a result ofchanges in investment expenditure. However, the IS-LM modeltakes into consideration the fall in private investment due to the risein interest rate that takes place with the increase in governmentexpenditure. The extent of fall in private investment expenditure asa result of rise in interest rates is termed as Crowding Out effect.Similarly, a fall in government expenditure will bring about theleftward shift in the IS curve and with the LM curve remainingconstant, the rate of interest will fall along with a fall in the level ofnational income. Reduction in government expenditure to controlinflation is an example of Anti-inflationary or Contractionary fiscalpolicy.
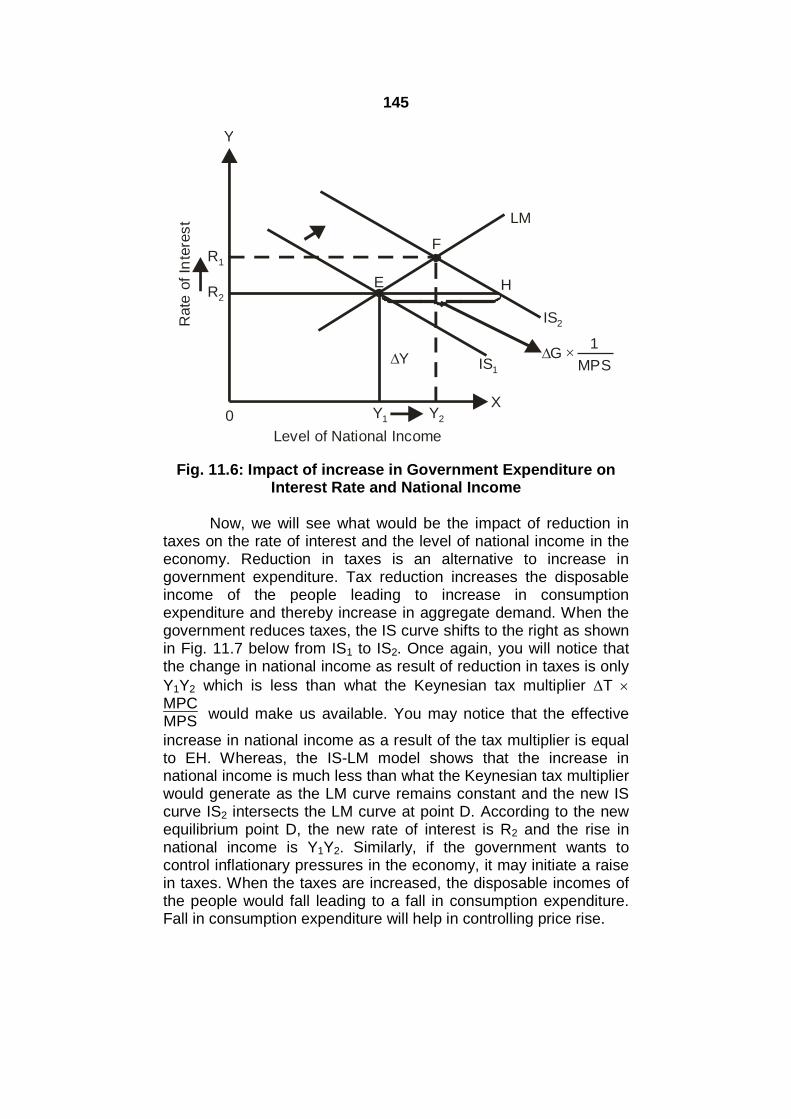
145
R1
X
Y
Rate
ofIn
tere
st
0
R2
Level of National Income
Y1 Y2
F
DY
H
IS1
IS2
E
DG1
MPS´
LM
Fig. 11.6: Impact of increase in Government Expenditure onInterest Rate and National Income
Now, we will see what would be the impact of reduction intaxes on the rate of interest and the level of national income in theeconomy. Reduction in taxes is an alternative to increase ingovernment expenditure. Tax reduction increases the disposableincome of the people leading to increase in consumptionexpenditure and thereby increase in aggregate demand. When thegovernment reduces taxes, the IS curve shifts to the right as shownin Fig. 11.7 below from IS1 to IS2. Once again, you will notice thatthe change in national income as result of reduction in taxes is onlyY1Y2 which is less than what the Keynesian tax multiplier T MPCMPS would make us available. You may notice that the effective
increase in national income as a result of the tax multiplier is equalto EH. Whereas, the IS-LM model shows that the increase innational income is much less than what the Keynesian tax multiplierwould generate as the LM curve remains constant and the new IScurve IS2 intersects the LM curve at point D. According to the newequilibrium point D, the new rate of interest is R2 and the rise innational income is Y1Y2. Similarly, if the government wants tocontrol inflationary pressures in the economy, it may initiate a raisein taxes. When the taxes are increased, the disposable incomes ofthe people would fall leading to a fall in consumption expenditure.Fall in consumption expenditure will help in controlling price rise.

146
R1
X
Y
Rate
ofIn
tere
st
0
R2
Level of National Income
Y1 Y2
D
IS1
IS2
E
LM
DYDT
MPS´
MPC
F1 2 3
Fig. 11.7: Impact of Reduction in Taxes on Interest Rate andNational Income
MONETARY POLICY AND THE IS-LM MODEL
The monetary policy of the government is determined andexecuted by the Central Bank of the country. Changes in themonetary policy can bring about changes in the rate of interest andthe level of national income. Like fiscal policy, the monetary policycan be expansionary or contractionary. In order to increase theavailability of credit and push economic growth rate to a higherlevel, the Central Bank may follow an expansionary monetarypolicy. However, in times of rising prices, the Central Bank mayfollow a contractionary or tight monetary policy to control the risingprices. The IS-LM model can be used to show the impact of bothexpansionary and contractionary monetary policies on the rate ofinterest and the level of national income. Changes in money supplywill cause a shift in the LM curve. While increase in money supplywill shift the LM curve to the right, the opposite will happen whenmoney supply is reduced. Assuming that the economy is in a stateof recession i.e., when the growth rate in the national income isregularly falling, the Central Bank would follow an expansionarymonetary policy to draw the economy out of recession. The CentralBank would follow steps that would increase money supply in theeconomy. Increase in money supply, with demand for moneyremaining constant would create a downward pressure on the rateof interest and the rate of interest would fall. When the interest ratefalls, investment demand will rise leading to an increase in nationalincome in the economy. Thus, with the increase in money supply,the LM curve will shift towards the right and intersect the constantIS curve at point D as shown in Fig. 10.8 below. You will notice thatthe economy moves from the initial equilibrium point E to D, therate of interest falls from R1 to R2 and the level of national income

147
increases from and the level of national income increases from Y1
to Y2. The IS-LM model therefore shows that expansion in moneysupply lowers the rate of interest and increases national income.Similarly, if the economy is caught in an inflationary spiral, theCentral Bank may follow a tight monetary policy that is it wouldreduce money supply and bring about a rise in the rate of interestand fall in the level of national income. Less income will reduce theaggregate demand in the economy and reduce the pressure onrising prices thereby controlling the inflation rate.
Level of National Income
Y1 Y2
E
IS
R1
R2
Rate
ofIn
tere
st
X
D
LM2
LM1
Y
0
Fig. 11.8: Impact of Expansionary Monetary Policy on InterestRate and National Income
11.6 SUMMARY
1. The IS-LM model shows how the equilibrium levels of incomeand interest rates are simultaneously determined by thesimultaneous equilibrium in the two interdependent goods andmoney markets.
2. The IS curve shows the different combinations of nationalincome and interest rates at which the goods market is inequilibrium. The IS curve has a negative slope indicating aninverse relationship between the rate of interest and the level ofaggregate demand.
3. The LM curve shows the different combinations of interest ratesand incomes corresponding to equilibrium in the money market.The LM curve is upward sloping. At higher income levels, itrequires higher interest rates to maintain the money marketequilibrium with constant money supply.

148
4. The equilibrium rate of interest and the level of income isdetermined at the intersection point of the IS and LM curve. Thegoods market is in equilibrium at all points on the IS curve andthe money market is in equilibrium at all points on the LM curve.Hence, only at the point of intersection between these twocurves, both the money market and the goods market will besimultaneously assuming equilibrium.
5. The IS-LM model helps us to explain as to how changes inmonetary policy initiated by the Central Bank of a country andchanges in fiscal policy initiated by the Government of a countryinfluences the rate of interest and the level of national income ina country.
6. The IS-LM model can be used to show the impact of bothexpansionary and contractionary monetary policies on the rateof interest and the level of national income.
11.7 QUESTIONS
1. What is an IS curve? Explain the derivation of the IS curve.
2. What is a LM curve? Explain the derivation of the LM curve.
3. Explain how simultaneous equilibrium in the goods market andthe money market is determined.
4. What determines the slope of the IS curve?
5. Explain how increase in the level of autonomous expenditureleads to a shift in the IS curve?
6. What determines the slope of the LM curve?
7. Explain how increase in money supply leads to a shift in the LMcurve?
8. Explain the impact of fiscal policy on the rate of interest andlevel of income.
9. Compare the impact of increase in government expenditure andreduction in taxes on the rate of interest and national income.
10.Examine the impact of monetary policy on the rate of interestand national income.
149
12
Module 4
BASIC ISSUES IN ECONOMICDEVELOPMENT
Unit Structure :
12.0 Objectives
12.1 Rationale of Economic Reforms
12.2 Trends in India’s National Income Since 1991
12.3 Changes in the Sectoral Composition of National Income
12.4 Changes in the Occupational Structure of Indian Economy
12.5 Summary
12.6 Questions
12.0 OBJECTIVES
Understand the rationale and key elements of New EconomicPolicy, 1991.
Understand the trends in India’s national income and per capitaincome since 1991.
Understand the sectoral composition of national income andchanges in it since 1991.
Understand the nature and changes in the occupationalstructure of India.
12.1 RATIONALE OF ECONOMIC REFORMS
The New Economic Policy (NEP) 1991 is a response to theunprecedented economic crisis that the Indian economy was forcedto face during the early months of 1990. It should be borne in mindthat the Indian economy was facing the same problems of hugefiscal deficits, unsustainable current account deficits and inflationproblem since Independence. What made the crisis of the early1990 was that the economy could not mobilise the resources tomeet its requirements as it could do on earlier occasions. The fourmajor causes for this are as under:
150
a. Political uncertainty abroad resulted in the loss of remittancesdue to the Gulf War. The collapse of the USSR caused the loss ofpolitical support. The domestic political uncertainty due to minoritygovernments further added to the problem. India failed to generateexternal assistance to meet its requirements as it could do duringthe earlier occasions.
b. The government resorted to expansionary fiscal policy after1980. Most of this expenditure was financed through fiscal deficits.The gross fiscal deficit as a percentage of GDP rose from 5.1 in1981-82 to 7.8 in 1990-91. To finance these, the centralgovernment resorted to public borrowing. The debt of governmentrose from 33.3 percent of GDP to 49.7 percent in 1990-91. Thismeant that most of the funds were taken away be the governmentto finance its current expenditure undermining the efficient use ofresources. The interest payments on public debt rose from 2percent of GDP to 3.8 percent during this time. As a percentage ofcentral government expenditure, they rose from 10 percent to 22percent. Thus, most of the government funds were allocated tointerest payments for loans that failed to generate any income. By1990-91, interest payments accounted for 39.1 percent of the totalrevenue of the central government. The fiscal deficit was 3.1 timesthe estimated during the Sixth Plan and 2.5 times the estimated inthe Seventh Plan. The fiscal situation led to the crowding-out ofprivate investment and inefficient use of scarce funds by thegovernment causing low growth of output.
c. The third was the unsustainable balance of payments. Due toslow growth rate of exports and increasing imports, India alwayshad adverse trade balance since 1950. The trade deficit wasfinanced by remittances as noted earlier. As a result, the currentaccount deficit was within the manageable limits. Liberal externalassistance was also a source of foreign exchange. Since 1980-81,India started relying on short-run external commercial borrowings tofinance its current account deficits. The use of external commercialborrowings to finance these deficits is seen in the external debtrising from 12 percent of GDP to 23 percent. This resulted inexternal debt servicing burden. The debt servicing rose from 15percent of export earnings in 1980-81 to 30 percent in 1990-91.Thus, exports were insufficient to meet the needs of the economy.The loss of factor income due to the Gulf War led to the currentaccount deficit increasing from 1.35 percent of GDP in 1980-81 to3.69 percent in 1990-91. The situation became so grave that byJanuary 1991, and June 1991, India’s foreign exchange reserveswere sufficient to cover only seven days of imports. This called forradical measures to restore international faith in Indian economy.
d. The price situation became worse during the 1980s. The annualrate of wholesale inflation during the second half of the 1980s was

151
about 6.7 percent. The price situation worsened by 1990-91 withthe wholesale price index rising by 10.3 percent, and the consumerprices rose by 11.2 percent. The food inflation meant loss of realincome for the community. High food prices dampen demand forindustrial goods and also erode the savings.
The economic reforms of 1991 were based on the twoprinciples of macroeconomic stabilisation and structural adjustment.Stabilisation deals with the control of inflationary forces that causemisallocation of resources. It refers to aggregate demandmanagement to ensure low and stable rates of inflation withsustainable fiscal and external balances. Structural adjustmentrefers to improving the supply-side conditions in the economy.Thus, it can be seen that stabilisation and adjustment arecomplementary. We now examine each of these two concepts asattempted in India after 1991.
A. Macroeconomic Stabilisation/Stabilisation: Stabilising themacroeconomic activity calls for addressing three interrelatedissues. The first of these is the control of inflation; the second isfiscal adjustment; and the third is the balance of paymentsadjustment. We shall now examine each of these in turn.
1. Control of Inflation: Since inflation increases the cost ofproduction it is inimical to the long-run growth of the economy.Control of inflation calls for attention to four inter-related issues:
a. Liquidity hangover needs to be addressed by controlling thegrowth of broad money (M3). In India control on money supplywas through elimination of budgetary deficits.
b. Growth of Agricultural Output: Since food inflation is the mainsource of price rise, measures are needed to promoteagricultural production.
c. Fuel Prices: India depends on imports for its energyrequirements. The world fuel prices are an important source ofcost-push inflation.
d. Foreign Exchange Flows: The scarcity of foreign exchangeresults in balance of payments constraints on the growth of theeconomy. However, attempts to attract foreign capital result involatility. It is observed that often the wide fluctuations in capitalflows accentuate the domestic fluctuations.
2. Fiscal Adjustment: Fiscal deficits cause excess absorptionover output. Huge budget deficits cause domestic inflation as wellas current account deficits. However, in a developing economy likeIndia, public expenditure will necessarily be higher than the publicrevenue. Since the propensity to consume is high for public

152
expenditure, it is necessary to keep deficits within manageablelimits. The fiscal adjustment is the most difficult part of the structuraladjustment. Since the government is often seen as a source ofimportant provider, any attempts at reducing public expenditureand/or increasing levies is seen as an attempt to rob the public. Aspart of the economic reforms programme, the government coinedthe phrase, “structural adjustment with human face”. Thus, thegovernment proposed to reduce wasteful public expenditure withoutsacrificing its socio-economic objectives. A reduction in currentrevenue is the main cause of deficits in India. The imprudentincrease in public expenditure needs to be controlled. As part of thefiscal consolidation, the government announced the Medium-TermFiscal Policy and proposed to bring the gross fiscal deficit to 4percent of GDP by the mid-1990s. Though the government couldreduce the deficits initially, by 1998-99, the gross fiscal deficit was6.5 percent of the GDP. The Fiscal Responsibility and BudgetManagement (FRBM) Act of 2004 set the targets for revenue andgross fiscal deficits.
However, the committed expenditure on salaries, and debtservicing, expenditure on defence and subsidies resulted in thefailure to contain revenue expenditure. To meet the deficit targetsthe government has been reducing the expenditure on socialsectors. This can adversely affect the social welfare in the long-run.
Another important aspect of fiscal adjustment is the failure tomobilise tax and non-tax revenue. Rationalisation of tax rates,introduction of value-added tax (VAT), services tax are some of theimportant measures attempted by the government. Tax revenue toGDP ratio is still very low in India when compared to othercountries.
Imposition of user-charges is another means of mobilisingnon-tax revenue. Many of the public services like electricity,irrigation, transport and water supply, are very lowly priced and donot reflect the marginal cost of production. The failure to reduce thecurrent expenditure and reductions in capital expenditureundermine the long-term growth of the economy.
3. Balance of Payments Adjustment: Current account deficitsare essentially a result of excess imports over exports. Thesedeficits will force the country to borrow from abroad. As more fundsare diverted to meet these requirements, the country is faced withdebt servicing problem. At the same time larger amortisation willleave lesser export revenues to finance the import requirements. Aspart of the balance of payments adjustment government took thefollowing measures:
153
a. In order to stop speculation in the foreign exchange market,the Indian rupee was devalued by 18 percent in two steps onJuly 1 and 3 of 1991. The Cash Compensatory Scheme(CCS) was also abolished. The government introduced EximScrips that are freely traded in the market.
b. In 1992-93 the Liberalised Exchange Rate ManagementSystem (LERMS) was introduced. The exporters are tosurrender forty percent of export revenue to the Reserve Bankat the official rate and are allowed to trade the remaining sixtypercent at the market rate.
c. There was significant lowering of customs duties. The peakimport duty was brought down from 300 percent in 1991 to 20percent by 2011. The lowering of import duties reduces thecost of production and improves the efficiency of the industrialsector.
d. The government took various measures to promote exportsthrough sensitising the producers. It provided incentives toexporters in terms of liberal access to inputs. The success ofthe stabilisation programme is seen in the fact that the currentaccount deficit never caused the panic during the 1990s and2000s as it did in the 1980s.
B. Structural Reforms: These are the measures undertaken tointegrate Indian economy with the world economy and thereby reapthe advantages of international division of labour. The measures inthe following four areas are the structural reforms. India’s structuraladjustment programme was aimed at bringing about changes withleast sacrifice in the welfare of the people. Therefore, thegovernment termed it as “structural adjustment with a human face”.
1. Reforms in Trade and Capital Flows: As a first step in structuraladjustment, the government devalued the Indian rupee in twosteps by eighteen percent on the first and third of June 1991. Italso abolished the Cash Compensatory Scheme (CCS). It wasfollowed by Liberalised Exchange Rate System (LERMS).Under this scheme, each exporter is allowed to retain part of theforeign exchange earnings and surrender the remaining part tothe Reserve Bank at the official rate. This was followed by fullconvertibility of all current account transactions in April 1994.The government also simplified the export and importprocedure. As of the present only three items of imports aresubject to licensing. Between 1991-92 and 2007-08, thegovernment reduced the peak import duty from 300 to tenpercent. The other measures in trade reforms include amongothers, the setting-up of Export Oriented Units (EOUs) andSpecial Economic Zones (SEZs), Star Trading Houses,allowance for 100 percent Foreign Direct Investment (FDI) in

154
export-related industries, simplification of the Export PromotionCapital Goods (EPCG) Scheme, and provision of advancedlicenses for import of inputs. The government has set-up ofForeign Investment Promotion Board (FIPB) to ensure speedyclearance of investment proposals by foreign companies.
2. Industrial Deregulation: Many studies have pointed out thatbureaucratic control and industrial licensing policies havediscouraged industrial sector in our country. As part of structuraladjustment, government scrapped the Monopolies andRestrictive Trade Practices (MRTP) Act. It also removed thephased manufacturing programme to allow greater flexibility inindustrial production. To infuse competition and efficiency inindustrial sector, the public sector reservations were reducedfrom seventeen to three. Industrial licensing is now removed forall but five products.
3. Public Sector Reforms and Disinvestment: When the SecondFive Year Plan was launched in 1956; the public sector wasgiven importance. However, over the years, it failed to deliverboth in terms of output and quality. It was plagued with losseswhich proved to be a drain on the economy. To promoteefficiency and accountability, government started grantinggreater managerial autonomy to these units. In case of some ofthe units is opted for selling them to the private sector. This isdisinvestment policy designed to transfer the management ofthe public sector units and thereby ensure greater efficiency.However, it is generally believed that public sectordisinvestment programme is not properly planned andgovernment is considering it only as a source of revenue tofinance fiscal deficits than to promote efficiency.
4. Financial Sector Reforms: An efficient financial system isessential for the proper use of scarce resources. In order topromote efficiency and competitiveness of the financial systemthe government appointed the Committee on Financial SectorReforms (1991) and the Committee on Banking Sector Reforms(1998) under the chairmanship of N. Narasimham, the formerGovernor of the Reserve Bank of India. The recommendationsof these two committees resulted in the lowering of StatutoryLiquidity Ratio (SLR) to 24 percent and the Cash Reserve Ratio(CRR) from 12.5 percent in 1991 to 4 percent by February 2013.This has resulted in infusion of liquidity into the system andlowering the preemption of funds by the government at the costof the rest of the economy. The committee also recommendedthe introduction of Capital Adequacy Norms to reduce the risk ofdefault in the banking system. As a result, the Reserve Bankadopted the Basel II norms on Capital to Risk-weighted AssetRatio (CRAR). Further, the branch licensing was abolished and
155
the commercial banks were allowed to open new brancheswithout any restrictions. Since the interest rate should reflect thecost and availability of funds, the Reserve Bank deregulated thedeposit and lending rates and commercial banks are given thefreedom to determine their own interest rates. Further, theBoard for Financial Supervision is set-up to ensure the smoothcontrol of the banking system. The government also introducedthe system of budgetary support for re-capitalisation of the weakbanks with the objective of lowering the non-performing assets(NPAs). All these measures have ensured promotion ofefficiency in the Indian banking system.
Criticism:As a result of the economic reforms, India emerged as the
second fastest growing economy of the world after China. However,it should be noted that all is not well with the economic reforms.Some of the areas of concern still remain and needs to beaddressed for the long-run well being of the economy. We shallnow examine some of them.
1. Economic reforms in India resulted in the neglect of agriculturalsector. With emphasis on the participation of the private sector,the government reduced the real public sector investment inirrigation and other activities. As a result, there is widespreadagrarian distress.
2. Economic reforms failed to ensure equity. India’s humandevelopment levels are one of the lowest in the world. This is adirect challenge to the making of economic policy. Unless theequity aspect of growth is addressed properly and adequately,the long-run sustainability of economic growth is questionable.
3. Reliance on private sector to promote growth is understood asgovernment opting out of economic welfare. As a result, thereare acute shortages of important public goods and opposition tothe industrial policies that cause exploitation of men and nature.
4. The fiscal policy failed to bring about the necessary changes interms of expenditure. The reductions in social sector spendingboth by the central and state governments resulted in increasein deprivation levels and worsening of living conditions.
5. The opening-up of the economy resulted in greater vulnerabilityof the economy to the external factors. As seen during the GreatRecession of 2009-12, Indian economy is now more fragile thanit was before.
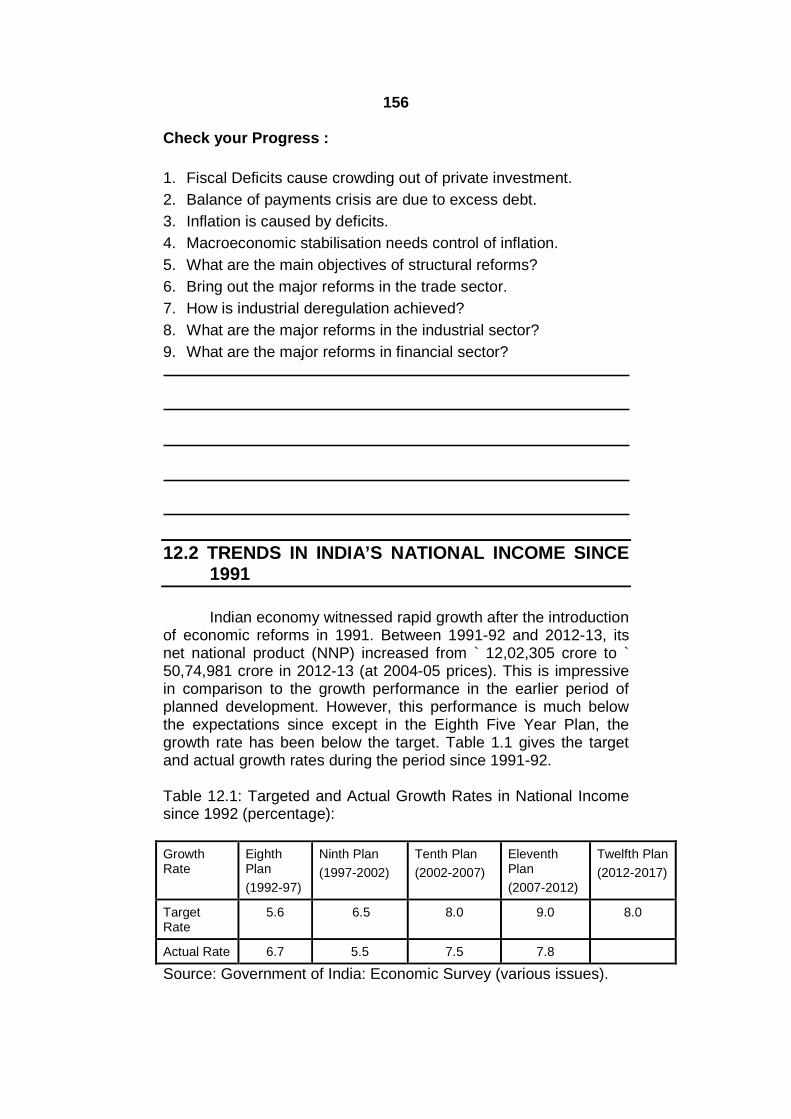
156
Check your Progress :
1. Fiscal Deficits cause crowding out of private investment.
2. Balance of payments crisis are due to excess debt.
3. Inflation is caused by deficits.
4. Macroeconomic stabilisation needs control of inflation.
5. What are the main objectives of structural reforms?
6. Bring out the major reforms in the trade sector.
7. How is industrial deregulation achieved?
8. What are the major reforms in the industrial sector?
9. What are the major reforms in financial sector?
12.2 TRENDS IN INDIA’S NATIONAL INCOME SINCE1991
Indian economy witnessed rapid growth after the introductionof economic reforms in 1991. Between 1991-92 and 2012-13, itsnet national product (NNP) increased from ` 12,02,305 crore to `50,74,981 crore in 2012-13 (at 2004-05 prices). This is impressivein comparison to the growth performance in the earlier period ofplanned development. However, this performance is much belowthe expectations since except in the Eighth Five Year Plan, thegrowth rate has been below the target. Table 1.1 gives the targetand actual growth rates during the period since 1991-92.
Table 12.1: Targeted and Actual Growth Rates in National Incomesince 1992 (percentage):
GrowthRate
EighthPlan
(1992-97)
Ninth Plan
(1997-2002)
Tenth Plan
(2002-2007)
EleventhPlan
(2007-2012)
Twelfth Plan
(2012-2017)
TargetRate
5.6 6.5 8.0 9.0 8.0
Actual Rate 6.7 5.5 7.5 7.8
Source: Government of India: Economic Survey (various issues).

157
Thus, it can be seen that only in the Eighth Plan, the countrycould achieve the growth rate that was targeted in the Five YearPlans. Following are some of the factors the explain India’s growthperformance since 1991.
During the Eighth Plan, the monsoon was favaourable andthis led to rapid growth in agricultural production. This also ensuredlesser inflationary pressures on the economy. The capital flowswere also significant with stability in the flows.
During the Ninth Plan period monsoon failure triggereddecline in the growth of agriculture and manufacturing. Sanctionsimposed on India after the Pokhran test was a main cause ofdecline in exports and technology deprivation. Kargil War and Bhujearthquake resulted in decline in production and diversion ofresources.
In the Tenth Plan period, though the manufacturing sectorrecovered, and economy witnessed the highest growth during2003-07, the overall growth rate was below the target due to thelow growth in the first year of the Plan. India, during this periodemerged as the second fastest growing economy in the world.External factors were favaourable with robust export growth. Theservices sector also posted robust growth at 8 percent per annumcontributing the overall growth of the economy.
During the Eleventh Plan, the growth rate declined due tothe global recession. Unlike in the earlier period, India was nowmore integrated with the world economy and the adverseconsequences were visible in the form of lower exports, volatilecapital flows and domestic pressures.
During the early years of the Twelfth Plan, India was stillfighting the adverse consequences of the downturn. Delayedmonsoon added to this and the economy witnessed lesser growthin these years.
Following are the main features of the growth of India’s nationalincome since 1992:
a. The growth rate is erratic. The economy witnessed periods ofhigh growth rate followed by decline. It is also observed thatthere is considerable overestimation in the income frommanufacturing and service sector.
b. Agriculture continues to be the main drag on the economy. Moresignificantly, agriculture in India is still governed by weatherconditions. It is argued by T.N. Srinivasan and others that the

158
decline in the real public investment in agriculture is the maincause of India’s economic problems in the post-reform period.
c. The growth rate is modest and is confined to a few sectors likeservices and durable consumer goods. Fragility in the demandfor the later is considered to be the cause of recessions.
d. Most of the growth is confined to a few states like Gujarat, TamilNadu, National Capital Region and Haryana. In all other states,the industrial growth is insignificant.
During the post-reform period, India witnessed significantincrease in its per capita income. This is due the decline in thepopulation growth and the increase in national income. The percapita NNP at constant prices (2004-05) rose from `14,157 in 1991-92 to `39,168 in 2012-13. This translates into an average growthrate of 4.8 percent per annum. There is also a considerabledecrease in the population growth after 1991. During 1991-2011,the population growth rate was just around 1.9 percent. Thisincrease in per capita income has considerably reduced theincidence of poverty.
Check your Progress :
1. India’s growth rate after 1991 is not satisfactory.
2. Per capita income growth rate is due to both an increase innational income and a fall in the population growth rate.
12.3 CHANGES IN THE SECTORAL COMPOSITION OFNATIONAL INCOME
According to Kuznets, the share of different sectors in thenational income is an important measure of the level ofdevelopment of that economy. Advanced capitalist economies havetheir agricultural sector accounting for a little around two percentwhile in the developing countries the share of agriculture is verylarge. Since agricultural sector cannot grow at more than fourpercent a year, the higher share of agriculture translates into lessergrowth rate of national income. In India, there are important
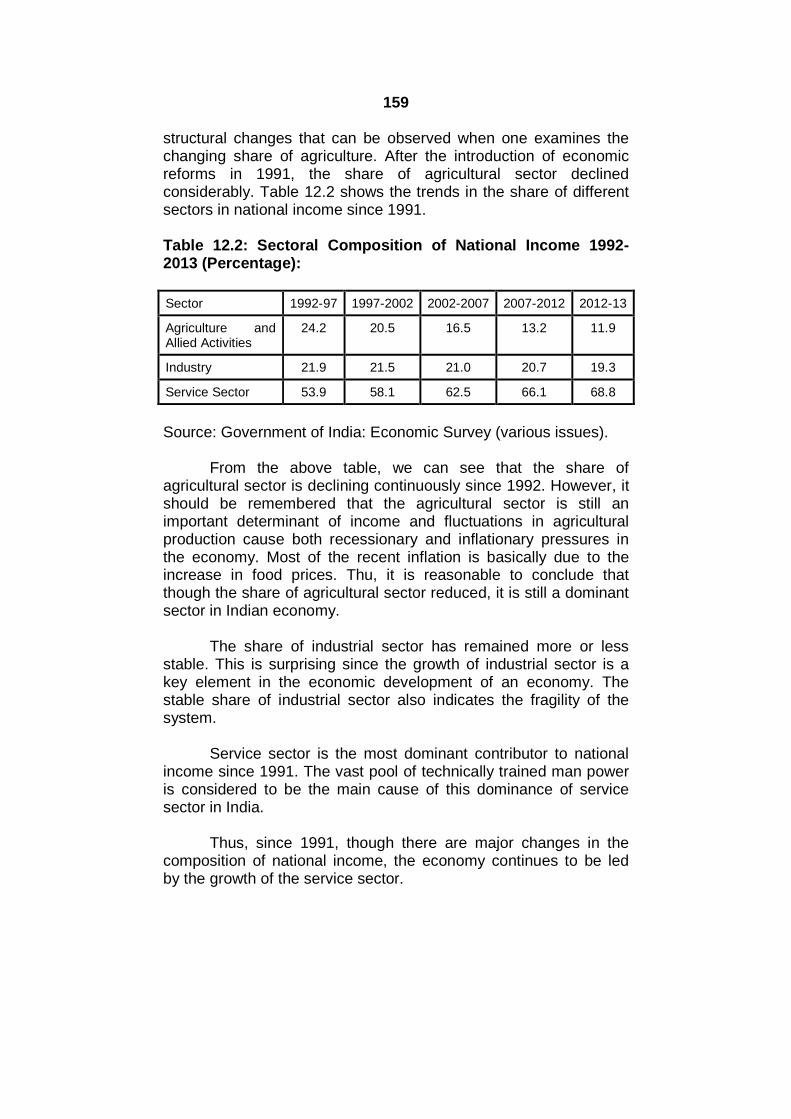
159
structural changes that can be observed when one examines thechanging share of agriculture. After the introduction of economicreforms in 1991, the share of agricultural sector declinedconsiderably. Table 12.2 shows the trends in the share of differentsectors in national income since 1991.
Table 12.2: Sectoral Composition of National Income 1992-2013 (Percentage):
Sector 1992-97 1997-2002 2002-2007 2007-2012 2012-13
Agriculture andAllied Activities
24.2 20.5 16.5 13.2 11.9
Industry 21.9 21.5 21.0 20.7 19.3
Service Sector 53.9 58.1 62.5 66.1 68.8
Source: Government of India: Economic Survey (various issues).
From the above table, we can see that the share ofagricultural sector is declining continuously since 1992. However, itshould be remembered that the agricultural sector is still animportant determinant of income and fluctuations in agriculturalproduction cause both recessionary and inflationary pressures inthe economy. Most of the recent inflation is basically due to theincrease in food prices. Thu, it is reasonable to conclude thatthough the share of agricultural sector reduced, it is still a dominantsector in Indian economy.
The share of industrial sector has remained more or lessstable. This is surprising since the growth of industrial sector is akey element in the economic development of an economy. Thestable share of industrial sector also indicates the fragility of thesystem.
Service sector is the most dominant contributor to nationalincome since 1991. The vast pool of technically trained man poweris considered to be the main cause of this dominance of servicesector in India.
Thus, since 1991, though there are major changes in thecomposition of national income, the economy continues to be ledby the growth of the service sector.

160
12.4 CHANGES IN THE OCCUPATIONAL STRUCTUREOF INDIAN ECONOMY
The occupational structure refers to the share of each sectorin the total employment. If the labour force is productively employedthe economy will enjoy higher levels of income and output. Since1991, there are major changes in the occupational structure. Table12.3 shows the occupational structure in India during 1991 and2011-12.
From the table it can be seen that the economy has not seenany major change in its employment situation. The share of primarysector has been falling. Most importantly, first time since 1951, theabsolute number of cultivators declined after 2009-10. This is theresult of agrarian distress the emerged with the introduction of NewEconomic Policy in 1991.
The Industrial sector failed to provide adequate employmentopportunities. There is clear evidence of “jobless growth” in thesecondary sector. The trend in manufacturing sector clearly hints atthis. Fluctuations in manufacturing sector employment are driven byexternal factors. The share of electricity, gas and water supplyremained stable at 0.3 percent throughout the post-reform period.Only construction sector experienced sustained increase in theemployment.
The steady growth in service sector employment is indicativeof the potential for future employment generation. The share ofpublic administration and defence in employment is declining,indicating the withdrawal of government from economic activity dueto liberalisation. The share of banking and insurance in employmentremained stable, indicating that this sector is technology-driven.Finance and other business services also show a strong positivetrend in their employment.
Thus, the changing occupational structure of Indianeconomy is consistent with the changes in the sectoral compositionof it national income.

161
Table 12.3: Occupational Structure in India 1991-2011/12:
Sector 1991 2001 2004/5 2009/10 2011/12
I. Agriculture and AlliedActivities
66.8 56.7 58.5 53.2 48.9
II. Industry
a. Manufacturing
b. Construction
12.7
10.2
1.9
18.2
13.9
4.4
18.2
11.7
5.6
26.5
11.0
9.6
24.3
12.6
10.6
III. Services
a. Trade andCommerce
b. Transport,Storage andCommunications
c. Other Services
20.5
7.5
2.8
10.2
25.1
9.4
4.0
11.7
23.3
9.0
3.8
10.5
25.3
9.5
4.3
11.5
26.9
9.3
4.8
12.8
Total (I+II+III) 100 100 100 100 100
Source: Government of India: Economic Survey (various issues).
Check your Progress :
1. Share of agricultural sector is falling in India’s national income.
2. Changes in occupational structure are consistent with thechanges in the composition of national income.
12.5SUMMARY
1. The New Economic Policy (NEP) 1991 is a response to theunprecedented economic crisis that the Indian economy wasforced to face during the early months of 1990. The economicreforms of 1991 were based on the two principles ofmacroeconomic stabilisation and structural adjustment.

162
2. During the post-reform period, India witnessed significantincrease in its per capita income. This is due the decline in thepopulation growth and the increase in national income.
3. Since 1991, though there are major changes in the compositionof national income, the economy continues to be led by thegrowth of the service sector.
4. The changing occupational structure of Indian economy isconsistent with the changes in the sectoral composition of itnational income.
12.6 QUESTIONS
1. Explain the rationale of New Economic Policy 1991.
2. What are the main features of New Economic Policy?
3. Bring out the main features of the macroeconomic stabilisationpolicy introduced in 1991.
4. What are the measures of structural adjustment adopted in Indiaafter 1991.
5. Bring out the main trends in India’s national income since 1991.
6. Examine the trends in the sectoral composition of India’s nationalincome since 1991.
7. What are the main trends in the occupational structure in Indiasince 1991?

163
13
INCLUSIVE GROWTH AND HUMANDEVELOPMENT IN INDIA
Unit Structure
13.0 Objectives
13.1 Inclusive Growth
13.2 Human Development in India
13.3 Trends in employment in recent years and problem ofUnemployment
13.4 Summary
13.5 Questions
13.0 OBJECTIVES
Understand the significance of Inclusive Growth and measuresto promote it.
Understand the concept of human development and measuresto promote human development in India.
Understand the concept of different types of employment.
Understand the concepts, and causes of unemployment inIndia.
Understand the main employment policies of Government ofIndia.
13.1 INCLUSIVE GROWTH
For long, Indian policy-makers believed in the theory of‘trickle down’. That is if the national income grows at a high rate,this will percolate to the poorer sections of the economy and theirstandards of living will also increase. It was realised that thebenefits of economic growth did not reach the deprived sections ofthe economy like the Scheduled Castes (SCs), Scheduled Tribes(STs), minorities and women. Gender inequality continues despitethe various legal provisions to protect the interests of the women. Itis important to know that ‘inclusive growth’ concept is based on the
164
understanding that both economic and non-economic factors playan important role in determining the outcomes on these sections.Religious, caste and gender discrimination excludes large sectionsof the people from participating in the economic activities anddenies them the benefits of the overall growth of the economy.
It is realized that the high growth rate in the GDP since theintroduction of economic reforms in 1991 could not ensure justiceand more importantly, on many macroeconomic indicators, India’sperformance slipped in terms of its own historical record and incomparison to other developing countries. Faster economic growthafter 1991 also witnessed a slowdown in the rate of povertyeradication, low growth rate of employment, increase in the rural-urban and regional disparities. There is a significant increase inagricultural indebtedness, forcing farmers in many regions of thecountry to take recourse to suicides. Malnutrition increased. It isobserved that while in 1998, 48 percent of children were sufferingfrom malnutrition, in 2005-06, 46 percent of children were under-nourished. Fifty percent of world population facing hunger live inIndia. It is found that 35 crore of Indians consume less than 80percent of the minimum energy required. Employment elasticity ofoutput declined from 0.26 in 1991-92 to 0.16 in 2004-05. This led tothe realisation that faster growth is in itself not a guarantee forimprovements in employment opportunities and thus, the spectre ofunemployment is real. Since high levels of unemployment causeincrease in the average standards of living, it is necessary togenerate adequate job opportunities to make proper use of theavailable human resources.
The benefits of economic growth of the nineties wereconfined only to the urban, educated population working in thecorporate, financial and IT sectors. Large sections of the societyare excluded from deriving the benefits of this high rate of growth inthe national and per capita income levels.
The most important development in recent years is theacceptance of the objective of ‘inclusive growth’ as the major goalof the Eleventh Five Year Plan. While there is no precise, uniformdefinition of inclusive growth, economists have agreed on thefollowing principles. 1. It refers to a high and sustainable increase inthe gross domestic product (GDP) over a period of time withequitable distribution of income, 2. Sustained reductions in thelevels of poverty and destitution and deprivation. 3. Ensuringgender equity and 4. Securing the benefits of economic growth andthe opportunities to benefit from this process to the backwardclasses are the major aspects of inclusive growth. It is clear fromthe above discussion that this concept is not very new to the Indianplanning. Since the Second Five Year Plan, India was aiming forthese objectives. However, the Eleventh Plan provided for a

165
comprehensive discussion of the various issues involved insecuring inclusive growth to the Indian masses. It aims at ‘fasterand more inclusive growth’ of the economy. The Eleventh Planidentified some thrust areas which would help to ensure anequitable distribution of income and economic opportunities. Itidentified seven thrust areas to promote inclusive growth. They areas under:
1. Providing for Rapid Growth and Poverty Reduction, andEmployment Generation: the economy needs to grow at ninepercent per annum to ensure adequate production to meet thegrowing needs of the population. This calls a balanced growth ofagriculture, industry and the service sectors. This growth has to belabour-intensive so that, the benefits reach a larger section of thepopulation. There is an urgent need to promote the skill-capabilitiesof the labour force so that they can be gainfully and productivelyemployed. Since the dependency ratio is estimated to be 0.59 in2011, it is vital that the earnings per head are increased to ensure adecent standard of living.
2. Access to Essential Services: The existing availability ofessential services like health, education and drinking water isgrossly inadequate; attention must be paid to the provision of theseservices. The access to basic health, education and sanitation willdetermine the quality of population and their ability to participate inthe growth process.
3. Social Justice and Empowerment: Despite various measuresand legal provisions, discrimination and denial due to caste,regional, religious and gender differences continue. Measures areneeded to bring in systems that allow SCs, STs, OBCs, minoritiesand women in to the mainstream society. In this case, thePanchayat Raj Institutions (PRI) does play an effective role.Strengthening of these institutions will allow larger participation inthe growth process.
4. Environmental Sustainability: there is an urgent need toprotect the environment. Since high population strains theecological system for livelihood, it is essential that there isadequate attention is paid to conserving the water bodies,biodiversity and habitats for wild animals. The need for fuel andfodder calls for serious attempts at a forestation as well.
5. Gender Equity: since women constitute a major portion of thepopulation, their well-being plays an important role in the overalleconomic and social development of the society. The opportunitiesavailable and used are not uniform across different regions, castesand religions. Thus, women and their problems are nothomogenous in the Indian context. Therefore, it is necessary that

166
caste, community, religion and geography specific initiatives areintroduced.
6. Governance: a major failure of the Indian economy ahs beenthe failure to provide transparent and efficient administration. Whilemeasures like the Right to Information Act (RTI) did bring in somesense of accountability, there is an urgent need to provide a largerrole for the civil society organisations (CSOs) in the effectiveimplementation of various schemes for the deprived sections. Also,it is necessary to introduce evaluation of different programmes onthe basis of proper, quantifiable benchmarks. Proper accountabilityand adequate transparency in administration is also needed.
7. Infrastructure: availability of good quality and liableinfrastructure is essential for connectivity of backward areas. Thus,the Plan provides for development of road, rail and air transportfacilities. It also recognises the need to provide electricity at stablevoltage and adequate and reliable telecommunication facilities.
13.2 HUMAN DEVELOPMENT IN INDIA
Human Development refers to the quality of life that thecitizens of a country enjoy. It is a concept wider than economicdevelopment. While economic development refers to theimprovement in the material wellbeing, the concept of humandevelopment encompasses to the health and educational status ofthe population and thus has a wider significance. According to theUnited Nations, ‘human development refers to the process ofwidening people’s choices and levels of wellbeing they achieve’.India, for example, posted impressive growth in recent years.However, its record/performance with respect to the quality of lifeleaves much to be desired. The levels of poverty, illness,malnutrition, deprivation, illiteracy are some of the issues on whichIndia lags behind even some of the other developing countries. Theconcept of human development acquired new importance aftervarious studies pointed out the role of human capital in the long-rundevelopment of the economy. Thus, human development refers tothree essential choices that make for better life. They are as under:
1. A Long and Healthy Life: An individual is entitled to have a longand healthy life. This is seen in the life expectancy at birth.Longer the life expectancy at birth better is the humandevelopment.
2. Access to Knowledge: Knowledge empowers an individual andfrees him/her from the danger of being exploited. The levels ofliteracy are seen as an indicator of the quality of life and level ofhuman development.

167
3. Access to Resources: It is necessary that individuals haveaccess to resources that ensure a decent standard of living. Theper capita income of the country is taken as the indicator of thelevel of human development.
Taking into consideration the above three variables, theUnited Nations Development Programme (UNDP) introduced theconcept of Human Development Index to measure the levels ofhuman development among its members. The index is constructedas under:
A. Life Expectancy Index (LEI): this is measured as the relativeachievement of the country vis-à-vis the highest and the lowestachievers among the UN member nations. Thus the LEI
=
gUNMembersLowestamonMembersngUNHighestamo
gUNMembersLowestamoncysLifeExpecIndia tan'
In India’s case in 2004, this index was as follows:63.6 25
0.64385 25
B. Education Attainment Index (EAI): This index is alsocalculated using the highest and the lowest levels of educationalparameters among the UN Member countries as in the case of lifeexpectancy. This index is a weighted average index of the grossenrollment (2/3 weight) and literacy level (1/3 weight). The former iscalculated as
MemberseamongUNollmentRatMinimumEnrMembersngUNollmentamoMaximumEnr
NMembersmentamongUimumEnrolluntrynaMemberColmentRateiGrossEnrol min
and the later as
eracyRateMinimumLittriesMemberCounmongUNeracyRateaMaximumLit
eracyRateMinimumLitacyRateinAdultLiter CountryMemberthe
Thus, for India in 2004, these are:2 61 0 1 62 0
0.6143 100 0 3 100 0
C. GDP Index: This index measures the relative standard of livingof a UN member country in terms of the purchasing power parityGDP. The GDP of the concerned member country is compared to

168
that of the highest GDP in the world. Thus, we have the GDP Indexgiven as:
log(100)-GDP)PPPMaximumof(log
log(100)-Member)theofGDPPPPof(log
In 2004, India’s PPP GDP was $3139 and the highest PPPGDP among the UN Members was $40,000. Therefore we haveIndia’s GDP Index for 2004 as:
575.02602.4
2497.3
log(100)-)log(40,000
(100)log-log(3139)
From the above three indices, we obtain the HDI for India in 2004as:
575.03
1614.0
3
1643.0
3
1
= 0.611
India’s HDI index improved from 0.413 in 1975 to 0.577 in2000 to 0.619 in 2005. As a result, the rank of India from among180 countries improved from 138 in 1994 to128 in 2005. It stood at134 in 2007. It is interesting to note that countries like Sri Lankahave a higher HDI than India. This highlights the need to initiateconcrete steps to improve the human development in India.
We now discuss the various initiatives taken by Governmentof India to promote human development and examine their efficacyin improving the living conditions of the masses. The efforts of thegovernment were directed in promoting three inter-related aspectsof human development. They are education, health and familywelfare.
A. Education:Education empowers an individual to be free from
exploitation as well as given an opportunity to benefit from anexpanding job market. Thus, providing education to the masses isan important aspect of human development. The number ofeducational institutions increased from 2.31 lakh in 1951 to 9 lakhin 1999 to a further 12,81,355 in 2007-08. During this period, theenrolment increased by eight times, from 24 million to 192 million.In 2007-08, there were 389 universities and 9,427 colleges offeringhigher education along with 1068 professional educationalinstitutions. As a result of the government efforts, the literacy rateincreased from 18.3 percent in 1951 to 65.38 percent in 2001. Thefollowing are the major initiatives to promote education. A majorstep in the universalisation of primary education is the 86th
Amendment to the Constitution in 2002 making free and

169
compulsory primary education to all children in the age group of 5-14 years a fundamental right. In 2009 it was decided to establish 11Central Universities in states where there are no CentralUniversities.
I Primary Education :
1. Sarva Shiksha Abiyaan (SSA) was introduced in 2001 to providefree and compulsory education for all. This scheme provides for theconstruction of new school buildings, classrooms, provision ofdrinking water and sanitation in schools, free text books andtraining of teachers. In 2004, a special fund, named PrarambhikShiksha Kosh was started to fund the SSA. By September 2009,2,88,155 new schools were constructed under this scheme. As aresult of creation of better teaching facilities and infrastructure, therural enrolment reached 96 percent in 2009.
2. Jan Shikskhan Sansthans: the government opened 194 centersto provide vocational training to non-literate labourers andbackward sections of the society.
3. Mid-Day Meal Scheme: the government introduced this schemeto cover all the school-going children in the country. It covers nearly10 crore children and in 2007-08, Rs. 7,324 crore were allocated for3,479 educationally backward blocks. In 2009, the scheme wasrevamped with increased allocations for hiring cooks and thepurchase of grains and cooking equipment.
4. National Programme for Education of Girls at Elementary Level(NPEGEL): This programme was introduced in 2003 to provideeducation facilities to the underprivileged and disadvantaged girls.This programme covers 3164 educationally backward blocks in 25states. 35,252 schools are operational under this scheme covering82.66 lakh students at a cost of Rs. 708.44 crore.
5. Kasturba Gandhi Balika Vidyalaya: This programme waslaunched in July 2004 to set-rp residential schools at elementarylevel for girls of backward classes and minorities. This scheme isoperational in 24 states and by September 2008, 1,564 of theseschools are operational covering 1,09,786 students. Since 01-04-2007, this scheme is merged with the SSA.
6. The government proposed in 2008 to construct 3500 hostels forgirl students in educationally backward blocks. In 2009, 647 hostelswere approved for construction.
The central government’s expenditure on educationincreased from Rs. 1,37,800 crore in 2001-02 to Rs. 1,67,981 crorein 2008-09. As a percentage of GDP, this amounts to an increase

170
from 2.98 to 3.9. The following are the major achievements in thearea of education in India.
II Higher Education:
Since the development of skills is based on the attainmentlevels at the higher education, government paid attention tosecondary and higher secondary education as well. As a result, thenumber of secondary and higher secondary educational institutionsincreased form 7,416 in 1950-51 to 1,52,049 in 2004-05. The totalenrolment in them stood at 37.1 million. Rashtriya MadhyamikShiksha Abiyan (RMSA) [Scheme for Universalisation of Access toSecondary Education (SUCCESS)] was introduced in 2009 with theobjective of achieving universal access to secondary education by2017. Its immediate target is to achieve 75 percent enrolment at IX-X class by 2015. It also aims to improve the quality of secondaryeducation with emphasis on employability. This scheme is aimed atproviding necessary infrastructure and resources to improve thequality of education and to provide extra support for girls, ruralchildren and the SC/ST students.
The government started a number of institutions to providehigher and technical education. As a result, the number of studentsenrolling for higher education increased to 11.34 million in 2005-06,with women students accounting for 40.39 percent.
Achievements:
1. Gross enrolment increased significantly from 22.1 million in1950-51 to 177 million in 2003-04. The gross enrolment ratio stoodat 96 percent in 2008-09.
2. The dropout ratio fell from 39 percent in 2001-02 to 31.4 percentin 2003-04, with the total dropouts being 95 lakh. The dropout ratiois still very high and needs attention.
3. Though the literacy rate improved from 18.3 percent in 1951 to64.8 percent in 2001, India still has one of the highest rates ofilliteracy in the world.
4. There is considerable improvement in the enrolment of women,but the female literacy rate is still 53.7 percent only. The totalnumber of illiterates was 296 million in 2001.
Shortcomings :
1. The enrolment of girl students is still less than 50 percent.
2. The spending on education has been inadequate to make anysignificant difference to the coverage quality. Despite the fact that

171
the National Policy on Education 1986, proposed to spend sixpercent of GDP on education, not more than 3.9 percent of GDPwas allocated for education. This is despite the governmentresolution to spend at least 6 percent of GDP on education.
3. The drop-out rates are still very high at 40 percent at the primarylevel. The 86th Amendment to the Constitution making education afundamental right will not improve things if proper attention is notpaid to the socio-economic factors responsible for dropping-out.Also, the lack of infrastructure, mainly in rural areas is not receivingproper attention. In many case, this is found to be the main causeof high dropouts, especially among girl students.
4. The teacher-student ratio is worsening across states due to lackof adequate teacher training facilities, proper incentives and thisneeds some immediate attention.
B. Health and Family Welfare :
An important aspect of human development is the provisionof health care and family welfare facilities. They directly impinge onthe quality of life. In this case also, India still has much to be done.Following are the major developments in the provision of health andfamily welfare facilities in India.
I. Health:
There has been considerable progress in the provision ofhealth services since 1951. The total number of Primary HealthCentres (PHCs) increased from 725 in 1951 to 1,73,770 in 2008.The number of dispensaries increased from 9,209 to 32,156 duringthis period. The number of trained nurses increased from 18,054 to15,72,363 and the number of doctors from 61,800 to 84,852. Thisresulted in improvements in the general health care as can be seenin the fall in the cases of malaria, leprosy and polio. The majorinitiatives in the health sector are as under:
1. The National Health Policy (NHP) 2002 aimed at providing anacceptable standard of good health for the population bydecentralisation of the public health system and enhancedinvestment in public health. As part of this, in 2004, IntegratedDisease Surveillance Programme was introduced to checkcommunicable and non-communicable diseases. Emphasis waslaid on eradication on malaria, dengue, encephalitis, kala-azar andlymphatic filariasis. The National Leprosy Eradication Programmebrought down the rate from 57.3 per 10,000 population in 1981 to1.17 in 2005. 25 states eliminated leprosy and another six are nearthe goal.
172
2. With India having the second largest population of HIV-infectedpeople, special attention is needed for this. Andhra Pradesh, TamilNadu and Maharashtra succeeded in stabilising the HIV infectedpopulation. The National AIDS Control Policy of 2002 provides foranti-retroviral treatment (ART) by 52 government hospitals andcovers 23,784 patients in 18 states. 156 districts were recognisedas high-risk. By November 2009, 91.9 lakh people were tested and2.88 lakh were given anti-retroviral treatment. A total of Rs. 11,585crore were allocated for this programme during 2007-12.The policyis also focusing on the high-risk cases of cardio-vascular diseases,mental disorders and cancer. The National Programme for Controlof Blindness is initiated to control the incidence of blindness due tomalnutrition and other problems.
3. The National Rural Health Mission (NRHM) was launched in2005 to ensure greater access to public health care facilities to ruralpopulation. According to Economic Survey 2007-08, “NRHM hassuccessfully provided a platform for community health action at alllevels. Besides merger of Departments of Health and FamilyWelfare in all States, NRHM has successfully moved towards asingle State and District level Health Society for effective integrationand convergence”. The highlights of this Programme so far are asunder: 5,43,315 Accredited Social Health Agents/Link Workershave been selected so far in the States. 1,86,606 of them havedrug kits. Since a major cause of diseases and ill-health is the lackof proper/adequate sanitation, government has initiated the processof setting-up the Village Health and Sanitation Committees(VH&SCs). 1,77,578 Village Health and Sanitation Committees arealready functional to ensure proper sanitation facilities to thevillages concerned. States are asked to speed-up the process ofsetting up of these committees wherever necessary.
4. Since a major cause of high infant and maternal mortality rates isthe lack of proper delivery and neo-natal care facilities, governmentintroduced the Janani Suraksha Yojana for institutional deliveriessince 2004. More than 50 lakh women have been brought underthe Janani Suraksha Yojana (JSY). This has led to a perceptible fallin the infant mortality rates.
5. Immunization Programme: In order to control the variousdiseases that can be controlled by immunization, the governmentlaunched a scheme of universalisation of immunization. As a resultof this, all the children in the age group of 0 to 5 years are coveredand this brought down the incidence of polio and other diseases. By2005, India reached 99.9 percent immunization of children,especially in case of polio. The following table provides theprogress in health since 1951.

173
Table 13.1: Progress in Health and Family Welfare 1991-2005.
Parameter 1991 2005-6
1. Crude Birth Rate 29.5 23.5 (2006)
2. Crude Death Rate 9.8 7.5 (2006)
3. Total Fertility Rate 3.6 2.9 (2005)
4. Maternal Mortality Rate (per100,000 live births)
437 (1992-3) 301 (2001-03)
5. Infant Mortality Rate (0to4years) per 1,000 live births
80 57 (2006)
6. Child Mortality Rate (0 to 4years) per 1,000
26.5 17.3 (2005)
7 Couple Protection Rate 48.2 (1998-9)
N.A.
8. Life Expectancy
a. Male
b. Female
59.0
59.7
(2001-05)
62.3
63.9
6. The Protection of Women from Domestic Violence Act, 2005,which came into force on October 26, 2006, seeks to provideimmediate relief to women facing situations of violence in theirhomes.
Though, India made considerable progress in humandevelopment, it still has a long way to go. Some of the otherdeveloping economies like Sri Lanka have better achievementsthan India. Corruption, apathy and indifference to the needs of thepeople on the part of public servants are often sighted as the majorcause of failure to improve the living conditions of the masses.Attention must be paid to these factors.
13.3 TRENDS IN EMPLOYMENT IN RECENT YEARSAND PROBLEM OF UMEMPLOYMENT
I. Trends in Employment since 1991 :
India, employment is provided by formal and informalsectors. Informal sector refers to those activities where a formaltraining is not there. It includes tiny units engaged in production buttheir activities are not recorded, recognised, protected or regulatedby the public authorities. Street vending, food processing, tailoring,are some of the informal activities. Formal sector refers toeconomic activity that is regulated by the public authorities.

174
Organised sector refers to economic activity that issupervised and regulated by the authorities. It comprises of allpublic sector units, and all units of non-agricultural establishmentsemploying ten or more workers. Unorganised sector refers to unitscomplementary to the organised sector Low wages, lack of incomesecurity, long working hours, lack of proper leave facilities andsocial security are some of the problems facing the workers in theunogranised sector.
Unorganised sector’s share in employment has declinedafter 1993-94 from 86.5 percent to 84.2 percent. Therefore, it is stillthe main provider of industrial employment. The informal sector’sshare in total employment increased from 37.9 percent to 57.8percent between 1993-94 and 2009-10. This helps us tounderstand the degree of economic exploitation of labour in theIndian economy.
Within the organised sector, employment comprises of workforce in the public and private sector. Over the years, though theshare of public sector in employment came down to the policy ofliberalisation, public sector is still the major provider of organisedemployment. Table 13.2 shows the trends in employment in publicsector and private sector. It should be noted that only sevenpercent of work force is engaged in the organised sector. Thisleaves the scope for exploitation of labour faced with massiveunemployment.
Table 13.2 Trends in employments in organised sector (1991-2011)
Sector 1991 2001 2005 2010 2012
Public Sector (%) 71.3 68.9 68.1 62.2 60.5
Private Sector (%) 28.7 31.1 31.9 37.8 39.5
Total Organised SectorEmployment (lakh)
237.4 277.9 264.6 287.7 289.9
Source: Reserve Bank of India (2012): Handbook of Statistics.
Trends in employment are explained in terms of category ofemployment Table 13.3 shows the division of employment bycategory during 1993-94 and 2009-10.
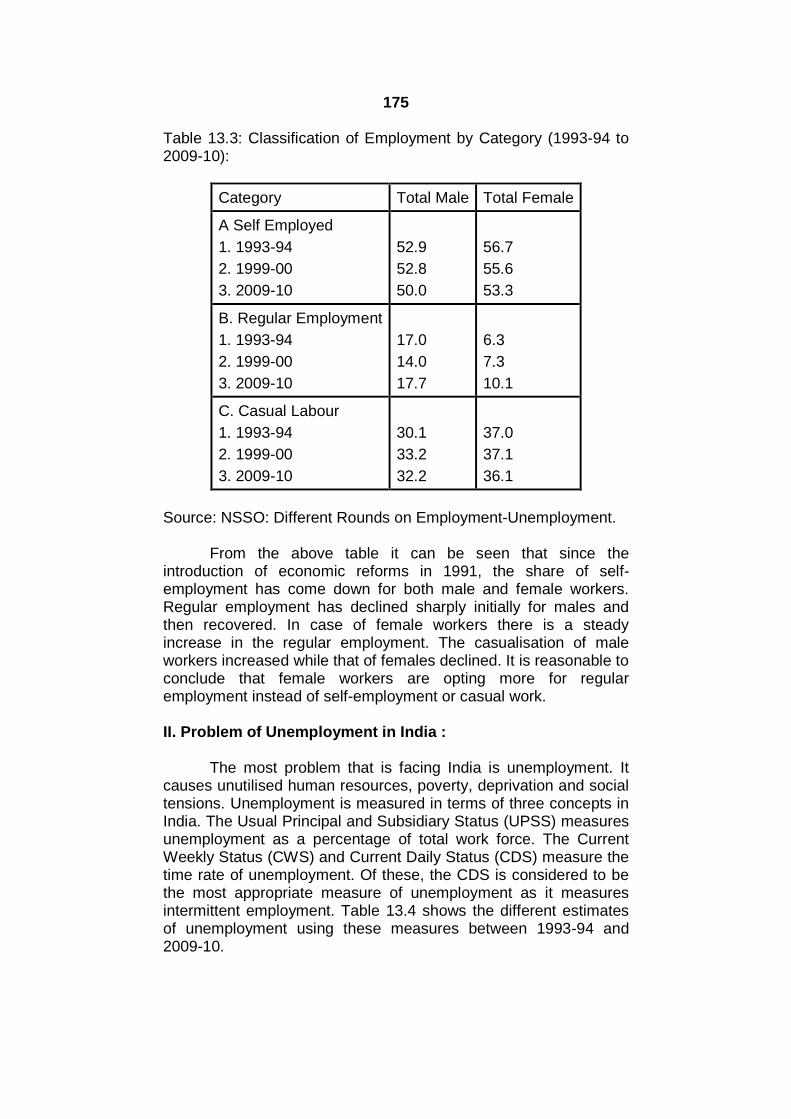
175
Table 13.3: Classification of Employment by Category (1993-94 to2009-10):
Category Total Male Total Female
A Self Employed
1. 1993-94
2. 1999-00
3. 2009-10
52.9
52.8
50.0
56.7
55.6
53.3
B. Regular Employment
1. 1993-94
2. 1999-00
3. 2009-10
17.0
14.0
17.7
6.3
7.3
10.1
C. Casual Labour
1. 1993-94
2. 1999-00
3. 2009-10
30.1
33.2
32.2
37.0
37.1
36.1
Source: NSSO: Different Rounds on Employment-Unemployment.
From the above table it can be seen that since theintroduction of economic reforms in 1991, the share of self-employment has come down for both male and female workers.Regular employment has declined sharply initially for males andthen recovered. In case of female workers there is a steadyincrease in the regular employment. The casualisation of maleworkers increased while that of females declined. It is reasonable toconclude that female workers are opting more for regularemployment instead of self-employment or casual work.
II. Problem of Unemployment in India :
The most problem that is facing India is unemployment. Itcauses unutilised human resources, poverty, deprivation and socialtensions. Unemployment is measured in terms of three concepts inIndia. The Usual Principal and Subsidiary Status (UPSS) measuresunemployment as a percentage of total work force. The CurrentWeekly Status (CWS) and Current Daily Status (CDS) measure thetime rate of unemployment. Of these, the CDS is considered to bethe most appropriate measure of unemployment as it measuresintermittent employment. Table 13.4 shows the different estimatesof unemployment using these measures between 1993-94 and2009-10.

176
Table 13.4 Estimates of Unemployment in India (1993-2009).Percent
Estimate 1993-94 2004-05 2009-10
1. UPSS 4.1 2.3 2.0
2. CWS 4.9 4.4 3.6
3. CDS 8.5 8.2 6.6
Source: NSSO: Different Rounds on Employment-Unemployment.
From the above table we can see that there is considerableimprovement in the UPSS unemployment. There is a decline in theabsolute number of unemployed also. The decline is attributed tothe decline in the labour force. The CDS rate continues to be highand indicates the intermittent nature of employment. A high rate ofCDS is the most important pointer towards the casualisation oflabour.
The National Sample Survey Organisation (NSSO) providesthe following estimates of unemployment for different years since1993-94.
Table 13.5: Estimation of Unemployment (in millions) during 1993-94 and 2011-12:
Year 1993-94 1999-00 2004-05 2009-10 2011-12
Number of Unemployed(million)
7.4 8.97 11.17 9.84 10.84
Usual Principal andSubsidiary Status(UPSS) (%)
2.0 2.2 2.4 2.1 2.2
Source: NSSO: Different Rounds on Employment-Unemployment.In India, the nature of unemployment is different between the
rural and urban areas. We shall first examine the ruralunemployment since it is more widespread.
A. Rural Unemployment :
In rural areas, there is employment only during some monthsof the year when agricultural operations are going on. The rest ofthe year, people remain unemployed. This is the seasonalunemployment.
Also, many people seem to be engaged in agriculture. But,the net addition to output due to some of them is either zero or

177
even negative. This is the disguised employment. In such cases,even if we remove some of the workers from agriculture, the totaloutput will not be adversely affected. The decline of rural industriesis the main cause of the rural unemployment.
B. Urban Unemployment :
Unlike in the rural areas, urban unemployment is open andundisguised. This problem is the source of many social andeconomic tensions. Some of the causes of urban unemploymentare as follow: The industrial unemployment is caused by the slowrate of growth of employment is this sector. For example, during1993-94 and 199-2000, the employment elasticity of industrialoutput came down from 0.33 to 0.09. It implies that lesser workersare required to generate the same volume of output. This isobviously the main cause of unemployment in the industrial sector.Large scale migration to urban areas is another reason for the rapidincrease in economically active population. Since the rural povertyis widespread and agrarian distress is unaddressed, people areforced to migrate to the nearby towns and cities in search oflivelihood. Unemployment among the educated is another majorproblem in urban areas. Due to lack of proper education systemand vocational education, many educated youth fail to obtain jobs.This then results in the waste of human resources. Also, in India,there is a preference for government jobs. People keep searchingin vain for government jobs. Due to liberalisation, governmentrecruitments have come down significantly, further adding to theproblem of educated unemployment.
III Major Employment Programmes of Government of India :
Government of India initiated various measures to promoteemployment opportunities for the needy from time to time since1980. These policies were revamped, merged and redefined fromtime to time to reflect the changing needs of the poor andunemployed. Following are the major flagship employmentprogrammes that are now operational.
a. Swarnajayanti Gram Swarojgar Yojana (SGSY) :
This programme was launched on April 1, 1999 by merging thevarious anti-poverty programmes that were operational till then.The objective is to provide income generating assets to the ruralpoor and make them self-employed. It is now redefined as theNational Rural Livelihood Mission (NRLM) aiming at reducingpoverty by enabling poor households to access gainful self-employment and skilled wage employment opportunities. Underthis scheme, as in September 2011, 42.05 lakh Self-HelpGroups (SHGs) were formed.
178
b. Swarna Jayanti Shahari Rojgar Yojana (SJSRY) :
This scheme was introduced on December 1, 1997 bysubsuming all the urban anti-poverty programmes. It aims toprovide gainful employment in urban areas through self-employment. It has five components: i) The Urban Self-Employment Programme, ii) the Urban Women Self-Employment Programme, iii) Skill Training for EmploymentPromotion among Urban Poor, iv) the Urban Wage EmploymentProgramme and v) the Urban Community DevelopmentNetwork. During 2012-13, over 4 lakh urban poor householdsbenefited from this scheme.
c. Prime Minister’s Rogjar Yojana (PMRY) :
This scheme was launched during the Eighth Plan and aims atproviding self-employment to educated unemployed youth bysetting-up micro-enterprises. Nearly five lakh youth benefitedfrom this scheme in the Eighth and Ninth Plans.
d. Mahatma Gandhi National Rural Employment GuaranteeScheme (MGNREGS) :
This is the most ambitious rural employment programme so far.Under this, the Act guarantees provision of at least 100 days ofwage employment to at least one member of every ruralhousehold whose adult members volunteer to do unskilledmanual work. It aims at creating rural community assets likewater conservation, drought proofing, land development, floodcontrol and rural connectivity through all weather roads. Thescheme is implemented through the active participation of thePanchyats. This scheme considered to be inclusive since mostof the beneficiaries are women, SCs, and STs as workers in thisscheme. However, it is found that in many cases, there werecases of tampered records of beneficiaries, non-payment ofunemployment allowance, taking up of unproductiveprogrammes and there is no quality control on the work done.
Check your Progress :
1. What is informal sector?2. What is formal sector?3. What do you understand by organised sector>4. How is organised sector defined in India?5. How is unemployment measured in India?

179
13.4 SUMMARY
1. Inclusive growth’ concept is based on the understanding thatboth economic and non-economic factors play an important role indetermining the outcomes on the deprived sections of the economylike the Scheduled Castes (SCs), Scheduled Tribes (STs),minorities and women.
2. Human development refers to three essential choices that makefor better life. They are i) a long and healthy life, ii) Access toknowledge, and iii) Access to resources.
3. Over the years, though the share of public sector in employmentcame down to the policy of liberalisation, public sector is still themajor provider of organised employment. It should be noted thatonly seven percent of work force is engaged in the organisedsector. This leaves the scope for exploitation of labour faced withmassive unemployment.
4. The most problem that is facing India is unemployment. It causesunutilised human resources, poverty, deprivation and socialtensions. Unemployment is measured in terms of three concepts inIndia. In India, the nature of unemployment is different between therural and urban areas.
5. Government of India initiated various measures to promoteemployment opportunities for the needy from time to time since1980. These policies were revamped, merged and redefined fromtime to time to reflect the changing needs of the poor andunemployed.
13.5 QUESTIONS
1. Explain the nature and significance of inclusive growth.2. What are the measures initiated by the government to bring
about inclusive growth in India?3. Explain how the human development index is constructed.4. What are the measures to promote human development through
health?5. What are the measures taken by the government to promote
education?6. What are the different measures initiated to promote family
welfare?7. Examine the trends in employment since 1991.8. Explain the causes of unemployment in India.9. What are the major employment programmes undertaken by the
government?
180
14
Module 5
AGRICULTURE, INDUSTRY ANDSERVICES SECTOR
Unit Structure :
14.0 Objectives14.1 Trends in Agricultural Production and Productivity Since
199114.2 Public Distribution And Food Security14.3 National Agricultural Policy 200014.4 WTO Agreements and Agriculture14.5 Summary14.6 Questions
14.0 OBJECTIVES
Understand the trends in agricultural production and productivitysince 1991
Understand the importance of food security and measures toensure it
Understand the National Agricultural Policy 2000 Understand the implications of WTO Agreements
14.1 TRENDS IN AGRICULTURAL PRODUCTION ANDPRODUCTIVITY SINCE 1991
Agriculture occupies an important place in the Indianeconomy. A vast majority of population depend on it for theirlivelihood. Given the large population, agriculture also hasimplications for food security to its population. Thus, both the sizeof agricultural output and the productivity are central to thedevelopment issues of the Indian economy. We examine some ofthe trends in agricultural production and productivity.
Since the introduction of high yielding varieties (HYVs) in1965 as part of the Green Revolution, agricultural output has seensignificant increase. Table 14.1 gives some trends in the productionof the major agricultural products since 1991.
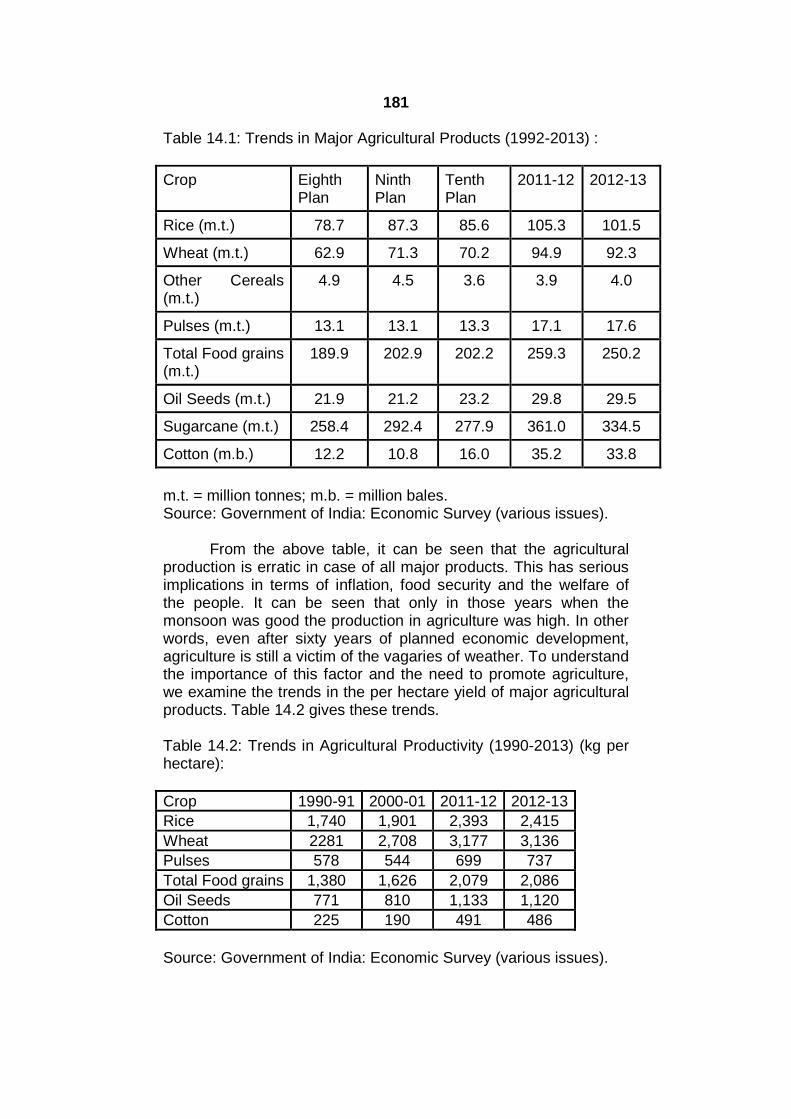
181
Table 14.1: Trends in Major Agricultural Products (1992-2013) :
Crop EighthPlan
NinthPlan
TenthPlan
2011-12 2012-13
Rice (m.t.) 78.7 87.3 85.6 105.3 101.5
Wheat (m.t.) 62.9 71.3 70.2 94.9 92.3
Other Cereals(m.t.)
4.9 4.5 3.6 3.9 4.0
Pulses (m.t.) 13.1 13.1 13.3 17.1 17.6
Total Food grains(m.t.)
189.9 202.9 202.2 259.3 250.2
Oil Seeds (m.t.) 21.9 21.2 23.2 29.8 29.5
Sugarcane (m.t.) 258.4 292.4 277.9 361.0 334.5
Cotton (m.b.) 12.2 10.8 16.0 35.2 33.8
m.t. = million tonnes; m.b. = million bales.Source: Government of India: Economic Survey (various issues).
From the above table, it can be seen that the agriculturalproduction is erratic in case of all major products. This has seriousimplications in terms of inflation, food security and the welfare ofthe people. It can be seen that only in those years when themonsoon was good the production in agriculture was high. In otherwords, even after sixty years of planned economic development,agriculture is still a victim of the vagaries of weather. To understandthe importance of this factor and the need to promote agriculture,we examine the trends in the per hectare yield of major agriculturalproducts. Table 14.2 gives these trends.
Table 14.2: Trends in Agricultural Productivity (1990-2013) (kg perhectare):
Crop 1990-91 2000-01 2011-12 2012-13
Rice 1,740 1,901 2,393 2,415
Wheat 2281 2,708 3,177 3,136
Pulses 578 544 699 737
Total Food grains 1,380 1,626 2,079 2,086
Oil Seeds 771 810 1,133 1,120
Cotton 225 190 491 486
Source: Government of India: Economic Survey (various issues).

182
From the above table we can see that the exiting productivityis not adequate to meet the food needs of the economy.Productivity in Indian agriculture is low compared to its potential. Itis estimated that in case of rice, the existing productivity is onlyabout 60 percent of the potential. In case of wheat and maize, it isless than 40 percent of the potential. In case of jute and sugarcane,only 70 percent of the potential production is realised. Thus, thereis a lot of scope for improving the productivity in agriculture toensure adequate production of all important products. Moreimportantly, in comparison with other countries also our productivityis woefully low. India’s levels of productivity are lower compared tosome of the developing countries. Thus, it is essential that thegovernment pays adequate attention to improving agriculturalproduction and productivity. We examine some of the causes of lowagricultural productivity in India.
B. Causes of Low Agricultural Production and Productivity :
1. Given the nature of ownership and land relations, the cultivator isforced to think that any extra output generated will beexpropriated by the land lord. And hence he prefers to hold onto subsistence agriculture only.
2. The average size of the landholding is uneconomical. Given thepressure on land, subdivision and fragmentation are verynatural. The farmers are forced to stick to the unproductivetraditional methods of cultivation. As a result, modernmechanised methods that improve productivity cannot beadopted effectively.
3. Excess utilisation of chemical fertilizers is noted by many studiesas the main cause of land degradation and accounts for a majorpart of soil erosion.
4. The major cause of low productivity is the lack of institutionalcredit. After the nationalisation of banks in 1969 governmentencouraged the commercial banks to actively provide credit toagriculture at subsidised rates, the situation changed with theintroduction of economic reforms. Emphasis on reduction innon-performing assets (NPAs), branch delicensing have leadthe commercial banks to shy away from providing agriculturalcredit.
5. As noted earlier, the provision of irrigation facilities is a majorchallenge to the agriculture. After 1980, the real public sectorinvestment in agriculture has come down drastically. With theNinth Plan emphasising the private participation in agriculture,the neglect of agriculture reached its pinnacle. Since irrigation isa public good it needs to be provided by the State only. It isimperative that the government pays adequate attention to
183
providing institutional support to agriculture in the form ofextension services.
6. Lack of adequate storage facilities is a major problem. Since thesaying power of the cultivators is low, they are forced toundertake distress sale of output and thus lose income. Thedifferent measures to promote warehousing and storagefacilities are grossly inadequate compared to the needs of theagricultural sector. It is observed that often the market yards aredominated by traders who conspire to lower the purchaseprices. This causes a loss of income to the cultivators.
14.2 PUBLIC DISTRIBUTION AND FOOD SECURITY
A very important outcome of economic growth in a poorcountry like India is providing food security. In simple words, foodsecurity means ensuring adequate supplies of food grains to thepopulation. The concept of food security has undergone a changein the last few decades. During the late sixties to 1980s it meanthaving enough food stocks with the government to stabilise thefood grains prices only. The concept of food security encompassedproviding minimum support prices (MSP) to the farmers ensuringprofitability, price stability through open market operations ofprocurement and sale through Food Corporation of India (FCI),maintaining buffer stocks and the Public Distribution System (PDS).This policy helped to ensure grain surplus, stable prices of basicfood prices and high farm incomes.
During the 1990s, various factors like the fiscal situation ofboth the central and state governments made it difficult to hold foodstocks beyond a certain level, and at the same time the fooddeprivation to many of the below the poverty line (BPL) familiesmeant holding of food stocks when there is malnutrition and under-nourishment due to lack of purchasing power was not considered tobe self-sufficiency. The government initiated measures to makefood grains available to the BPL families at reasonable prices toensure that there is no privation. The government decided to bringdown the cost of holding food stocks by fixing ceilings on bufferstocks.
The major issues in the concept of food security are asfollow: 1) The procurement of food grains rose from 22.4 milliontonnes in 1995-96 to 41.4 million tonnes in 2004-05. 2) the foodgrains stocks were two-and-a-half times the buffer stock normsduring 2001 (45.7 as against a requirement of 16.8 million tonnes)and three-and-a-half times during 2002 ( 48.2 m.t., and 16.8 m.t.) In2005, the actual stocks were 21.7 m.t., as against a buffer stockrequirement of 16.8 m.t. For the government this translates intounproductive expenditure. 3) It is observed that during the last few
184
years the gap between central allocations of food grains and theoff-take by the state governments is increasing. This is verypronounced in case of wheat. 4) The central government has beenrevising the central issue price (CIP) of food grains continuously.The minimum support price (MSP) for wheat increased from ` 360per tonne in 1994-95 to ` 640 per tonne in 2004-05. In case of rice itwas ` 340 in 1994-95 and increased to ` 560 and 590 per tonnedepending on the quality. The state governments are not in aposition to afford these high cost grains. 5) The total food subsidygiven was ` 2, 450 crore. in 1990-91. This reached to `85,000crore in 2012-13. As a percentage of GDP, food subsidy was 0.43,0.85 respectively. 6) The cost of holding the food stocks is alsoproving to be very high. For rice, the economic costs haveincreased from ` 1137.1 per tonne in 2000-01 to ` 2,000 in 2010-11. For wheat, the same rose from ` 883.5 to ` 1,500. Out of thefood subsidy given by the government, 41.5% is spent oncarrying/distribution costs of the FCI. Thus, it is argued that thegovernment can reduce the burden of food subsidies by reducingthe stocks to the levels recommended by the expert group on foodgrains. 7) Most of the allocations under the PDS have reached theabove the poverty level (APL) families in urban areas. The reach ofPDS in rural areas has been limited due to administrative as well aseconomic factors. It has been estimated that only 30% of theallocations are made to the rural families under the PDS. As theprices in the PDS outlets came close to the open market prices, theAPL families opted to buy better food grains from the market thanthe fair price sops. Thus the off-take from the PDS outlets fellduring the late 1990s. 8) It is argued that the NSS data show thatthe per capita expenditure on food and cereals fell during the 1990sin both rural and urban areas. There is a shift away from cereals tonon-cereals like mild, fruits and other items. In this changeddemand conditions, it is not necessary to provide cheaper foodgrains on a universal basis. 9) The spread of PDS is not uniformthroughout the country. It is more widespread in rich states likeKerala, Tamil Nadu, Karnataka and Andhra Pradesh. Its reach isvery limited in poor states like Bihar, UP, Rajasthan, and MP, whichaccount for major BPL families. The NSS reports that there is asignificant decline in the per capita consumption of food grains. Theper capita calorie intake has declined both in rural and urban areas.Out of the infants with low birth weight, India accounts for morethan half the total. This indicates malnutrition and undernourishment in face of surplus food stocks and needs immediateattention. 10) The per capita consumption of pulses is only 65%and that of vegetables is only 50% of the minimum nutritionalrequirements, adding to the problem of malnutrition, morbidity andinefficiency. 8) It must be accepted that given the increase in percapita income in the last fifteen years, there must be selectivity inthe reach of PDS to ensure both efficiency and equity. Theintroduction of Re-vamped public Distribution System (RPDS) in

185
1997, Antyodaya Anna Yojana and Annapurna Yojana are positiveinitiatives. The RPDS aims at providing food grains to BPL familiesat 70% of the economic costs. The other two are aimed at providingthe weakest of the social groups. An estimated 6.52 crore familiesare benefiting from these schemes. Speculative price hikes andpolitical pressures from farmers in food surplus states have resultedin large increases in food prices and the poor families are pushedinto deprivations. The concept of food security should be viewed inthe context of declining public investment in irrigation, lack ofaccess to safe drinking water, sanitation, falling growth of fertilizeruse, and lack of local involvement in the distribution of food grains.Various studies have shown that the employment generationschemes were more effective in providing safety net to the poor inthe form of subsidised food. It is suggested that the Panchayat RajInstitutions (PRIs) must be more actively nutrition requirements ofinvolved in the distribution of food grains. It is important to note thatthere can not be one blanket scheme of PDS to meet the nutritionrequirements of various regions.
There is an economic compulsion in rationalising the MSPsince the benefits are reaching only the well to do farmers. As thecost of procurement increase, government is forced to increase thePDS price of food grains. This led to forced malnutrition of the BPLfamilies. Attempts must also be made to reduce the operationalcosts of the FCI and improve efficiency in holding food stocks. It isalso observed that the state level sales taxes and mandi fees arealso pushing up the cost of procurement. These also need to beaddressed.
Since the WTO provisions do not allow direct subsidisation,in future, it may become necessary to provide specific targeting offood subsidies. The free trade in food grains may as well result inlarge fluctuations in the food grain prices and the FCI can beentrusted with the task of stabilising them in conformity of the WTOprovisions. Ensuring nutritional standards would require providingboth food and non-food items at reasonable prices to the BPLfamilies. Subsidies must be provided only to common varieties offood grains or on those items whose production costs per unit ofnutritional requirements are the least. Long-term measures likeextension of irrigation facilities, improvements in the knowledge offarm management techniques, easy access to markets will help toimprove food security without the need to hold excess stocks andsave public money. Redistribution of land and non-land assets,provision of adequate, efficient credit facilities, generation ofemployment, would go a long way in providing food security to theBPL families.
In 2013, the Government introduced the National FoodSecurity Bill. This Bill allows legal entitlement to food nearly 67
186
percent of the population for subsidised food grains. Individualentitlements are given instead of the previous family-basedallocations. It aims to cover 75 percent of rural and 50 percent ofurban population. It proposed to provide free food for all childrenbetween the age of six months and six years. School children up toClass VIII will be provided a free meal every school day in allschools run by government or government aid. Local anganwadiswill provide a free every day to pregnant and new mothers alongwith a cash subsidy. The major problem with this ambitiousprogramme is the estimated food subsidy estimated at ` 1,20,000to ` 1,30,000 crore.
14.3 NATIONAL AGRICULTURAL POLICY 2000
The National Agricultural Policy 2000 was announced onJuly 28, 2000 in the Parliament to promote agricultural growth thatsuffered serious set back in the nineties. The Policy observed thatthe decline in public investments in agriculture, controls on themovement, storage and sale of agricultural products haveadversely affected the profitability and contributed to a decline inthe growth of this sector.
The Policy is called Rainbow Revolution as it aims at acomprehensive development of all the sub-sectors in agriculturelike, horticulture, seri-culture, animal husbandry, poultry, aqua-culture and aromatic and medicinal plants.
The policy aims at ensuring food and nutrition to thepopulation, providing raw materials for expanding industries,generating exportable surplus and ensuring equitable returns foethe farming community. The following are the objectives of the NAP2000:
a. A growth rate of over 4% p.a. in the agricultural sector.
b. Efficient use of resources and conservation of soil, water andbio-diversity.
c. Growth of equity across regions and farmers.
d. Promoting demand-driven growth that caters to the domesticmarkets and maximise the benefits from exports of agriculturalproducts that arise from liberalisation and globalisation.
e. To promote technologically, environmentally and economicallysustainable growth in agricultural sector.
In order to achieve the above objectives, the NAP 2000proposes the following steps:

187
i) To contain biotic pressures on land and to prevent thefraudulent transfer of agricultural land for non-agriculturalpurposes.
ii) Promote the effective use of wastelands by providing financialincentives and entitlements for the landless labour and to thebackward classes.
iii) To promote multi-cropping and inter-cropping to conserve soilfertility.
iv) To cover 2/3 of the cropped area by watersheds and promotethe use of drip and sprinkler irrigation to conserve waterresources.
The NAP 2000 has the following strategy to achieve theobjectives:
a. Greater attention will be paid to the development of newvarieties of food crops with higher nutritional value.
b. Ensure adequate food supply and exportable surplus bypromoting horticulture, floriculture, aromatic and medicinalplants among others.
c. Improve animal protein availability by promoting animalhusbandry, poultry, fisheries, etc.
d. Involve private sector and co-operatives to encouragedevelopment of contract farming, and animal husbandry.
e. Use bio-technology, remote sensing, energy savingtechnologies to promote production and productivity.
f. Ensure the sustainability of extension services by promotingrealistic cost recovery, keeping in mind the needs of small andmarginal farmers.
g. Promote empowerment of women by providing access to land,credit and other services.
h. Implementation of the land reforms by consolidating landholdings, redistribution of surplus land, tenancy reforms,improvement of land records and providing land leasing in oilseeds, cotton and horticulture.
i. A comprehensive agricultural insurance scheme to cover all therisks from sowing to post-harvesting operations, and ensuringreasonable prices for all farmers throughout the country.
The NAP recognizes that agriculture should be kept out ofthe purview of taxes and subsidies are necessary to protect theinterests of the farmers. In light of the WTO restrictions onsubsidies, there is need to monitor global prices of agriculturalprices.

188
However, the policy was fraught with inconsistencies fromthe beginning. Some of the shortcomings of the policy are as follow:
1. While the NAP set a target of 4% annual increase in theagricultural output, during 2000-2005, the actual growth rate offood grains production was only 0.63%. The pulses productionrecorded a growth rate of 0.78%. The yield per hector rose by1.29% for food grains and by 2.01% for all agriculturalcommodities. This is undoubtedly a blow to the food security.This situation is termed as “food security without endinghunger”.
2. The policy does not specify any quantitative targets for any of theobjectives. In the absence of any verifiable target, the promisesin the policy cannot be checked.
3. The policy does not mention the states that lagged behind inagricultural development and does not come out with anyspecific programmes for promoting agricultural production andproductivity in these states.
4. While the policy emphasizes the role of private investment inpromoting agricultural growth, it does not come out with anyspecific measures to do this. Nor can we expect the small andmarginal farmers to undertake any large investments in thisdirection. There is no target set for the volume of privateinvestment in agriculture.
5. The policy wrongly expects contract farming to generateemployment in agriculture. Contract farming by its very naturewill discourage labour-intensive techniques of production andrelies more on capital-intensive, labour-saving technologies.Thus, we may end-up with larger open-unemployment in ruralareas.
6. The policy fails to provide an action plan to achieve itsobjectives. Since agriculture is a state subject, the participationof states is essential to achieve the stated objectives of thepolicy. There are no institutional arrangements mentioned toachieve this. In short, the National Agricultural Policy 2000, is apolicy statement that has no direction and no strategy toachieve its stated objectives. The failure to reverse the trend inpublic investment in agriculture, is reflected in the fallingproduction and productivity of this sector.
14.4 WTO AGREEMENTS AND AGRICULTURE
The World Trade Organisation (WTO) came into existence in1995 on the promise of a near-free trade regime among all themember countries. It is based on a set of Agreements that wereagreed up on by the members. An important component of these

189
agreements is a set of arrangements governing the trade inagricultural commodities among member countries. This is knownas the ‘Agreements on Agriculture’ (AoA).
Prior to the AoA, the USA and the EU dominatedinternational trade in agriculture as the two main suppliers ofimportant all food grains like wheat and maize; Australia dominatedthe trade in milk products. The high levels of domestic subsidies toagriculture in these countries made it impossible for developingcountries to export to the developed country markets. The AoAproposed to limit these subsidies and to allow greater marketaccess to the developing countries. At the same time, thedeveloped countries also had high effective tariffs on imports ofagricultural trade. Lowering them was also part of the agreements.India as one of the original member of the WTO was expected togain immensely due to the opening up of trade in agriculture. Astrade in agriculture is freed, it was hypothesized that India would beable to access these markets. It would be able to obtain betterprices for its products. Before exploring the effects of AoA, let usbriefly understand its main features.
1. Market Access: This refers to the system of restrictions on theexports of agricultural goods from the developing countries.Prior to AoA, there were a number of non-tariff barriers (NTBs)on trade in agriculture. The Agreement mandated the removal ofall NTBs and a gradual reduction in tariffs by a simple averageof 36 percent by the developed countries (by 2000), and by 24percent by the developing countries (by 2004). By the end of theimplementation period, the market access to agricultural importsshould be provided at five percent of the domestic consumption.In other words, the developing countries will have theopportunity to export goods worth 5 percent of the totalconsumption of the developed countries by 2000.
2. Reductions in Domestic Support: An important and contentiousissue is the provisions regarding the reductions in support toagriculture by national governments. A number of schemesoperate both in the developed and developing countries to makeagriculture a viable activity. Some of them, however, preventfree flow of agricultural products across countries. The AoAdeals with these. According to this, all domestic support toagriculture is classified into two groups: 1) trade distorting and2) non-trade distorting (or minimum trade distorting). All trade-distorting subsidies are classified as ‘Amber Box’ subsidies, andare subject to reductions. Included in the amber box are themeasures undertaken to support prices and subsidies directlyrelated to production quantities. Amber-box support is subject tolimits expressed in terms of a "Total Aggregate Measurement ofSupport" (Total AMS) which combines all supports for specified

190
products, together with supports that are not for specificproducts, into one single figure. All non-trade distortingsubsidies are classified into two groups: a) The ‘Blue Box’subsidies which are also permitted, but on the condition thatthey must not lead to increased production, and b) the Greenbox subsidies which are deemed to cause minimal distortion,and typically include those to research and development (R&D),environmental protection and animal welfare. There is no upperlimit to these subsidies and they are not subject to any reductioncommitments. c) Special and Differential (S&D) Box subsidiesrefer to the certain subsidies like input subsidies to low-incomeand resource poor farmers in developing countries. These areallowed within the WTO framework. The AoA proposes to limitthe Blue and Amber Box subsidies to ensure the competitivetrade in agriculture.
3. Aggregate Measure of Support (AMS): This refers to the totalsupport given to the agriculture under the Amber Box and issubject to reductions. These are classified into i) ProductSpecific Support like in case of difference between the domesticsupport prices and external reference price, ii) Non-productSpecific Support like subsidies to agricultural inputs likefertilizers, electricity, irrigation and credit. This subsidy is takenas the total level of domestic support and not to individualcommodities. The total AMS is stipulated for a 20% reduction incase of developed countries in 6 years and by 13% bydeveloping countries in 10 years. Table 14.3 gives theReduction Commitments under the AoA.
Table 14.3: Reduction Commitments as envisioned in AoA:
Measure DevelopedCountries
(1995-2000)
DevelopingCountries
(1995-2004)
1.Average Reduction of Tariffson Agricultural Products (Base1986-88)
36% 24%
2. Total AMS (Base 1986-88) 20% 13%
3. Export Subsidies (Base 1986-88)
36% 24%
4. Volume of Export Subsidies 21% 14%
Source: WTO (1995): Agreements on Agriculture.
Apart from the above three, there is another set of subsidiesknown as ‘de minimis’ subsidies that refer to policies which amountto domestic support at less than 5%of the value of production for

191
developed countries and at less than 10 percent for developingcountries. These are excluded from any further reductioncommitments.
1. Other Agreements related to Agriculture: Though not directlypart of the AoA, there are some other provisions of the WTOthat have an important bearing on trade in agricultural products.Some of them are given below:
A) Sanitary and Phyto-Sanitary (SPS) Measures: These are relatedto measures considered necessary for protecting human, animalor plant life. Countries can fix higher standards thaninternational standards under Article 2 of the WTO Agreementsif there is scientific justification for them.
B) Trade Related Intellectual Property Rights (TRIPS): Under theseprovisions, protection of plant varieties either by patent or by aneffective suigeneris or by any other combination thereof can begranted.
C) Technical Barriers to Trade (TBT): These are instruments thatare used for setting up international standards and developmentof national testing and certifying bodies to avoid discriminationagainst exports.
From the above discussion it may appear that, the AoA is anon-discriminating arrangement to promote free trade in agriculturalproducts. However, reality is contrary to this. Given below are someof the problems that the developing countries are facing in theirtrade with developed countries.
1) High levels of protection in developed countries are replaced bysubsidies. For example, the USA spends more than nearly 33%of its GDP from agriculture on subsidies. For Japan, it is 25%,Canada and the EU 13%. More importantly, they are able toshift the subsidies from one category to another to avoid action.
2) Contrary to the reduction commitments agreed upon, the OECDcountries support to agriculture rose from $ 242,474 million in1986-88 to $ 279,845 million in 2008. As percentage of grossfarm receipts, the subsidy was 37% in 1986-88 and 29% in2005. The following table gives the limiting commitments underthe AMS.

192
Table 14.4: Comparison of Agricultural Subsidies (2000)(in US$ million)
Country GreenBox
BlueBox
CurrentTotalAMS
deminimis
Total
EU 20,749.9 23,040.1 56,571.1 612.1 100,698.2
USA 51,246.0 -- 6,238.1 811.6 58,295.7
Canada 859.2 -- 364.1 665.1 1,888.4
Japan 23,445.4 392.1 5,987.1 589.8 30,414.4
Switzerland 2,190.4 -- 2,257.6 -- 4,448.0
Norway 515.4 1,044.4 1,442.7 -- 3,002.5
Total 98,731.3 24,476.6 72,860.7 2,678.6 198,747.2
We can see that the developed countries spend a hugeamount on subsidising their agriculture, but insist on the developingcountries to reduce their subsidies to agriculture. Interestingly,some developed countries like the USA argue that the developingcountries should also increase their level of support to agriculture.However, since in developed countries agriculture accounts for asmall portion of GDP (2 to 4%), even if the support is 50%, the totalspending would be only one percent of GDP. If the developingcountries were to subsidise their agriculture by the samepercentage, they would have to spend between 14 to 24% of theirGDP. This is simply not possible. Thus, there is no way that thedeveloping countries can match the levels of support to agriculturethat is provided in the developed countries. This results inasymmetry in the support and gives advantage to the developedcountries in terms of prices and exports.
1) More importantly, most of the subsidies provided by thedeveloped countries are placed in the Green Box. Whereas, thesubsidies extended to agriculture by the developing countriescome under the Amber Box. Therefore, these subsidies areactionable. The administrative and institutional factors make itdifficult for the developing countries to shift their subsidies fromone box to another.
2) Though the developed countries lowered their tariffs onagricultural products by 36%, they are still very high. There is nosubstantial decrease in the tariffs on products that are of interestto the developing countries.

193
3) The use of TBTs and SPS measures by the developedcountries is another important problem. It has been found incase of India’s exports of mangoes and peanuts that thestandards set are unscientific and cannot be justified.Nevertheless, by the time the dispute is settled, farmers lost theseason. It is found that processed agricultural products havelesser levels of NTBs. However, in most of the developingcountries, facilities for testing and certification are not availableand the farmers are left without any protection against therestrictions that can be imposed on their exports.
4) Problems associated with patents are another major issue intrade in agriculture. The recent Texamati rice case is a pointerin this direction. The IPR regimes in developed countries are feltto undermine agriculture in developing countries. Many of thelivelihood concerns of the developing countries are not yetanswered. The linking of NAMA with liberalisation of agriculturaltrade is one simple example of the attitude of the developedcountries. There is some justification in the argument that WTOis a new instrument of neo-colonialism, designed to exploit thedeveloping countries and ensure that they remain dependent onthe rich countries.
14.5 SUMMARY
1. Agriculture occupies an important place in the Indian economy.A vast majority of population depend on it for their livelihood.Given the large population, agriculture also has implications forfood security to its population. Thus, both the size of agriculturaloutput and the productivity are central to the developmentissues of the Indian economy.
2. The exiting productivity is not adequate to meet the food needsof the economy. Productivity in Indian agriculture is lowcompared to its potential. India’s levels of productivity are lowercompared to some of the developing countries. Thus, it isessential that the government pays adequate attention toimproving agricultural production and productivity.
3. The concept of food security in India encompassed providingminimum support prices (MSP) to the farmers ensuringprofitability, price stability through open market operations ofprocurement and sale through Food Corporation of India (FCI),maintaining buffer stocks and the Public Distribution System(PDS). This policy helped to ensure grain surplus, stable pricesof basic food prices and high farm incomes.

194
4. The National Agricultural Policy 2000 was announced on July28, 2000 in the Parliament to promote agricultural growth thatsuffered serious set back in the nineties. The Policy is calledRainbow Revolution as it aims at a comprehensive developmentof all the sub-sectors in agriculture like, horticulture, seri-culture,animal husbandry, poultry, aqua-culture and aromatic andmedicinal plants.
5. An important component of these agreements is a set ofarrangements governing the trade in agricultural commoditiesamong member countries. This is known as the ‘Agreements onAgriculture’ (AoA).
14.6 QUESTIONS
1. Explain the trends in agricultural production and productionsince 1991.
2. What are the causes of low agricultural productivity in India?
3. What is food security? What is the need for food security?
4. Explain the concept of food security. What are the variousmeasures initiated by the government to ensure food security?
5. What are the various problems faced in providing food security?
6. What are the main objectives of the National Agricultural Policy2000?
7. What are the different measures proposed in the NationalAgricultural Policy 2000?
8. Explain the main features of Agreements on Agriculture.
9. What are the various implications of the WTO Agreements onAgriculture?

195
15
INDIA’S INDUSTRIAL ECONOMY
Unit Structure :
15.0 Objectives
15.1 Introduction
15.2 Causes of Low Industrial Growth after 1991
15.3 New Industrial Policy 1991
15.4 Small Scale Industries Policy
15.5 Small Scale Industries Policy 1991
15.6 Summary
15.7 Questions
15.0 OBJECTIVES
Understand the nature and structure of industrial growth in Indiaafter 1991.
Understand the main features of New Industrial Policy 1991. Understand the role, problems, and policies related to small
scale sector.
15.1 INTRODUCTION
A: Growth and Diversification of Indian Industry since 1991:
The industrial sector is the key to an economy’s growth anddevelopment. India adopted the strategy of planned economicdevelopment in 1952 with the public sector playing a crucial role inthe economy. As part of this strategy, restrictions were imposed onthe private industrial activity and a wide variety of licenses andpermits were introduced to regulate the private sector. After fortyyears of planning, the dismal performance of industrial sectorforced the government to change the strategy and opt forliberalisation in 1991. A new set of policies were adopted thataimed at encouraging the private enterprise and promote industrialactivity. To understand the impact of this policy, we shall examinethe growth and diversification of Indian industry since 1991.

196
India during the post-reform period emerged as an importantproduction center for major consumer goods industries. It is animportant center for the manufacturing of automobile components.However, the same could not be achieved in case of the capitalgoods. Following table gives the growth rate of different sectors ofthe industry since 1991 in terms of the different Five Year Plans.
Table 15.1 Growth of Indian industry since 1991 (Annual Average)
Sector Eighth Plan
(1992/3-1996/7)
Ninth Plan
(1997/8-2001/2)
Tenth Plan
(2002/3-2006/7)
Eleventh Plan
(2007/8-2011/12)
1. Basic Goods 6.8 4.1 6.6 5.4
2. Capital Goods 8.9 4.7 14.4 14.3
3. Intermediate Goods 8.5 5.8 6.2 4.0
4.Consumer Goods
a. Durables
b. Non-durables
6.6
13.4
4.8
5.5
10.7
3.8
9.6
8.8
10.0
7.8
15.6
3.4
General Index 7.4 5.0 8.2 6.9
Source: Reserve Bank of India (2013): Handbook of Statistics.
From the above table it can be seen that there isconsiderable volatility in the production of all major industrialgroups. The growth in the basic goods sector is less than thegrowth rate achieved in the pre-reform period. The intermediategoods sector also recorded low and volatile growth rates. It is theconsumer goods industry that has come to dominate the industrialactivity. Once again the durable consumer goods sector recordedvolatile growth. This volatility not only results in industrialdistortions, but also generates inflationary pressures on theeconomy. The overall index is lower than that of the pre-reformperiod. We shall now turn to the causes of this dissatisfactoryperformance of industry since 1991.
15.2 CAUSES OF LOW INDUSTRIAL GROWTH AFTER1991
There are a number of causes that explain the growth ofindustrial sector since 1991. Following are some of the important ofthem.
1. With the opening of the economy, the industrial sector had toface the competition from the foreign producers. In fact, in India,for a long time industrial policy was guided by this consideration.With the entry of the foreign countries, Indian industry could notcompete effectively.

197
2. After 1991, the public sector investment on infrastructuredeclined. The market was supposed to provide these utilities. Asa result, there developed acute shortage of all essential goodsand services. The case of electricity is one in this. Frequent andunscheduled power cuts disturbed the industrial and agriculturalactivities. The lack of proper roads, and long handling time atthe major ports, are some of the other adverse consequences ofthe neglect of infrastructure.
3. Due the stock market scams, initially the firms found it difficult toobtain the necessary funds for investment from the stockmarkets. Subsequently, speculation in gold and real estatediverted funds from industrial sector to these activities and theindustry was forced to slow-down its investment proposals.
4. It was observed that during the post-reform period, ReserveBank of India tried to reign-in the inflationary pressures. Itfollowed a high interest rate regime towards this goal. As aresult, the market interest rates increased and made investmentcostly for the firms.
5. Low and erratic agricultural production also resulted influctuations in the demand for industrial goods. This is held as athe main cause of volatile industrial growth after 1991.
6. The exports were governed by external demand conditions. AsIndian economy opened-up, it has to face the negative side ofliberalisation. With world economy acing frequent crisis, Indianindustry was also buffeted by these conditions.
It is important to note that the process of industrialdevelopment needs long-term planning and direction by thegovernment. Unbridled freedom to private sector is not the optionfor any country, not for India.
15.3 NEW INDUSTRIAL POLICY 1991
The watershed in India’s economic policy was on July 25th
1991 when the then Finance Minister Dr. Manmohan Singhannounced the New Industrial Policy (NIP 1991). This Policy aimsat integrating the Indian industry with the global economy andfacilitate the gains from international division of labour. The watchwords of this policy are: “liberalisation”, “privatisation” and“globalisation”. Thus, this strategy of rapid economic developmentthrough industrial development was also called “the LPG Strategy”.Following are the main instruments of this strategy:
a. De-reservation of Industries: In India, seventeen sectors wereexclusively reserved for the Public Sector. No private firm canenter into these. Government started opening them up for theprivate sector in a phased manner. And the reserved industries
198
were gradually reduced to only three. All other sectors are nowopen for private sector investments.
b. Abolition of MRPT Act: The Monopolies and Restrictive TradePractices Act was the most severe of all economic legislation inIndia. It placed restrictions on the assets that a private businesshouse can hold. It translated into restrictions on capacity,product-mix and so on. As the industrial sector is based onindivisibilities, these capacity restrictions only promotedinefficient production. These restrictions were all removed in1991.
c. Foreign Direct Investment (FDI): The foreign investment is animportant complement to the domestic investment. Whendomestic producers do not have the necessary technology,and/or capital, a foreign investment is a reasonable alternative.The restrictions on foreign investment proposed that theseinvestments should not exceed 49 percent of the totalinvestment. These restrictions were removed. Now in allimportant sectors, government allows 100 percent foreign directinvestment. A Foreign Investment Promotion Board (FIPB) isset-up for the speedy clearance of investment proposals fromabroad.
d. Abolition of Industrial Licensing: By 1991, there were a variety ofrestrictions on the industrial sector. These were in the form oflocation, capacity, products, investments, number of workers,and so on. In 1991, all restrictions except those related toenvironment were removed and the industry is given thefreedom to choose their own location, product-mix and size. Thepractice of phased-manufacturing was also removed allowingthe firms to grow faster.
e. Revamping of Public Sector: The public sector units (PSUs)which are supposed to play a pivotal role in industrialdevelopment became a drag on the economy due to themassive losses incurred by them. As part of public sectorreforms, government proposed disinvestment in these units. ADisinvestment Board was set-up to advice the government onthe units that are to be disinvested. Surpluses that generatedare to be used for setting up of National Renewal Fund forpromotion of industrial sector. The government also grantedfunctional autonomy through the Nava Ratna Scheme to profitmaking PSUs.
f. Promotion of Small Scale Industries: The governmentintroduced a comprehensive Act for the promotion of small andmarginal units. It allowed higher investment in this sector andalso reduced the number of items reserved for this sector.

199
Appraisal of the New Industrial Policy 1991 :
It is apparent that the reforms in the industrial sector are amixed bag of fortunes. While the variety and volume of consumergoods improved, a lot remains to be desired. Following are some ofthe observations on the NIP 1991:
1. The Indian industry at last started showing signs oftechnological improvements. There are many foreign companiesthat started production in India itself.
2. The industrial structure is quite diversified with emphasis oninnovations and price competitiveness. India emerged as thesecond fastest growing economy of the world.
3. There is considerable decline in the role of public sector.However, the private sector did not take the necessary lead inthe development of the economy.
4. Regional disparities increased significantly after 1991. Only afew states like, Gujarat, Tamil Nadu, National Capital Region ofNew Delhi have seen the setting up of new industrial units.
5. The casualisation of labour is the main adverse consequence ofthe LPG strategy. The earnings of the labour have not kept upwith the increase in productivity.
15.4 SMALL SCALE INDUSTRIES POLICY
The small-sector plays an important role in the Indianeconomy. This sector has been traditionally the largest provider ofemployment after agriculture. Small Scale industries are animportant component of the Indian industrial sector. This sector isconsidered to be labour-intensive and require lesser capital per unitof output and labour. According to the latest definition, they coverboth manufacturing and services enterprises. Based on the capitalinvestment, they are defined as under:
A. Manufacturing Enterprises are defined as: i) A unit with aninvestment not exceeding Rs.25 lakh is defined as a microenterprise. ii) A unit with an investment between Rs. 25 lakh andRs. 5 crore is defined as a small enterprise. ii) A unit with aninvestment between Rs. 5 crore and Rs. 10 crore is defined as amedium enterprise. B) Service Enterprises are defined as: i) Amicro unit is defined as one with an investment in equipment notexceeding Rs. 10 lakh. ii) A small enterprise has an investmentceiling of up to Rs. 2 crore. iii) A medium enterprise has aninvestment ceiling of Rs. 5 crore. When a unit is registered with theDistrict Industries Centre, it is known as registered unit. All unitsusing 10 workers with power or more than 20 workers withoutpower has to necessarily register.

200
D. 1. Role of Small Scale Industries in Indian Economy
The SSI sector has important bearing on the economy. Wecan see its role in terms of the following :
a) Contribution to Industrial Production :
The number of SSI units increased from 0.87 million in 1980-1 to 7.35 million in 1992-3 and to a further 12.84 million by 2006-07.The number of units increased at an annual rate of 4.06 percent.During the same period, output increased from `. 28,100 core to`. 84,413 crore and to `. 5,85,112 crore. The output at 1993-94prices rose by 11.56 percent. Thus, the SSI recorded a highergrowth than the large industries and account for nearly 39 percentof industrial output.
b) Contribution to Employment :The SSI units are an important source of employment for the
semi-skilled and un-skilled labour. The Third Small Scale IndustriesSurvey of 2001-02 indicated that the employment potential of SSI islarger at 7 times that of the large industries for an investment of` One lakh. The total employment in this sector rose from 7.10million in 1980 to 17.48 million in 1992-93. By 2006-07,employment in SSI increased to 31.25 million. The employmentgrowth rate is also higher at 3.97 percent when compared to thelarge industries. If we consider the high incidence of chronicunemployment among the rural labour force, this sector becomesan important source of non-farm employment.
c) Contribution to Exports :
The SSIs are an important contributor to the exports. During1991/2 and 2005/6, exports of SSI in dollar terms recorded anannual growth rate of 11.58 percent. In 2005-06, they accountedfor exports worth `. 1,50,242 crore or US$ 33,935 million. Theexports to output ratio of SSI increased from 17.22 percent in 1991-92 to 30.18 percent in 2005-06. This growth has been sharp after2001 indicating the success of the policy initiatives since 2000. Theexports of SSI recorded a marginally higher growth than its output.Thus, the performance and problems of the SSI have an importantBOP implications for India. Most of the SSI exports are the fastgrowing manufactures like jewellery, hand tools, sports goods,leather manufactures and so on.
d) Mobilisation of Capital and Entrepreneurial Skills :
The most important role of this sector is in that it allowsindividual initiative and risk-bearing qualities to find expression inproductive activities. This can be seen in their spread across thecountry and providing job opportunities so many un-skilled andsemi-skilled workers.
201
D. 2) Problems of the SSI:However, all is not well with the SSIs. The following are the
major problems that the SSIs are facing in India :
1) Problem of Sick Units: The SSIs experience rampant sickness.Between 1991 and 2005, the number of sick SSIs has actuallydeclined from 2,21,472 units to 1,38,041 units. Sickness of SSIspeaked in 1999 when 3,06,221 units were reported sick. Thecredit outstanding in their account rose from ` 2,792.04 cr to` 5,380.13 cr, recording an annual increase of 4.65%. There isno proper mechanism to revive and rehabilitate the sick units.
2) Shortage of Raw Materials: The SSIs are not in a position toacquire reliable local raw materials. At the same time, the tradepolicy generally favoured the large industries in grantinglicenses to import raw materials. As a result of this shortage,they can not meet the production deadlines; maintain theirquality levels, causing them to lose their customers andmarkets. This leads to the eventual sickness of the units. Underthe economic policy reforms introduced in 1991, the SSIs areforced to face much tougher conditions in procuring rawmaterials and other inputs. Thus, the government should put inplace a system of addressing these difficulties effectively.
3) Problems of Marketing: These units are scattered and operateon a limited scale. As a result, they cannot enjoy the economiesof scale in both procuring of raw material and selling of the finaloutput. They find it difficult to obtain credit and discounts on thepurchase of inputs. As a result, they are forced to pay higherprices for their inputs and realise lower prices. This is animportant cause of the sickness among the SSIs.
4) Labour and Management Problems: Many of the SSIs face theproblem of labour unrest. They have to contend with low-skilledlabour. This results in lower productivity and higher costs ofproduction. The demand for bonus, wage increases are alsocommon. Frequent strikes and other forms of industrial unrestcause loss of production. As these units are mostly family-run,they are not managed by trained staff. Decisions are taken on acase-to-case basis and there is a lack of long-term vision on thenature of production, diversification and marketing strategy.
5) Technological Problems: It has been observed by J. C.Sandesara, that the SSIs adopt capital-intensive techniques toavoid labour problems. They prefer to import new technologyrather than to develop existing technologies. When thegovernment allows them to, they opt for more capital- andimport-intensive technologies. As a result, the SSIs are forced torely upon more and more imports, which also contribute to theirproduction problems.

202
6) Lack of Adequate Credit: It has been observed by M. R.Narayana that after the introduction of economic reforms in1991, the commercial banks have become risk-averse and arekeeping away from the SSIs. The commercial banks have failedto meet their targets of SSI lending for the last 15 years. Ascredit gets squeezed, the SSIs are facing greater danger ofsickness. Further, the commercial banks shy the export credit tothe SSI units and thus these units are dependent on privatesources for both pre- and post-shipment credit at higher rates ofinterest.
7) Problem of External Competition: M. R. Narayana furtherobserved that both the government and the SSIs do not seem tobe aware of the danger of cheap imports, especially from China.Lack of check on illegal imports, inability to maintain quality andlack of market information are the serious issues which needimmediate attention of the policy-makers. Some of the subsidiesthat are presently available to the SSIs can come under theWTO restrictions under the SCMs. This problem also needsurgent attention.
8) Scale Problems: It has been observed by T. N. Srinivasan thatthe policy of reservations has itself become a drag on the SSIs.As government reserved items to them, these units are not ableto expand their output even when the demand for their productsis increasing. As a result, these units are forced to face theprospect of uneconomical scale, higher costs and lessercompetitiveness in external markets.
9) Fall in Output per Worker: Since 1990-91, there was a steep fallin output per worker in the SSIs. In 1990-91 ir was ` 1,59,000per worker and fell to ` 61,000 per worker in 1995-96. Thereafter it made a marginal recovery and reached ` 89,000 perworker in 2004-05. This indicates a fall in the productivity of thelabour in the SSIs and calls for urgent remedial measures.
15.5 SMALL SCALE INDUSTRIES POLICY 1991
The watershed in the development of SSI is the policystatement of August 1991. The government adopted a progressiveview to develop this sector as a result it announced the increase inthe investment limit for the tiny units from ` 5 lakh to ` 25 lakh. Alsothe locational restrictions were removed. Sandesara observed thatthis shift from small industries to small business policy is animportant development. More importantly, the definition of ‘industry’is extended to include all industry-related services and businessenterprises.
A separate package was announced for the tiny sector witha view to provide continuous support, and for others a one-time

203
assistance. The premise is that the tiny-sector will become self-supportive after reaching a certain stage of development.
An important legal provision was in concept of ‘unlimitedliability’. In the earlier policy, all the partners had equal liability. Thisfound to discourage the friends and family members of smallentrepreneurs from providing capital. In order to make investmentsin SSI attractive, the government introduced the provision ofunlimited liability to only one partner. All other partners have alimited liability equal to their share capital. This would encouragethe SSI to attract capital.
The technological up gradation and product development inthe SSI needs the support of the large industries. In order topromote the process of technological transfers, the governmentallowed the large industries to participate up to 24 percent of equityin the SSI. This also allows the infusion of new liquidity in thissector.
A National Equity Fund (NEF) is set up to cover the largerunits among the SSI.
The government accorded priority to the SSI in allocatingindigenous raw materials.
The government set up a separate Market DevelopmentFund for the SSI and the tiny sector products. In 2006, a MarketDevelopment Assistance (MDA) Scheme was initiated exclusivelyfor the SSIs.
In March 1994, the Integrated Infrastructure DevelopmentCentres (IIDCS) was introduced. This scheme allows the allocationof industrial plots to the SSI units on a priority basis.
The Ninth Five Year Plan also continued with the emphasison SSIs. It proposed the strengthening the financial base of theSate Finance Corporations (SFCs) and the Small IndustriesDevelopment Organisation (SIDO). It proposed setting up ofspecialised commercial bank branches to cater to the credit needsof the SSIs. Further the Local Area Banks (LBAs) were set up toco-ordinate the activities of the manufacturers associations.Further, efforts were initiated to provide SSIs with more funds fromthe non-bank finance companies.
(A) COMPREHENSIVE PACKAGE 2000
This was announced on August 30, 2000 and containedproposals to revitalise the SSIs. The following are some of theimportant provisions :

204
1. The excide duty exemption limit was raised to Rs. One crore.This limit was increased to Rs. 4 crore in 2006.
2. The capital subsidy was increased to 12 percent andsubsequently to 15 percent in 2006.This would facilitatetechnological up gradation.
3. The composite loan limit was also raised to ` 25 lakh and to` One crore for SSI units with good track record.
4. The Integrated Infrastructure Development Scheme (IIDS) wasextended to cover the entire country with a provision for 50percent reservation for rural areas and 50 percent plots werereserved for the tiny sector units.
5. The cabinet Secretary will head a group to review andrecommend the necessary legal framework for the efficientfunctioning of the SSIs. As a result of the consultations with theentrepreneurs and the SSI associations, the Micro, Small andMedium Enterprises Development (MSMED) Act 2006 wasenacted to provide a comprehensive legislation to facilitate theorderly development of this sector.
(B) OTHER MEASURES :
In addition to the above measures, additional policyinitiatives were also taken :
a) The SSI investment limit was raised to ` 5 crore in 2006.
b) The Credit Guarantee Fund (CGF) Scheme was extended tocover up to ` 50 lakh for SSIs and up to ` 5 lakh for microenterprises. Higher loan amounts are allowed for womenentrepreneurs.
c) Various studies observed that the practice of reservation hasundermined the profitability of the SSIs by limiting their size.Therefore, the list of items reserved for SSIs was graduallyreduced from 847 to 14 during 1991-2007.
d) SSI units with a good track record were allowed collateral freeloans up to ` 25 lakh and the credit limit on Laghu UdyamiCredit Card was increased to ` 10 lakh for such units.
e) The SIDBI is operating the Small and Medium Enterprises Fundof ` 10,000 crore since April 2004 to provide loans to SSI unitsat 2 percent below its PLR.
Micro, Small and Medium Enterprises Development (MSMEC)Act 2006 :
In 2006, the MSMED Act was passed to provide a legalframework for firms that are involved in both manufacturing andservices to the economy. This Act established a consultative
205
framework at the national level for better co-ordination of thepolicies that are aimed at promoting the small industries. The mainfeatures of this Act are as under:
a) Setting up of special funds for the promotion, development andenforcement of competitiveness of the small units.
b) Notification of schemes/programmes for their development.
c) Pursuing progressive credit policies and practices for thedevelopment of micro, small and medium units.
d) Providing preferential treatment in government procurement tothese units, and
e) Simplifying the procedures for the closure of sick units.
(C) APPRAISAL
The performance of the SSI units improved significantly afterthe introduction of these various measures. Some of the importantoutcomes of this were :
1. The incidence of sickness has come down from about 31percent to about 9 percent during 1991-2007.
2. The product profile of these units improved significantly. Butthey continue to concentrate on low-end labour-intensivemanufacturing and thus, their growth is severely constrained.This also impaired their export performance.
3. Despite the various measures initiated by the government,these units have to put up with regulations and bureaucraticdiscretions. They are thus forced to incur a number of costs insecuring the benefits that the policies proposed. Theperformance of the ‘Single-Window’ scheme is at best dubious.
4. Though the credit flows from the commercial banks improved,these units are still starved of the vital working capitalrequirement. This forces many of them to borrow from the non-institutional sources that add to their financial burdens.
5. An important problem is the quality aspect. Since the testingfacilities are inadequate, they are forced to produce and sellproducts that are of indefinite quality. This is found to be asevere constraint on the exports.
It is a tribute to the entrepreneurial skills of these units that theycontinue to out-perform the large scale industry despite all theinstitutional and bureaucratic restrictions.
15.6 SUMMARY
1. After forty years of planning, the dismal performance ofindustrial sector forced the government to change the strategyand opt for liberalisation in 1991. A new set of policies were

206
adopted that aimed at encouraging the private enterprise andpromote industrial activity.
2. There is considerable volatility in the production of all majorindustrial groups. This volatility not only results in industrialdistortions, but also generates inflationary pressures on theeconomy. The overall index is lower than that of the pre-reformperiod.
3. The New Industrial Policy (NIP 1991) aims at integrating theIndian industry with the global economy and facilitate the gainsfrom international division of labour. The watch words of thispolicy are: “liberalisation”, “privatisation” and “globalisation”.
4. The small-sector plays an important role in the Indian economy.This sector has been traditionally the largest provider ofemployment after agriculture. Small Scale industries are animportant component of the Indian industrial sector. This sectoris considered to be labour-intensive and require lesser capitalper unit of output and labour.
5. The government adopted a progressive view to develop thissector as a result it announced the increase in the investmentlimit for the tiny units from ` 5 lakh to ` 25 lakh. Also thelocational restrictions were removed. More importantly, thedefinition of ‘industry’ is extended to include all industry-relatedservices and business enterprises.
6. The Comprehensive Policy Package was announced on August30, 2000 and contained proposals to revitalise the SSIs.
7. In 2006, the MSMED Act was passed to provide a legalframework for firms that are involved in both manufacturing andservices to the economy. This Act established a consultativeframework at the national level for better co-ordination of thepolicies that are aimed at promoting the small industries.
15.7 QUESTIONS
1. Explain the trends in industrial production since 1991.
2. What are the main features of New Industrial Policy 1991?
3. What are the achievements and failures of NEP 1991?
4. Examine the role of small scale sector in the Indian economy.
5. What are the major problems that are faced by small scale units?
6. Examine the measures initiated to promote small scale sectorafter 1991.

207
16
COMPETITION ACT 2002 ANDSERVICES SECTOR IN THE INDIAN
ECONOMY
Unit Structure :
16.0 Objectives
16.1 Competition Act
16.2 Comparison between MRTP Act And Competition Act
16.3 Services Sector in Indian Economy
16.4 Summary
16.5 Questions
16.0 OBJECTIVES
To understand the features of Competition Act of 2002 To understand the significance of service sector to Indian
economy
16.1 COMPETITION ACT
Economic reforms led to a change in thinking that theprocess of globalisation calls for the establishment of free marketeconomy and that the focus of economic policy should not beconfined to curbing monopolies but to allow enterprise to meetcompetition both from within the country and outside. The role ofthe State changes from that of a regulator to that of a facilitator ofeconomic activity. An important step in this direction is theenactment of the Competition Act 2002. The core objective of theCompetition Act of 2002 is to promote the competitive process inthe Indian economy. The following are the objectives of the Act:
1) To prevent practices that have a negative effect on competition;2) To promote and sustain competition in the markets; and3) To protect the interests of the consumers and to ensure
freedom of trade.
208
The Competition Commission of India (CCI) is set up topromote the competitive process in the Indian economy. It haseleven members appointed by the government. The Commissionhas the powers to regulate its own procedures is not bound by theCivil Procedure Code. It operates on the principle of natural justiceand is subject to the procedures laid down by the Government ofIndia. The Commission shall treat all information about anyenterprise as confidential and ensure that the commerciallysensitive information is not used to harm the interests of theconcerned enterprise.
The Act is based on the findings world over that competitionamong the producers promotes consumer welfare and ensures theoptimum use of resources. This is also in line with the fundamentalright to carry on any trade or business that is enshrined in theConstitution. The Competition Act recognises certain acts on thepart of producers as anti-competitive and prohibits/ regulates themto ensure competition in ‘the relevant market’. While there is noprecise definition of ‘the relevant market’, the Commission isempowered to decide with respect to the relevant product market orthe relevant geographical market or with respect to both themarkets. These are defined in terms of the regulatory tradebarriers, local specification requirements, distribution facilities,import tariffs, legal and cultural traditions, consumer preferencesand the need for secure and regular supplied or rapid after salesservices. Once the Commission decides up on the following threeacts on the part of the producers, it declares such practices asprohibitive and issues orders to repel them including the provisionfor payment of financial damages :
1) Anti-competitive Agreements,2) Abuse of Dominant Position,3) Combinations.
In this connection, the Indian Act is supposed to be inlinewith the international best practices. We shall examine each ofthese and the legal provisions to prevent/regulate them asenvisaged in the Act.
1) Anti-competitive Agreements :
Section 3 of the Act defines any agreement with respect tothe production, supply, distribution, storage, acquisition or control ofgoods or provision of services which causes or is likely to cause anappreciable adverse effect on competition within India as anti-competitive and thus shall be void. Such an agreement could bewritten, unwritten, formal or informal. Under this section five actsare declared as void. The various practices that are prohibitedunder the Competition Act are, those related to limiting and

209
controlling production, and supply; technical development; sharingthe market or the source of production; allocation of geographicalmarket; price fixing; tie-in agreements; refusal to deal with aparticular dealer or buyer; resale price maintenance where anagreement to sell goods on the condition that the prices to becharged on the resale by the purchaser shall be the pricesstipulated by the seller; and so on.
The Act exempts the intellectual property rights (IPRs), rightsunder the Patent Act of 1970, the Copyright Act of 1957 from itspurview. It also exempts agreements related to export of a productfrom India.
2) Abuse of Dominant Position :
Section 4 of the Act spells out the provisions regarding theabuse of its dominant position in ‘the relevant market’ by a firm.Dominant position is explained as ‘a position of strength whichenables a firm to operate independent of the competitive forces inthe market; affect its competitors or consumers in its favour’. Indiaalso uses the market share of the enterprise as a ready measure ofdominance in the market. It also considers the size and resourcesof the enterprise, economic power over the rivals, entry barriers inthe market and dependence of consumers on the enterprise todefine dominant position.
Abuse of dominant position is defined in terms of predatorypricing, limiting or restricting production or technical or scientificdevelopment, denying market access, imposing supplementaryobligations that have no connection with the subject of the contract,or using the dominance in one market to enter into or protectanother market. The list of abuses is exhaustive and not merelyillustrative.
3) Regulation of Combinations :
Section 5 of the Act defines a combination as one that‘includes an acquisition, acquiring of control and any merger oramalgamation’. The Combination is defined in terms of size-relatedthresholds and only the firms above these limits are subject of thejurisdiction of the Commission. These thresholds are subject toperiodic review by the government. The following are the existingthresholds:

210
Group Status Geographical Coverage Threshold Limit
No Group India Assets: `. 1,000 croreTurnover: `. 3,000 crore
World-wide Assets: U.S.$ 500 millionTurnover: U.S.$ 1,500million
Group India Assets: `. 4,000 croreTurnover: `. 12,000 crore
World-wide Assets: U.S.$ 2 billionTurnover: U.S.$ 6 billion
The Act defines turnover to include the value of sales ofgoods and services and assets to include intangibles like value ofgoodwill, copyrights, patent and trademark. Though there is nospecific mention of joint ventures, they can become subject toscrutiny if they satisfy all the conditions of Section 5.
The Act provides under Section 6 the following provisions: a)No person or enterprise shall enter into a combination that causesor is likely to cause an appreciable adverse effect on thecompetition in the relevant market in India; b) a notice is to be givento the Commission disclosing the details of the proposedcombination within seven days of approval by the board of directorsor execution of any agreement for acquisition or acquiring ofcontrol.; c) if any merger or acquisition is likely to cause actual orpotential adverse effect, the Commission has to give its decisionwithin 90 days of notification or else, the combination shall bedeemed as approved.
4) Competition Advocacy :
The Competition Commission of India is mandated to takesuitable measures for the promotion of a competitive environmentfor economic activities by means of non-enforcement mechanismsand by creating awareness and imparting training aboutcompetition issues and activities to strengthen the competitionculture in the market. It is important to note that enforcement andadvocacy are mutually reinforcing. Competition advocacy iscompliance without enforcement.
5) Other Provisions :
a) Remedies and Leniency : The Act provides for the remediesthat the Commission can order in case of anti-competitiveagreements and the abuse of dominant position. The Commission
211
can order the persons or enterprise to ‘cease and desist’ in suchcases. It can also impose a penalty not exceeding 10 percent of theaverage turnover of the preceding three years. In case of a cartel,the Commission can impose a penalty up to 10 percent of theturnover or three times the amount of profits made out of the cartelagreement, whichever is higher. It can recommend to thegovernment to divide an enterprise enjoying the dominant position.It can award compensation for any loss or damage suffered as aresult of any contravention of the provisions of the Act on the threegrounds of non-competitive behaviour by a person (s) or enterprise.It can even punish the persons guilty of such acts ofcontraventions. In case of cartels, the Act provides for leniency tothe first party that makes the full, true and vital disclosure beforethe investigations into the cartel.
b) Regulated Sectors : the Commission has jurisdiction over allthe sectors of the economy. When a separate sectoral regulatorexists, it can make a reference to the Commission about the threeacts of contravention. The Commission shall give its opinion within60 days after hearing the parties. But the sectoral regulator is notbound by the opinion of the Commission about the contravention.
c) Exemptions : The Act excludes all activities carried by thegovernment dealing with atomic energy, currency, defence andspace from the application of the provisions of the Act. However,the Indian law is considered to be weak in protecting the stateactivities of commercial nature. The Act also exempts theintellectual property rights (IPRs), and export trade from the anti-competition provisions. The government can also notify furtherexemptions.
d) Extra Territoriality : Section 32 of the Act provides for theCommission to inquire into an agreement or abuse of dominantposition or combination if the act has taken place outside India.This is based on ‘the effects doctrine’ which allows supporting theextra-territorial jurisdiction. The Commission can, under Section 18of the Act, enter into memorandum or agreement with any agencyof any country with the prior approval of the government to inquireinto such cases. In this case, the Indian Act is in conformity with theprovisions of the USA and the EU. This ensures that theCommission can prevent any anti-competitive act perpetratedoutside India.
6) Competition Amendment Bill 2006 :
The Supreme Court made certain observations about theCompetition Act and they were incorporated in the 2007Amendment. They are as under:

212
i) A statutory regulator can suo motto make a reference to theCommission for its opinion and after receiving it opinion, mustgive reasons for not accepting the Commission’s views.
ii) The Commission on its own can order the division of a dominantenterprise.
iii) The leniency treatment will be extended to the parties that havesubsequently provided information about the cartel. This facilityis valid till the investigation report is made.
iv) The state governments will also be able to make a reference tothe Commission.
v) A Competition Appellate Tribunal is to be set up to hear anddispose appeals against any direction issued or decision madeor order passed by the Commission. It also is to be empoweredto decide on the claims for compensation that may arise fromthe findings of the Commission. The Commission will have nopower to decide on the compensation claims.
vi) It is mandatory to give a prior notification of a combinationinstead of an option as per the existing rules.
vii) Provide complete amnesty to the first firm that gives enoughevidence to the commence an investigation and reducedpenalties it they continue to collaborate in the investigationsagainst the remaining members of the cartel.
The Supreme Court observed that since the Commissionperforms a judicial function, it should have judges on its panel.Further, it is suggested that the Competition Appellate Tribunal canbe approached only after the Commission has determined aviolation of the Act has taken place and not before that. The IndianAct is considered to be weak in protecting the research anddevelopment efforts. In this case, the EU rules provide forexemption from the application of dominant position provisions forthe firms that enter into agreements related to R&D. In the Indiancase, the Act does not specify the grounds on which theCommission can grant exemptions. The government, and not theCommission, is given the authority to grant exemptions. In the EUthe law specifies the provisions for block exemptions. The clause touse ‘public interest’ as a ground for exemption is too vague andthere are no clear cut procedures laid down in the law on this. TheIndian Act also does not provide for the Commission to takeindependent decisions and its membership is decided by thegovernment only. In a recent case, the Supreme Court tookobjection to the appointment of the retired Commerce Secretary tothe Commission since it results in a conflict of interests.

213
16.2 COMPARISON BETWEEN MRTP ACT ANDCOMPETITION ACT
The Competition Act of 2002 differs significantly from theMRPT Act that the government used from 1969 to 2002. Followingare some of the important differences between the two:
a. The national monopolies were defined in terms of assetscommanded by an industrial house. In case of Competition Act,it is defined in terms of the restrictive trade practices used by afirm or group of firms to prevent the free play of market forces.
b. Product monopolies were defined in terms of share in themarket. While in the later it is defined in terms of agreementsrelated to the production, distribution, storage and acquisition orcontrol of goods and services that may cause adverse effectson the working of the markets.
c. In case of the former, prior permission of the government isneeded for substantial expansion is planned through issues offresh capital, or purchase of new capital equipment. Priorpermission is also required for the establishment of newundertakings, mergers, acquisitions, and amalgamation of otherfirms. The MRTP Act acted in tandem with the FERA Act. Incase of the Competition Act, no such permissions are required.It only aims at prohibiting the abuse of dominant position,defined as capability to operate independently of the marketforces and effects the other market players. It aims at controllingthe combinations rather than prohibiting them.
d. While the MRTP Act does not allow any oligopolies, theCompetition Act prohibits the abuse of the dominant positionthat firms obtain through monopolies.
e. The MRTP Chairman is appointed by the government and as aresult, the independence of the office is doubtful. TheCompetition Commissioner of India is selected by a collegiumsand thus enjoys a higher degree of independence.
f. The MRTP Act does not contain any provision for thepunishment of the offenders. The Competition Act proposespunishment to the abuse of the market. Thus, the later is moreeffective than the former.
g. The MRTP Act omits the restrictive practices while the laterfocuses on the importance of restrictive practices and providesfor punishing the offenders.

214
16.3 SERVICES SECTOR IN INDIAN ECONOMY
Service sector refers to a) Construction, b) Trade, hotels,transport and communication, c) Finance, banking and insurance,and d) Community and personal services. In an advancedeconomy, the share of services in GDP would high. In other words,as the economy progresses, the share of this sector in the nationaleconomy would be increasing. In case of India, this is a clearindication to the structural changes that the economy witnessedsince 1991. The following Table shows the trends in the output ofdifferent sectors in the Indian economy between 1990-91 and2012-13.
Table 16.1: Components of GDP during 1990-91 and 2012-13(`Cr. at current prices):
Year GrossDomestic
Product (GDP)
Agriculture and
Allied Activities
Industry Services
1990-91 5,15,031 1,50,800 1,10,760 2,53,472
2000-01 19,25,017 4,49,515 3,92,138 10,83,313
2005-06 32,75,670 6,15,844 6,77,946 19,81,879
2010-11 72,66,967 13,06,942 14,07,850 45,52,175
2012-13 94,61,013 16,44,834 16,69,114 61,47,064
Source: Reserve Bank of India: ‘Handbook of Statistics Relating toIndian Economy 2008-09.
The value of GDP originating in the service sector has seena remarkable increase since 1990-91. As can be seen in the abovetable, the share of service sector in GDP rose from 49 percent. to56 percent of the GDP in 2000-01. In 2007-08, it accounted for 61percent of the GDP. During 1991-92 and 2007-08, the servicesector recorded an annual average growth rate of 8.17 percent.During this period, the GDP grew at only 6.42 percent. Thus, in thenineties, the service sector at a much faster rate than industry andagriculture.
All the four sub-sectors within the services did not postuniform growth. This calls for some further analysis of the trends inthe growth of service sector, especially after the introduction ofeconomic reforms in 1991. Table 16.2 shows the shares of differentsub-sectors during 1991-92 and 2007-08.

215
Table 16.2: Output and Shares of Service Sectors during 1991-92and 2012-13 (`Cr. Constant Prices)
Year ServiceSector
Construction Trade, Hotels,Transport andCommunication
Banking,FinanceandInsurance
PersonalandSocialServices
1991-92 6,02,569 67,696 2,03,897 1,27,079 2,03,897
2000-01 10,46,299 1,08,362 4,15,650 2,43,048 2,79,239
2005-06 15,95,818 1,84,255 6,86,738 3,59,942 3,64,883
2012-13 37,09,640 4,30,277 15,32,034 10,30,684 7,16,645
Source: Reserve Bank of India: “Handbook of Statistics Relating toIndian Economy 2012-13.
From the above table we can see that the growth in theservice sector is not uniform. Trade, Hotels, Transport andCommunication saw the highest annual growth at 9.29 percentfollowed by Banking, Finance and Insurance at 8 percent.Construction posted an annual growth of 7.85 percent followed byOther Services at 6.64 percent.
The factors that explain this phenomenal growth of servicesector are studied by E. D’souza. According to him, as theeconomy progresses, the role of supportive services becomesimportant. As a result, the share of services in value added will seean increase. Thus, the growth of services is related directly to thegrowth of manufacturing and agriculture also. IT-enables productiontechniques are one example of this phenomenon. The ReserveBank also arrived at similar conclusions in 2000. It would beinteresting to examine the income and price elasticity of demand forservice sector. Estimations of these elasticities using the GDP atconstant prices (1990-2000 prices) and the wholesale price index(1999-2000 =100) gives us the following results:

216
Table 16.3: Income and Price Elasticities of Service Sector (1991-92 to 2007-08).
Sector Income Elasticity Price Elasticity
1. Total Services 1.259 1.385
2. Construction 1.224 1.313
3. Trade, Hotels,Transport andCommunication
1.426 1.573
4. Banking, Financeand Insurance
1.235 1.361
5. Community andPersonal Services
1.025 1.137
Source: Calculated on the basis of data given in ‘RBI: Handbook ofStatistics Relating to Indian Economy 2008-09’.
From the above table we can see that the Trade, Hotels,Transport and Communication is the most income and pricesensitive sub-sector. This result is consistent with the RBI’s studythat this sub-sector is most income- and price-sensitive.
The employment implications of the growth of service sectorcan not be directly studied since there are no data on theemployment in this sector. The NSSO provides the data on thebasis of the different rounds, expressed as share in per 1000workers. We used the data from these surveys as a proxy for theannual employment in service sector. Our reasoning is that if theshare of service sector increases, it indicates that there is a growthin employment in this sector relative to the rest of the economy. It isobserved that according to the NSSO data, employment in theservice sector increased at an annual growth rate of 0.79 percent.The employment elasticity of principal status in service sector isestimated at 0.101. In other words, a one percent increase in theoutput in the service sector results in 0.101 percent increase in theemployment. This employment elasticity is found to be statisticallysignificant. We present employment by different sub-sectors ofservices for selective years.
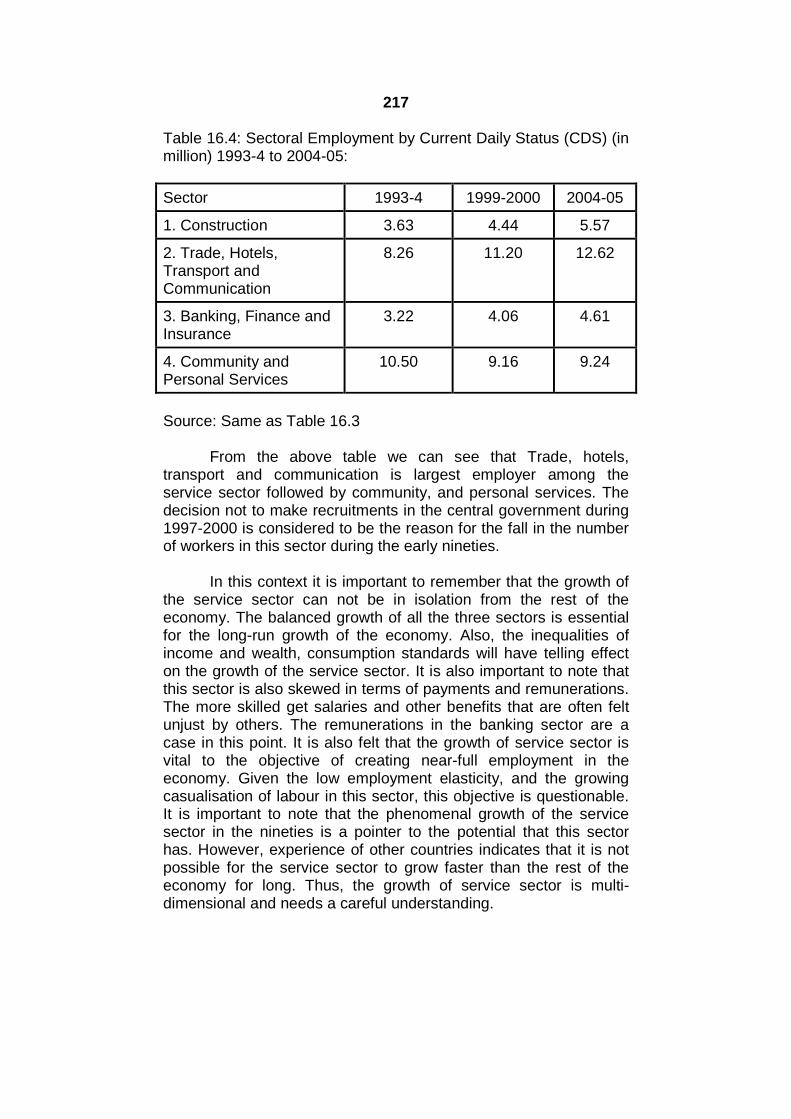
217
Table 16.4: Sectoral Employment by Current Daily Status (CDS) (inmillion) 1993-4 to 2004-05:
Sector 1993-4 1999-2000 2004-05
1. Construction 3.63 4.44 5.57
2. Trade, Hotels,Transport andCommunication
8.26 11.20 12.62
3. Banking, Finance andInsurance
3.22 4.06 4.61
4. Community andPersonal Services
10.50 9.16 9.24
Source: Same as Table 16.3
From the above table we can see that Trade, hotels,transport and communication is largest employer among theservice sector followed by community, and personal services. Thedecision not to make recruitments in the central government during1997-2000 is considered to be the reason for the fall in the numberof workers in this sector during the early nineties.
In this context it is important to remember that the growth ofthe service sector can not be in isolation from the rest of theeconomy. The balanced growth of all the three sectors is essentialfor the long-run growth of the economy. Also, the inequalities ofincome and wealth, consumption standards will have telling effecton the growth of the service sector. It is also important to note thatthis sector is also skewed in terms of payments and remunerations.The more skilled get salaries and other benefits that are often feltunjust by others. The remunerations in the banking sector are acase in this point. It is also felt that the growth of service sector isvital to the objective of creating near-full employment in theeconomy. Given the low employment elasticity, and the growingcasualisation of labour in this sector, this objective is questionable.It is important to note that the phenomenal growth of the servicesector in the nineties is a pointer to the potential that this sectorhas. However, experience of other countries indicates that it is notpossible for the service sector to grow faster than the rest of theeconomy for long. Thus, the growth of service sector is multi-dimensional and needs a careful understanding.

218
16.4 SUMMARY
1. The core objective of the Competition Act of 2002 is to promotethe competitive process in the Indian economy. The followingare the objectives of the Act:
a) To prevent practices that have a negative effect oncompetition;
b) To promote and sustain competition in the markets; andc) To protect the interests of the consumers and to ensure
freedom of trade.
2. Service sector refers to a) Construction, b) Trade, hotels,transport and communication, c) Finance, banking andinsurance, and d) Community and personal services. In otherwords, as the economy progresses, the share of this sector inthe national economy would be increasing. In case of India, thisis a clear indication to the structural changes that the economywitnessed since 1991.
3. It is important to remember that the growth of the service sectorcan not be in isolation from the rest of the economy. Thebalanced growth of all the three sectors is essential for the long-run growth of the economy.
16.5 QUESTIONS
1. What do you understand by monopoly power? Examine thedifferent ways in which it is defined in India.
2. What are the main features of Competition Act of 2002?
3. Examine the main differences between the MRTP Act and theCompetition Act.
4. What is the contribution of service sector to India’s nationalincome?
5. Examine the factors responsible for the growth of service sectorin India since 1991.

219
17Module 6
BANKING and MONETARY POLICYSINCE 1991
Unit Structure :
17.0 Objectives
17.1 Banking sector reforms
17.2 Progress of Commercial Banks Since 1991
17.3 Summary
17.4 Questions
17.0 OBJECTIVES
To understand the rationale of banking sector reformsintroduced in India in 1991 and 1998.
To understand the main instruments of banking sector reforms.
To understand the performance of the commercial banks afterthe reforms.
17.1 BANKING SECTOR REFORMS
The nationalisation of the 14 major commercial banks in1969 is a significant step in the planned development process ofthe economy. This culminated in the nationalisation of another sixmajor banks in 1980. The Public Sector Banks (PSBs), as theyhave come to be known, played an important role in the economicdevelopment of the economy by providing banking facilities inremote, un-banked and under-banked areas, extending creditfacilities to many marginalised sections of the community. However,the banking system itself was burdened by high defaults, high costof operations and low profitability. In 1991, the Reserve Bank ofIndia constituted a committee to look into the various issues relatedto the financial system and to make recommendations to improvethe efficiency and profitability of the banking sector. This committeeis known as the Committee on the Financial System or theNarasimham Committee. The committee recommended that the

220
financial system has to address the issue of profitability and anelement of competition shall be introduced into the system. TheCommittee observed that the branch regulations, pre-empting offunds under the SLR and CRR requirements have undermined theprofitability of the banking system. Therefore, it recommended thatthe branch expansion must be free from regulation and that theSLR and CRR must be reduced so that larger funds are availablefor lending at market rate to ensure the profitability of the system. Itfurther recommended the introduction of prudential norms forbanking sector to make it capable of facing the risks arising out ofthe changing nature of business with more banks now exposed tointernational risks. It recommended that the interest rates should bede-regularised to reflect the actual cost of funds. It proposed athree-tier banking system with SBI group and a few other banksoperating at the international level, banks operating at national leveland local area banks. It further recommended that the banks mustbe allowed to merge to ensure profitability. To maintain the assetquality, the Committee recommended measures to strengthen theregulatory framework regarding the non-performing assets (NPAs).It further recommended that new banks must be allowed to ensurecompetition and improved services. The Committee furthersuggested that the banks must be made to adopt informationtechnology (IT) to improve the quality of services.
In 1998, the Committee on Banking System Reforms(Chairman: M. Narasimham) submitted its report on the measuresrequired to improve the working of the banking system. The majorrecommendations of the committee are: The Committeerecommended that the banking system must be re-organised withthree or four banks at the national level, which should include theSBI group, and local banks including the RRBs. Abolition of prioritysector lending targets, merger of weaker banks, re-capitalisation ofthe banks, permission to the private sector banks, and privatisationof the public sector banks. Acting on these two reports, the RBI hasintroduced the following reform measures to improve theprofitability and efficiency of the banking system. The bankingreforms in India are guided by the domestic expertise and worldexperience. The reforms are based on non-disruptive progress andconsultative process by setting up mechanisms to improve thebenefits of efficiency and stability of the system.
1. The first measure in the banking reforms is the abolition of thebranch expansion regulations. The commercial banks are nowallowed to set up new branches wherever they want. In addition,the RBI allowed restructuring of the staff according to thebusiness of each branch. The RBI also allowed the opening upof ATM centres to facilitate easy banking.

221
2. The Narasimham Committee observed that the SLR and CRRregulations have led to large-scale pre-emption of bank fundsthat can otherwise be lent profitably and the RBI acting on thisrecommendation reduced the SLR to 25 per cent by 2004 from28.5 per cent in 1991. The incremental SLR was reduced form38.5 to 27 per cent during this time. The CRR was graduallyreduced from 15 per cent in 1991 to 5 per cent by October2004. Together, these measures are estimated to release` 48,000 crore for lending to other purposes.
3. Narasimham Committee recommended a Capital to RiskWeighted Assets Ratio (CRAR) of 8% for the banks. Thegovernment has made a total budget provision of Rs. 1,100crore for the banks to adjust the non-performing assets (NPAs)of the commercial banks. RBI prescribed a 9% CRAR to all thebanks. All the banks in India have achieved this target. As partof the Basel II Accord, RBI has prescribed a CRAR of 10% to beachieved by 2007. This has considerably reduced the risk forthe commercial banks. In Maarch 2008, the RBI issued newguidelines on CRAR norms. The risk weight foradvances/securities/overdraft/credit to the state governmentsshall be zero. In case of gold and jewellery, the market value isto be considered for fixing the risk. In all repo-like transactions,the risk needs to be adjusted upwards. Deposits can also beused as collaterals with zero risk and the explicit consent of thedepositor is required for this. Banks like the RRBs, where noCRAR norms are prescribed, are advised to have notionalcapital adequacy norms. Equities are not allowed as eligiblefinancial collaterals for CRAR requirements.
4. The RBI, acting on the recommendations of the NarasimhamCommittee asked the banks to reduce their NPAs and createdan Asset Reconstruction Fund (ARF) for this purpose. ThePSBs’
NPAs reduced from 11.1% in 1994 to 3.3% by 2006. Thepassing of Securitisation and Reconstruction of Financial Assetsand Enforcement of Security Interest Act of 2002 allows thebanks to take over NPAs of banks and financial institutions byasset management companies. This Debt Recovery Tribunals(DRTs) were set up for the speedy settlement of claims underthe NPAs.
5. The RBI abolished restrictions on interest rates on all depositsand loans, except the export credit, savings bank and the NRIdeposits. Interest rates on all, but the small loans up to Rs. 2lakh are free to be determined by the markets. This has helpedthe banking system to operate in a more competitiveenvironment. This measure removed the burden of cross-subsidisation on the banks and helped to improve theprofitability by removing ‘financial repression’.

222
6. The public sector banks (PSBs) were allowed to expand theircapital base through private equity participation. This helped tointroduce greater accountability and efficiency in the bankingsystem. In addition, this helped to restrict the governmentcontribution to recapitalisation to less than one per cent of theGDP and did not strain the central government resources.
7. By allowing 12 new private sector banks to be set up, FDI up to74% and reducing the central government share to 51% of thePSB capital, the RBI brought a greater degree ofcompetitiveness in the banking sector.
8. The consolidation of the banking sector was made possible byallowing reverse merger of development finance institutions withtheir commercial bank subsidiaries as in the case of ICICI andIDBI. The RBI has also issued guidelines on the merger ofcommercial banks to ensure their profitability and operationalefficiency.
9. The RBI has set up the Board for Financial Supervision (BSF) in1994 to provide direction on regulatory policies and supervisorypractices in an integrated manner. The Board for Regulationand Supervision of Payment and Settlements System (BPSS)looks after the regulation and supervision of settlements anddetermines the criteria for membership to these systems. Inorder to ensure efficient functioning of the banks, the priorapproval of RBI was made mandatory in all cases where 5% ormore shares of a banking company are acquired. In such cases,the RBI reserves the right to supersede the decision of theBoard of the concerned banking company. Know YourCustomer (KYC) provides the data-base for bank borrowers thatcan be used to determine creditworthiness of the customers.The Credit Information (Regulation) Act helped to shareinformation on borrowers and reduce spurious transactions. TheRBI issued instructions that all applicants for loans above Rs. 2lakh must be informed of the reasons when their loanapplications are rejected.
10.The RBI has improved transparency standards and disclosurestandards which provide for informing the public about all casesof penalty imposed by RBI on banks, directions issued onspecific matters including those arising out of inspection ofbanks. This, in light of private equity participation, helped toimprove the operational efficiency and reduced the cases ofcorruption in banks.
11.The RBI has made it mandatory for the banks to obtainacknowledgement from it for all transfers of shareholdings of 5%and more. Such significant shareholders are put through a ‘fitand proper’ test and this is applicable to directors and seniormanagers of banks. The directors of banks are now required tosign a covenant of role and responsibility. The listed banks are

223
also required to comply with the governance principles laiddown by SEBI. The RBI guidelines on the ownership of privatebanks help to improve efficiency as well as the diversifiedownership.
12.The RBI allowed the banks to lend up to 25% of their tier 2capital to other commercial banks. They are further allowed toinvest up to 5% of total NDTLs in the secondary market.
13. In order to ensure effective functioning of the banks, the RBIinitiated measures to promote computerisation. As a result,‘click banking’ replaced the old ‘queue banking’. Moreimportantly, banks could introduce electronic banking andprovide efficient services at lower costs and expand theirgeographical reach. The use of ATMs, e-banking and e-payments have greatly contributed to the expansion of bankingservices. Now, nearly 75 percent of the PSBs are using thesefacilities. The technological reach is observed to be higheramong the private sector and foreign banks.
14.The introduction of an effective set of rules, institutions andtechnology for the transfer of funds is the heart of profitable andefficient banking system. This is known as the payments andsettlement system. Under this, the RBI introduced the electronicfunds transfer (EFT), the real time gross settlement system(RTGS) to facilitate continuous processing and settlement offunds transfer; the negotiated dealing system (NDS) for thescreen-based trading in government securities; the centralisedfunds management system (CFMS) for providing back-officesupport and funds transfer.
15.The emergence of retail banking is the most importantdevelopment in the post-reform period. The RBI allowed banksto provide housing loans, auto finance and educational loans toexpand their business. Banks are now allowed to provideinsurance facilities as well. Loan syndication allows a group ofbanks to participate to provide funds for a single loan. Thishelps better supervision and diversification of risk. Most of theprivate sector banks are important players in this. In 2001, theClearing Corporation of India Limited (CCIL) was set up by theSBI and other banks to provide clearing and settlement facilitiesfor government securities and foreign exchange transactions.
The reforms of the commercial banking system have surelyimproved the profitability and efficiency. However, the reforms haveraised some important issues :
1. The commercial banks were found to be shying away fromsmall-scale industry and agricultural sector. The loans extendedto these sectors have fallen considerably in post-1991 period.

224
So much so, during 1991-2004, the commercial banks nevermet their target of 18% loans to agriculture. Thus banks seem tobe risk-averse. They are instead depositing their share of theseloans to RIDF accounts and the central government in March2005 issued special instructions to the commercial banks toconcentrate on providing the credit as per the credit policy. Eventhe PSBs seem to have been caught in this. According to R.A.Mazumdar, this risk-aversion is the greatest adverse effect ofreforms. The commercial banking system, which was nurturedsince 1969, based on the socio-economic realities of theeconomy, has been reduced to shambles following the reforms.The banking system is now accused of being guided by profitmotive only.
2. The commercial banks are investing the surplus funds releasedfrom the reductions in SLR and CRR in government bonds andhave not invested in the economy. The fall in the credit-depositratios in the 1990s reflects this tendency. Thus, the argumentthat the high SLR and CRR have pre-empted the investiblefunds does not seem to hold water.
3. The banking sector reforms have neglected the developmentalrole of the commercial banks in a country like India. They justcannot go by profit considerations alone. This is seen in the fallin the priority sector lending. Though the RBI rejected theNarasimham Committee’s recommendation of abolishing thepriority sector lending, it did not effectively ensure the properflow of funds to this sector after 1991.
4. Though the RBI reports that the profitability of PSBs improved, itdoes not say how this has happened. More importantly, theautonomy of banks needs careful designing since it can impingeon the nature of the banking system and the role it plays in adeveloping economy. In this context, the risk-aversion displayedby the banks since the initiation of the reforms should be bornein mind.
5. Allowing the commercial banks to invest in the secondarymarket can endanger the profitability of the banks since thestock markets are prone to fluctuations. The RBI seems to haveignored the earlier experiences of misutilisation of bank fundsfor speculative activities on the stock markets.
The real estate lending is also causing strain on the bankingsystem. It is sad fact that the banking sector reforms in India did notlearn from the experience of banks in Thailand and other EastAsian counties while allowing liberal credit to the reality sector.Fluctuations in property prices were one of the main reasons for therecent failure of so many large banks in the USA.

225
17.2 PROGRESS OF COMMERCIAL BANKS SINCE1991
Indian commercial banking sector has seen spectacularexpansion in number of branches, volume of deposits, creditcreated and other parameters. However, this progress was nowithout its problems. We shall now examine the impact of reformson the commercial banks.
The number of branches of increased from 60,220 in March1991 to 1,05,752 by March, 2013. This shows an impressiveperformance. However, the percentage of rural branches declinedfrom 58.5 to 37.2 percent of the total during this period. Thus, thereis a clear indication that the banks are now more focused on profitsand seem to have given up the objective of providing services inun-banked areas. The new private sector banks and foreign bankshave a clear urban and metropolitan orientation. As these banksincrease both in terms of number of branches and business, thesemi-urban and rural population may be deprived of the bankingservices.
The following table shows the progress of commercialbanking in India after 1991 in terms of the ownership by differentgroups.
Table 17.1: Number of Scheduled Commercial Banks in India byOwnership (1991-2012) :
Year 1991 2012
Scheduled Commercial Banks 104 84
State Bank Group 8 7
Nationalised Banks 20 19
Old Private Sector Banks 25 15
New Private Sector Banks 9 7
Foreign Banks 42 36
Source: RBI: Report on Trend and Progress of Banking in India(various issues).
The above table shows a decline in the number ofScheduled Commercial Banks (SCBs) declined after 1991. This isdue to the mergers of both the public sector and private sectorbanks to improve the operational efficiency.

226
The SCBs in India posted a healthy deposit growth with theintroduction of the economic reforms in 1991. The aggregatedeposits and credit by the SCBs during selected years are shown inTable 17.2.
Table 17.2: Deposits and Credit by SCBs during selected years(`. Cr.) :
Year End ofMarch,1991
End ofMarch,1995
End ofMarch,2001
End ofMarch,2006
End ofMarch,2009
End ofMarch,2012
AggregateDeposits
2,30,758 4,33,819 9,62,618 21,09,049 38,34,110 59,09,082
Total BankCredit
1,25,592 2,54,015 5,11,434 15,07,077 7,15,724 46,11,852
Credit-Deposit Ratio
54.5 58.5 53.1 71.5 72.4 78.0
Source: RBI: Handbook of Statistics relating to Indian Economy,2009.
The credit-deposit ratio is another important indicator of theefficiency of the banking sector, prior to the introduction of thereforms in the banking sector; most of the funds of the SCBs wereused by the government under the Statutory Liquidity Ratio (SLR)regulations. After 1998, this ratio improved with the freeing of fundsthat were earlier committed to SLR.
The net profits of the SCBs improved from `. 4,504 crore in1996-07 to `. 52,771 crore in 2008-09. The Public Sector Banks(PSBs) accounted for nearly half of the total profits. Table 17.3shows the profit ratios of different groups of SCBs during 1996-97and 2011-12.
Table 17.3: Net Profits to Total Advances Ratios of SCBs (1997-2012)
Bank Group March 31, 1997 March 31, 2012
Public Sector Banks 0.57 0.88
Nationalised Banks 0.41 0.88
SBI Group 0.41 0.89
Old Private Sector Banks 0.84 1.20
New Private Sector Banks 0.73 1.63
Foreign Banks 1.19 1.76
All Scheduled Commercial Banks 0.67 1.08
Source: RBI: Report on Trend and Progress of Banking in India(various issues).

227
From the above table we can see that the profits of theSCBs show a definite improvement after the introduction of theeconomic reforms and allowing the interest rates to move accordingto the market conditions. The most important fact to be noted is theimprovement in the profits of the PSBs. They nearly doubled acrossall the groups of SCBs.
An important indicator of the performance of a commercialbank is the net profit to the total assets. In this case, we observethat the profit ratio does not snow a clear cut upward trend acrossthe SCBs. Only the new private sector banks posted animprovement. The decline the net profits ratio during 2008-09 isattributable partly to the global slowdown in 2007 and 2008.Table17.4 shows the net profit to total assets ratios of the SCBs during1991-2012.
Table 17.4: Net Interest Income to Total Assets Ratio of SCBs inIndia (1992-2012) :
Year 1992 2002 2009 2012
Scheduled Commercial Banks 10.27 8.26 7.4 8.9
State Bank Group 3.8 8.62 7.0 9.5
Nationalised Banks 2.86 8.78 7.4 9.6
Old Private Sector Banks 5.7 9.36 8.1 9.5
New Private Sector Banks N.A. 8.56 8.9 10.5
Foreign Banks 11.61 8.26 6.8 9.5
Source: RBI: Report on Trend and Progress of Banking in India(various issues).
An important facet of the economic liberalisation isimprovement in the non performing assets (NPAs) of thecommercial banks. These loans hold up liquidity and hamper theability to generate credit. In this direction, the RBI initiatedmeasures like loan syndication and debt recovery tribunals (DRTs)to improve the asset quality of the SCBs. As a result of theseefforts, there is a significant improvement in the performance of thebanks in India. Table 17.5 shows the NPAs of the SCBs duringselected years. From the table we can that the NPAs as percentageof both total advances and total assets registered a decline during1995-96 and 2006-07. However, following the global financial crisisin 2007 and 2008, the NPAs registered a marginal increase innominal terms from ` 53,097 crore in 2005-06 to ` 56,435 croreand ` 68,973 crore in gross terms and to `. 24,734 crore and` 31,424 crore during 2007-08 and 2008-09. However, due to betterasset management by the commercial banks and largerprovisioning, the net NPAs as percent of net advances came down.

228
The NPA position of the new private banks and foreign banksworsened. This could possibly due to the fact that these bankscater to the clients in the corporate sector and in services sector.The PSBs performed relatively better with 16 percent increase intheir NPAs during 2007-09 compared to the doubling of the NPAsof the new private and foreign banks during this period.
Table 17.5: Gross and Net NPAs of Commercial Banks in India(1996-97 to 2011-12) (in ` crore)
Year 1996-97 2001-02 2005-06 2010-11
Type ofBank
GrossNPAs to
GrossAdvances
Net NPAsto NetAdvances
GrossNPAs toGrossAdvances
Net NPAsto NetAdvances
GrossNPAs toGrossAdvances
Net NPAsto NetAdvances
GrossNPAs toGrossAdvances
Net NPAsto NetAdvances
AllSCBs
47,300
(15.7)
22,340
(8.1)
70,861
(10.4)
35,554
(5.5)
51,097
(3.3)
81,543
(1.2)
97,922
(2.4)
41,813
(1.1)
PublicSectorBanks
(17.8) (9.2) (11.1) (5.8) (3.6) (1.3) (2.3) (1.1)
OldPrivateSectorBanks
(10.7) (6.6) (11.0) (5.8) (3.6) (1.3) (2.3) (1.1)
NewPrivateSectorBanks
(2.6) (2.0) (8.9) (4.9) (1.7) (0.8) (2.3) (0.6)
ForeignBanks
(4.3) (1.9) (5.4) (1.9) (0.96) (0.43) (2.5) (0.7)
Figures in the parentheses show the percentage values.
Source: Reserve Bank of India: Report on Trend and Progress ofBanking in India (various issues).
Another important indicator of a commercial bank’sperformance is the Risk-weighted Capital to Asset Ratio (RCAR).This is also popularly known as the capital adequacy ratio. Thisratio indicates the provisioning for assets of the commercial banksin terms of the risk of default specific to a particular asset of thebanking system. These are also known as prudential norms, theasset management of a commercial bank. The RBI has initiatedmeasures to improve the capital base of the commercial banks inIndia to prepare them adequately for the risk that is contingent onassets of a commercial bank in a globalising economy. As a part ofthis, the government took initiatives to recapitalise the PSBs. As aresult of these initiatives on the part of the RBI and government, theRACR of SCBs improved significantly. In 1995-96, 42 SCBsachieved a RACR of 10 percent or more and 33 banks had a RCAR

229
of 8 to 10 percent. The average of all SCBs was 8.7 percent in thatyear. By 2000-01, this ratio improved to an average of 11.1 percentfor all SCBs. Only 2 banks had an RCAR of less than 9 percent. 84of them achieved a capital adequacy ratio of more than 10 percentand 12 banks had between 8 to 10 percent.
The RBI observed in its Report for 2008-09 that, “onesignificant aspect is that unlike other countries where the adverseloop operated from the financial to real sector, in India the bankingsector has got an impact from the real sector. Secondly, the factthat so far, financial sector reforms have been calibrated with aprogressive integration into the world economy has paid us richdividends. A key consideration in the choice of pace andsequencing has been the management of volatility in financialmarkets and implications for the conduct of monetary operations.The nuanced approach to financial sector reform has served Indiawell with an accent on conscious gradualism in the implementationof coordinated and sequenced moves on several fronts. What havebeen ensured are appropriate safeguards to ensure stability, whiletaking account of the prevailing governance standards, riskmanagement systems and incentive frameworks in financialinstitutions in the country. Overall, these progressive but cautiouspolicies have contributed to efficiency of the financial system whilesustaining the growth momentum in an environment ofmacroeconomic and financial stability. The policy challenge is tocontinue to ensure financial stability in India during this period ofinternational financial turbulence, while achieving high growth withprice stability”.
Thus, after the introduction of the banking sector reforms in1991, the commercial banks in India were resilient enough to facethe global financial crises that were experienced in 1998, 2007 and2008.
17.3 SUMMARY
1. The nationalisation of the 14 major commercial banks in 1969 isa significant step in the planned development process of theeconomy. This culminated in the nationalisation of another sixmajor banks in 1980. The Public Sector Banks (PSBs), as theyhave come to be known, played an important role in theeconomic development of the economy by providing bankingfacilities in remote, un-banked and under-banked areas,extending credit facilities to many marginalised sections of thecommunity.
2. In 1991, the Reserve Bank of India constituted a committee tolook into the various issues related to the financial system andto make recommendations to improve the efficiency andprofitability of the banking sector. This committee is known as

230
the Committee on the Financial System or the NarasimhamCommittee.
3. In 1998, the Committee on Banking System Reforms(Chairman: M. Narasimham) submitted its report on themeasures required to improve the working of the bankingsystem.
4. After the introduction of the banking sector reforms in 1991, thecommercial banks in India were resilient enough to face theglobal financial crises that were experienced in 1998, 2007 and2008.
17.4 QUESTIONS
1. Examine the rationale of banking sector reforms in India.
2. What are the main instruments of banking sector reforms?
3. Explain the impact of banking sector reforms in India.
4. Examine the progress of commercial banking after the reformsin 1991.
231
18
RBI’s MONETARY POLICY
Unit Structure :
18.0 Objectives
18.1 Development Functions of the Reserve Bank of India
18.2 Reserve Bank of India’s Money Supply Measures
18.3 Inflation in India Since 1991
18.4 Recent Developments in Monetary Policy In India
18.5 Appraisal
18.6 Summary
18.7 Questions
18.0 OBJECTIVES
To understand the various functions of the Reserve Bank ofIndia.
To understand the different measures of money supply usedby the RBI.
To understand the causes and control of inflation in India since1991.
To understand the recent developments in the monetary policyin India.
18.1 DEVELOPMENT FUNCTIONS OF THE RESERVEBANK OF INDIA
The introduction of Five Year Plans in 1951 led to the RBI toadopt development banking. The following are the importantdevelopment function that the RBI adopted to create efficientmachinery for providing finance needed for economic development.It also created institutions that will ensure adequate flow of fundsfor different productive sectors of the economy.
1) Establishment of Financial Institutions: RBI was activelyinvolved in the setting up of development finance institutions likethe Industrial Finance Corporation of India (IFCI), IndustrialDevelopment Bank of India (IDBI), National Bank for Agricultureand Rural Development (NABARD), Unit Trust of India (UTI),
232
Small Industries Development Bank of India (SIDBI), StateFinance Corporations (SFCs) and Deposit InsuranceCorporation (DIC). These institutions played an active role inchannelising resources to flow into the productive sectors of theeconomy.
2) Supervision of Commercial Banks: The Reserve Bank of IndiaAct, 1934 and Banking Companies Act, 1949 give the RBIauthority on licensing and inspecting of commercial banksoperating in India. It is empowered to lay the guidelines forlending policies, amalgamation and mergers of weak banks. Itsought to restrict the detrimental control exercised by particulargroups of persons on banks. It also played an important role inthe consolidation of the State Bank of India group. It played anactive role in strengthening the co-operative credit system. Withthe introduction of the banking sector reforms, RBI sought topromote efficiency and competition in the banking sector. It hasalso introduced autonomy with accountability, effective riskmanagement systems, operational flexibility, and informationsystems. It campaigned effectively for the introduction ofprudential norms in the banking sector and improving theprofitability of the banks. India happens to be one of the fewLDCs to fully implement the Basle I norms on banking like theCRAR, bank capitalisation regulations. Due to the statutoryaudit and inspection system evolved by the RBI, Indian bankingsystem remained free from major crisis.
3) Expansion of Banking Services: RBI used its regulatoryauthority to ensure the geographical spread of the bankingservices. Branch expansion regulations ensured that the ruraleconomy is integrated with the national economy and credit ischannelised into the priority sectors. As the branch expansionregulations were found to be detrimental to the effectivefunctioning of the banks, the RBI relaxed these norms followingthe recommendations of the Narasimham Committee. It alsoliberalised the norms regarding the setting-up of ATMs.
4) Credit Policy Initiatives: The Reserve Bank played an active rolein promoting credit to the priority sectors. In addition tostipulating annual lending targets, it introduced the Lead BankScheme in 1969. For each district in the country credit targetswere set, beneficiaries identified for the provision of productivecredit to the needy. It also provided for concessional credit tothe exporters on both, pre- and post-shipment basis. The RBIplayed an important role in the setting-up of the Regional RuralBanks (RRBs). It provided liberal re-financing facilities inaddition to providing managerial assistance. Because of theseinitiatives, credit flows for agriculture, exports and small-scaleunits improved significantly. In 1971, meet the risk of default inpayments of interest and principal for commercial banks the RBIset-up the Credit Guarantee Corporation of India to. Despite the

233
Narasimham Committee’s recommendations to abandon thepriority sector lending targets, RBI continues with them.
5) Interest Policy: An important policy imperative in a developingcountry is to ensure adequate credit at reasonable interestrates. The differential interest rate (DRI) scheme became animportant policy plank of the RBI since 1969. This schemeprovided for concessional interest rates on priority sectoroperations. It also sought to regulate interest rate on depositsand lending operations of the commercial banks so that the costof borrowing to the government is kept at the minimum.However, starting in 1991, the Reserve Bank liberalised theinterest rates. Now RBI allows commercial banks to decide ontheir own deposit and lending rates. This greatly enhanced themarket efficiency in reflecting the relative risk of each asset.
18.2 RESERVE BANK OF INDIA’S MONEY SUPPLYMEASURES
The availability of money supply affects the level ofeconomic activity. If there is excess liquidity, it triggers inflationarypressures. Conversely, inadequate liquidity will cause a recession.Thus, traditionally central banks are given the monopoly over theissue of currency. The currency in circulation holds the key to thetotal money supply. Together with the commercial banks, thebanking system determines the total volume of money supply. Inorder to reflect the changing nature of the Indian economy, in 1998,the Dr. Y.V. Reddy Committee recommended the introduction ofnew measures of money supply and liquidity. They are as under:
1. Money Supply Measures: The Committee introduced threemeasures of money supply instead of the traditional four.
M0 = Reserve Money = Currency in circulation + Bankers’ Depositswith the Reserve Bank + Other Deposits with the ReserveBank.
NM1 = Currency with Public + Demand Deposits + Other Depositswith the Reserve Bank.
NM2 = M1 + Short-term Deposits of ResidentsNM3 = NM2 + Long-term Deposits of Residents + Call/Term
Lending by Financial Institutions.In addition to these, the RBI also introduced three conceptsof liquidity to ensure better monetary management. They areas under:
L1 = NM3 + Postal Deposits.L2 = L1 + Liabilities of Financial Institutions.L3 = Public Deposits with Non-Bank Finance Companies.
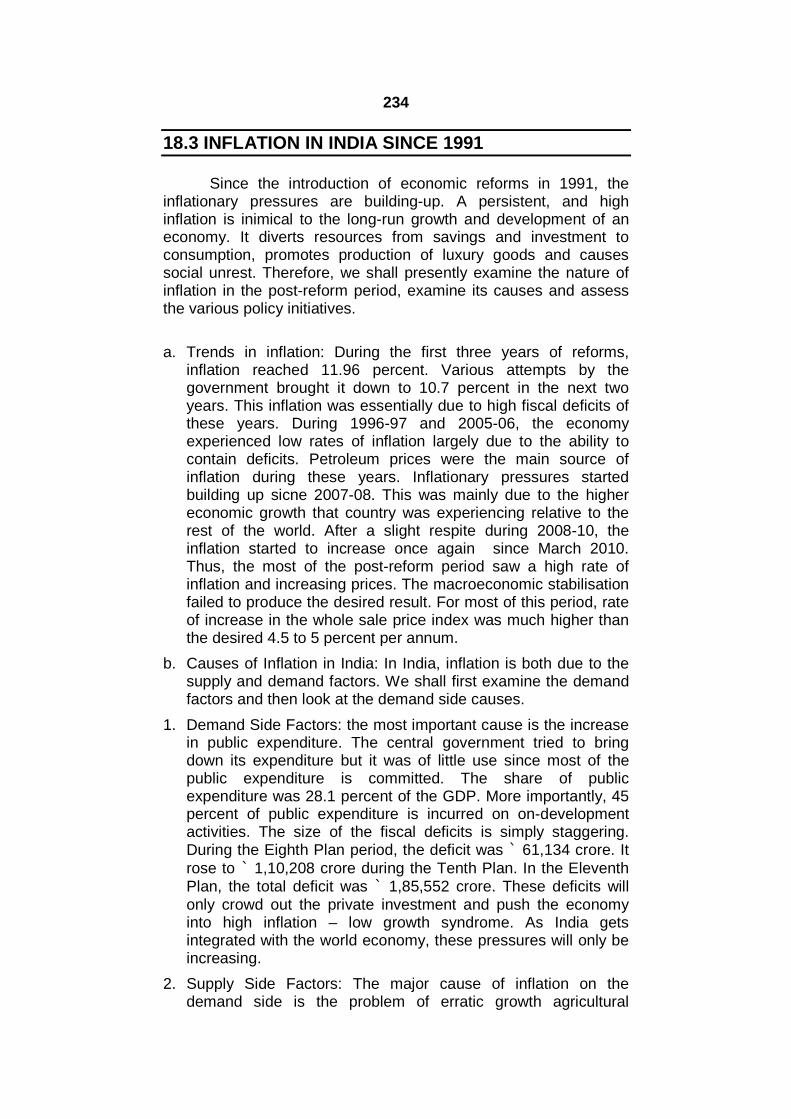
234
18.3 INFLATION IN INDIA SINCE 1991
Since the introduction of economic reforms in 1991, theinflationary pressures are building-up. A persistent, and highinflation is inimical to the long-run growth and development of aneconomy. It diverts resources from savings and investment toconsumption, promotes production of luxury goods and causessocial unrest. Therefore, we shall presently examine the nature ofinflation in the post-reform period, examine its causes and assessthe various policy initiatives.
a. Trends in inflation: During the first three years of reforms,inflation reached 11.96 percent. Various attempts by thegovernment brought it down to 10.7 percent in the next twoyears. This inflation was essentially due to high fiscal deficits ofthese years. During 1996-97 and 2005-06, the economyexperienced low rates of inflation largely due to the ability tocontain deficits. Petroleum prices were the main source ofinflation during these years. Inflationary pressures startedbuilding up sicne 2007-08. This was mainly due to the highereconomic growth that country was experiencing relative to therest of the world. After a slight respite during 2008-10, theinflation started to increase once again since March 2010.Thus, the most of the post-reform period saw a high rate ofinflation and increasing prices. The macroeconomic stabilisationfailed to produce the desired result. For most of this period, rateof increase in the whole sale price index was much higher thanthe desired 4.5 to 5 percent per annum.
b. Causes of Inflation in India: In India, inflation is both due to thesupply and demand factors. We shall first examine the demandfactors and then look at the demand side causes.
1. Demand Side Factors: the most important cause is the increasein public expenditure. The central government tried to bringdown its expenditure but it was of little use since most of thepublic expenditure is committed. The share of publicexpenditure was 28.1 percent of the GDP. More importantly, 45percent of public expenditure is incurred on on-developmentactivities. The size of the fiscal deficits is simply staggering.During the Eighth Plan period, the deficit was ` 61,134 crore. Itrose to ` 1,10,208 crore during the Tenth Plan. In the EleventhPlan, the total deficit was ` 1,85,552 crore. These deficits willonly crowd out the private investment and push the economyinto high inflation – low growth syndrome. As India getsintegrated with the world economy, these pressures will only beincreasing.
2. Supply Side Factors: The major cause of inflation on thedemand side is the problem of erratic growth agricultural

235
production. With increasing population food is the mostessential item. As agriculture fails, it causes food inflation. Since2005, increase in food prices is the major cause of inflation.Adequate attention should be paid to promote agriculture.Hoarding is another major cause of inflation. Since all essentialcommodities are in short supply, hoarding allows profiteering.The slow and erratic growth in industrial production is also acause of inflation. The problem of administered prices is alsohighlighted by economists. In India a variety of subsidies areprovided for some reason or other. This increases the burdenon the government and the producer is forced to limit his output.In such a situation all essential goods will be in short supply andadd to the pressure on prices.
c. Measures to Control Inflation: Government initiated a variety ofmeasures to promote price stability. We shall now examinesome of them:
1. The RBI has taken initiatives in this direction. It has taken astrong view of the inflationary pressures. During March 2010and October 2011, it revised the repo rate 13 times to containinflationary forces. It also raised the CRR from 4 to 8.5 percent.Continuous open market operations are also used along withsterilization of foreign currency inflows. The RBI is evenaccused of being overly concerned with the problem of inflationat the cost of growth. But, growth is not possible without pricestability as the essential pre-condition.
2. The government has been active in restricting hoarding ofessential commodities. It has taken measures to developstorage and warehousing facilities. Measures are also beingtaken to regulate trade in essential goods by restricting exports.
18.4 RECENT DEVELOPMENTS IN MONETARYPOLICY IN INDIA
Monetary policy refers to the deliberate decisions of thecentral bank about the availability of cash and the cost of credit toachieve a given set of objectives. Since its inception, the ReserveBank of India (RBI) focused on the objective of price stability. WithIndependence in 1947, and the beginning of planning in 1951, theobjectives of monetary policy became growth-oriented. In 1969,RBI adopted the objective of ‘growth with stability’. With theintroduction of economic reforms, there was a need to revise theobjectives of monetary policy and its instruments. This hassled tothe RBI adopting the objective of ‘controlled expansion’ in 1994.The monetary policy of RBI since 1991 focused on widening anddeepening of the financial and foreign exchange markets. As aresult of this, the RBI is in a better position to regulate the flow offunds more effectively. According to Dr. Y.V.Reddy, the most

236
important aspect of monetary policy after 1991 is the move from thedirect to the indirect methods of credit control.
a) Instruments of Monetary Policy since 1991 :
In order to achieve adequate expansion of money supply theRBI uses the NM3 as the target variable and the cash reserve ratio(CRR) as the intermediate variable. It also adopted a ‘multi-target’method of monetary management with attempts to control thevarious interest rates in the market. The following are the differentmonetary policy instruments used by the RBI to achieve itsobjectives:
1) Bank Rate: This is the rate at which the RBI rediscounts the billof exchange held by the commercial banks. Despite the efforts ofthe RBI, rediscounting is not a popular instrument in India. Thebank rate, which has been fixed at 6% since 2000, only serves as abench-mark lending rate.
2) Open Market Operations (OMO): This refers to the sate andpurchase of dated government securities in order to influence thefunds in the financial system. When there is a shortage of liquidity,the central bank will purchase the securities so that the financialinstitutions will get cash which can be used for lending. When thereis excess liquidity, the central bank will sell the securities andliquidity will flow from the financial system to the central bank. Withthe introduction of auctioning of securities in 1997, the open marketoperations have become more effective in regulating the liquidity.
3) Cash Reserve Ratios (CRR): This refers to the percentage ofbank deposits held in the form of cash with the central bank. After1991, the CRR has become an important policy instrument. TheRBI has been operating on CRR to influence the surplus fundsavailable with the SCBs. Following the financial sector reforms, theCRR was brought down to 6%. Between 2004 and October 2008,the RBI changed the CRR seven times in order to influence theliquidity of the
SCBs. Effective June 2004, the RBI is paying bank rate asthe interest on excess cash reserves of the commercial banks on afortnightly basis.
4) Liquidity Adjustment Facility (LAF): The most importantinstrument of monetary policy in India is the liquidity adjustmentfacility. This was introduced in 1998 following the NarasimhamCommittee on Banking Sector Reforms. In 2000 this facility wasredefined and further modified in 2004.The LAF is to regulate theavailability of funds with the SCBs and the money market interestrates. It is also an instrument for sterilization operations. Under this
237
arrangement, the RBI auctions the dated securities, the interestrate on these is known as the repo rate. When the RBI wants toinject liquidity into the system, it will buy the securities from thebanking system and this is known as the reverse repo operations.Since 2000, the inflow of foreign exchange through NRI and foreigninstitutional investors (FIIs) became destabilizing. More importantly,these funds should not be allowed to enter into the economybecause it will create excess liquidity and cause inflationarypressures. Since 2004, the RBI started auctioning the datedsecurities and holds the entire proceeds in a separate account ofthe central government. This scheme is known as the MarketStabilisation Scheme (MSS). In 2007-08, the RBI sterilised morethan Rs. 52,000 crore with the help of this scheme.
5) Abolition of Selective Credit Controls : Starting with 1991, theselective credit controls were slowly dismantled. In 1998, with thederegulation of the deposit rates except the savings bank and alllending rates, except for loans up to Rs. 2 lakh, all the creditoperations became market determined.
18.5 APPRAISAL
1. The RBI is considered to be one of the few successful centralbanks in promoting economic growth with reasonable pricestability. This is more so during the 1970s and 1990s when theprice stability was seriously undermined. India escaped the1997 Asian Contagion and the recent global slowdown.
2. From 1991, the RBI adopted multiple instruments targeting byensuring the orderly development of money market and foreignexchange market.
3. According to Balakrishnan, in the 1990s, the monetary policyfailed on its mandate. This is because, during the nineties, thereal PLR was increasing and as a result, the real private sectorinvestment has declined. Thus, the 1990s were ‘the decade ofmissing monetary policy’.
4. It is estimated that the sterilisation operations are causinginterest liabilities equal to about 1.2% of the net inflows and thisneeds to be lowered.
18.6 SUMMARY
1. The introduction of Five Year Plans in 1951 led to the RBI toadopt development banking to create efficient machinery forproviding finance needed for economic development. It alsocreated institutions that will ensure adequate flow of funds fordifferent productive sectors of the economy.
238
2. In 1998, the Dr. Y.V. Reddy Committee recommended threemeasures of money supply viz. NM1, NM2, NM3. In addition tothis, the RBI also introduced three concepts of liquidity toensure better monetary management such as, L1, L2, and L3.
3. Since the introduction of economic reforms in 1991, theinflationary pressures are building-up. A persistent, and highinflation is inimical to the long-run growth and development ofan economy. It diverts resources from savings and investmentto consumption, promotes production of luxury goods andcauses social unrest In India, inflation is both due to the supplyand demand factors. Government initiated a variety of measuresto promote price stability.
4. The monetary policy of RBI since 1991 focused on wideningand deepening of the financial and foreign exchange markets.The most important aspect of monetary policy after 1991 is themove from the direct to the indirect methods of credit control.
18.7 QUESTIONS
1. Explain the important development functions of the RBI.
2. Examine the various causes of inflation since 1991.
3. Briefly explain the different measures to contain inflation inIndia.
4. Examine the recent developments in RBI’s monetary policy.


