SWUTC/08/473700-00075-1 - Texas A&M University · PDF file16. Abstract Port drayage, defined...
40
Form DOT F 1700.7 (8-72) Reproduction of completed page authorized 1. Report No. SWUTC/08/473700-00075-1 2. Government Accession No. 3. Recipient's Catalog No. 4. Title and Subtitle Characteristics of Drayage Operations at the Port of Houston 5. Report Date September 2008 6. Performing Organization Code 7. Author(s) Robert Harrison, Nathan Hutson, Jason West, and Julie Wilke 8. Performing Organization Report No. Report 473700-00075 9. Performing Organization Name and Address Center for Transportation Research University of Texas at Austin 3208 Red River, Suite 200 Austin, Texas 78705-2650 10. Work Unit No. (TRAIS) 11. Contract or Grant No. DTRS99-G-0006 12. Sponsoring Agency Name and Address Southwest Region University Transportation Center Texas Transportation Institute Texas A&M University System College Station, Texas 77843-3135 13. Type of Report and Period Covered Technical Report 14. Sponsoring Agency Code 15. Supplementary Notes Supported by a grant from the U.S. Department of Transportation, University Transportation Centers Program 16. Abstract Port drayage, defined as a container truck pickup to or from a seaport terminal with both the trip origin and destination in the same urban area, is a critical yet comparatively understudied link in the intermodal supply chain. Because port dray trucks operate primarily in urban environments, they can have a significant impact on congestion and air quality. The primary goal of this study is to identify key dray industry characteristics at the Port of Houston Authority (POHA) to help planners prepare for increasing container volumes while maintaining profitability and mitigating societal costs. The report gives the results of interviews with dray managers and a survey of 103 port drivers at the Port of Houston Barbours Cut container terminal on demographics, working conditions, truck characteristics, route characteristics and port operations. The results of the study are then compared against the existing literature, most of which comes from the Los Angeles area. Substantial variation is shown in the age and mileage of trucks. While only a minority of drivers was unsatisfied with overall terminal efficiency, many had suggestions on ways in which efficiency could be improved. The industry is found to be relatively stable despite the increasing demands placed by high container growth rates which have created a shortage of drivers at some locations. Lastly, the report examines methods in which the dray fleet could be modernized through air quality improvement grants. 17. Key Words Drayage, Intermodal, Ports, Container Terminals, Dray Drivers 18. Distribution Statement No restrictions. This document is available to the public through NTIS: National Technical Information Service 5285 Port Royal Road Springfield, Virginia 22161 19. Security Classif.(of this report) Unclassified 20. Security Classif.(of this page) Unclassified 21. No. of Pages 40 22. Price Technical Report Documentation Page
Transcript of SWUTC/08/473700-00075-1 - Texas A&M University · PDF file16. Abstract Port drayage, defined...

Form DOT F 1700.7 (8-72) Reproduction of completed page authorized
1. Report No. SWUTC/08/473700-00075-1
2. Government Accession No.
3. Recipient's Catalog No.
4. Title and Subtitle Characteristics of Drayage Operations at the Port of Houston
5. Report Date September 2008 6. Performing Organization Code
7. Author(s) Robert Harrison, Nathan Hutson, Jason West, and Julie Wilke
8. Performing Organization Report No. Report 473700-00075
9. Performing Organization Name and Address Center for Transportation Research University of Texas at Austin 3208 Red River, Suite 200 Austin, Texas 78705-2650
10. Work Unit No. (TRAIS) 11. Contract or Grant No. DTRS99-G-0006
12. Sponsoring Agency Name and Address Southwest Region University Transportation Center Texas Transportation Institute Texas A&M University System College Station, Texas 77843-3135
13. Type of Report and Period Covered Technical Report 14. Sponsoring Agency Code
15. Supplementary Notes Supported by a grant from the U.S. Department of Transportation, University Transportation Centers Program 16. Abstract
Port drayage, defined as a container truck pickup to or from a seaport terminal with both the trip origin and destination in the same urban area, is a critical yet comparatively understudied link in the intermodal supply chain. Because port dray trucks operate primarily in urban environments, they can have a significant impact on congestion and air quality. The primary goal of this study is to identify key dray industry characteristics at the Port of Houston Authority (POHA) to help planners prepare for increasing container volumes while maintaining profitability and mitigating societal costs. The report gives the results of interviews with dray managers and a survey of 103 port drivers at the Port of Houston Barbours Cut container terminal on demographics, working conditions, truck characteristics, route characteristics and port operations. The results of the study are then compared against the existing literature, most of which comes from the Los Angeles area. Substantial variation is shown in the age and mileage of trucks. While only a minority of drivers was unsatisfied with overall terminal efficiency, many had suggestions on ways in which efficiency could be improved. The industry is found to be relatively stable despite the increasing demands placed by high container growth rates which have created a shortage of drivers at some locations. Lastly, the report examines methods in which the dray fleet could be modernized through air quality improvement grants.
17. Key Words Drayage, Intermodal, Ports, Container Terminals, Dray Drivers
18. Distribution Statement No restrictions. This document is available to the public through NTIS: National Technical Information Service 5285 Port Royal Road Springfield, Virginia 22161
19. Security Classif.(of this report) Unclassified
20. Security Classif.(of this page) Unclassified
21. No. of Pages 40
22. Price
Technical Report Documentation Page

ii
iii
CHARACTERISTICS OF DRAYAGE OPERATIONS AT THE PORT OF HOUSTON
by
Robert Harrison
Nathan Hutson
Jason West
Julie Wilke
Research Report SWUTC/08/473700-00075-1
Southwest Region University Transportation Center Center for Transportation Research
University of Texas at Austin Austin, Texas 78712
September 2008

iv

v
DISCLAIMER
The contents of this report reflect the views of the authors, who are responsible for the facts and the
accuracy of the information presented herein. This document is disseminated under the sponsorship of
the Department of Transportation, University Transportation Centers Program, in the interest of
information exchange. The U.S. Government assumes no liability for the contents or use thereof.
vi
ABSTRACT
Port drayage, defined as a truck pickup from or delivery to a seaport with both the trip origin and
destination in the same urban area, is a critical yet comparatively understudied link in the intermodal
supply chain. Because port dray trucks operate primarily in urban environments, they can have a
significant impact on congestion and air quality. The primary goal of this report is to identify dray industry
characteristics at the Port of Houston Authority (POHA) to help planners prepare for future increases in
container volumes while keeping in mind the twin needs of maintaining profitability and reducing societal
costs. The report discusses the results of interviews with dray managers and a survey of 103 dray drivers
at the Port of Houston Barbour’s Cut container terminal on driver demographics, working conditions, truck
characteristics, route characteristics and port operations. The results of the study are then compared
against the existing literature, most of which comes from the Los Angeles area. Substantial variation is
shown in the age and mileage of trucks. While only a minority of drivers was unsatisfied with overall
terminal efficiency, many had suggestions on ways in which efficiency could be improved. The industry in
Houston is found to be relatively stable despite high container growth rates which have created driver
shortages at some larger U.S. terminals. Lastly, the report examines methods in which the dray fleet in
Houston could be modernized through air quality improvement grants.

vii
ACKNOWLEDGMENTS
The authors recognize that support was provided by a grant from the U.S. Department of
Transportation, University Transportation Centers Program to the Southwest Region University
Transportation Center.
Support was also provided by TxDOT Project 0-5068 entitled, “Planning for Container Growth
Along the Houston Ship Channel and Other Texas Seaports.” The authors wish to recognize the help
provided by the Project Monitor, Dr. Nathan Huynh, who met several times with team members and
helped organize the Port of Houston, Barbours Cut terminal survey. Thanks are also due to the Port of
Houston dray industry that responded positively and constructively to the research team questions.
viii
EXECUTIVE SUMMARY
Port drayage, defined as a truck container pickup from or delivery to a seaport terminal with both
the trip origin and destination in the same urban area, is a critical yet comparatively understudied link in
the intermodal supply chain. Because port dray trucks operate primarily in urban environments, they can
have a significant impact on congestion and air quality. The primary goal of this report is to identify basic
dray industry characteristics at the Port of Houston Authority (POHA) terminal at Barbours Cut to help
planners prepare for growth in container volumes, while maintaining profitability and reducing societal
costs.
To achieve this goal, the research team began by consulting with dray company managers and
POHA officials to gain insights into the scope of the Port’s interaction with dray operators. Next, the
research team sought the input of dray drivers at the Port. Working with both dray company managers
and POHA officials, the team developed a twenty question survey covering a range of topics including
driver demographics, driver working conditions, truck and route characteristics, and port operations. The
survey was provided in both English and Spanish in a self-administered format with survey staff available
to answer questions that drivers may have about a particular question.
The researchers first conducted a pilot study on June 5th, 2006 at one of the largest drayage firms
in Houston with the permission of the firm’s management. The initial round of surveys generated 15 valid
responses and also allowed the researchers to interview the drivers to make sure they interpreted the
questions correctly in both the English and Spanish versions. Following success of the initial round of
surveys, the researchers proceeded to interview drivers at the port on June 6th, 2006 between the hours
of 9-12 AM and 2-4 PM, where 88 drivers were surveyed at Gates C1-C5 of the Barbour’s Cut terminal.
The results of the survey suggest that drayage operations at the Port of Houston are more stable
and working conditions more acceptable than that previously recorded in the literature. The survey
revealed that the average dray driver at the Port of Houston is older and more experienced than drivers at
the Ports of Los Angeles and Long Beach. Drivers also appear to work a high, but not overwhelming,
number of hours and though a majority of drivers are owner-operators, nearly all drivers are associated
with a trucking company. Somewhat surprisingly, this preliminary work indicated that driver turnover is
relatively modest and well below that reported in other trucking sectors, like truck load carriers. Port of
Houston dray drivers also drive newer vehicles than their counterparts at the Ports of LA/LB. Similar to
LA/LB and other ports across the country adjacent to large urban areas; congestion in Houston is a
concern for drivers that should be addressed in the near future. Even though current conditions in the
drayage industry appear favorable at the Port of Houston, continued attention should be paid to improving
efficiencies given the container volumes predicted in the near future.
ix
TABLE OF CONTENTS
Chapter 1 INTRODUCTION ...................................................................................... 1
Chapter 2 STUDY APPROACH ................................................................................ 2
Chapter 3 SURVEY RESULTS ................................................................................. 5
Driver Demographics ................................................................................ 5
Driver Working Conditions ........................................................................ 6
Truck Characteristics ................................................................................ 6
Route Characteristics ............................................................................... 8
Port Operations ......................................................................................... 9
Chapter 4 STRATEGIES FOR IMPROVING DRAY EFFICIENCY ......................... 10
Chapter 5 CONCLUSIONS ..................................................................................... 11
References ................................................................................................. 13
Appendix A PORT OF HOUSTON DRIVER SURVEY .............................................. 14
Appendix B ANNOTATED BIBLIOGRAPHY .............................................................. 17

x
LIST OF FIGURES
1. Vehicle Mileage ................................................................................................... 7
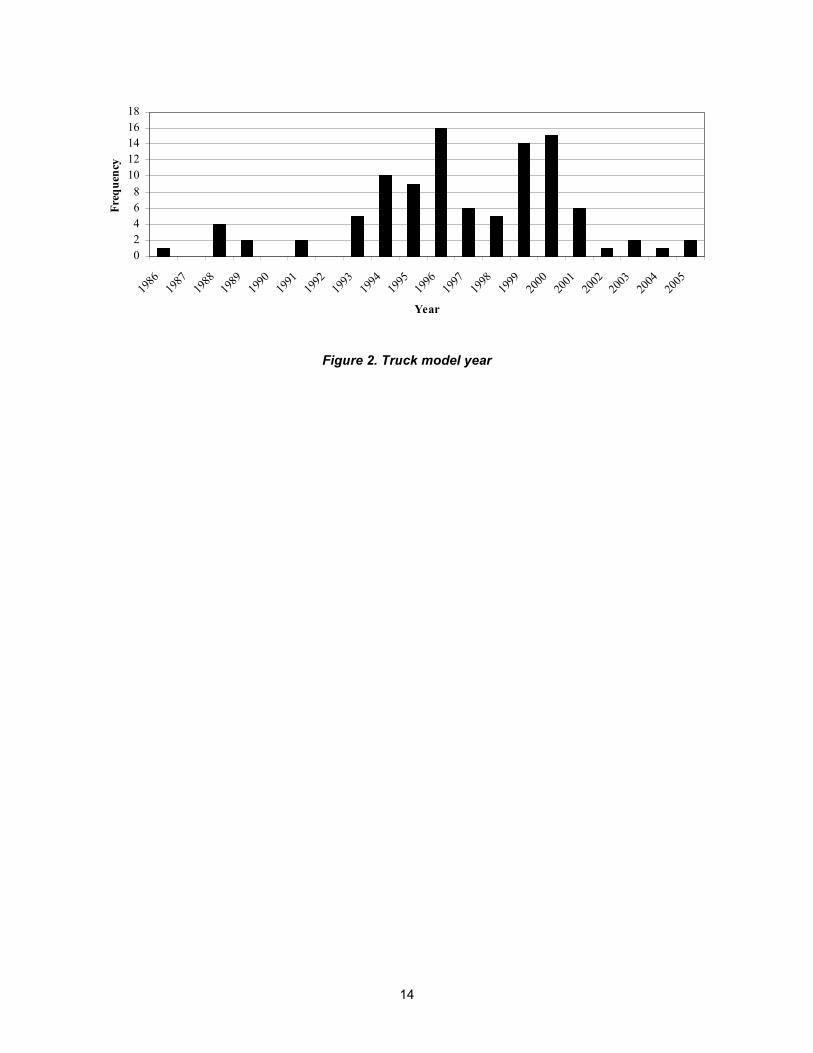
2. Truck Model Year .............................................................................................. 11
xi
LIST OF TABLES
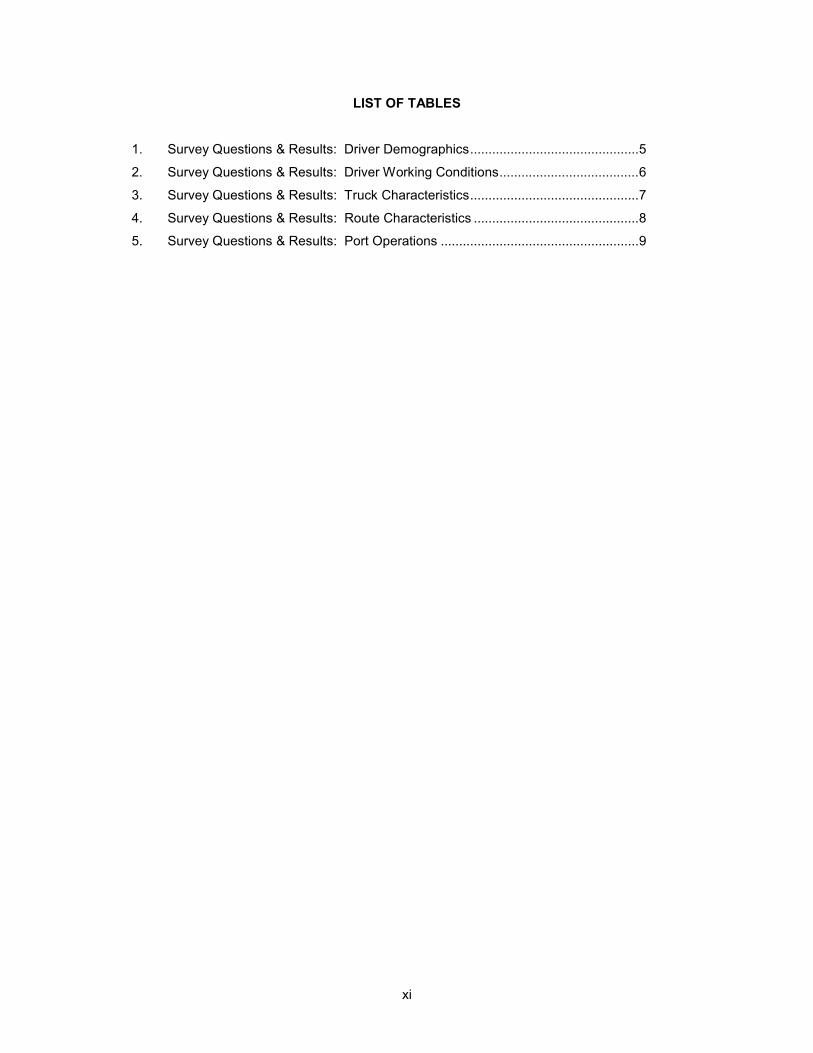
1. Survey Questions & Results: Driver Demographics .............................................. 5
2. Survey Questions & Results: Driver Working Conditions ...................................... 6
3. Survey Questions & Results: Truck Characteristics .............................................. 7
4. Survey Questions & Results: Route Characteristics ............................................. 8
5. Survey Questions & Results: Port Operations ...................................................... 9

xii

1
CHAPTER 1: INTRODUCTION
The growing importance of intermodal maritime trade to the U.S. economy has led logisticians to
more carefully examine all components of the intermodal supply chain. Port drayage, defined for the
purpose of this paper as a truck pickup from or delivery to a seaport with both the trip origin and
destination in the same urban area, is a critical yet comparatively understudied link. On the surface, dray
operations would seem to be a more technologically stagnant and therefore less interesting component of
marine intermodalism when compared with the rapid advances in ship, crane and rail technology. Yet,
while a major container port may operate with only a handful of crane operators, the same port will
require the labor of hundreds of dray drivers to run smoothly. Therefore, improving dray operations can
substantially improve the overall efficiency of a port.
Dray operations are discussed in the literature under a number of subcategories including cross
border trucking operations, deliveries to and from rail heads, and deliveries to and from ports. In its
unmarked form, the term drayage will most commonly refer to cross border deliveries. However, there are
a number of operational and economic characteristics of cross border drayage, such as the ability to
service vehicles within Mexico, which can make these operations functionally distinct from port drayage.
Therefore, this paper refers specifically to marine port terminal drayage and does not imply that the
findings described will be applicable to border operations.
Because port dray trucks operate primarily in urban environments, they have a proportionally
greater impact on urban congestion and air quality when compared with long haul trucks. As a case in
point, the goal of learning more about the composition of the drayage fleet in Los Angeles factored
heavily into the recently released San Pedro Bay Ports Clean Air Action Plan (1). Furthermore, from a
logistics perspective, the drayage component of the total intermodal cost can be quite significant.
Research by Morlock in the 1990s clearly demonstrated how high drayage costs have limited the
penetration of short haul rail intermodal (2). This was confirmed by a further study by Resor and Blaze
examining short haul rail competitiveness and the constraints imposed by terminal and drayage costs (3).
Congested conditions at port gates and other bottlenecks in the routes taken by dray drivers can drive up
costs and squeeze profitability. While the U.S. Maritime Administration has concluded that most major
ports in the United States still have “acceptable” landside access, container ports on average have more
serious landside access problems than non-container ports (4). A study by ICF Consulting suggested that
under current conditions, ports may not have sufficient motivation to improve gate access since the ports
themselves do not directly bear the costs of this delay (5). Drayage costs may also be driven up by
endogenous industry characteristics, such as suboptimal dispatching and inefficient allocation of capital.
The US currently has an efficient freight transportation system with logistics consuming only 9.5% of
Gross Domestic Product (GDP) in 2005. However, this figure has increased from a low of 8.6% in 2003
driven in part by higher fuel prices (6). With total U.S. demand for freight movement expected to double
by 2020, it is important to seek ways in which port drayage operations can be improved so that the cost of
drayage does not constrain the advance of intermodal freight transportation (7).
2
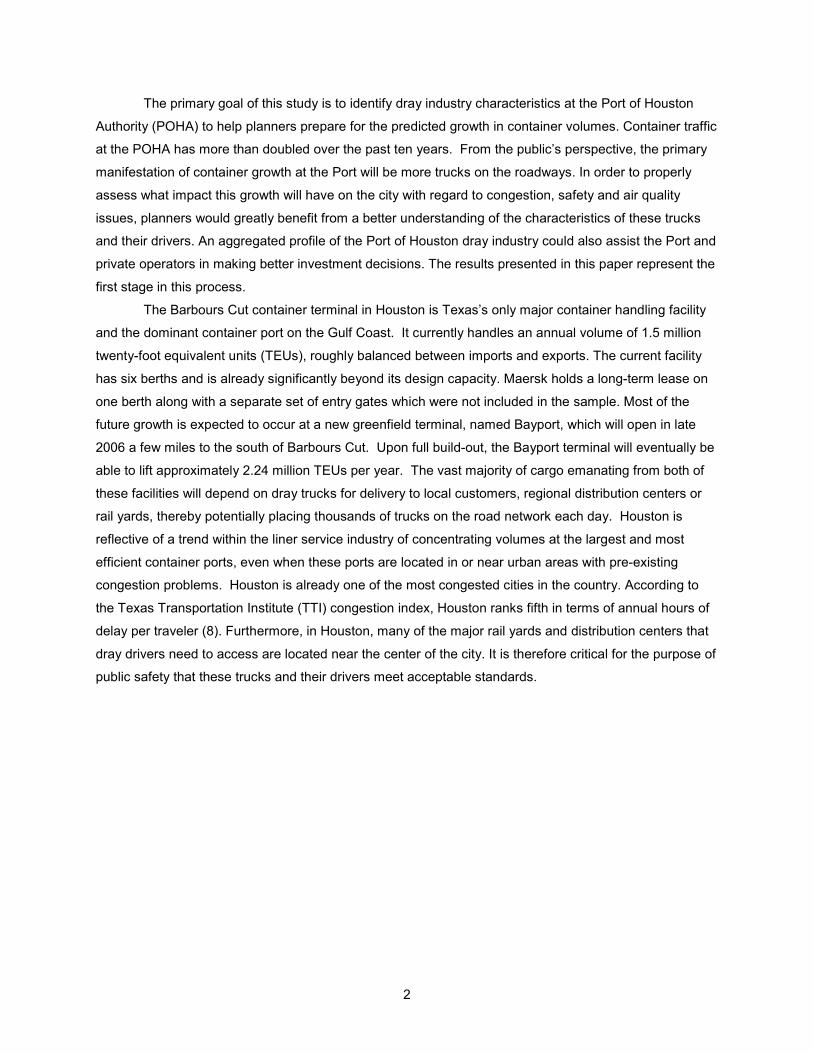
The primary goal of this study is to identify dray industry characteristics at the Port of Houston
Authority (POHA) to help planners prepare for the predicted growth in container volumes. Container traffic
at the POHA has more than doubled over the past ten years. From the public’s perspective, the primary
manifestation of container growth at the Port will be more trucks on the roadways. In order to properly
assess what impact this growth will have on the city with regard to congestion, safety and air quality
issues, planners would greatly benefit from a better understanding of the characteristics of these trucks
and their drivers. An aggregated profile of the Port of Houston dray industry could also assist the Port and
private operators in making better investment decisions. The results presented in this paper represent the
first stage in this process.
The Barbours Cut container terminal in Houston is Texas’s only major container handling facility
and the dominant container port on the Gulf Coast. It currently handles an annual volume of 1.5 million
twenty-foot equivalent units (TEUs), roughly balanced between imports and exports. The current facility
has six berths and is already significantly beyond its design capacity. Maersk holds a long-term lease on
one berth along with a separate set of entry gates which were not included in the sample. Most of the
future growth is expected to occur at a new greenfield terminal, named Bayport, which will open in late
2006 a few miles to the south of Barbours Cut. Upon full build-out, the Bayport terminal will eventually be
able to lift approximately 2.24 million TEUs per year. The vast majority of cargo emanating from both of
these facilities will depend on dray trucks for delivery to local customers, regional distribution centers or
rail yards, thereby potentially placing thousands of trucks on the road network each day. Houston is
reflective of a trend within the liner service industry of concentrating volumes at the largest and most
efficient container ports, even when these ports are located in or near urban areas with pre-existing
congestion problems. Houston is already one of the most congested cities in the country. According to
the Texas Transportation Institute (TTI) congestion index, Houston ranks fifth in terms of annual hours of
delay per traveler (8). Furthermore, in Houston, many of the major rail yards and distribution centers that
dray drivers need to access are located near the center of the city. It is therefore critical for the purpose of
public safety that these trucks and their drivers meet acceptable standards.

3
CHAPTER 2: STUDY APPROACH
While there have been relatively few comprehensive studies that focus on the drayage
component of intermodalism directly, port drayage is frequently mentioned in the industry press. For this
reason, a body of conventional wisdom has evolved regarding the status and characteristics of port dray
drivers and their vehicles. For example, analysts such as Prince have argued that drivers who are owner-
operators face a significantly lower earning potential than drivers who are company drivers due in large
part to the lack of market power (9). Prince describes the trucking industry as analogous to a pyramid
with unionized company drivers at the apex and container drayage owner-operators at the very bottom,
usually making around $6/hour after expenses are taken out. Obviously, if the container drayage industry
is this marginal, shippers can not be confident that they will be able to attract sufficient numbers of
experienced operators in times of rising demand. Other writers have referenced the purported
deteriorated condition of dray trucks or driver inexperience as consistent problems plaguing the industry.
At present, a disproportionate share of the literature on port container drayage comes from the Los
Angeles and Long Beach (LA/LB) areas. While Los Angeles and Long Beach operations are important for
international trade and the leader in showcasing new technologies such as PierPass, Cold Ironing1, and
the Alameda Corridor, researchers must be cautious in applying the characteristics of LA/LB to the rest of
the nation. In other words, not every trend encountered by LA/LB will be reflected in other large container
ports around the country. Research from regional container ports in the 1-2 million TEU range such as
Houston, Savannah, Tacoma or Norfolk may be more useful in elucidating relevant drayage issues for
ports of this size and also for ports in the 100,000 – 1 million TEU range that expect rapid growth in the
future.
The research team began the part of the study discussed in this report by interviewing officials at
the Port of Houston Barbours Cut terminal to learn about the scope of the Port’s interactions with dray
drivers. Administrators at Barbours Cut keep detailed records on truck turn-times from the time the truck
enters the gate until the time it leaves. The port uses this data to demonstrate the general level of
customer service it is providing drivers. Truck-turn times, however, do not capture the driver’s entire
experience at the port because they do not show how long a driver waited prior to entering the gates. The
port provided researchers with a list of firms that are registered to do business at the port. As of January
2006, there were 583 truck companies registered as drayage operators by the Port of Houston. Several
of these firms were contacted by the researchers for phone and in person interviews.
From interviews with local drayage firm managers, the researchers learned that the port drayage
industry in the Houston area in 2006 could generally be described as healthy. There is currently a strong
demand for drivers with several companies indicating they have been able to raise driver rates in the last
three years after long periods of stagnation. One informant stated that many of his newer drivers had
1 Cold Ironing is a naval term referring to the main engines being shut down. Ship power is provided by electricity supplied by the terminal while the ship is berthed.

4
previously worked at the Port of Los Angeles and Long Beach but had moved to Houston to avoid the
gate congestion that was inhibiting their profitability. He had even taken to advertising in Los Angeles
newspapers to recruit more LA drivers.
Most firms have also enacted fuel surcharges in the last two years. The net impact of higher fuel
costs on driver profitability is varied, with some drayage managers reporting that truckers are actually able
to earn higher profits due to surcharges and others reporting that the surcharges only partially
compensate the drivers for higher costs. Dray drivers who work for firms such as these typically own their
own truck but depend on the firm to organize deliveries and dispatch. While the ultimate responsibility for
the truck lies with the owner-operator, firms have a strong incentive to discourage their drivers from using
trucks which are unreliable or safe for reasons of company reputation and potential liability. Some firms
also reported that they place a maximum age limit on trucks that their owner operators can drive.
Despite the prevalence of firms that aggregate drivers under definite companies, the port drayage
industry is still more decentralized than most other types of transportation workers. According to the
Teamsters, 80% of all port drivers nationwide are non-unionized owner-operators (10). In this
environment, there is no substitute for speaking to drivers directly.
One recent analysis that took this direct approach was a study conducted on drayage at the Port
of LA/LB by Monaco and Grobar. This extensive survey included 36 questions on topics ranging from
rates of pay, demographic characteristics and safety practices (11). The researchers collected 175
surveys which the drivers completed while they waited to enter the Port gates. Monaco and Grobar found
that most drivers are able to earn acceptable annual salaries, but do so by working exceptionally long
hours under difficult conditions. On average, dray drivers at these Ports reported that they spent 48
percent of their total trip time waiting to get in and out of the port (10).
The landside congestion levels at the Port of Houston reflect those of other US terminals
operating in the 1-2 million TEU range and do not approach the levels of Los Angeles and Long Beach
terminals. Firms that were interviewed generally reported that wait times at the port gates have actually
decreased in recent years thanks to improved customer service despite the fact that TEU volumes have
soared during this period. It was impossible to verify these reports scientifically due to an absence of
historical data. Several managers reported that bottlenecks at the port gates in which drivers need an
hour or more to enter the facility do still occur on occasion.
Given the relative lack of long lines at the port entrance gates, the researchers could not survey
drivers as they idled outside the gate and therefore sought another opportunity when the drivers would
have sufficient downtime. Port of Houston Authority (POHA) staff suggested that drivers may have a small
window of time (approximately 10 minutes) after they had pulled past the gate while waiting for their
paperwork to be completed. With these constraints in mind, the researchers designed a survey that would
be less extensive than the survey administered at the Ports of LA/LB but still capture the most critical
data. As a trial run, the researchers conducted an initial round of surveys on June 5th, 2006 at one of the
largest drayage firms in Houston with the permission of the firm management. This initial round of surveys

5
generated 15 valid responses and also allowed the researchers to interview the drivers to make sure they
interpreted the questions correctly for both the English and Spanish versions. Following success of the
initial round of surveys, the researchers proceeded to interview drivers at the port on the following day,
June 6th. Between the hours of 9-12 AM and 2-4 PM, 88 drivers were surveyed at Gates C1-C5 of the
Barbours Cut terminal.

6

7
CHAPTER 3: SURVEY RESULTS
The Port of Houston driver survey consisted of twenty questions covering a range of topics
including driver demographics, driver working conditions, truck and route characteristics, and port
operations. The survey was provided in both English and Spanish in a self-administered format with
surveyors available to answer questions that drivers may have about a particular question. The survey
produced 103 valid results and had a response rate of 87%. In total, 39 of the 103 respondents chose to
complete the survey in Spanish (37%). Survey questions and driver responses are given in Appendix A.
DRIVER DEMOGRAPHICS
The first section of the survey asked drivers questions listed in Table 1 about their age,
education, and years of experience. Most drivers were found to be between 35 and 44 years old. The age
profile of the drivers is consistent with the results found at the Ports of LA/LB and likely strengthens the
hypothesis that middle age drivers will be comparatively more attracted to intracity delivery jobs because
they can spend more nights at home. Monaco and Grobar found that the mean age of dray drivers
operating at the Ports of LA/LB was 40.4 with 10% of drivers 30 or younger and another 10% 52 or older
(1). With regard to educational attainment, the Port of Houston survey found that a relatively small
percentage (16%) of drivers did not have high school equivalency, while one third (34%) reported having
some college training. This is again consistent with Monaco and Grobar’s findings at the Ports of LA/LB,
where 17.4% of respondents did not have a high school degree and a combined 29% had either a
vocational or technical degree, associates, or some college.
Dray drivers at the Port of Houston have worked in the trucking industry for an average of 12
years. On the whole, drivers tend to be highly experienced with the vast majority drivers having more than
six years of experience (80%). This suggests that in Houston the port dray profession cannot easily be
described as a transitory profession for drivers who are simply trying to enter a more lucrative level of the
trucking industry.
TABLE 1. SURVEY QUESTIONS AND RESULTS: DRIVER DEMOGRAPHICS
Question, (Number of responses) Category Result What is your age? (103) 24 and under 2 25-34 23 35-44 48 45-54 26 55 and over 3 What is the highest educational level that you have completed? (102) Less than HS
HS degree of GED 16 51
Some College 30 College Degree 5 How many years have you worked as a truck driver? (103) Mean
Median 12 10

8
DRIVER WORKING CONDITIONS
The next set of questions in the survey asked drivers about the number of hours worked per day
and per week; health insurance coverage, truck ownership, and membership in a trucking company (see
Table 2). In the context of a drayage operation, a trucking company will usually mean a dispatching firm.
The survey found that, on average, drivers work 10 hour days and 50-55 hour weeks. Intracity driver
hours-of-service are limited by Texas law to no more than 12 per day. In total, 17% of drivers stated that
they worked exactly 12 hours per day. Five drivers reported working over 12 hours per day.
TABLE 2. SURVEY QUESTIONS AND RESULTS: DRIVER WORKING CONDITIONS
Question, (Number of responses) Category Result How many hours do you work per day? (95) Mean Median 10.2
10 How many hours do you work per week? (76) Mean Median 54.5
54.5 Do you own your own truck? (102) Yes 78 No 24 Do you belong to a trucking company? (98) Yes
No 88 10
Do you have health insurance? (102) Yes 34 No 68
Despite the fact that most drivers were middle-aged men working in a relatively high-risk
profession, only a third (33%) had health insurance. The majority (76%) owned their own truck, although
the vast majority of the drivers (90%) reported that they belonged to a trucking firm. This is an interesting
finding given that port dray drivers are typically assumed to be “independent” owner-operators. While it is
technically possible for a driver to be a one-man shop, most drivers apparently find it more beneficial to
belong to a firm. A firm can serve a number of important functions that can benefit both the drivers and
the port. For example, a firm can help its drivers engage in at least a modest amount of collective
bargaining while a fully independent driver is forced to be a pure price-taker. Furthermore, firms can use
their influence to press the port or the surrounding urban area to take steps to improve efficiency. As an
example, at the Port of Houston a group of dray firms pooled their resources to hire off-duty police officers
to speed operations at a four way stop near the port that had become a bottleneck. After the port saw the
positive impact of this change, it agreed to finance a portion of the cost. As mentioned previously, firms
can also help planners by discouraging the use of older or less safe trucks.
TRUCK CHARACTERISTICS
Given that most drivers purchase their own vehicle, the research team was interested in learning
more about the profile of vehicles dray drivers selected. Thus, the survey asked questions shown in
Table 3 about the make, age, and mileage of the trucks that are being used to conduct dray operations at
the port. Generally speaking, the vehicles used for container drayage at the Port of Houston are not
substantially different in make from the long-haul fleet comprised of Class 8 trucks. Freightliner held a
9
substantial percentage of the total market, followed by KW, International, Volvo and Peterbilt. Due to the
fact most dray drivers buy used vehicles, the vehicles they purchase are often tailored to suit over the
highway hauls rather than intracity deliveries. For example, the majority of drivers were observed to have
trucks with sleeper cabins which in this context would create dead weight. Officials at the port of Los
Angeles and Long Beach have also reported the prevalence of sleeper cabins amongst the drayage fleet
(1).
TABLE 3. SURVEY QUESTIONS AND RESULTS: TRUCK CHARACTERISTICS
Question, (Number of responses) Category Result What is the make of your truck? (97) Freightliner
International KW Other
52 13 15 13
What is the year of your truck? (101) Mean 1997 How many miles are currently on your vehicle? (93) Mean
Median 637,115 724,456
Roughly, how many miles did you driver your truck last year? (69) Mean Median
123,000 60,000
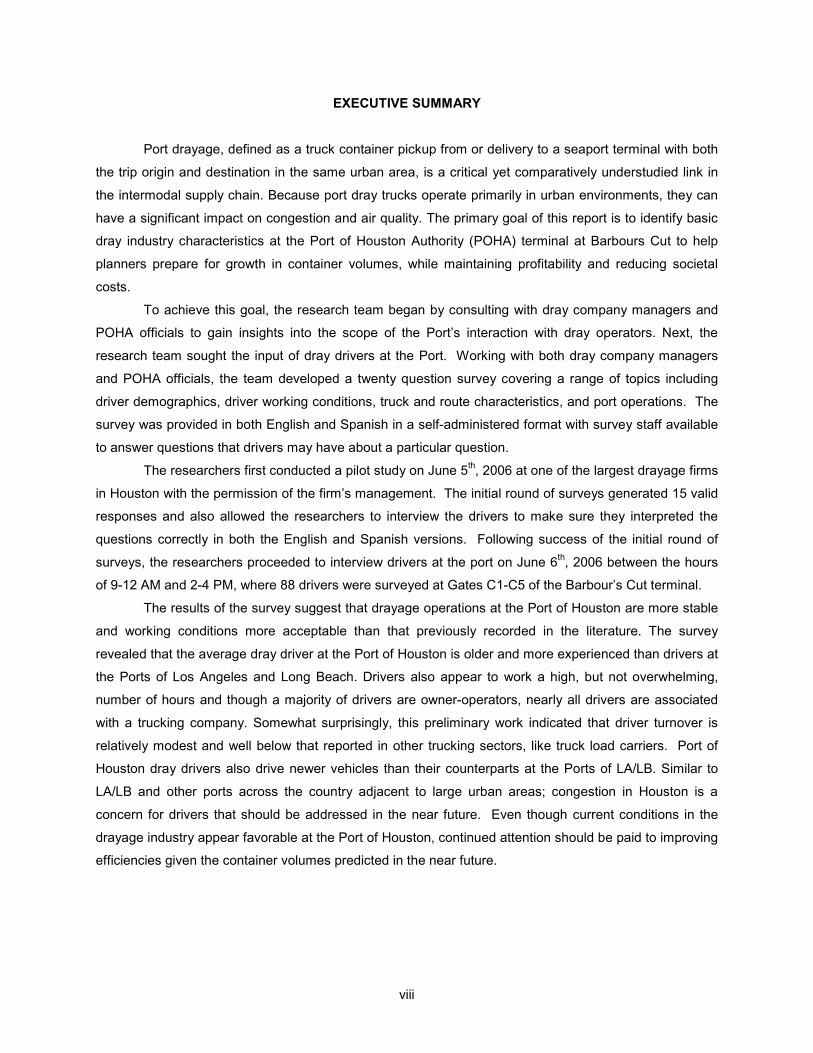
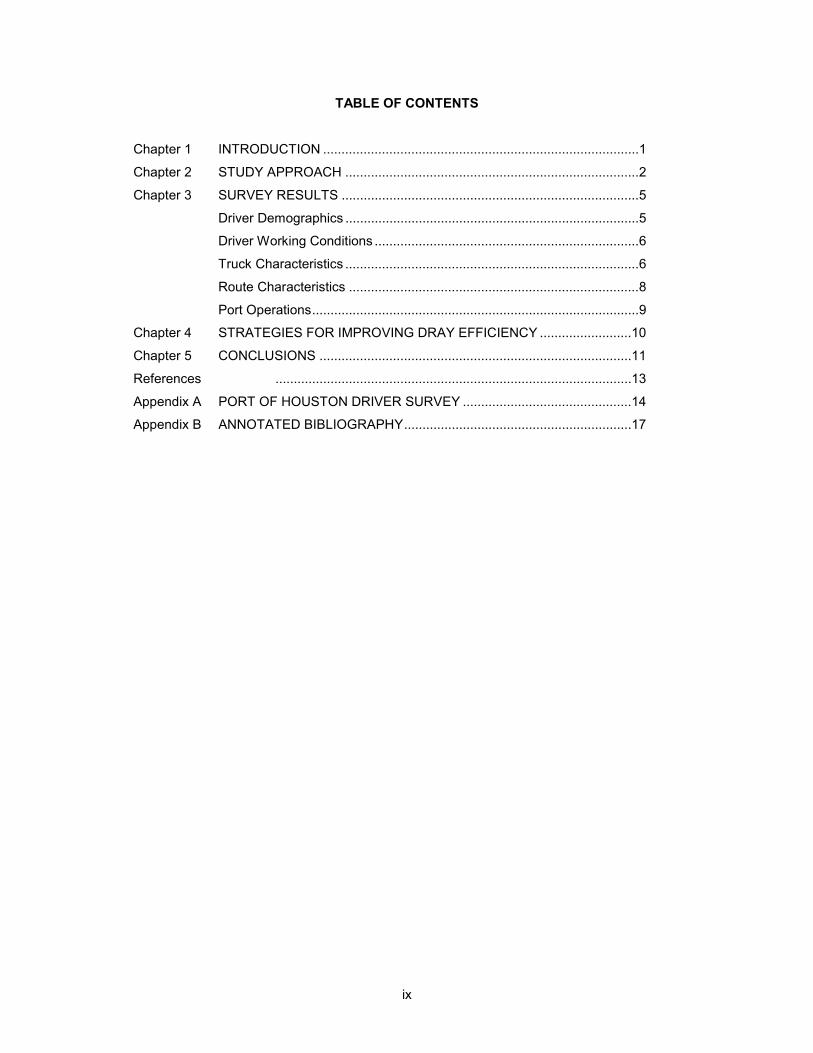
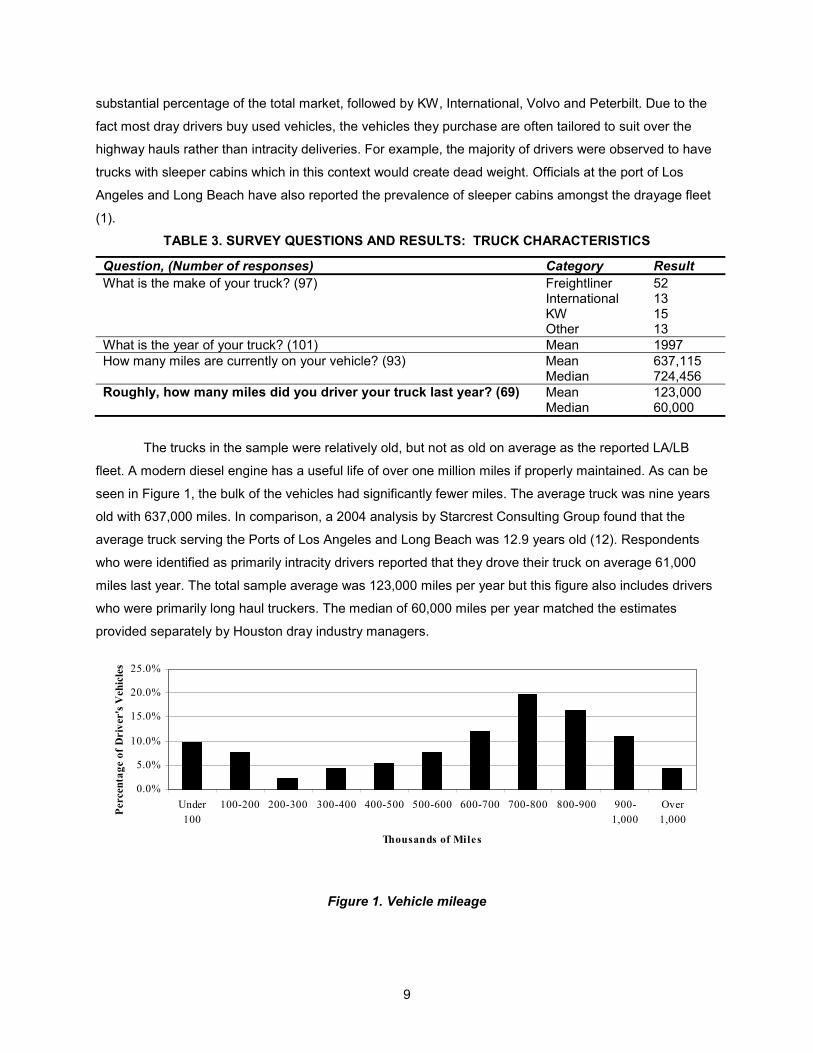
The trucks in the sample were relatively old, but not as old on average as the reported LA/LB
fleet. A modern diesel engine has a useful life of over one million miles if properly maintained. As can be
seen in Figure 1, the bulk of the vehicles had significantly fewer miles. The average truck was nine years
old with 637,000 miles. In comparison, a 2004 analysis by Starcrest Consulting Group found that the
average truck serving the Ports of Los Angeles and Long Beach was 12.9 years old (12). Respondents
who were identified as primarily intracity drivers reported that they drove their truck on average 61,000
miles last year. The total sample average was 123,000 miles per year but this figure also includes drivers
who were primarily long haul truckers. The median of 60,000 miles per year matched the estimates
provided separately by Houston dray industry managers.
0.0%
5.0%
10.0%
15.0%
20.0%
25.0%
Under100
100-200 200-300 300-400 400-500 500-600 600-700 700-800 800-900 900-1,000
Over1,000
Thousands of Miles
Perc
enta
ge o
f Dri
ver'
s Veh
icle
s
Figure 1. Vehicle mileage

10
ROUTE CHARACTERISTICS
Increasing congestion levels threaten to constrain the productivity of dray haulers. While long
haul truckers can often plan their trips to avoid the worst urban congestion, dray haulers must make
deliveries during standard business hours since their schedules are tied to the port operating hours. With
this concern in mind, the survey asked drivers about the average length of their hauls, the number of trips
to the port they were able to make in a typical day and the frequency with which trucks carrying inbound
containers left without return cargo (bobtailing) as seen in Table 4. Since drivers are paid per delivery, the
number of port trips per day is highly salient in determining profitability. The survey also asked where
drivers run into the worst traffic along their routes, and most frequent cause of their delay. According to
the port drivers, the median dray distance, defined as one haul from either a pickup point to the port or
from the port to a delivery point, was 60 miles. The mean of 199 miles is again skewed by data from
intercity drivers. If the subset of drivers who reported an average dray distance of 100 miles or less are
analyzed separately, the average dray haul was 48 miles and the average number of trips to the port per
day was 3.2. In the Houston metro area, drivers run into the worst traffic along Barbours Cut Boulevard
leading to the port complex, followed by Interstate10 and Loop 610 North. According to the port drivers,
the top three causes of traffic delay from first to third were construction zones, an inadequate number of
lanes, and accidents/stalled vehicles. The drivers were queried as to their use of toll lanes due the fact
that Houston has several toll facilities that provide close substitutes for free alternative routes and would
likely be used more frequently if congestion became more burdensome.
TABLE 4. SURVEY QUESTIONS AND RESULTS: ROUTE CHARACTERISTICS
Question, (Number of Responses) Category Result What is the average length of each drayage haul (from either a pickup point to the port or from the port to a delivery point)? (96)
Mean Median
199 60
How many trips do you make to Barbours Cut Terminal (gates C1-C5) in a typical day? (103)
Mean 2.6
On this trip, will you leave the terminal empty or loaded? (81) Empty Loaded
42 39
Where do you run into the worst traffic along your route? (82) Multiple responses What is the primary cause of your traffic delay? Freeway
interchange Access ramp Inadequate # of lanes Incidents Construction zone Other
12 3 25 22 35 14
How often do you use a toll facility for your dray hauls? (97) Daily Once a week 2-3 times a week Rarely or never
8 9 10 70

11
PORT OPERATIONS
Finally, the research team wanted to gather drivers’ opinions as to what actions the port could
take to improve the efficiency of the drayage system at its Barbours Cut terminal. Port drivers were asked
to identify the length of the wait times entering the Barbour’s Cut terminal gates operated by the POHA.
Additionally, port drivers selected their satisfaction level with port efficiency from a list of options and then
identified what could be done to improve port efficiency. Drivers entering the C1-C5 gates reported that
they experienced wait times of 70 minutes on average. On their most recent trip to the port, (Tuesday,
June 5th when the surveys were conducted) drivers reported waiting an average of 27 minutes. Self-
reported wait times such as these do not carry the same level of accuracy as would a direct observational
study conducted over a period of randomly selected sampling periods. What can be concluded from the
data is that the selected sample period represented a below average wait time. This is likely due to the
fact that there was no ship in dock on the day of the survey. Given the fact that export containers are
required to be dropped off significantly in advance of a ship’s departure, this factor may not have had a
significant effect on the sample. Still, POHA officials remarked that the survey day had been a relatively
slow day at the port. Drivers identified the top three actions that could be taken to improve port efficiency
as increasing the number of booths at terminal entrances, offering extended port operating hours, and
improving terminal yard operations.
TABLE 5. SURVEY QUESTIONS AND RESULTS: PORT OPERATIONS
Question, (Number of Responses) Category Result How long is your average wait time entering Barbours Cut Terminal (gates C1-C5) in minutes? (88)
Mean 70
How long was your wait time entering Barbours Cut Terminal (gates C1-C5) in minutes on this trip? (88)
Mean 27
How pleased are you with the efficiency of Barbours Cut Terminal (gates C1-C5)? (94)
Very Satisfied Satisfied Neutral Unsatisfied
5 17 29 43
What would be the most effective action to improve efficiency of Barbours Cut Terminal (gates C1-C5)?
Offer extended port operating hours Provide scheduled container pick-up times Increase the number of booths at terminal entrances Improve terminal yard operations Streamline driver and ship carrier operations Other
30 10 38 29 9 1

12
13
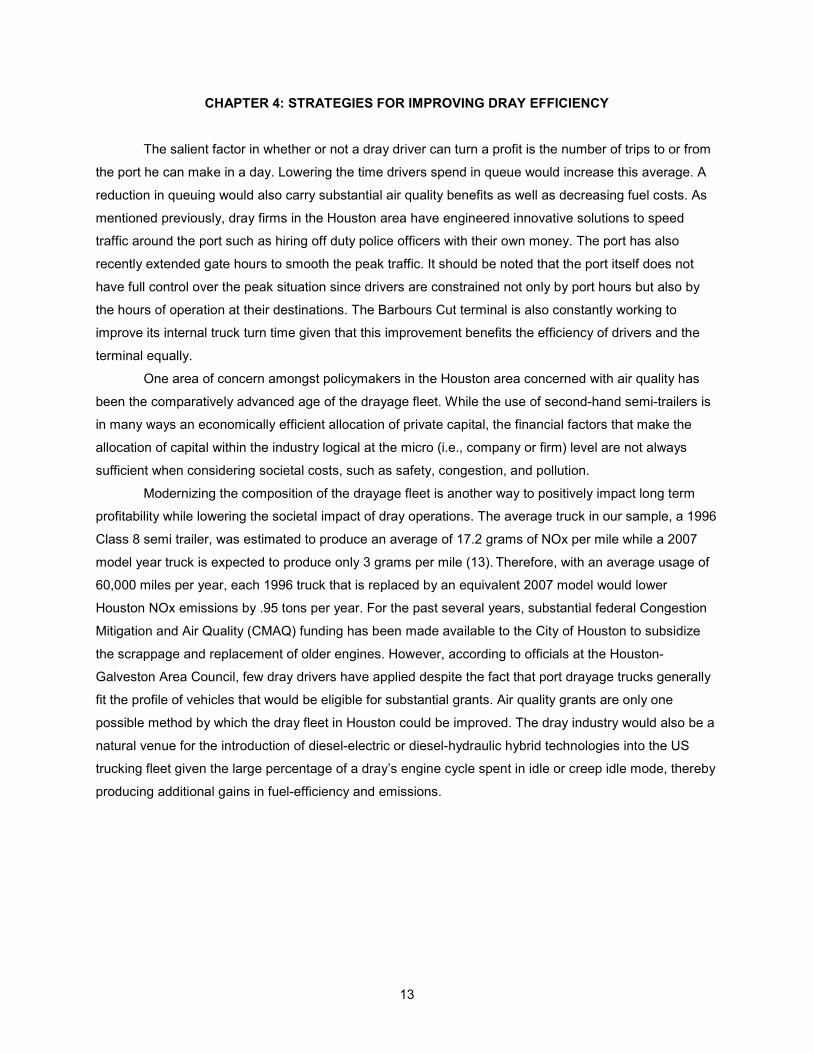
CHAPTER 4: STRATEGIES FOR IMPROVING DRAY EFFICIENCY
The salient factor in whether or not a dray driver can turn a profit is the number of trips to or from
the port he can make in a day. Lowering the time drivers spend in queue would increase this average. A
reduction in queuing would also carry substantial air quality benefits as well as decreasing fuel costs. As
mentioned previously, dray firms in the Houston area have engineered innovative solutions to speed
traffic around the port such as hiring off duty police officers with their own money. The port has also
recently extended gate hours to smooth the peak traffic. It should be noted that the port itself does not
have full control over the peak situation since drivers are constrained not only by port hours but also by
the hours of operation at their destinations. The Barbours Cut terminal is also constantly working to
improve its internal truck turn time given that this improvement benefits the efficiency of drivers and the
terminal equally.
One area of concern amongst policymakers in the Houston area concerned with air quality has
been the comparatively advanced age of the drayage fleet. While the use of second-hand semi-trailers is
in many ways an economically efficient allocation of private capital, the financial factors that make the
allocation of capital within the industry logical at the micro (i.e., company or firm) level are not always
sufficient when considering societal costs, such as safety, congestion, and pollution.
Modernizing the composition of the drayage fleet is another way to positively impact long term
profitability while lowering the societal impact of dray operations. The average truck in our sample, a 1996
Class 8 semi trailer, was estimated to produce an average of 17.2 grams of NOx per mile while a 2007
model year truck is expected to produce only 3 grams per mile (13). Therefore, with an average usage of
60,000 miles per year, each 1996 truck that is replaced by an equivalent 2007 model would lower
Houston NOx emissions by .95 tons per year. For the past several years, substantial federal Congestion
Mitigation and Air Quality (CMAQ) funding has been made available to the City of Houston to subsidize
the scrappage and replacement of older engines. However, according to officials at the Houston-
Galveston Area Council, few dray drivers have applied despite the fact that port drayage trucks generally
fit the profile of vehicles that would be eligible for substantial grants. Air quality grants are only one
possible method by which the dray fleet in Houston could be improved. The dray industry would also be a
natural venue for the introduction of diesel-electric or diesel-hydraulic hybrid technologies into the US
trucking fleet given the large percentage of a dray’s engine cycle spent in idle or creep idle mode, thereby
producing additional gains in fuel-efficiency and emissions.
14
02468
1012141618
1986
1987
1988
1989
1990
1991
1992
1993
1994
1995
1996
1997
1998
1999
2000
2001
2002
2003
2004
2005
Year
Freq
uenc
y
Figure 2. Truck model year

15
CHAPTER 5: CONCLUSIONS
The results of the study presented in this report mark a first step in gaining a greater
understanding of the characteristics of drayage at Texas deepwater ports. Although the study captured
only one randomly selected day at the Port, the decentralized nature of the dray industry is likely to have
produced a sufficient degree of randomness to draw preliminary results. As research continues through
2007, the researchers hope to refine and repeat the survey to examine possible seasonality effects. The
validity of the initial survey was also greatly aided by the extremely low refusal rate. The results suggest
that despite the rapid increase in TEU volumes at the Port of Houston in recent years, the drayage
industry has managed to maintain relative stability. Several possible reasons for this performance exist.
For example, the drayage industry is not as subject to some of the constraints that impede market
responsiveness of other transportation industries such as high upfront capital costs or unionization. The
researchers did not directly query drivers on their profitability, nevertheless the information collected from
Houston dray managers suggested that there has been a relatively low rate of market exit since
compensation rates have increased in recent years. Port drayage is a difficult and physically demanding
profession. Still, the researchers found that most firms were able to attract sufficient numbers of qualified
drivers despite a nationwide trucker shortage that has affected all areas of the trucking industry.
Even if most drivers are currently able to earn an acceptable return, this should not prevent
researchers from examining ways in which the industry could be made more efficient by methods such as
reducing deadheading, shortening queues and modernizing the dray fleet. The challenge for improving
the dray industry is to create win-win solutions that benefit the working conditions and profitability of
drivers while at the same time improving overall port efficiency and lower the associated negative
externalities of the industry. If these strategies are realized the dray component of the marine intermodal
system can become more efficient and more closely tailored to its specific role within the supply chain
while remaining a resourceful and profitable industry sub-sector.

16

17
REFERENCES 1. The Port of Long Beach. San Pedro Bay Ports Clean Air Action Plan Technical Report:
Performance Standards for On-Road Heavy-Duty Vehicles. June 2006. www.polb.com/civica/filebank/blobdload.asp?BlobID=2967. Accessed July 28, 2006.
2. Morlock, Edward K., and Lazar N. Spasovic. Approaches For Improving Drayage In Rail-Truck
Intermodal Service. August 18, 1994. www.transportation.njit.edu/nctip/final_report/approaches_for_improving_drayage.pdf. Accessed July 28, 2006.
3. Resor, Randy and Blaze, James. Short-Haul Intermodal: Can it Compete with Trucks? Transportation Research Record, Issue Number: 1873, p.45-52. 2004
4. Strauss-Weider, Inc. Intermodal Access to US Ports Report on Survey Findings. Maritime
Administration. August 2002. www.marad.dot.gov/Publications/01%20IAccess%20Report%20pub.doc. Accessed July 28, 2006.
5. ICF Consulting. Evaluation of U.S. Commercial Motor Carrier Industry Challenges and Opportunities.
March 31, 2003. http://www.icfi.com/Markets/Transportation/reports/us-motor-carrier.asp. Accessed July 28, 2006.
6. Cooke, James A. Logistics costs under pressure. Logistics Management, Issue 7, pp. 34. 2006
Brown, Thomas R. and Anthony B. Hatch. The Value of Rail Intermodal in the U.S. Economy. September 19, 2002. www.aar.org/pubcommon/documents/govt/brown.pdf. Accessed July 28, 2006.
7. Texas Transportation Institute. National Congestion Tables. www.mobility.tamu.edu/ums/report/.
Accessed July 28, 2006. 8. Prince, Ted. Endangered species; Economic instability threatens drayage operators and their
customers. Journal of Commerce, pp. 12-16. May 9, 2005. 9. Gillis, Chris. Teamsters Mack Attack: Port Division Continues Drive to Organize Container Drayage
Operations. American Shipper, Vol. 45, 2003, pp. 88-90. 10. Monaco, Kristen and Lisa Grobar. A Study of Drayage at the Ports of Los Angeles and Long Beach.
AR 04-01. December 15, 2004. 11. www.metrans.org/research/final/AR%2004-01_final_draft.pdf. Accessed July 28, 2006. 12. Starcrest Consulting Group LLC. Port-Wide Baseline Air Emissions Inventory. June 2004.
www.portoflosangeles.org/DOC/REPORT_Final_BAEI_ExecSum.pdf. Accessed July 28, 2006. 13. Houston-Galveston Area Council. The Clean Cities / Clean Vehicles Program.
www.houston-cleancities.org. Accessed July 28, 2006.

18
19
APPENDIX A
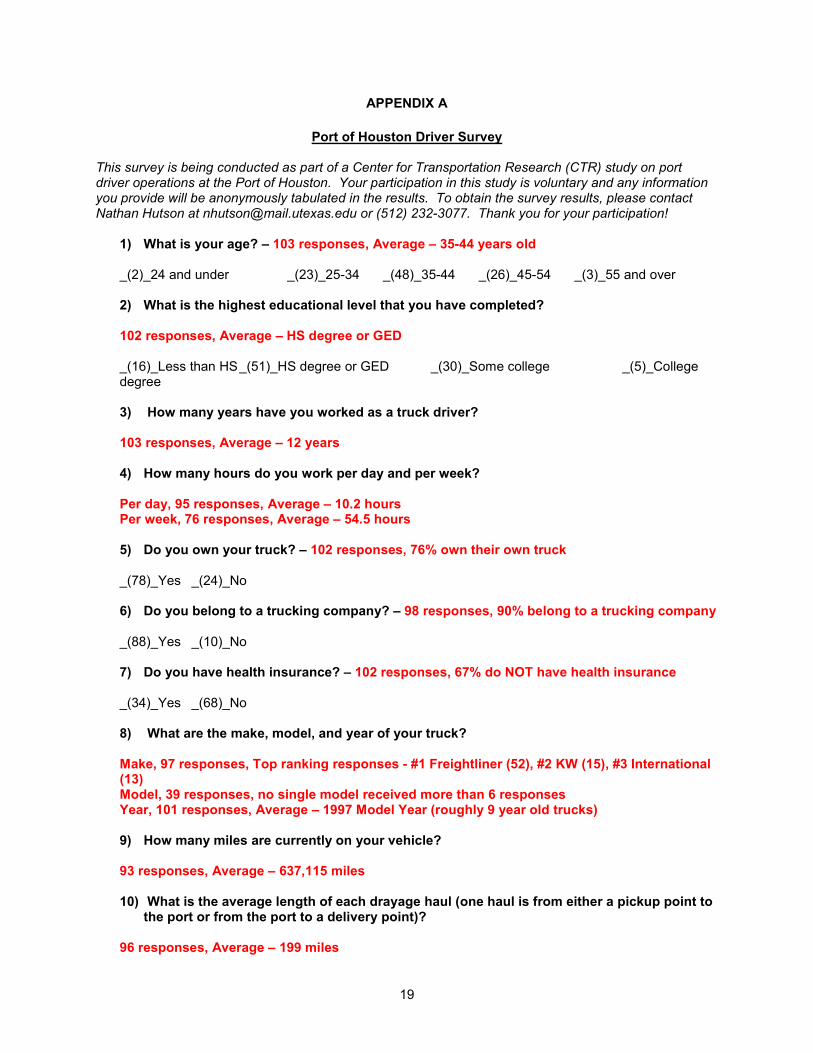
Port of Houston Driver Survey This survey is being conducted as part of a Center for Transportation Research (CTR) study on port driver operations at the Port of Houston. Your participation in this study is voluntary and any information you provide will be anonymously tabulated in the results. To obtain the survey results, please contact Nathan Hutson at [email protected] or (512) 232-3077. Thank you for your participation!
1) What is your age? – 103 responses, Average – 35-44 years old _(2)_24 and under _(23)_25-34 _(48)_35-44 _(26)_45-54 _(3)_55 and over
2) What is the highest educational level that you have completed? 102 responses, Average – HS degree or GED _(16)_Less than HS _(51)_HS degree or GED _(30)_Some college _(5)_College degree
3) How many years have you worked as a truck driver? 103 responses, Average – 12 years
4) How many hours do you work per day and per week?
Per day, 95 responses, Average – 10.2 hours Per week, 76 responses, Average – 54.5 hours
5) Do you own your truck? – 102 responses, 76% own their own truck _(78)_Yes _(24)_No
6) Do you belong to a trucking company? – 98 responses, 90% belong to a trucking company _(88)_Yes _(10)_No
7) Do you have health insurance? – 102 responses, 67% do NOT have health insurance
_(34)_Yes _(68)_No
8) What are the make, model, and year of your truck? Make, 97 responses, Top ranking responses - #1 Freightliner (52), #2 KW (15), #3 International (13) Model, 39 responses, no single model received more than 6 responses Year, 101 responses, Average – 1997 Model Year (roughly 9 year old trucks)
9) How many miles are currently on your vehicle? 93 responses, Average – 637,115 miles
10) What is the average length of each drayage haul (one haul is from either a pickup point to
the port or from the port to a delivery point)?
96 responses, Average – 199 miles
20
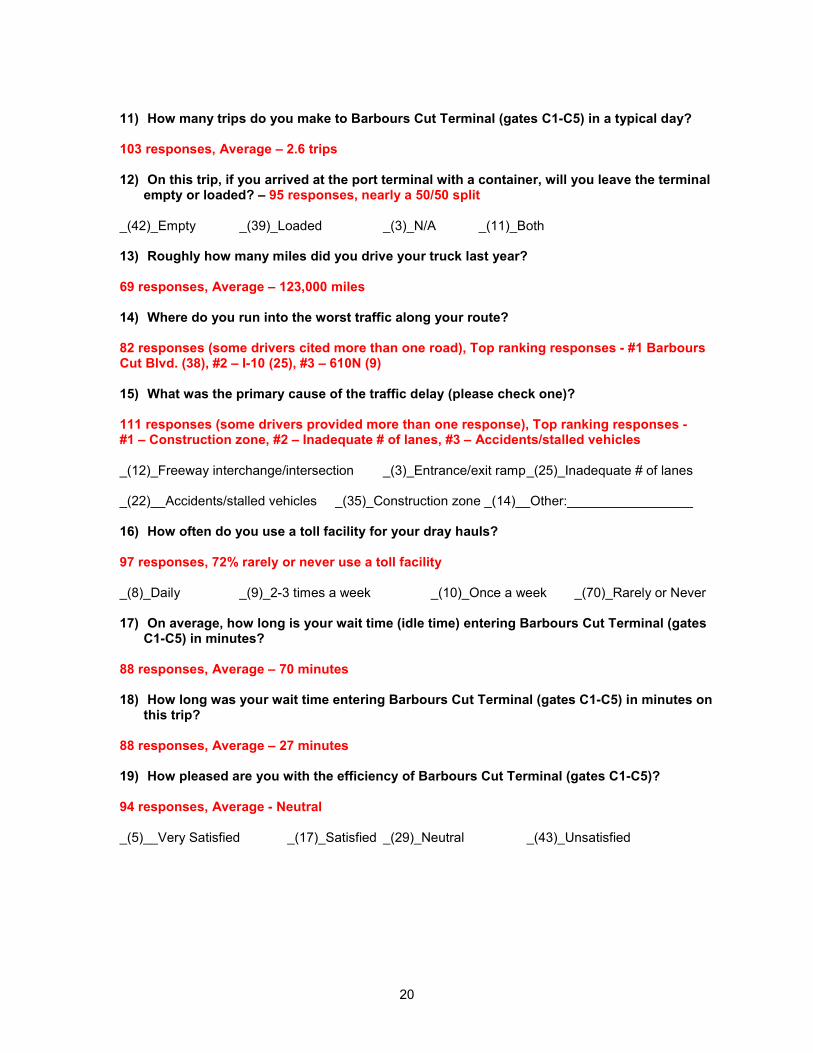
11) How many trips do you make to Barbours Cut Terminal (gates C1-C5) in a typical day?
103 responses, Average – 2.6 trips
12) On this trip, if you arrived at the port terminal with a container, will you leave the terminal
empty or loaded? – 95 responses, nearly a 50/50 split _(42)_Empty _(39)_Loaded _(3)_N/A _(11)_Both 13) Roughly how many miles did you drive your truck last year? 69 responses, Average – 123,000 miles
14) Where do you run into the worst traffic along your route? 82 responses (some drivers cited more than one road), Top ranking responses - #1 Barbours Cut Blvd. (38), #2 – I-10 (25), #3 – 610N (9) 15) What was the primary cause of the traffic delay (please check one)? 111 responses (some drivers provided more than one response), Top ranking responses - #1 – Construction zone, #2 – Inadequate # of lanes, #3 – Accidents/stalled vehicles _(12)_Freeway interchange/intersection _(3)_Entrance/exit ramp _(25)_Inadequate # of lanes _(22)__Accidents/stalled vehicles _(35)_Construction zone _(14)__Other:_________________
16) How often do you use a toll facility for your dray hauls? 97 responses, 72% rarely or never use a toll facility _(8)_Daily _(9)_2-3 times a week _(10)_Once a week _(70)_Rarely or Never 17) On average, how long is your wait time (idle time) entering Barbours Cut Terminal (gates
C1-C5) in minutes? 88 responses, Average – 70 minutes 18) How long was your wait time entering Barbours Cut Terminal (gates C1-C5) in minutes on
this trip? 88 responses, Average – 27 minutes
19) How pleased are you with the efficiency of Barbours Cut Terminal (gates C1-C5)? 94 responses, Average - Neutral _(5)__Very Satisfied _(17)_Satisfied _(29)_Neutral _(43)_Unsatisfied
21
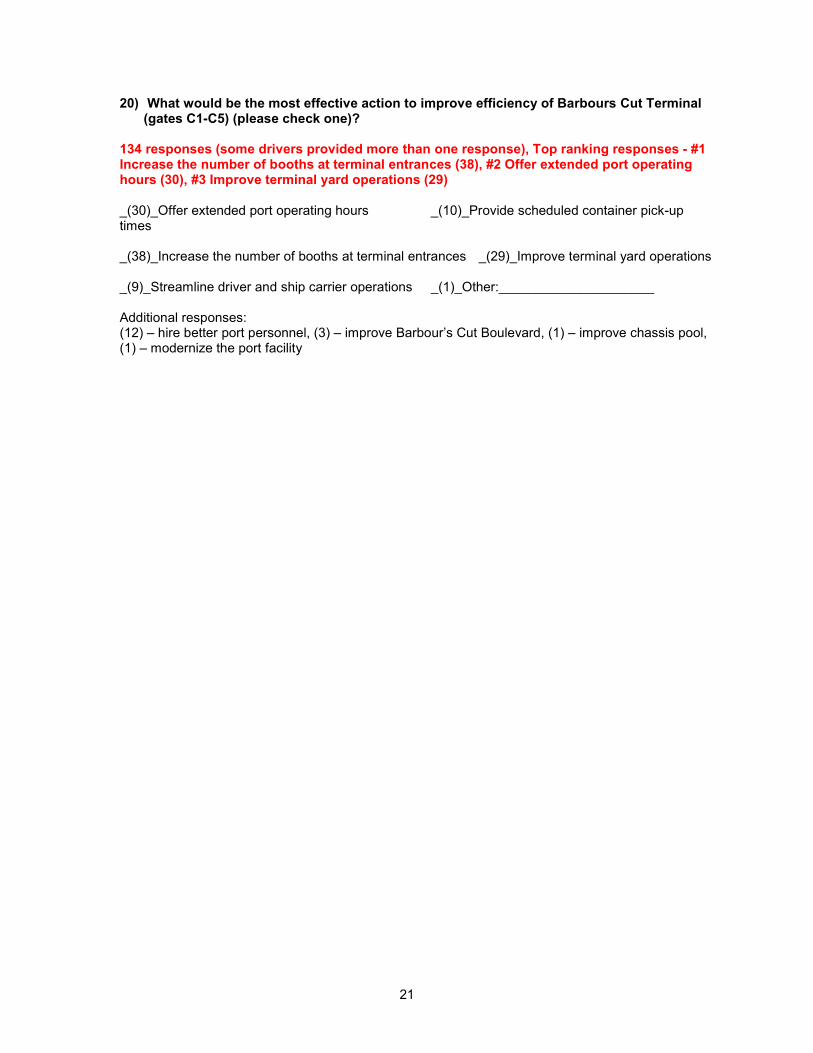
20) What would be the most effective action to improve efficiency of Barbours Cut Terminal (gates C1-C5) (please check one)?
134 responses (some drivers provided more than one response), Top ranking responses - #1 Increase the number of booths at terminal entrances (38), #2 Offer extended port operating hours (30), #3 Improve terminal yard operations (29) _(30)_Offer extended port operating hours _(10)_Provide scheduled container pick-up times _(38)_Increase the number of booths at terminal entrances _(29)_Improve terminal yard operations _(9)_Streamline driver and ship carrier operations _(1)_Other:_____________________ Additional responses: (12) – hire better port personnel, (3) – improve Barbour’s Cut Boulevard, (1) – improve chassis pool, (1) – modernize the port facility

22
23
APPENDIX B
Annotated Bibliography
Project Summary: The Value of Texas Ports. TTI Research Report 2994-2F. Texas Transportation
Institute. Texas A&M University.
In this report, TTI analyzes the impact of Texas ports on the state economy. Unlike other gulf states,
Texas ports do not receive state government subsidies. According to TTI, state employment attributable
to Texas ports in 1994 was 942,883. In that year, Texas ports generated earnings of $30 billion (18.6%
of Gross State Product). TTI contends that the port cities are not the only ones who benefit from this
economic activity and state that it is important for the state to become more involved in supporting the
various ports along the state’s gulf coast.
.
Resor, Randy., and Blaze, James. Short-Haul Intermodal: Can it Compete with Trucks? Transportation Research Record, Issue Number 1873, p.45-52. 2004.
Double stack rail cars were first introduced in the 1980’s, reducing rail haul costs and making intermodal
traffic competitive at distances of about 500 miles as opposed to 750 miles. In this report, Resor and
Blaze consider the impact and opportunity presented by double stack technology. Despite the
improvements brought on by double stack technology, a reduction in rail costs between 40-50%, the
authors found that most intermodal traffic is still being handled by long haul trucks. A major reason for this
is the fact that three quarters of truck tonnage moves distances of less than 500 miles, a distance where
rail has been unable to effectively compete. One successful short-haul intermodal market that offers
some hope for rail is from Jacksonville, FL to Miami, FL. Along this route, goods ship via frail from Miami
to Jacksonville then goes via truck to East Coast destinations.
Naturally, ports have been very interested in considering the opportunities presented by double stacking.
Recently, the Port of New York undertook a study to determine the competitiveness of short haul rail to
regional destinations with a mix of single and double stack scenarios. In the study, point to point cost was
much cheaper via rail than truck (20 times cheaper). However, the rail costs did not include drayage and
terminal charges and it was assumed that the truck was returning to port empty (only a one-way haul).
Adjusting for these factors, truck comes out ahead even though double stacking has significantly
decrease rail line haul costs.
24
Ways to reduce rail costs:
1) Clear rail routes for double stack cars
2) Improve intermodal connectors (roads that connect ports and rail yards) to allow draymen to
make more trips during the working day
3) Centrally manage drayage operations to help match drivers with loads to increase productivity
4) Have rail yard within the port area
5) Use “dry ports”. Move containers via rail from ports to inland locations to avoid drayage costs.
6) Use public/private partnerships to reduce terminal costs
Brown, Thomas R. and Anthony B. Hatch. The Value of Rail Intermodal in the U.S. Economy. September 19, 2002. www.aar.org/pubcommon/documents/govt/brown/pdf. Accessed July 28.
2006.
This report presents a wealth of facts about the U.S. transportation network, and more specifically the
national rail network including the following:
• The U.S. has the most efficient freight transportation system in the world and faces a doubling in
demand by 2020. Logistics in the U.S. consumes only 9.5% of GDP (2001), far lower than other
developed countries.
• Demand for freight will not be able to be met by expanding the highway network according to the
Federal Highway Administration (FHWA).
• Cost of building railroad mainline is $1-$2 million/mile, for urban highway $10 million/mile
• In 1984 one single stack train per week went from the California coast to inland via intermodal.
Today, over 241 double stack trains per week do so.
• A single 5,000 twenty foot vessel will generate 7 double stack trains.
• To meet short to middle distance shipping challenges, the RoadRailer has been developed – a
trailer with interchangeable rail or road wheels. The RoadRailer works on both highway and
railroad.
25
Morlok, Edward. Summary of Research Results in University of Pennsylvania Study on Reducing
Intermodal Drayage Costs and Improving Service Quality on Conrail.
Drayage costs currently account for 40% of the total price for door-to-door intermodal movements paid
out by Conrail. As a large component of total intermodal cost, yet short length of an intermodal move, in
this study Morlok conducts a case study of the Morrisville terminal to determine where intermodal drayage
costs may be reduced. Here is what Morlok learned:
Case study of Morrisville terminal:
• Under the current system trailer movements are between $72,400 and $78,600 and could be
reduced to $45,000 (a savings of $30,000 or 40%) if drayage operations are centralized allowing
total tractor hours and tractor miles to be reduced translating into reduced payments for draymen.
• Another concern is quality of drayage service. Time related level of service constraints have been
considered, but it is uncertain if drayage companies would charge more for quicker service.
• In the end, improvements in drayage are physically possible, but institutionally there are a
number of issues to overcome. Intermodal retailers deal with the draymen, not Conrail,
engendering conflict and inefficient operations.
FHWA: Freight Management and Operations – Advancing Intermodal Cargo Information.
http://ops.fhwa.dot.gov/freight/documents/depmodes/sec04.htm.
This document deals with technological advances in the drayage industry. Today, drayage is mostly
comprised of small to mid sized companies. The few larger companies embrace technological advances.
New tech is used to track shipments for customers and to help drayage companies figure out driver
movement and more efficient route and driver schedules. GPS technology is used in drayage as well as
cheaper cellular tech. Cellular tech is effective in urban locations where GPS is not and is more
commonly used by the smaller firms. Until GPS technology become a cheaper and more practical
alternative, cellular technology will continue to be a mainstay in the drayage industry.
Advancing Intermodal Cargo Information System Deployments Across Modes and Regions.
Technology and terminology in freight:
Data exchange technologies for cargo transport
Extranets – use of internet for tracking by customers and business partners.
Electronic Data Interchange (EDI) – transfer of cargo data through electronic transaction sets. Allows for
automated billing, routine data transfer between databases, freight tracking.

26
Terminal freight and equipment tracking
RF Tags – radio signals that establish real time data exchange. Used to check rail car numbers vs. train
composition information in the Port Management System.
Smart cards – wallet sized cards used to manage the entrance and exit of vehicles in the terminal yard.
Satellite-based technologies – locate cargo and equipment within meters using GPS.
Port Management Information Systems (PMIS)
Logistics module – controls flow of ships, cargo, and personnel.
Physical assets module – datable of terminal assets used to schedule maintenance of port facilities and
equipment.
Freight Carriers: From Modal Fragmentation to Coordinated Logistics. Federal Highway
Administration.
Coordinated logistics is the integration of distinct logistics activities such as cross-modal coordination or
the bundling of transportation and inventory control. The rapid expansion of global and “hemispheric”
(such as NAFTA) trade and rising shipper expectations have forced many carriers to abandon single-
mode product offerings, and develop mode-neutral service products. Whereas shippers see the
opportunity for better and more cost-effective service products, carriers see the high cost of information
systems necessary to manage a coordinated product. Today, the trucking industry is fragmented,
however, the degree of concentration among the largest lines has grown. Coordinated logistics has
created fewer, larger service providers offering quality service in the trucking industry. In the rail industry
this is not the case. A consolidated rail industry has resulted in poorer quality.
5 trends pushing and shaping cross modal operational strategies:
1) the rapid development and adoption of information technologies for tracking shipments and
managing fleets
2) economic competition for capital
3) carrier concentration and consolidation
4) globalization in the economy
5) the evolution of networks
3 categories of technologies available for freight transportation:
1) Shipment and asset tracking technologies
2) Routing and dispatch optimization models
3) Commercial transaction management software

27
Prince, Ted. Endangered Species: Economic instability threatens drayage operators and their
customers. Journal of Commerce, pp. 12-16. May 9, 2005.
-Intermodal drayage has not kept pace with advancements in ships and stack trains
-Currently, drayage is a complicated web of overlaying transactions.
-Company drivers cost 50% more per mile than owner-operators
-Owner-operators only make about $6/hr after expenses
-Drayage operators face longer intercity movements, reducing the number of trips that may be made in a
day.
-Terminals have instigated reduced terminal storage from 5 to 4 days and railroads sometimes only allow
24 hours at intermodal hubs
-Rising insurance costs are having a negative impact on the drayage industry
-Draymen don’t get paid as quickly as other components of intermodal shipment. Some wait for 2 months
while a steamship company is prepaid.
-Rising equipment and operating costs
Gillis, Chris. Teamsters’ Mack Attack: Port Division Continues Drive to Organize Container
Drayage Operations. American Shipper, Vol. 45, 2003, pp. 88-90.
Chuck Mack, Teamsters port division director, is spearheading an effort to combat line carriers and
shippers who shortchange port drivers. This article discusses why the Teamsters are concerned with the
state of the drayage industry and what the Teamsters have proposed as a resolution to the problems.
According to the Teamsters, 80% of port drivers today are non-unionized owner-operators. These drivers
often work 60 to 80 hours a week for $7 to $8/hour and generally lack basic benefits, such as health care
insurance. Because of the low pay and long hours, there is a high driver turnover rate that poses a
potential security threat to the ports. One solution to the problem is to give port drivers more leverage by
eliminating liner carriers’ antitrust immunity privileges originally granted in the 1998 Ocean Shipping
Reform Act.
“These workers are not scabs. They are not willingly driving themselves into bankruptcy. They deserve
the same right to economic security and opportunity as you and me. Together we must end this
exploitation and bring dignity and economic justice to everyone on the waterfront.” – Chuck Mack
McNally, Sean. Homeland Security Department Cites Port, Border Drayage as Risks. Transport
Topics.
“Generally speaking…we are concerned about drayage – both on the foreign side of the supply chain and
on the domestic side of the supply chain.” – Elaine Dezenski, director of cargo security policy for the
Department of Homeland Security’s border and transportation security directorate “There’s not a
capability to track where that trucker is going with that cargo. And they don’t always show up at the port at
the time you think.”
28
Viega, Alex. Delays at California Ports Send O-Os Elsewhere. Transport Topics. October 4, 2004.
Trucking companies serving the Port of Los Angeles and Long Beach are having a tough time retaining
drivers due to increased congestion at the ports. According to Stephanie Williams of the California
Trucking Association, between 10-20% of the 12,000 truck operators who pull freight in the harbor have
moved on to other trucking work over the past two months. An informal survey conducted by 11 trucking
companies suggested truckers are sometimes forced to wait all day just to get one cargo container.
Monaco, Kristen and Lisa Grobar. A Study of Drayage at the Ports of Los Angeles and Long
Beach. AR 04-01. December 15, 2004.
Over the course of a week at the Ports of Los Angeles and Long Beach Monaco and Grobar conducted
an in-depth survey of dray drivers. Monaco and Grobar’s research provided a wealth of information about
the nature and status of the dray industry in the Los Angeles area and their survey methodology provided
a model for the establishment of our own dray survey at the Port of Houston.