SWITCH POINT PROFILE DESIGN AND REVENUE SERVICE PROTOTYPE ... · PROTOTYPE TESTS Prototype switch...
37
SWITCH POINT PROFILE DESIGN AND REVENUE SERVICE PROTOTYPE EVALUATION Huimin Wu Transportation Technology Center, Inc. 55500 DOT Rd Pueblo, CO 81001 Telephone: 719-584-0533 Fax: 719-584-0770 David Davis Transportation Technology Center, Inc. 55500 DOT Rd Pueblo, CO 81001 Telephone: 719-584-0754 Fax: 719-584-0770 AREMA 2012 Annual Conference and Exposition Chicago, Illinois Words: 3,139 Abstract Switch point fatigue is a limiting factor of the service life of turnouts. Switch point breakage (chipping), rolling contact fatigue, and metal flow are common degradation modes seen in heavy axle load service. Under Association of American Railroads’ research funding, Transportation Technology Center, Inc. designed a new running surface profile for mainline switch points. The new design is intended to reduce wheel/rail contact stresses and to locate wheel contact toward the rail top over the length of the switch point transfer zone. Working with Union Pacific Railroad, BNSF Railway Company, and switch suppliers, the switch points with the new designed profile and with the current standard profile have been tested in revenue service since December 2010. The test results up to early 2012 indicated that the new designed switch point profile prototypes, when correctly shaped, have produced better wear patterns, lower wear rate, and less rail surface damage. In addition, the prototypes have required less grinding for plastic flow and RCF maintenance. © 2012 AREMA
Transcript of SWITCH POINT PROFILE DESIGN AND REVENUE SERVICE PROTOTYPE ... · PROTOTYPE TESTS Prototype switch...
SWITCH POINT PROFILE DESIGN AND REVENUE SERVICE PROTOTYPE EVALUATION
Huimin Wu
Transportation Technology Center, Inc. 55500 DOT Rd
Pueblo, CO 81001 Telephone: 719-584-0533
Fax: 719-584-0770
David Davis Transportation Technology Center, Inc.
55500 DOT Rd Pueblo, CO 81001
Telephone: 719-584-0754 Fax: 719-584-0770
AREMA 2012 Annual Conference and Exposition Chicago, Illinois
Words: 3,139
Abstract
Switch point fatigue is a limiting factor of the service life of turnouts. Switch point breakage
(chipping), rolling contact fatigue, and metal flow are common degradation modes seen in heavy
axle load service. Under Association of American Railroads’ research funding, Transportation
Technology Center, Inc. designed a new running surface profile for mainline switch points. The
new design is intended to reduce wheel/rail contact stresses and to locate wheel contact toward the
rail top over the length of the switch point transfer zone. Working with Union Pacific Railroad,
BNSF Railway Company, and switch suppliers, the switch points with the new designed profile
and with the current standard profile have been tested in revenue service since December 2010.
The test results up to early 2012 indicated that the new designed switch point profile prototypes,
when correctly shaped, have produced better wear patterns, lower wear rate, and less rail surface
damage. In addition, the prototypes have required less grinding for plastic flow and RCF
maintenance.
© 2012 AREMA
INTRODUCTION
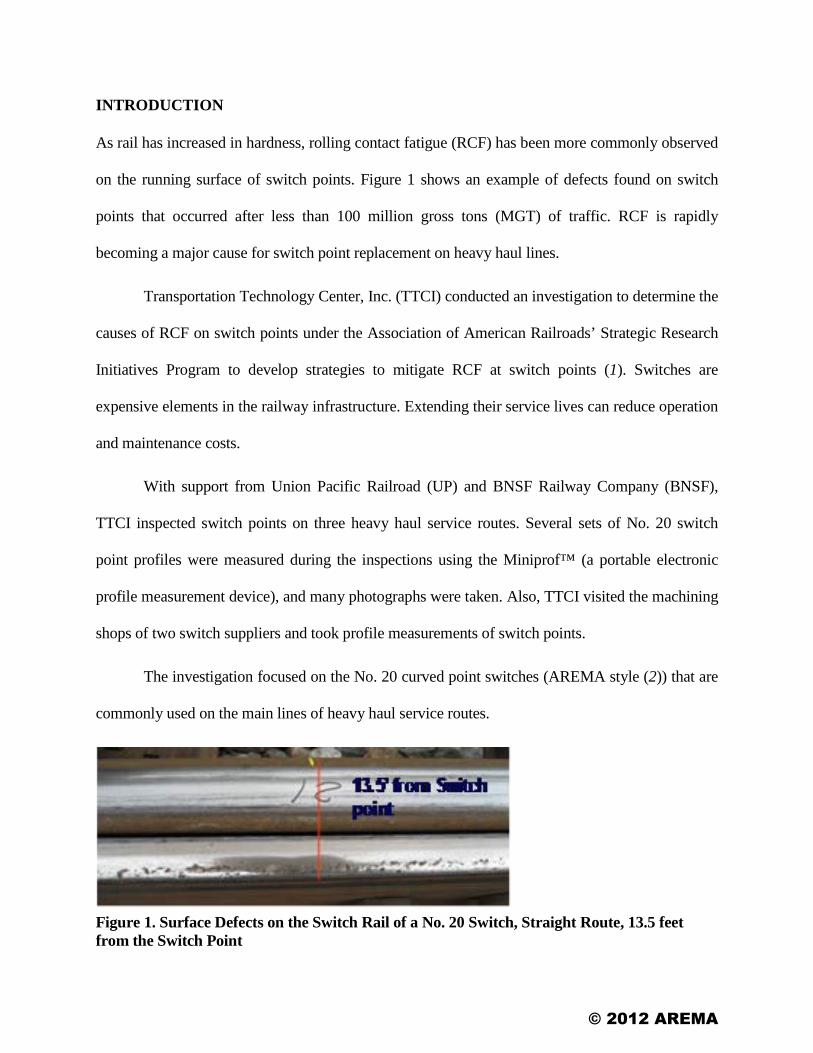
As rail has increased in hardness, rolling contact fatigue (RCF) has been more commonly observed
on the running surface of switch points. Figure 1 shows an example of defects found on switch
points that occurred after less than 100 million gross tons (MGT) of traffic. RCF is rapidly
becoming a major cause for switch point replacement on heavy haul lines.
Transportation Technology Center, Inc. (TTCI) conducted an investigation to determine the
causes of RCF on switch points under the Association of American Railroads’ Strategic Research
Initiatives Program to develop strategies to mitigate RCF at switch points (1). Switches are
expensive elements in the railway infrastructure. Extending their service lives can reduce operation
and maintenance costs.
With support from Union Pacific Railroad (UP) and BNSF Railway Company (BNSF),
TTCI inspected switch points on three heavy haul service routes. Several sets of No. 20 switch
point profiles were measured during the inspections using the Miniprof™ (a portable electronic
profile measurement device), and many photographs were taken. Also, TTCI visited the machining
shops of two switch suppliers and took profile measurements of switch points.
The investigation focused on the No. 20 curved point switches (AREMA style (2)) that are
commonly used on the main lines of heavy haul service routes.
Figure 1. Surface Defects on the Switch Rail of a No. 20 Switch, Straight Route, 13.5 feet from the Switch Point
© 2012 AREMA
FIELD OBSERVATIONS
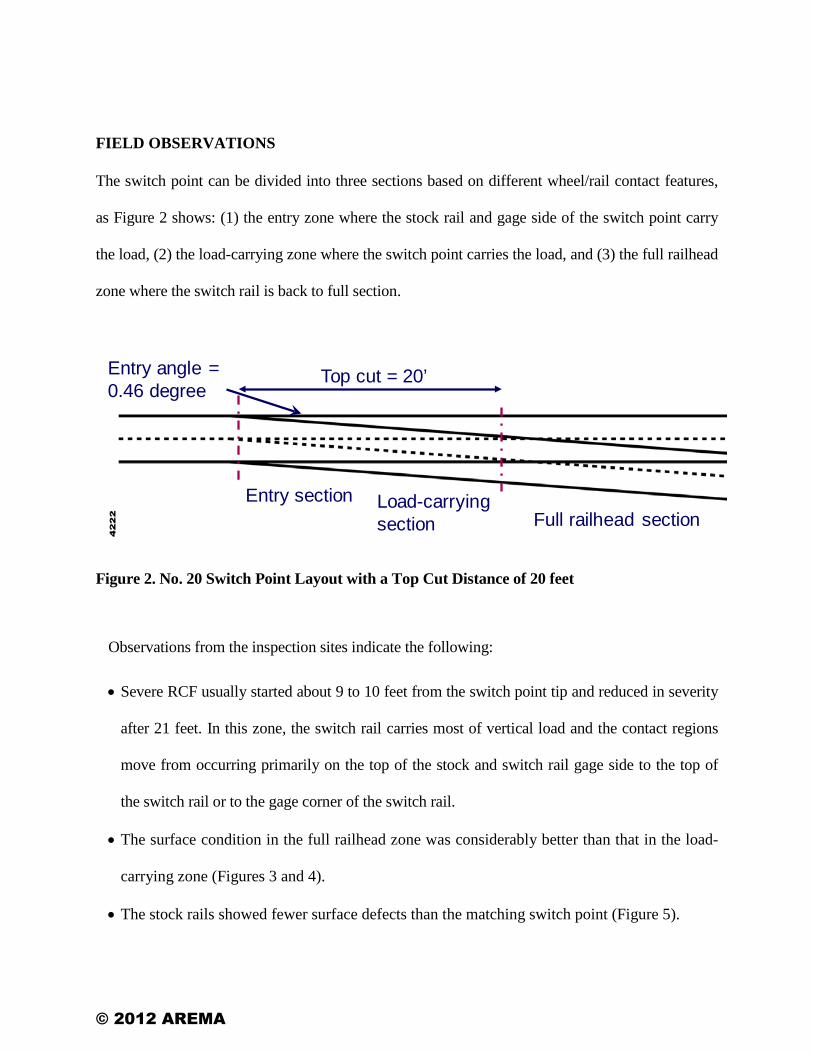
The switch point can be divided into three sections based on different wheel/rail contact features,
as Figure 2 shows: (1) the entry zone where the stock rail and gage side of the switch point carry
the load, (2) the load-carrying zone where the switch point carries the load, and (3) the full railhead
zone where the switch rail is back to full section.
Top cut = 20’Entry angle = 0.46 degree
Entry section Load-carrying section Full railhead section
Figure 2. No. 20 Switch Point Layout with a Top Cut Distance of 20 feet
Observations from the inspection sites indicate the following:
• Severe RCF usually started about 9 to 10 feet from the switch point tip and reduced in severity
after 21 feet. In this zone, the switch rail carries most of vertical load and the contact regions
move from occurring primarily on the top of the stock and switch rail gage side to the top of
the switch rail or to the gage corner of the switch rail.
• The surface condition in the full railhead zone was considerably better than that in the load-
carrying zone (Figures 3 and 4).
• The stock rails showed fewer surface defects than the matching switch point (Figure 5).
© 2012 AREMA
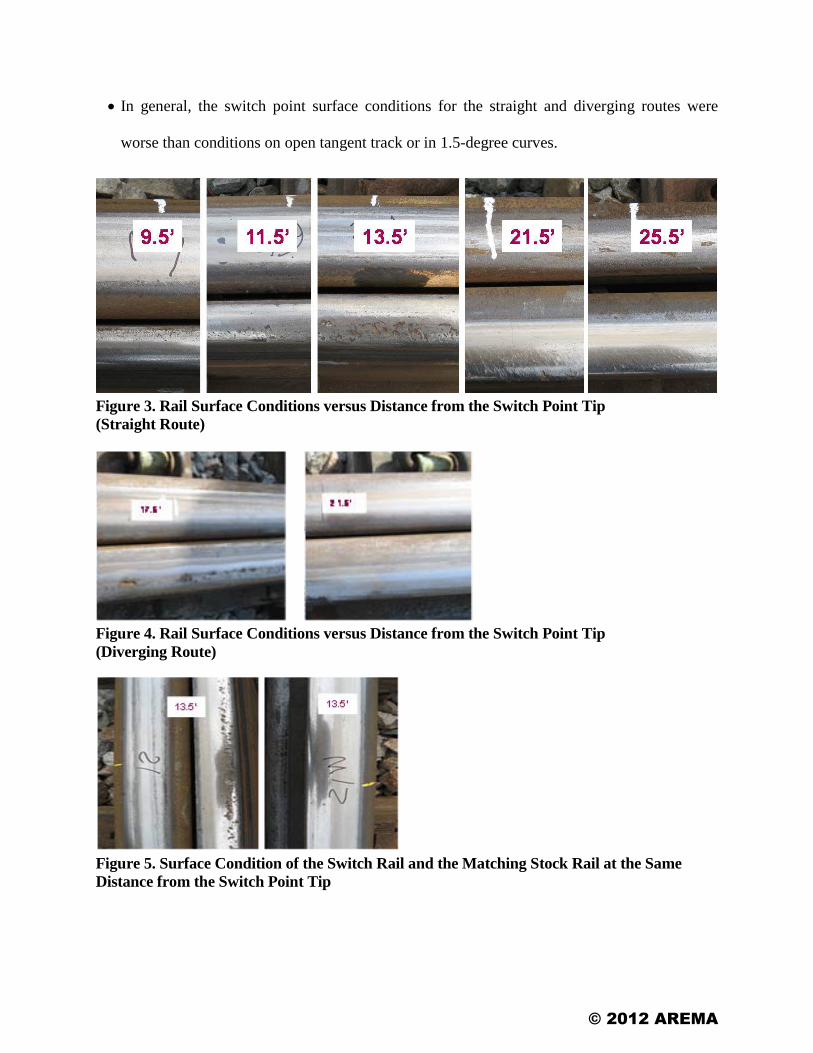
• In general, the switch point surface conditions for the straight and diverging routes were
worse than conditions on open tangent track or in 1.5-degree curves.
Figure 3. Rail Surface Conditions versus Distance from the Switch Point Tip (Straight Route)
Figure 4. Rail Surface Conditions versus Distance from the Switch Point Tip (Diverging Route)
Figure 5. Surface Condition of the Switch Rail and the Matching Stock Rail at the Same Distance from the Switch Point Tip
© 2012 AREMA

CONTACT AND WEAR PATTERN ANALYSIS
Figure 6 shows the typical contact pattern of a common worn wheel contacting a new switch point
profile of the current design. Very high contact stress and shear stress can be induced at the switch
point gage corner due to the small contact area. This condition can only be improved when the
sharp corner is worn into the shape shown in Figure 7.
Small contact area carries most of the vertical load
Figure 6. Contact Pattern of a Worn Wheel in Contact with the Current Switch Point Design
Worn switch rail profile
Figure 7. Contact Pattern of a Worn Wheel in Contact with a Worn Switch Point
Figure 8, which compares a typical worn switch rail profile with a new switch rail shape for
the current design, shows the concentrated wear that occurs at the switch rail gage corner.
© 2012 AREMA
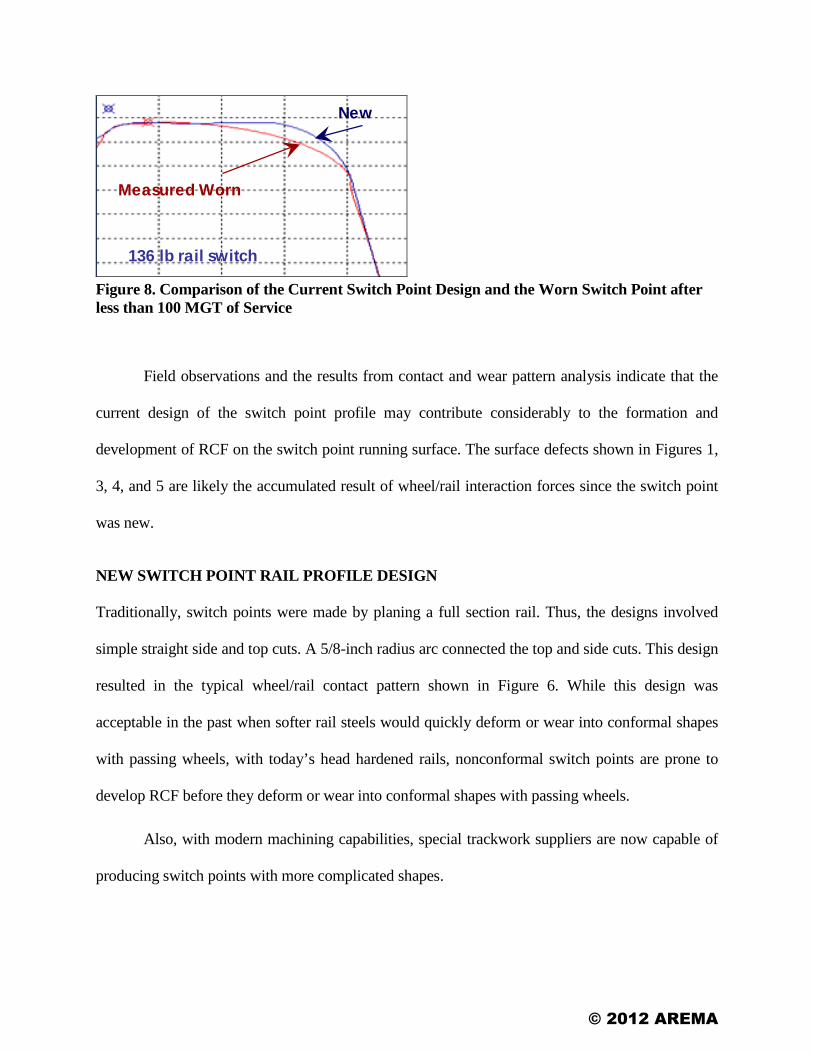
New
Measured Worn
136 lb rail switch
Figure 8. Comparison of the Current Switch Point Design and the Worn Switch Point after less than 100 MGT of Service
Field observations and the results from contact and wear pattern analysis indicate that the
current design of the switch point profile may contribute considerably to the formation and
development of RCF on the switch point running surface. The surface defects shown in Figures 1,
3, 4, and 5 are likely the accumulated result of wheel/rail interaction forces since the switch point
was new.
NEW SWITCH POINT RAIL PROFILE DESIGN
Traditionally, switch points were made by planing a full section rail. Thus, the designs involved
simple straight side and top cuts. A 5/8-inch radius arc connected the top and side cuts. This design
resulted in the typical wheel/rail contact pattern shown in Figure 6. While this design was
acceptable in the past when softer rail steels would quickly deform or wear into conformal shapes
with passing wheels, with today’s head hardened rails, nonconformal switch points are prone to
develop RCF before they deform or wear into conformal shapes with passing wheels.
Also, with modern machining capabilities, special trackwork suppliers are now capable of
producing switch points with more complicated shapes.
© 2012 AREMA
TTCI has designed two new switch point profiles for No. 20 switches to improve wheel/rail
contact conditions on the switch point running surface. The objectives of the new designs include:
• Extending the service life of a switch point by reducing or delaying the initiation of RCF
• Reducing contact stress and shear stress by producing a larger wheel/rail contact area
• Improving wear life by avoiding concentrated wear
• Reducing variations in contact conditions by smoothly blending the switch point section into
the full railhead section
• Ensuring no negative performance issues result compared to the current switch point design
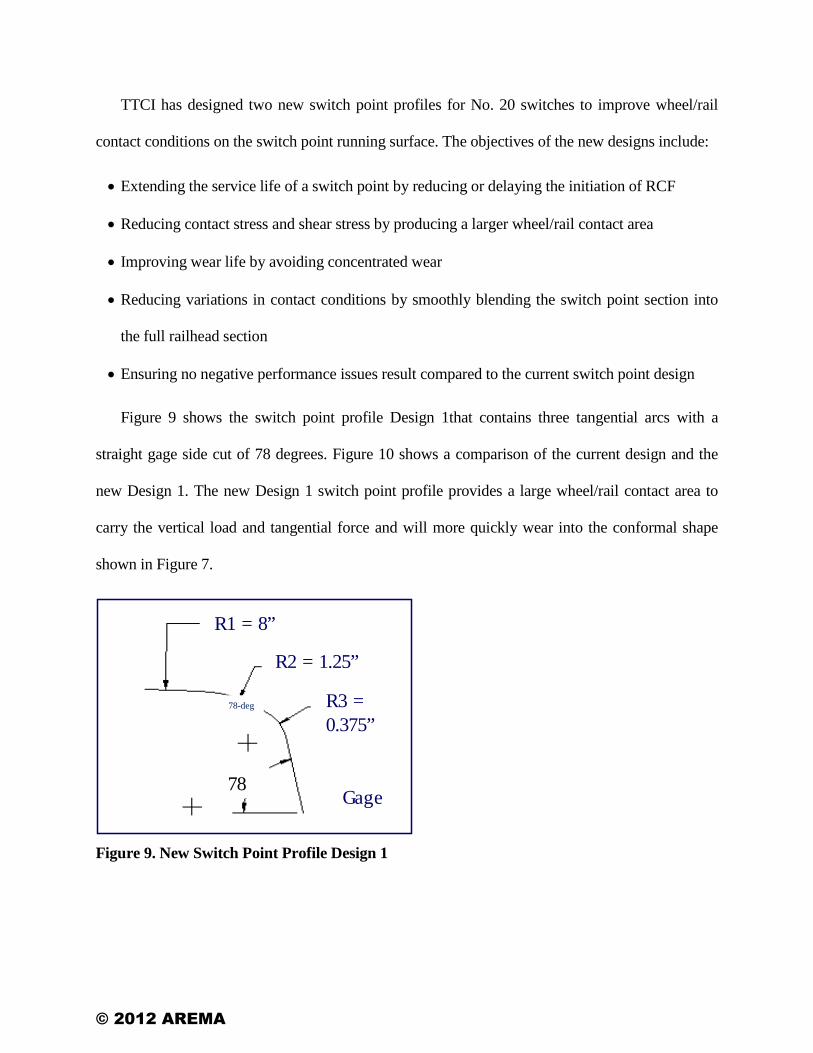
Figure 9 shows the switch point profile Design 1that contains three tangential arcs with a
straight gage side cut of 78 degrees. Figure 10 shows a comparison of the current design and the
new Design 1. The new Design 1 switch point profile provides a large wheel/rail contact area to
carry the vertical load and tangential force and will more quickly wear into the conformal shape
shown in Figure 7.
78Gage
R1 = 8”
R2 = 1.25”
R3 = 0.375”
Figure 9. New Switch Point Profile Design 1
78-deg
© 2012 AREMA

Current Design
New Design
For No. 20 Switch
Figure 10. Comparison of the Current Switch and the New Switch Point Profile Design 1
To simplify the machining process and use an existing cutting tool, an alternative switch
point profile design (Design 2) has been developed. This switch point profile has a 1-inch radius at
the switch point gage corner. It maintains the 78-degree gage side cut and has a flat top (or 1:20
slope) cut that is tangential to the 1-inch radius arc, as Figure 11 shows.
Design 2 maintains the desired contact features (Figure 12) produced using Design 1.
Because the 1-inch radius arc is not tangential to the 78-degree line, it creates a small kink at the
intersection point of the two segments that must be smoothed during production. This switch point
should quickly wear into a conformal shape with the commonly worn wheel profile shape.
78-degree line
Gage
R = 1 inch
Kink at intersection point that must be smoothed
Figure 11. New Switch Point Profile Design 2
© 2012 AREMA
R = 1 inch Design 2
3 arcs Design 1
For No. 20 Switch
Wheel
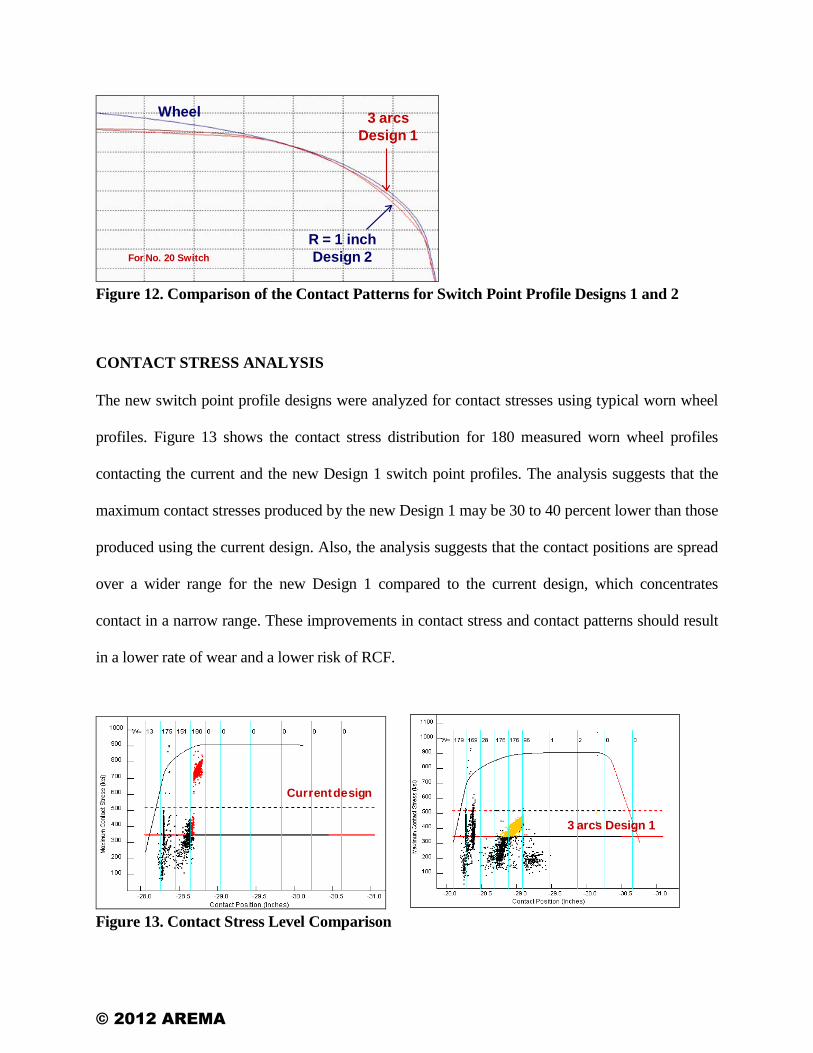
Figure 12. Comparison of the Contact Patterns for Switch Point Profile Designs 1 and 2
CONTACT STRESS ANALYSIS
The new switch point profile designs were analyzed for contact stresses using typical worn wheel
profiles. Figure 13 shows the contact stress distribution for 180 measured worn wheel profiles
contacting the current and the new Design 1 switch point profiles. The analysis suggests that the
maximum contact stresses produced by the new Design 1 may be 30 to 40 percent lower than those
produced using the current design. Also, the analysis suggests that the contact positions are spread
over a wider range for the new Design 1 compared to the current design, which concentrates
contact in a narrow range. These improvements in contact stress and contact patterns should result
in a lower rate of wear and a lower risk of RCF.
Current design
Figure 13. Contact Stress Level Comparison
3 arcs Design 1
© 2012 AREMA

SWITCH POINT TOP CUT MODIFICATIONS
As Figure 10 shows, to increase the size of the wheel/rail contact area, the switch point top of the
new design is slightly higher than the current design in the load-carrying zone from 9 to 19 feet
from the switch point tip. The top cut slopes for the first and second cuts, and the length of the
second cut have been adjusted to keep the switch point tip elevation the same as in the current
design.
PROTOTYPE TESTS
Prototype switch points involved in revenue service testing on BNSF and UP lines were built by
two separate switch suppliers.
The BNSF test consists of a No. 20 crossover at East Marceline, Missouri. One turnout has
prototype switch points, while the other has AREMA style profile switch points. Figure 14 shows
the Marceline test site.
Figure 14. No. 20 Turnout with Prototype Switch Points on BNSF at Marceline
Traffic at Marceline consists of intermodal, mixed freight, unit grain, and passenger trains.
Traffic levels are approximately 60 MGT/yr on each track.
The UP test consists of four No. 20 turnouts at Bonner Springs, Kansas, and Linn, Kansas.
These are installed in three crossovers. One crossover, at Linn, has two turnouts: one with
© 2012 AREMA
prototype and one with AREMA style profile switch points. A second turnout with prototype
switch points is installed near Bonner Springs.. The second turnout with AREMA style profile
points is installed at the control point west of Linn.. All four turnouts are within a 10-mile segment
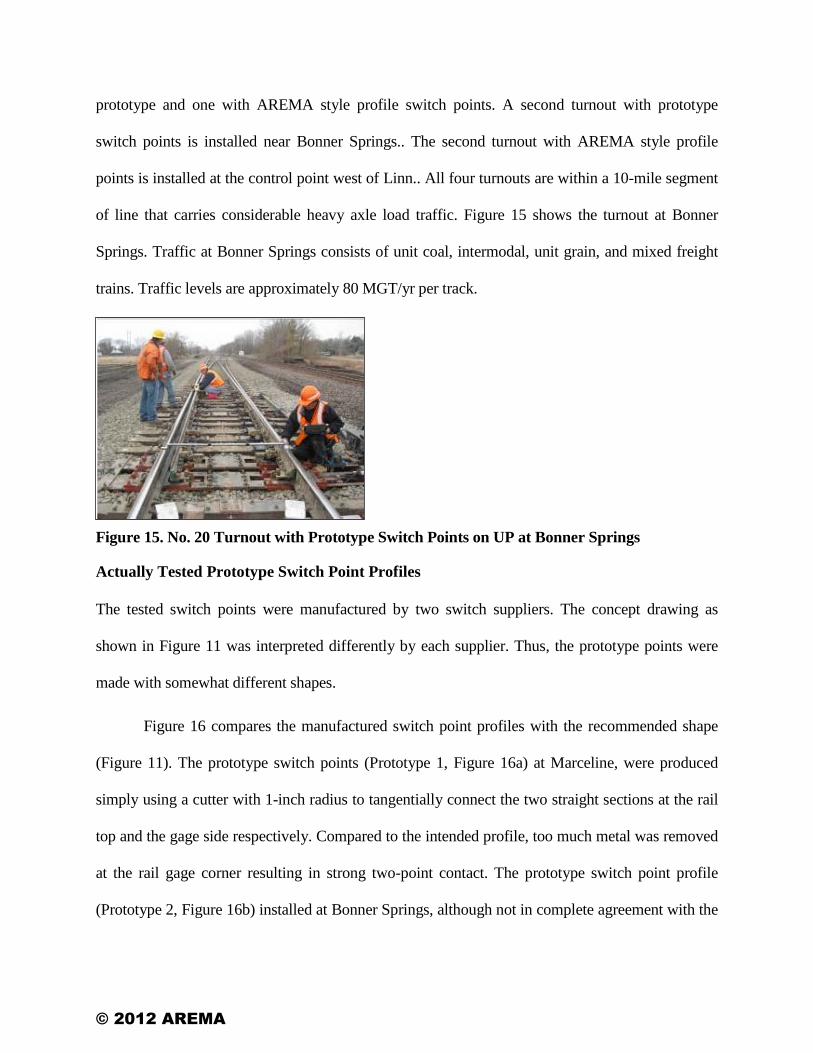
of line that carries considerable heavy axle load traffic. Figure 15 shows the turnout at Bonner
Springs. Traffic at Bonner Springs consists of unit coal, intermodal, unit grain, and mixed freight
trains. Traffic levels are approximately 80 MGT/yr per track.
Figure 15. No. 20 Turnout with Prototype Switch Points on UP at Bonner Springs
Actually Tested Prototype Switch Point Profiles
The tested switch points were manufactured by two switch suppliers. The concept drawing as
shown in Figure 11 was interpreted differently by each supplier. Thus, the prototype points were
made with somewhat different shapes.
Figure 16 compares the manufactured switch point profiles with the recommended shape
(Figure 11). The prototype switch points (Prototype 1, Figure 16a) at Marceline, were produced
simply using a cutter with 1-inch radius to tangentially connect the two straight sections at the rail
top and the gage side respectively. Compared to the intended profile, too much metal was removed
at the rail gage corner resulting in strong two-point contact. The prototype switch point profile
(Prototype 2, Figure 16b) installed at Bonner Springs, although not in complete agreement with the
© 2012 AREMA
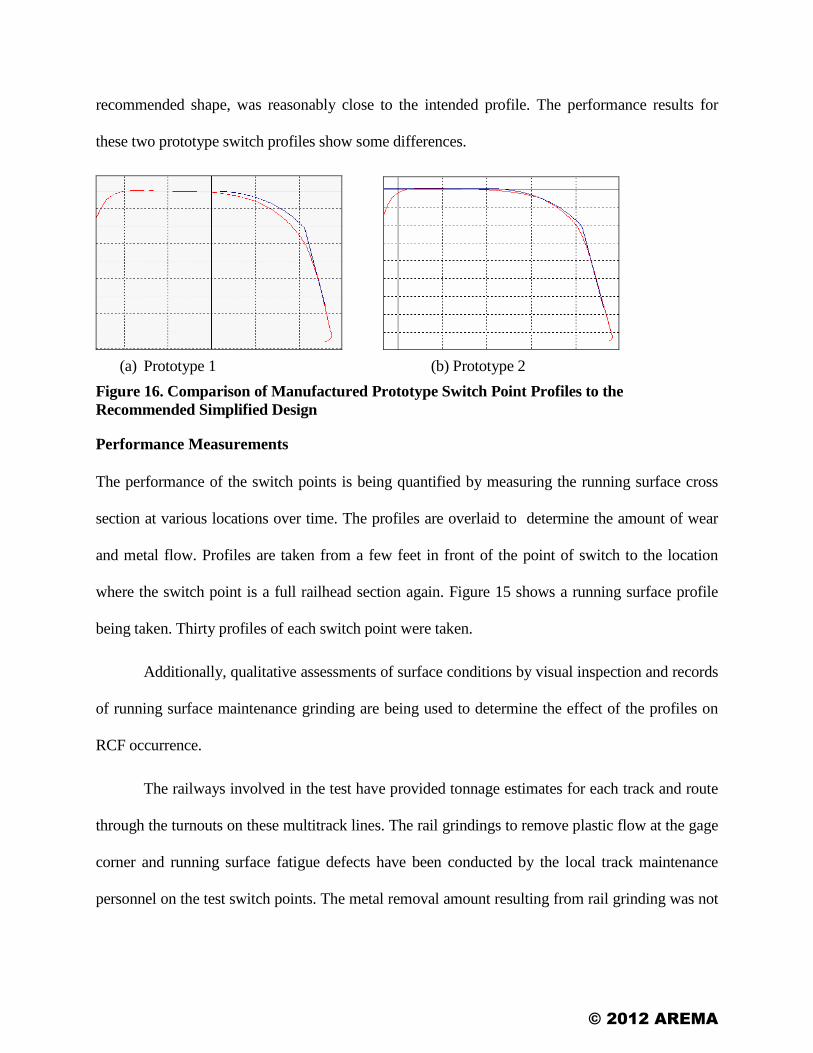
recommended shape, was reasonably close to the intended profile. The performance results for
these two prototype switch profiles show some differences.
(a) Prototype 1 (b) Prototype 2
Figure 16. Comparison of Manufactured Prototype Switch Point Profiles to the Recommended Simplified Design
Performance Measurements
The performance of the switch points is being quantified by measuring the running surface cross
section at various locations over time. The profiles are overlaid to determine the amount of wear
and metal flow. Profiles are taken from a few feet in front of the point of switch to the location
where the switch point is a full railhead section again. Figure 15 shows a running surface profile
being taken. Thirty profiles of each switch point were taken.
Additionally, qualitative assessments of surface conditions by visual inspection and records
of running surface maintenance grinding are being used to determine the effect of the profiles on
RCF occurrence.
The railways involved in the test have provided tonnage estimates for each track and route
through the turnouts on these multitrack lines. The rail grindings to remove plastic flow at the gage
corner and running surface fatigue defects have been conducted by the local track maintenance
personnel on the test switch points. The metal removal amount resulting from rail grinding was not
© 2012 AREMA
always measured, because of logistical issues. This paper discusses the performance trends of the
standard switch point and the two types of prototype switch profiles described in Figure 16.
Trends of Performance Results
Standard Switch Points
The standard switch points from two switch suppliers at the two test sites produced similar wear
patterns as in the previous survey (Figure 8).
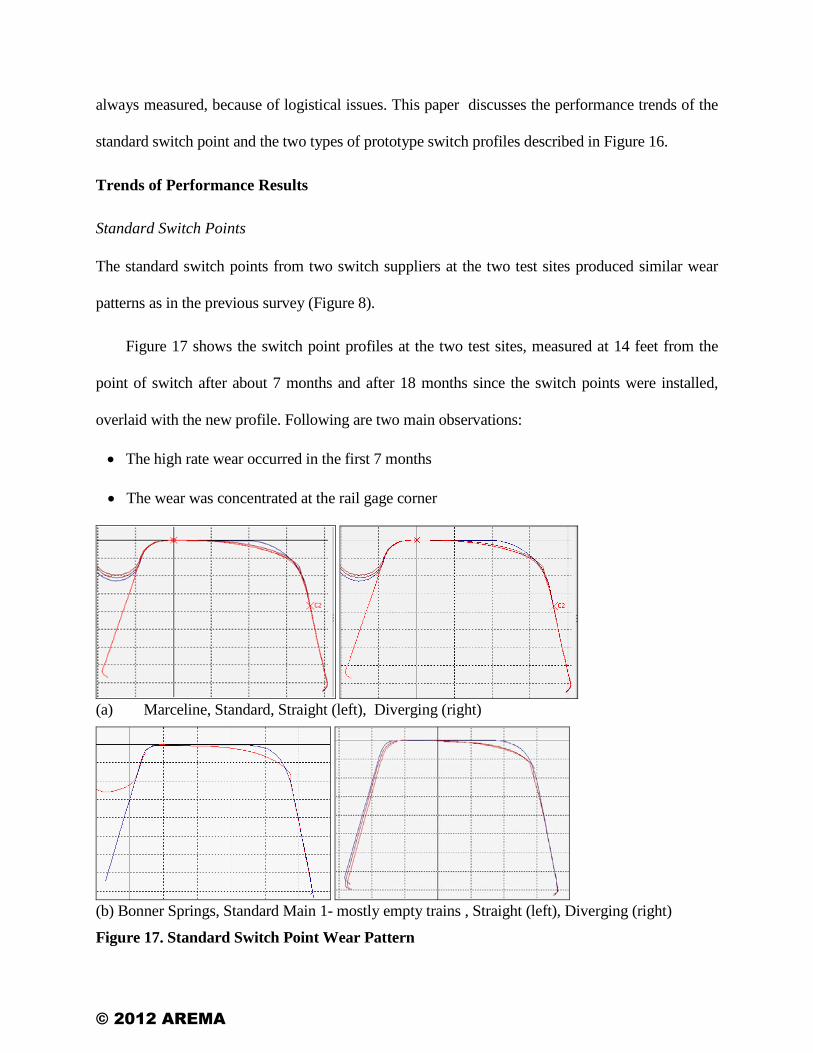
Figure 17 shows the switch point profiles at the two test sites, measured at 14 feet from the
point of switch after about 7 months and after 18 months since the switch points were installed,
overlaid with the new profile. Following are two main observations:
• The high rate wear occurred in the first 7 months
• The wear was concentrated at the rail gage corner
(a) Marceline, Standard, Straight (left), Diverging (right)
(b) Bonner Springs, Standard Main 1- mostly empty trains , Straight (left), Diverging (right)
Figure 17. Standard Switch Point Wear Pattern
© 2012 AREMA

Figure 18 is a photo of the standard switch point taken 7 months after the installation at
Marceline, which shows the surface damage at the rail gage corner. Rail grinding (using a hand
grinder) was conducted a few days before for the purpose of removing the plastic flow at the gage
corner.
Figure 18. Standard, Straight, about 14 feet (measurement position 22) from the Point of Switch, Grinding had been Conducted to Remove the Gage Flow – April 2011
Prototype Switch Points
Figure 19 shows the wear patterns for two variations of the prototype switch point profile at a
similar distance from the switch point as that shown in Figure 17 and during the same time.
Compared to the standard switch point profile, performance results from the prototype profiles
show the following features:
• Both versions of the prototype profile did not show the concentrated wear at the rail gage
corner as seen on the standard profile. The wear was mainly spread at the rail top, indicating a
larger wheel/rail contact area.
• The wear at this location during the same service period was lower than that on the standard
profile.
© 2012 AREMA
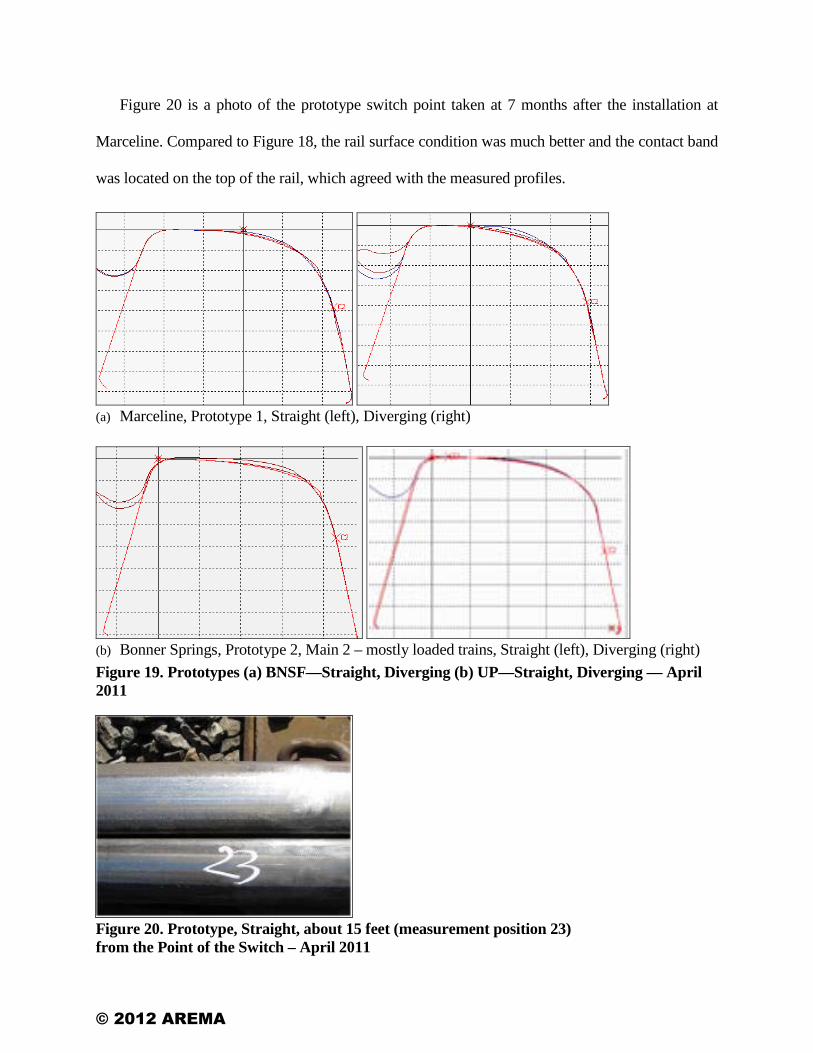
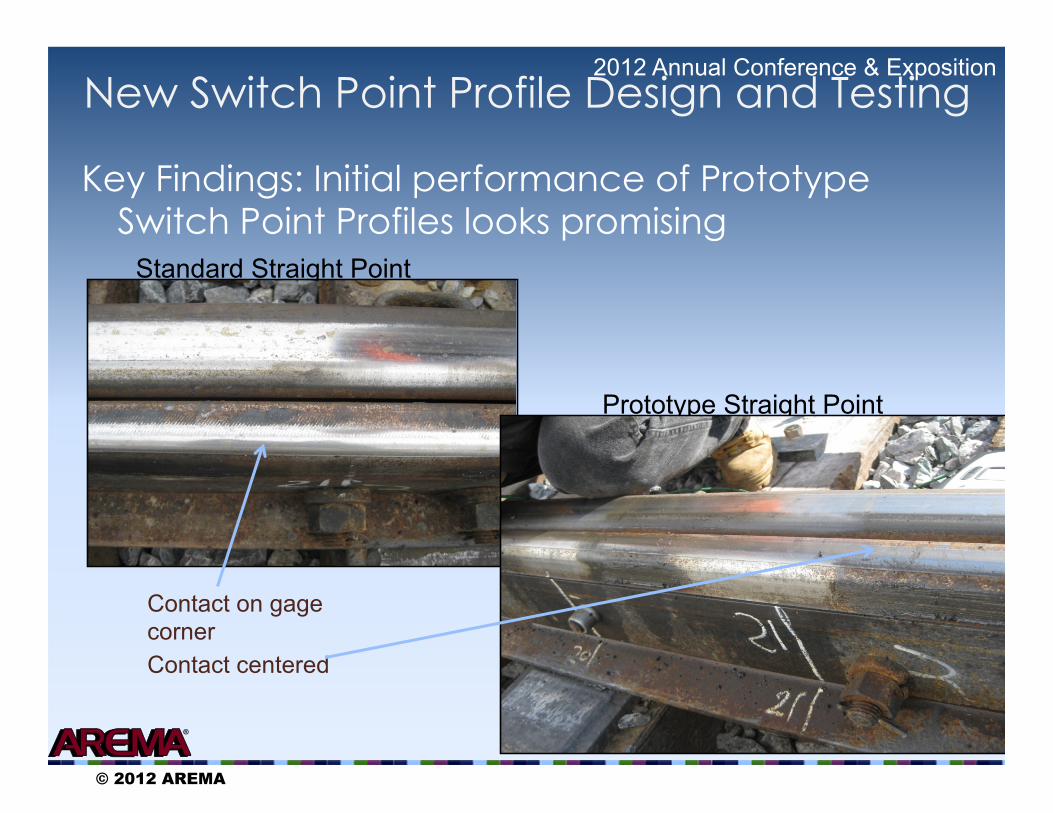
Figure 20 is a photo of the prototype switch point taken at 7 months after the installation at
Marceline. Compared to Figure 18, the rail surface condition was much better and the contact band
was located on the top of the rail, which agreed with the measured profiles.
(a) Marceline, Prototype 1, Straight (left), Diverging (right)
(b) Bonner Springs, Prototype 2, Main 2 – mostly loaded trains, Straight (left), Diverging (right) Figure 19. Prototypes (a) BNSF—Straight, Diverging (b) UP—Straight, Diverging — April 2011
Figure 20. Prototype, Straight, about 15 feet (measurement position 23) from the Point of the Switch – April 2011
© 2012 AREMA
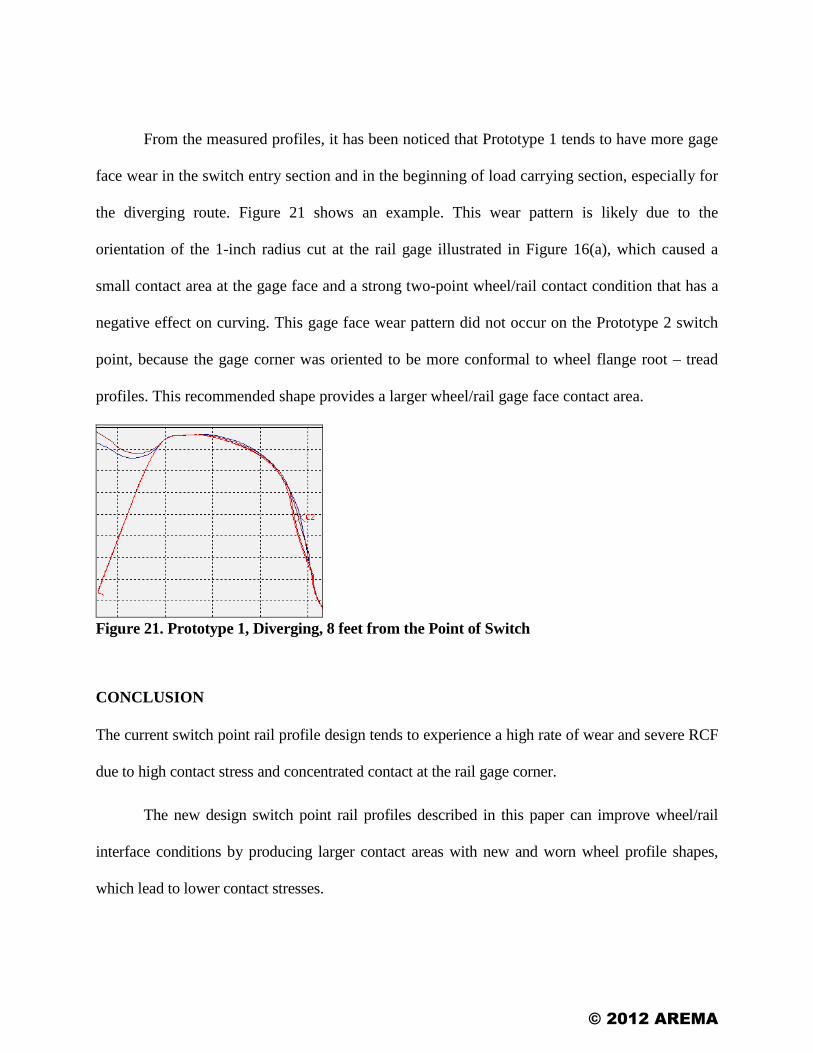
From the measured profiles, it has been noticed that Prototype 1 tends to have more gage
face wear in the switch entry section and in the beginning of load carrying section, especially for
the diverging route. Figure 21 shows an example. This wear pattern is likely due to the
orientation of the 1-inch radius cut at the rail gage illustrated in Figure 16(a), which caused a
small contact area at the gage face and a strong two-point wheel/rail contact condition that has a
negative effect on curving. This gage face wear pattern did not occur on the Prototype 2 switch
point, because the gage corner was oriented to be more conformal to wheel flange root – tread
profiles. This recommended shape provides a larger wheel/rail gage face contact area.
Figure 21. Prototype 1, Diverging, 8 feet from the Point of Switch
CONCLUSION
The current switch point rail profile design tends to experience a high rate of wear and severe RCF
due to high contact stress and concentrated contact at the rail gage corner.
The new design switch point rail profiles described in this paper can improve wheel/rail
interface conditions by producing larger contact areas with new and worn wheel profile shapes,
which lead to lower contact stresses.
© 2012 AREMA
The track tests conducted on revenue service lines again confirmed the previous
observations on the current standard switch point profile, showing it produces concentrated wear
and causes surface damage in the early stages of service life.
The track test also indicated that the contact positions for both prototypes of switch point
profiles moved away from the rail gage corner. An indication of the robustness of the design was
inadvertently obtained when two variants of the design profile were made. While both provided
significant improvement over the currently used profile, the prototype that was closer to the
recommended shape produced better wear patterns, lower wear rates, and less rail surface damage.
Therefore, the new designed switch point profiles are expected to increase switch point life
by reducing wear and delaying the initiation of RCF.
WAY FORWARD
The prototype switch points have provided benefits in terms of decreased wear and running surface
maintenance in two heavy haul revenue service tests. Further monitoring of the prototypes will
establish the life-cycle cost improvements likely to be derived. With no adverse effects noted in the
prototype tests, a wider scale implementation is warranted. Additional effort is needed to perfect
the manufacturing processes for the simplified point design. Also, a determination of the likely
payback from using the more complex 3-arc profile will be made.
ACKNOWLEDGEMENTS
The authors wish to thank the BNSF Railway and the Union Pacific Railroad for their assistance
in evaluating the prototype switch points in revenue service. These railways and CSX
contributed significantly to the development of the prototype designs. In particular, John
Bosshart, Seth Ogan, Eric Gehringer, Jim Beyerl and Dave Clark contributed their experience
and ideas to developing the prototypes.
© 2012 AREMA
REFERENCES
1. Wu, H., Madrill, B., and Davis, D. March 2010. “New Rail Profile Designs for Switch Points.”
Technology Digest TD-10-011, Association of American Railroads, Transportation Technology
Center, Inc., Pueblo, Colorado.
2. American Railway Engineering and Maintenance-of-Way Association. 2008. Plan 127-08,
Portfolio of Trackwork Plans, Lanham, Maryland.
© 2012 AREMA

September 16-19, 2012 Chicago, IL
2012 Annual Conference & Exposition
SWITCH POINT PROFILE DESIGN AND REVENUE SERVICE
PROTOTYPE EVALUATION
David Davis and Huimin Wu Transportation Technology Center, Inc.
Transportation Technology Center, Inc.
®
© 2012 AREMA
September 16-19, 2012 Chicago, IL
2012 Annual Conference & Exposition
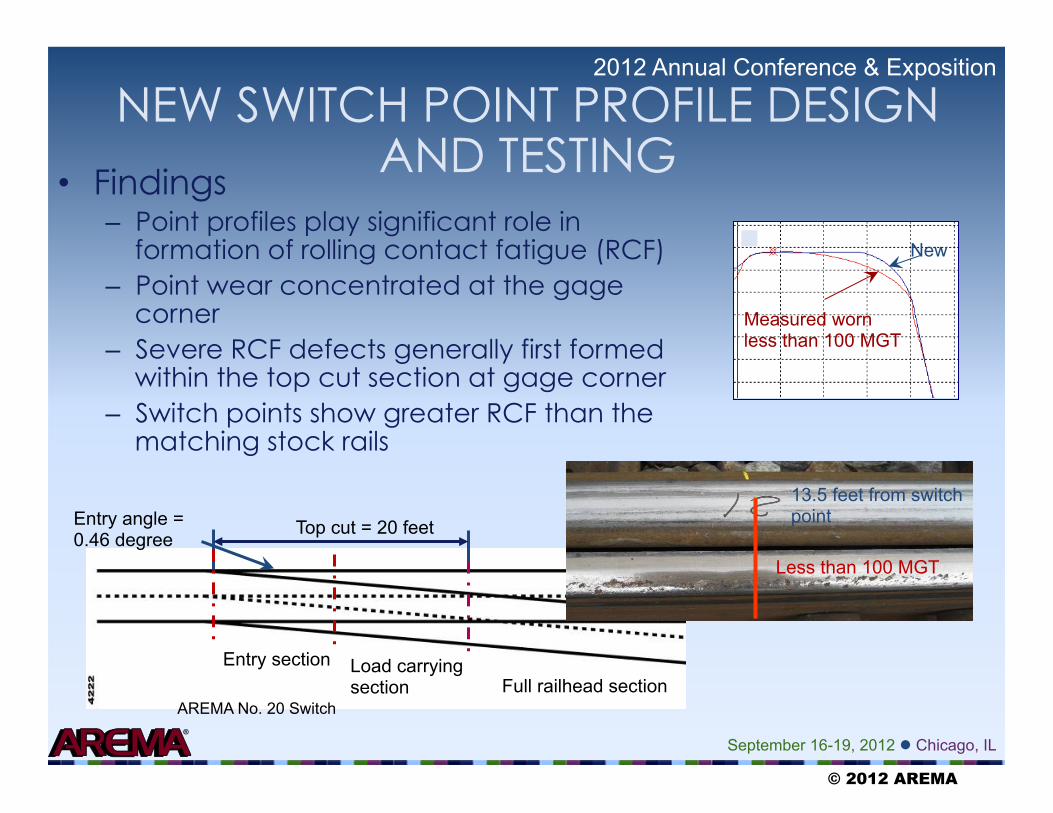
• Findings – Point profiles play significant role in
formation of rolling contact fatigue (RCF) – Point wear concentrated at the gage
corner – Severe RCF defects generally first formed
within the top cut section at gage corner – Switch points show greater RCF than the
matching stock rails
Top cut = 20 feet Entry angle = 0.46 degree
Entry section Load carrying section Full railhead section
13.5 feet from switch point
AREMA No. 20 Switch
New
Measured worn less than 100 MGT
Less than 100 MGT
NEW SWITCH POINT PROFILE DESIGN AND TESTING
© 2012 AREMA
September 16-19, 2012 Chicago, IL
2012 Annual Conference & Exposition
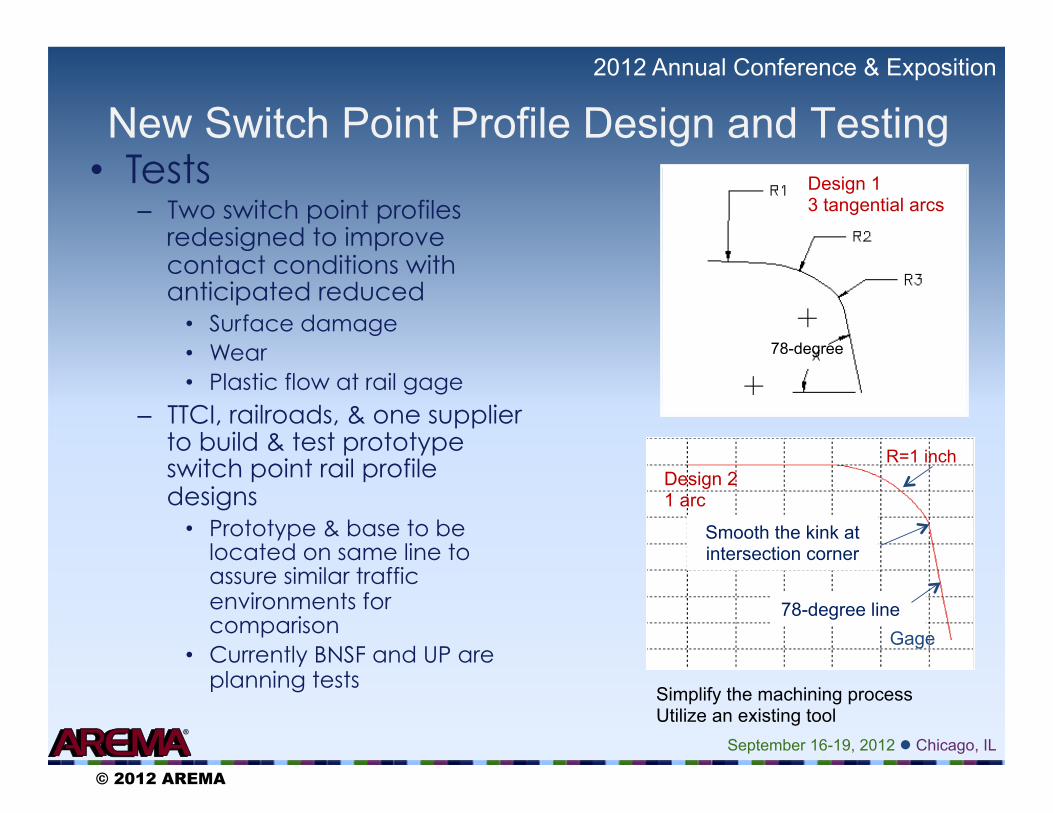
• Tests – Two switch point profiles
redesigned to improve contact conditions with anticipated reduced
• Surface damage • Wear • Plastic flow at rail gage
– TTCI, railroads, & one supplier to build & test prototype switch point rail profile designs
• Prototype & base to be located on same line to assure similar traffic environments for comparison
• Currently BNSF and UP are planning tests
78-degree line Gage
R=1 inch
Smooth the kink at intersection corner
78-degree
Design 1 3 tangential arcs
Design 2 1 arc
New Switch Point Profile Design and Testing
Simplify the machining process Utilize an existing tool
© 2012 AREMA
September 16-19, 2012 Chicago, IL
2012 Annual Conference & Exposition
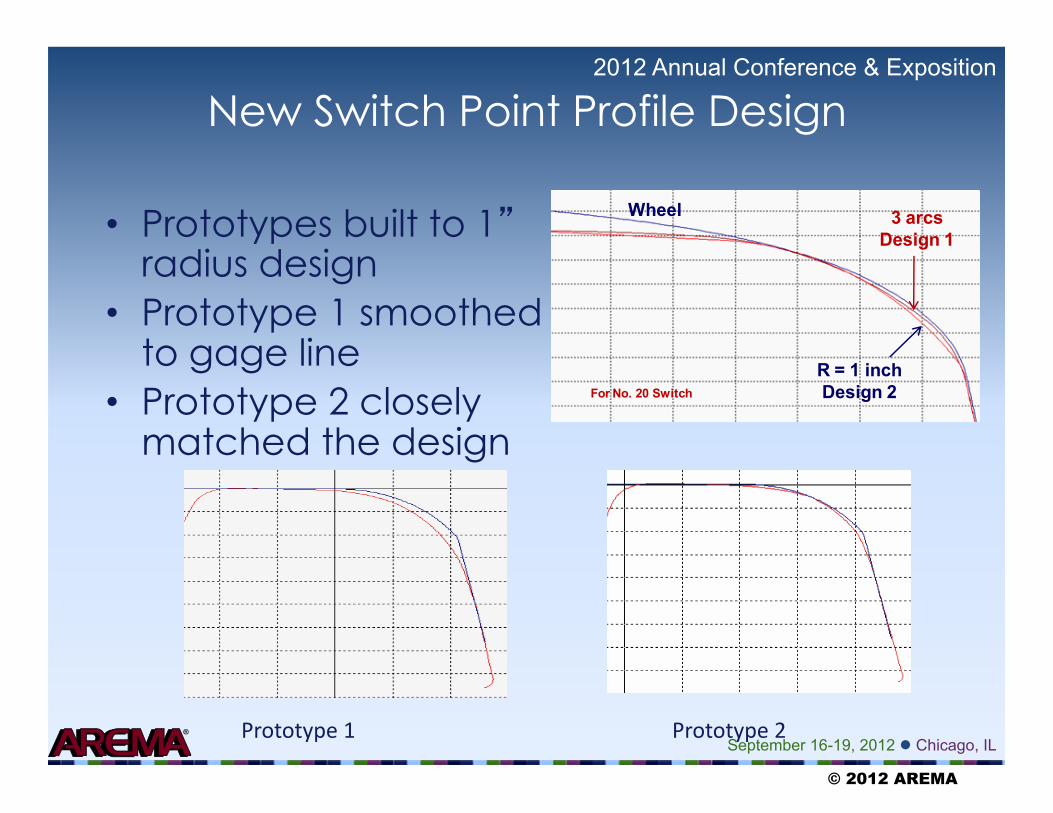
New Switch Point Profile Design
R = 1 inch Design 2
3 arcs Design 1
For No. 20 Switch
Wheel• Prototypes built to 1” radius design
• Prototype 1 smoothed to gage line
• Prototype 2 closely matched the design
Prototype 1 Prototype 2
© 2012 AREMA
September 16-19, 2012 Chicago, IL
2012 Annual Conference & Exposition
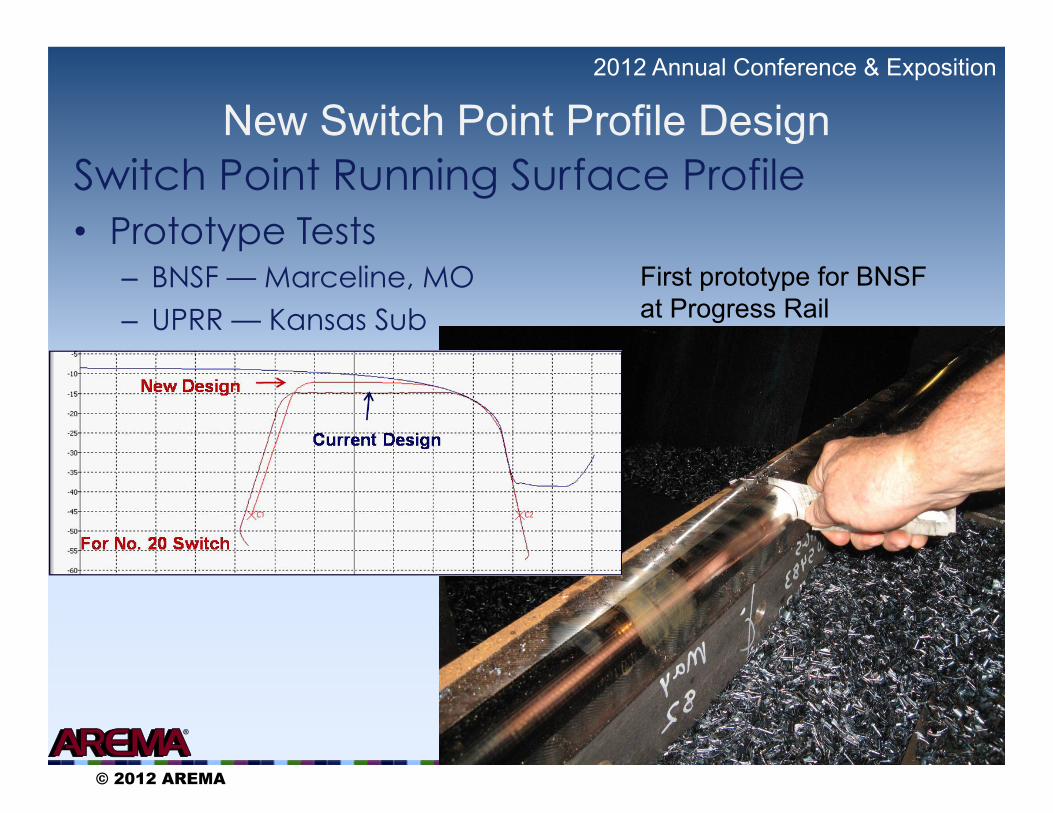
New Switch Point Profile Design Switch Point Running Surface Profile • Prototype Tests
– BNSF — Marceline, MO – UPRR — Kansas Sub
First prototype for BNSF at Progress Rail
© 2012 AREMA
September 16-19, 2012 Chicago, IL
2012 Annual Conference & Exposition
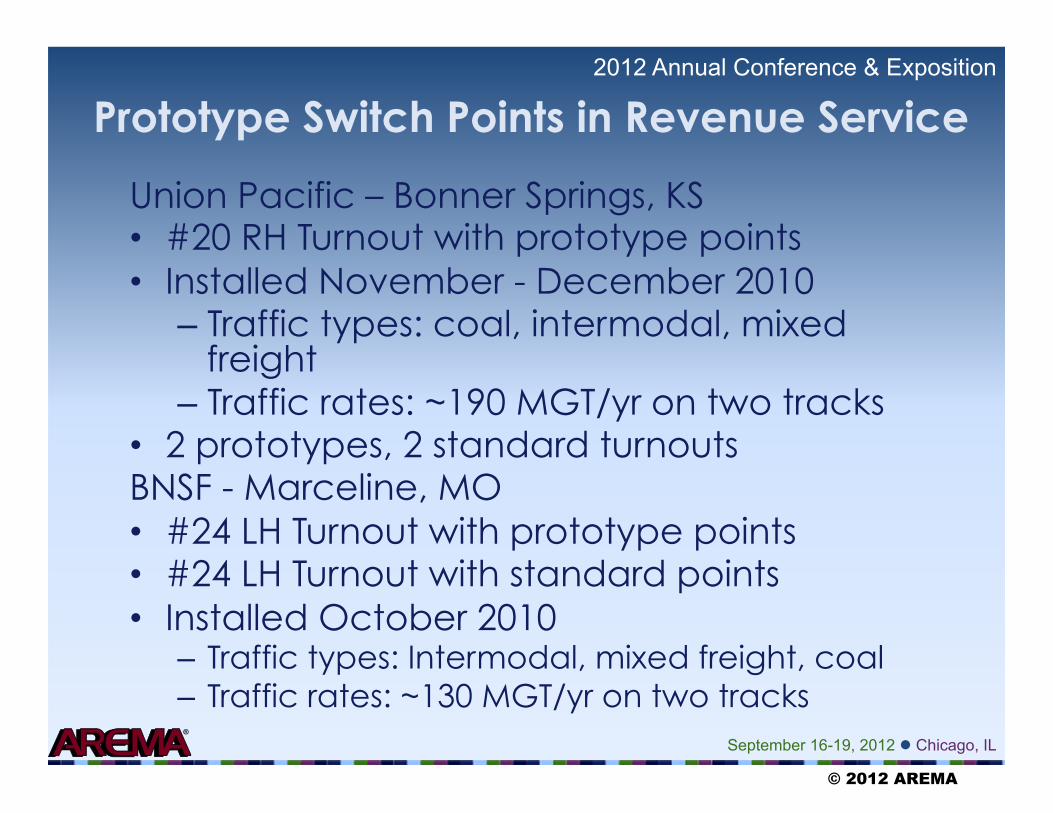
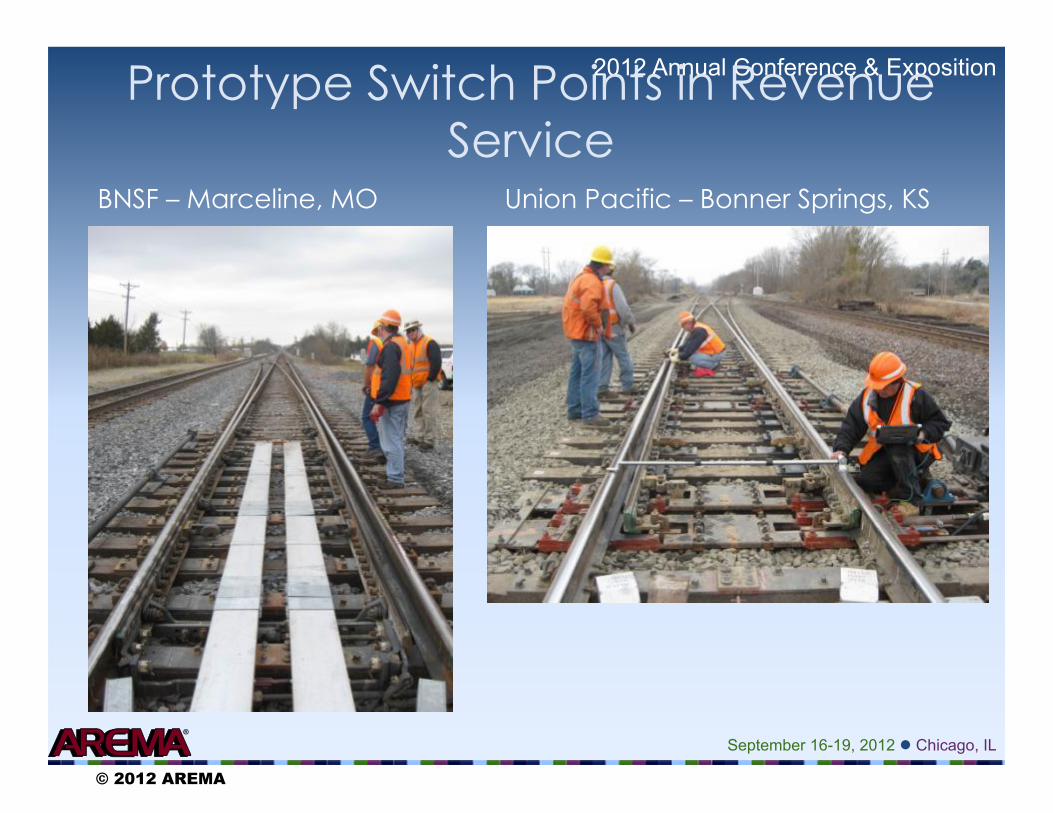
Prototype Switch Points in Revenue Service
Union Pacific – Bonner Springs, KS • #20 RH Turnout with prototype points • Installed November - December 2010
– Traffic types: coal, intermodal, mixed freight
– Traffic rates: ~190 MGT/yr on two tracks • 2 prototypes, 2 standard turnouts BNSF - Marceline, MO • #24 LH Turnout with prototype points • #24 LH Turnout with standard points • Installed October 2010
– Traffic types: Intermodal, mixed freight, coal – Traffic rates: ~130 MGT/yr on two tracks
© 2012 AREMA
September 16-19, 2012 Chicago, IL
2012 Annual Conference & Exposition Prototype Switch Points in Revenue Service
Union Pacific – Bonner Springs, KS BNSF – Marceline, MO
© 2012 AREMA
September 16-19, 2012 Chicago, IL
2012 Annual Conference & Exposition
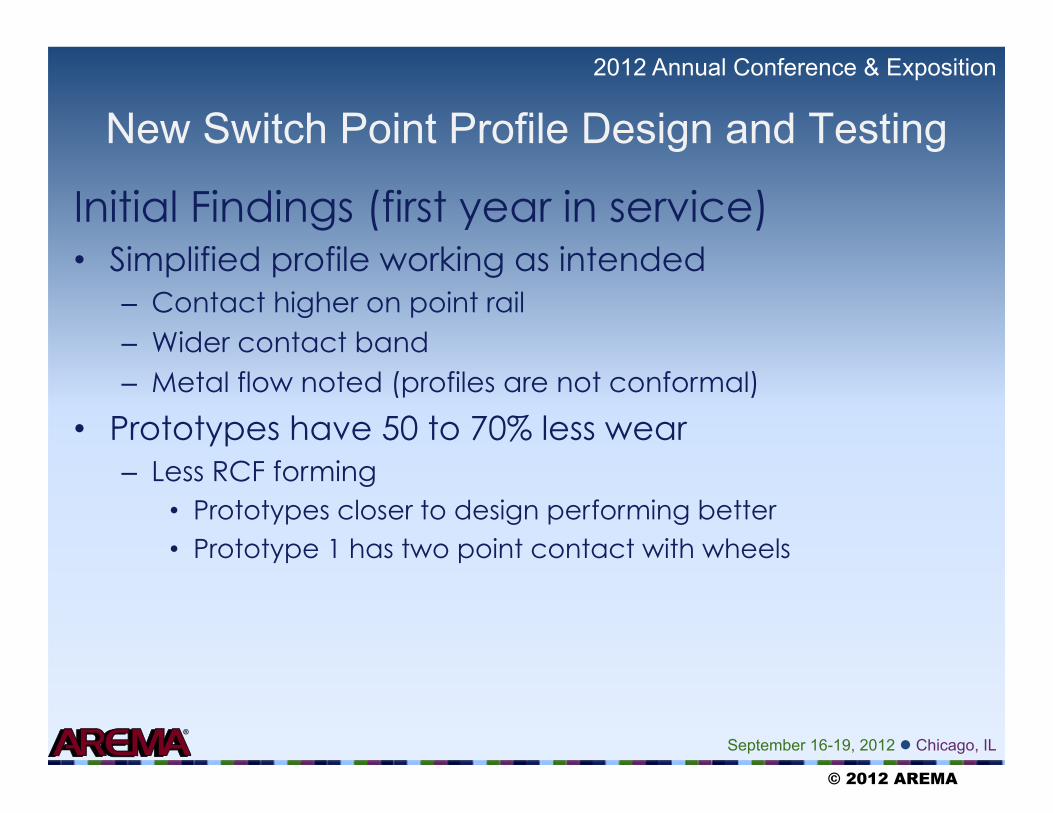
Initial Findings (first year in service) • Simplified profile working as intended
– Contact higher on point rail – Wider contact band – Metal flow noted (profiles are not conformal)
• Prototypes have 50 to 70% less wear – Less RCF forming
• Prototypes closer to design performing better • Prototype 1 has two point contact with wheels
New Switch Point Profile Design and Testing
© 2012 AREMA
September 16-19, 2012 Chicago, IL
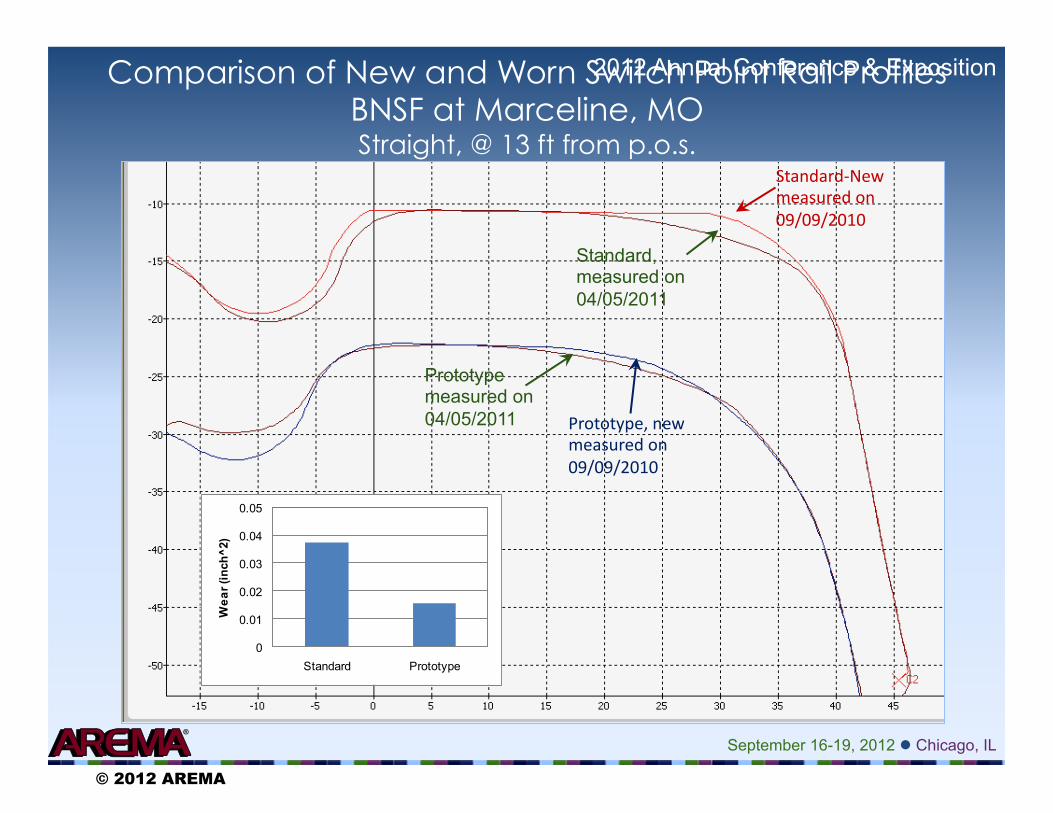
2012 Annual Conference & Exposition Comparison of New and Worn Switch Point Rail Profiles BNSF at Marceline, MO Straight, @ 13 ft from p.o.s.
Standard-‐New measured on 09/09/2010
Standard, measured on 04/05/2011
Prototype, new measured on 09/09/2010
Prototype measured on 04/05/2011
0
0.01
0.02
0.03
0.04
0.05
Standard Prototype
Wea
r (in
ch^2
)
© 2012 AREMA
September 16-19, 2012 Chicago, IL
2012 Annual Conference & Exposition
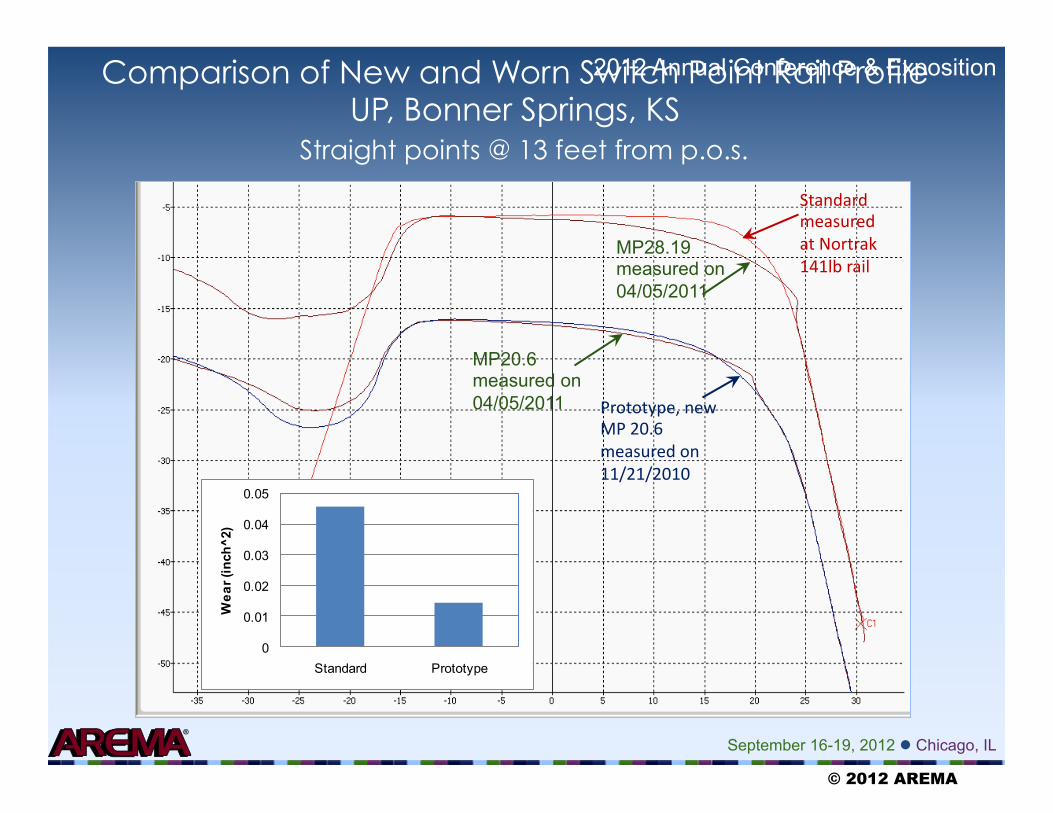
Prototype, new MP 20.6 measured on 11/21/2010
MP20.6 measured on 04/05/2011
Standard measured at Nortrak 141lb rail
MP28.19 measured on 04/05/2011
Comparison of New and Worn Switch Point Rail Profile UP, Bonner Springs, KS
Straight points @ 13 feet from p.o.s.
0
0.01
0.02
0.03
0.04
0.05
Standard Prototype
Wea
r (in
ch^2
)
© 2012 AREMA
September 16-19, 2012 Chicago, IL
2012 Annual Conference & Exposition New Switch Point Profile Design and Testing
Key Findings: Initial performance of Prototype Switch Point Profiles looks promising
Prototype Straight Point
Standard Straight Point
Contact on gage corner Contact centered
© 2012 AREMA
September 16-19, 2012 Chicago, IL
2012 Annual Conference & Exposition
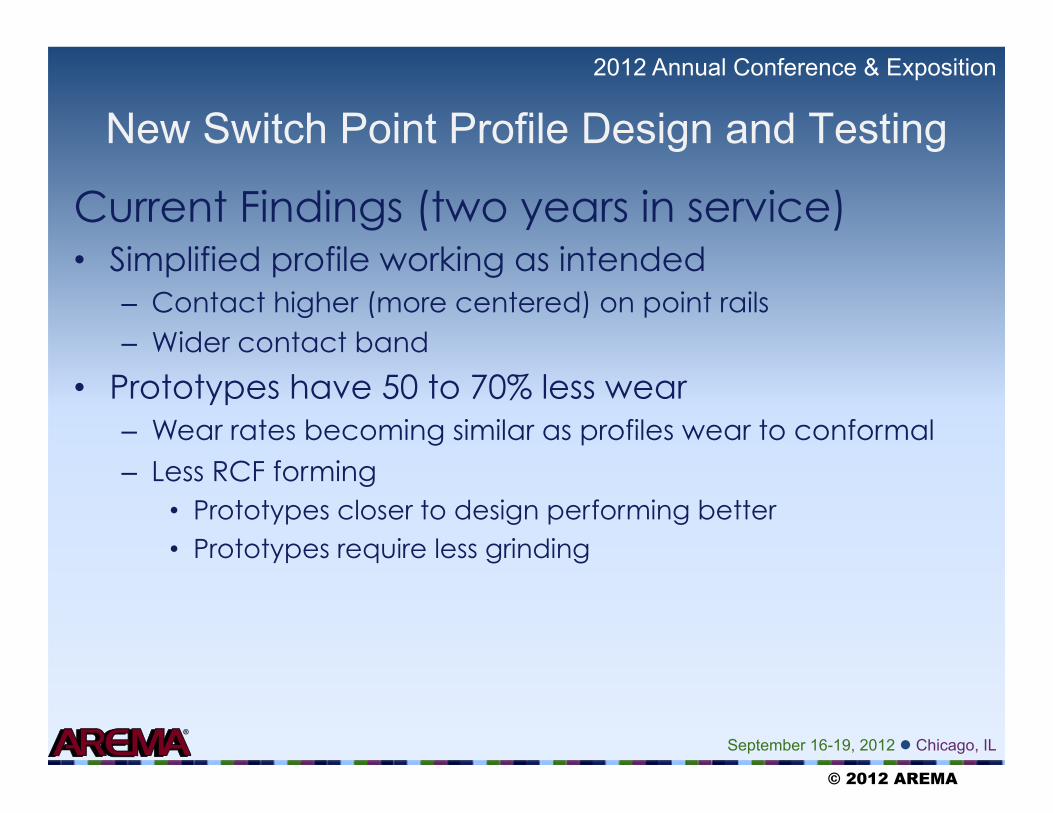
Current Findings (two years in service) • Simplified profile working as intended
– Contact higher (more centered) on point rails – Wider contact band
• Prototypes have 50 to 70% less wear – Wear rates becoming similar as profiles wear to conformal – Less RCF forming
• Prototypes closer to design performing better • Prototypes require less grinding
New Switch Point Profile Design and Testing
© 2012 AREMA
September 16-19, 2012 Chicago, IL
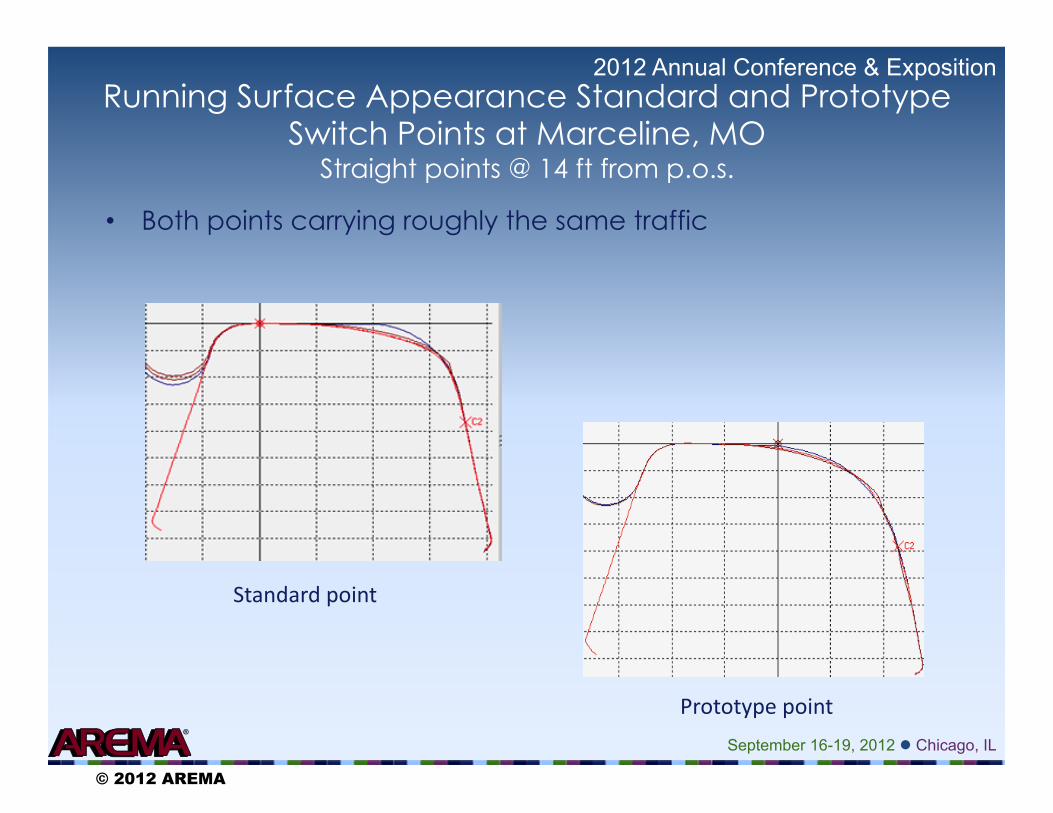
2012 Annual Conference & Exposition Running Surface Appearance Standard and Prototype
Switch Points at Marceline, MO Straight points @ 14 ft from p.o.s.
Standard point
Prototype point
• Both points carrying roughly the same traffic
© 2012 AREMA
September 16-19, 2012 Chicago, IL
2012 Annual Conference & Exposition
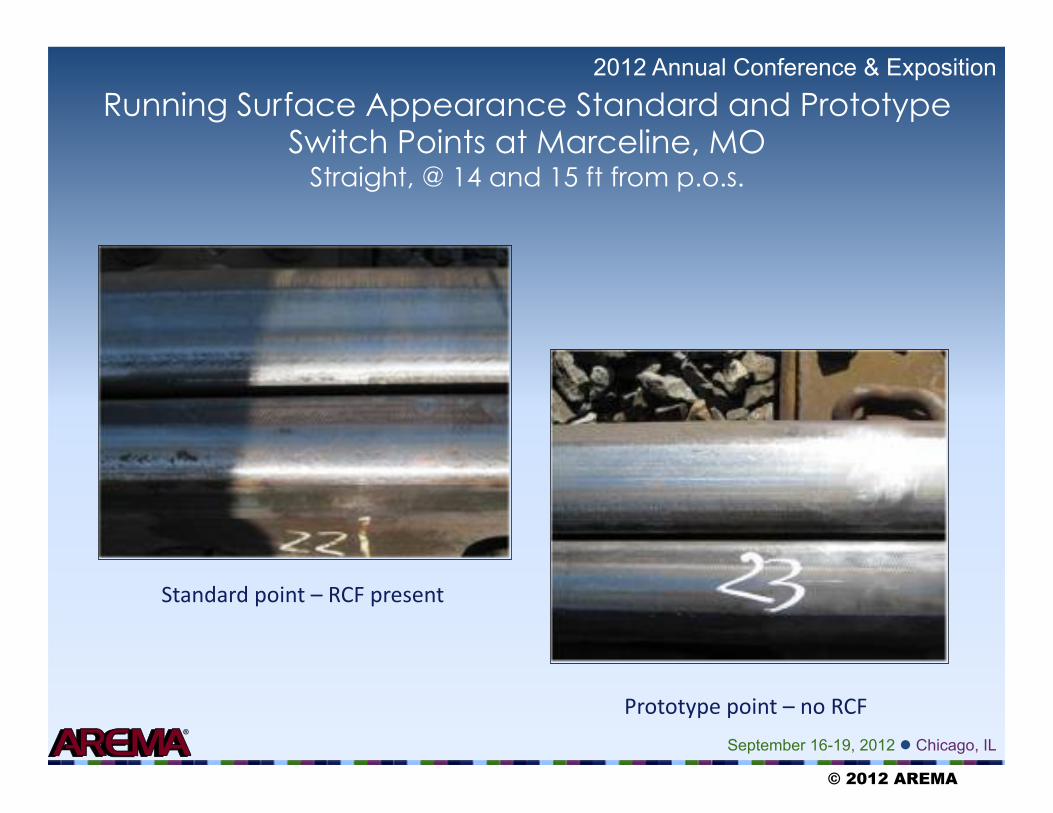
Running Surface Appearance Standard and Prototype Switch Points at Marceline, MO
Straight, @ 14 and 15 ft from p.o.s.
Standard point – RCF present
Prototype point – no RCF
© 2012 AREMA
September 16-19, 2012 Chicago, IL
2012 Annual Conference & Exposition
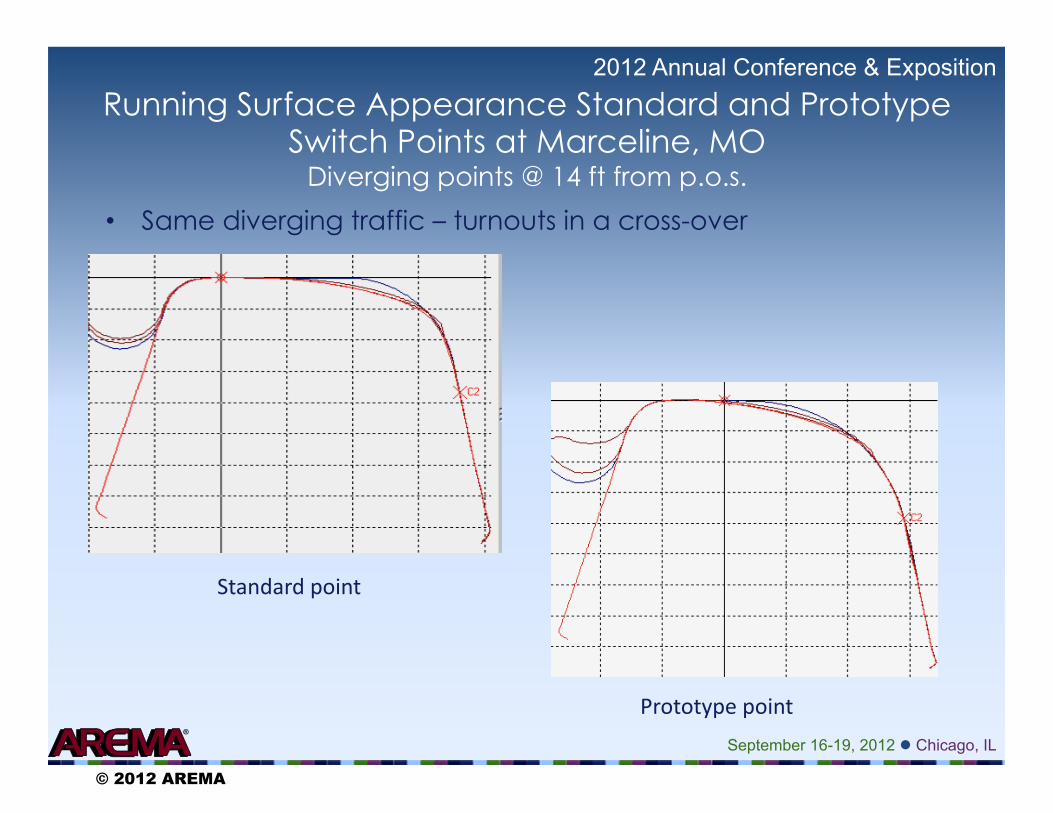
Running Surface Appearance Standard and Prototype Switch Points at Marceline, MO
Diverging points @ 14 ft from p.o.s.
Standard point
Prototype point
• Same diverging traffic – turnouts in a cross-over
© 2012 AREMA
September 16-19, 2012 Chicago, IL
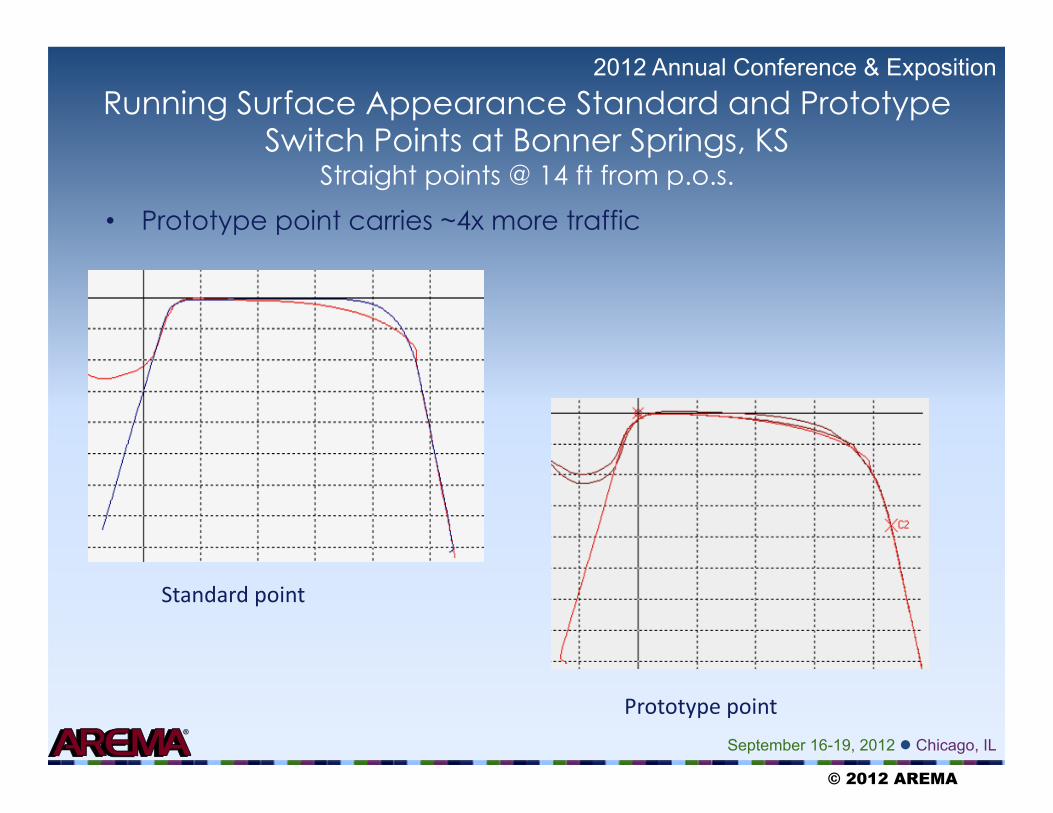
2012 Annual Conference & Exposition Running Surface Appearance Standard and Prototype
Switch Points at Bonner Springs, KS Straight points @ 14 ft from p.o.s.
Standard point
Prototype point
• Prototype point carries ~4x more traffic
© 2012 AREMA
September 16-19, 2012 Chicago, IL
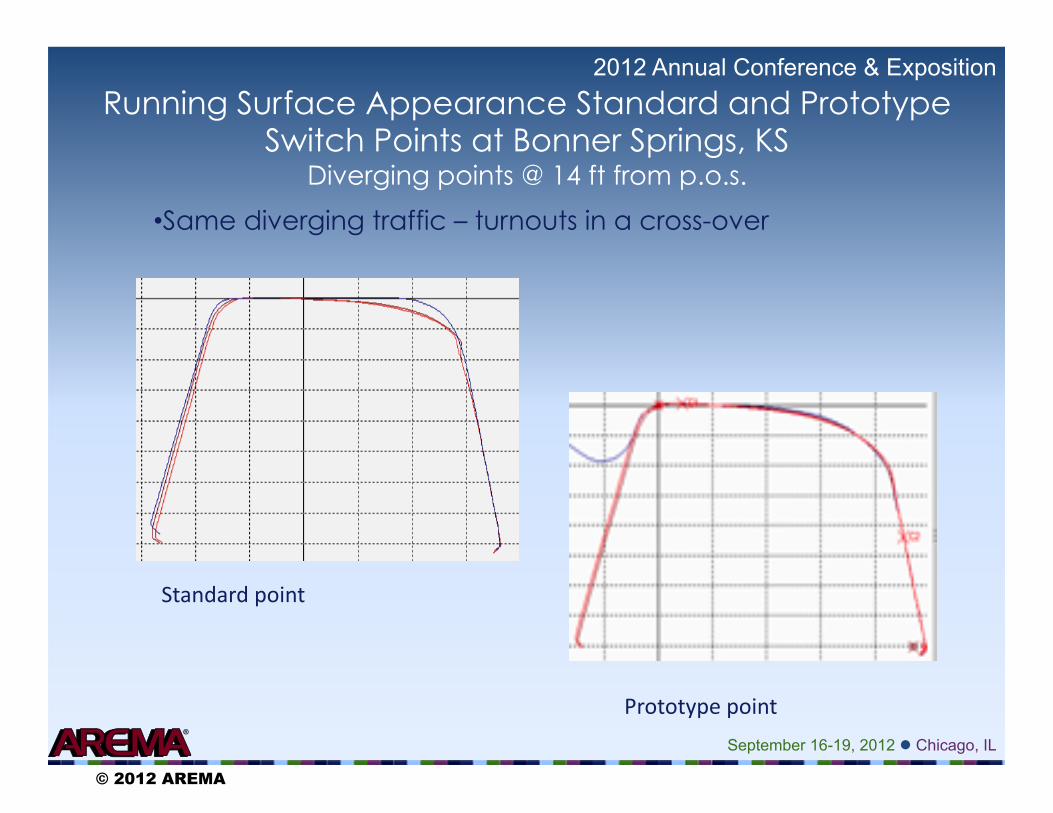
2012 Annual Conference & Exposition Running Surface Appearance Standard and Prototype
Switch Points at Bonner Springs, KS Diverging points @ 14 ft from p.o.s.
Standard point
Prototype point
• Same diverging traffic – turnouts in a cross-over
© 2012 AREMA
September 16-19, 2012 Chicago, IL
2012 Annual Conference & Exposition
Conclusions • Simplified profile working as intended
– Care should be taken to orient 1 inch radius to match canted rail
– Significant reduction in wear (>50%) – Less RCF forming
• Prototypes closer to design performing better
• Study whether 3 radius design is feasible
New Switch Point Profile Design and Testing
© 2012 AREMA
September 16-19, 2012 Chicago, IL
2012 Annual Conference & Exposition
Acknowledgements • Railway test and design support
– BNSF: John Bosshart, Seth Ogan – UPRR: Eric Gehringer, Chris Rewczuk – CSX: Jim Beyerl, Dave Clark
• Prototype manufacturing – Progress Rail: Russ Hein – VAE-Nortrak: Gary Click, Ron Geitner
New Switch Point Profile Design and Testing
Transportation Technology Center, Inc.
®
© 2012 AREMA