Swiss Real SnapShot! - KPMG | US · PDF filefinancial crisis six years ago, ... SXI Real...
22
Swiss Real SnapShot! Current developments in the Swiss real estate investment market Scrapping of the Euro / Franc exchange rate control – a double-edged sword for real estate investments Spring Edition 2015
Transcript of Swiss Real SnapShot! - KPMG | US · PDF filefinancial crisis six years ago, ... SXI Real...
Swiss Real SnapShot!Current developments in the Swiss real estate investment market
Scrapping of the Euro / Franc exchange rate control – a double-edged sword for real estate investments
Spring Edition 2015

Scrapping of the Euro / Franc exchange rate control – a double-edged sword for real estate investments
Macroeconomic Overview 6
Office Market 8
Retail Market 10
Residential Market 13
Direct Real Estate Investments 16
Indirect Real Estate Investments 17
Focus: Data Centres 19
Content
Swiss Real SnapShot! / Spring 2015 / 3

Dear Madam or Sir,
KPMG Real SnapShot!, published every 6 months, provides you with an overview of the current developments in the Swiss real estate market and its influencing factors.
The Swiss real estate market is a heterogeneous and strictly segmented structure. Thus, KPMG Real SnapShot! limits itself to global observation, without addressing regional deviations in detail.
KPMG Real Estate has both Swiss specific and global expertise in the real estate markets. Our extensive data pools in local markets along with competent and in-depth consultation generate added value for our clients in all areas connected with real estate.
Turn to the last page of KPMG Real SnapShot! to see what we can do for you and how you can benefit from our services.
We hope you find our report interesting.
With kind regards,
Introduction
The KPMG Real Snapshot! is also available for Europe, Asia and the Americas. Contact us if you would like to learn more about the global real estate markets. Download publications: www.kpmg.com/Global/en/industry/real-estate
Ulrich PrienPartner, Head of Real Estate Switzerland
Beat SegerPartner, Real Estate M&A
Swiss Real SnapShot! / Spring 2015 / 5
Scrapping of the Euro / Franc exchange rate control – a double-edged sword for real estate investments
Positive impetus is expected from the USA in particular, where the sustained upswing is now accompanied by a steady fall in unemployment. Conversely, economic recovery in the Eurozone has so far been much more sluggish than expected. Even the German economy, which has been robust for some time, experienced a cooling down (albeit not too severe) in the final quarter of the year as a result of weaker export and investment activities. Notwithstanding this “temporary” weakness, the long-term debt issues faced by various countries, peripheral areas as well as Italy and France, will continue to overshadow the economic activity for years to come.
The prospect of an extensive programme of quantitative easing by the European Central Bank (ECB) intensified pressure on the Swiss Euro exchange rate control in early 2015. The risk of maintaining the exchange rate control was that the SNB could lose control over its finances. This could have made it difficult to pursue stability oriented policies in the future and therefore the SNB decided to scrap the exchange rate control. At the same time, it was announced that the interest rate on current accounts exceeding a specific threshold would be reduced by 0.5 percentage points to minus 0.75%. Even the target range for 3-month Libor shifted further into negative territory, from -0.75% to 0.25% to -1.25% to -0.25%.
The financial markets reacted to the SNB’s decision with erratic exchange rate fluctuations. The Franc appreciated significantly and the Euro-Franc exchange rate fell below parity for a short time. There were also assive losses in the SMI Index. Since then, the exchange rate (EUR 1 = CHF 1.05) and local share prices (SMI YTD: +2.29%)1 have gradually recovered.
The Franc is still over-valued compared to most other currencies in terms of purchasing power parity. Although studies show that the currencies tend to move towards purchasing power parity, given the Franc’s function as a “Safe Haven”, this could still take some time.
1 As at 30 March 2015
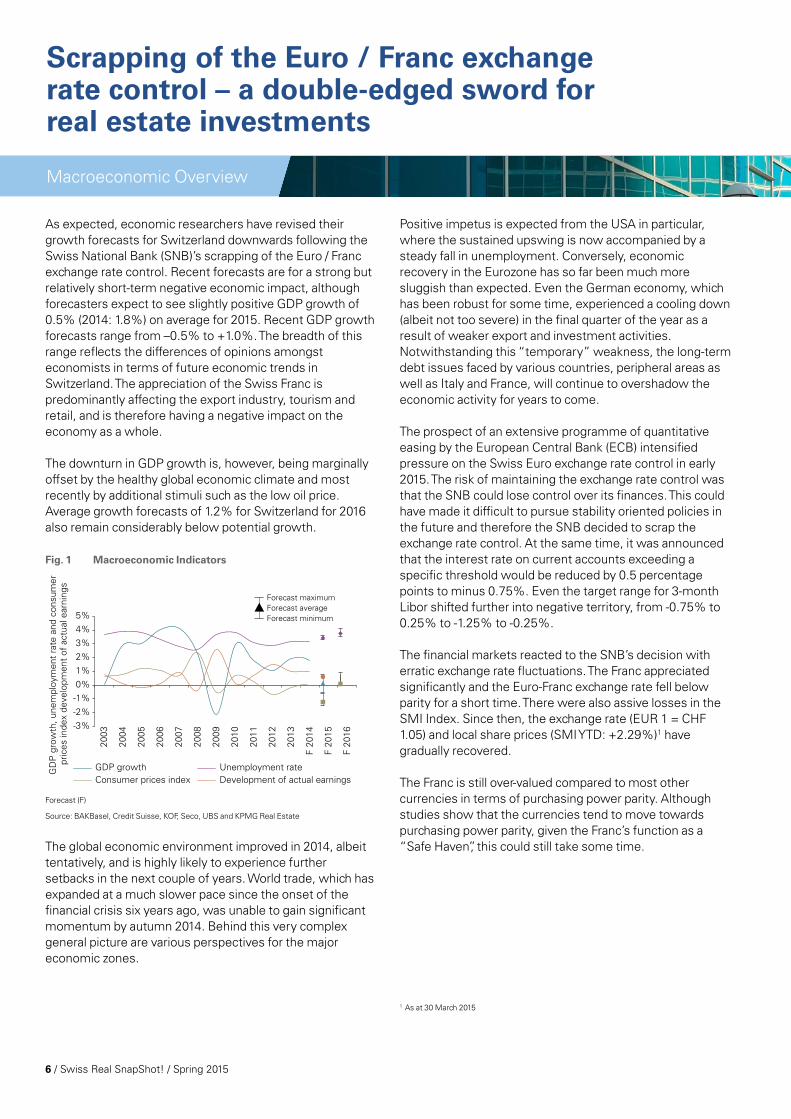
As expected, economic researchers have revised their growth forecasts for Switzerland downwards following the Swiss National Bank (SNB)’s scrapping of the Euro / Franc exchange rate control. Recent forecasts are for a strong but relatively short-term negative economic impact, although forecasters expect to see slightly positive GDP growth of 0.5% (2014: 1.8%) on average for 2015. Recent GDP growth forecasts range from –0.5% to +1.0%. The breadth of this range reflects the differences of opinions amongst economists in terms of future economic trends in Switzerland. The appreciation of the Swiss Franc is predominantly affecting the export industry, tourism and retail, and is therefore having a negative impact on the economy as a whole.
The downturn in GDP growth is, however, being marginally offset by the healthy global economic climate and most recently by additional stimuli such as the low oil price. Average growth forecasts of 1.2% for Switzerland for 2016 also remain considerably below potential growth. Fig. 1 Macroeconomic Indicators
-3%-2%-1%0%1%2%3%4%5%
2003
2004
2005
GD
P g
row
th, u
nem
ploy
men
t ra
te a
nd c
onsu
mer
pr
ices
inde
x de
velo
pmen
t of
act
ual e
arni
ngs
2006
2007
2008
2009
2010
2011
2012
2013
F 20
14
F 20
15
F 20
16
GDP growth
Forecast maximumForecast averageForecast minimum
Unemployment rateConsumer prices index Development of actual earnings
Forecast (F)
Source: BAKBasel, Credit Suisse, KOF, Seco, UBS and KPMG Real Estate
The global economic environment improved in 2014, albeit tentatively, and is highly likely to experience further setbacks in the next couple of years. World trade, which has expanded at a much slower pace since the onset of the financial crisis six years ago, was unable to gain significant momentum by autumn 2014. Behind this very complex general picture are various perspectives for the major economic zones.
Macroeconomic Overview
6 / Swiss Real SnapShot! / Spring 2015

Fig. 2 Yields for Government Bonds, EUR/CHF Exchanges
Rates and Equity Investments
-0.4
-0.3
-0.2
-0.1
0.0
0.1
0.2
0.3
0.4
80
85
90
95
100
105
110
05.0
1.20
1506
.01.
2015
07.0
1.20
1508
.01.
2015
09.0
1.20
1510
.01.
2015
11.0
1.20
1512
.01.
2015
13.0
1.20
1514
.01.
2015
15.0
1.20
1516
.01.
2015
17.0
1.20
1518
.01.
2015
19.0
1.20
1520
.01.
2015
21.0
1.20
1522
.01.
2015
23.0
1.20
1524
.01.
2015
25.0
1.20
1526
.01.
2015
Reference yield for 10-year
Governm
ent bonds as at %
SM
I ind
exed
exc
hang
e ra
tes,
list
ed
real
est
ate
and
CH
F/E
UR
exc
hang
e ra
te
Reference yield for 10-year Government bonds as at % (right hand scale)
SXI Real Estate® Shares PR (left hand scale)SXI Real Estate® Funds PR (left hand scale)SMI PR (left hand scale)CHF/EUR (left hand scale)
Source: SNB, SWX and KPMG Real Estate
According to surveys by the Swiss Secretariat for Economic Affairs (SECO), the unemployment figure reported by the Regional Employment Centres (RAV) at the end of January 2015 was around 132,000, 3,600 more than in the previous month. This means that the unemployment rate rose from 3.4% in December 2014 to 3.5%. This rise can be explained chiefly by seasonal effects, as unemployment reduced by approximately 2,300 people year-on-year. In view of the signs of an economic downturn, forecasting institutes anticipate an average unemployment rate of 3.4% in 2015, which is a rise of 0.2 percentage points compared to 2014.
An extrapolation of the figures from the Federal Office for Migration for 2014 as a whole indicates that net inward migration of around 80,000 people can be expected for the past year, which is similar to the previous year’s figure and in line with the average figure since the introduction of totally free movement.
In the period between 2000 and 2011, Germans were the dominant immigrant group, but they have once again been overtaken by Portuguese and Italians.
The negative consequences on growth prospects of the adoption of the mass migration initiative have been pushed somewhat into the background since the scrapping of the Franc-Euro exchange rate control. In view of the expected cooling of economic growth, considerably fewer foreign workers will move to Switzerland over the coming year. Medium to long-term migration figures will depend on the formal implementation of the mass migration initiative as well as economic trends. Fig. 3 Migratory Balance
-20,000
0
20,000
40,000
60,000
80,000
100,000
120,000
2000
2001
2002
2003
2004
2005
2006
2007
2008
2009
2010
2011
2012
2013
F201
4
Net
mig
ratio
n
Other countries Germany France PortugalItaly Spain Total
Forecast (F)
Source: Federal Office for Migration and KPMG Real Estate
Swiss Real SnapShot! / Spring 2015 / 7
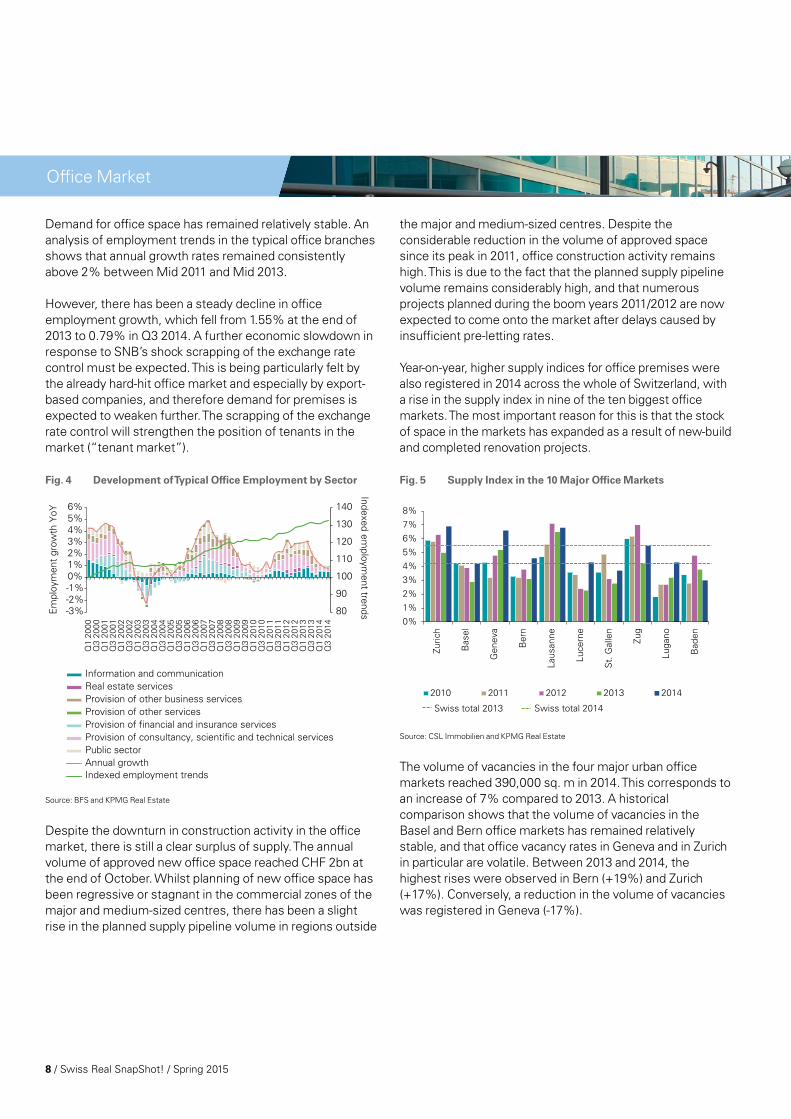
Demand for office space has remained relatively stable. An analysis of employment trends in the typical office branches shows that annual growth rates remained consistently above 2% between Mid 2011 and Mid 2013.
However, there has been a steady decline in office employment growth, which fell from 1.55% at the end of 2013 to 0.79% in Q3 2014. A further economic slowdown in response to SNB’s shock scrapping of the exchange rate control must be expected. This is being particularly felt by the already hard-hit office market and especially by export-based companies, and therefore demand for premises is expected to weaken further. The scrapping of the exchange rate control will strengthen the position of tenants in the market (“tenant market”).
Fig. 4 Development of Typical Office Employment by Sector
80
90
100
110
120
130
140
-3%-2%-1%0%1%2%3%4%5%6%
Q1
2000
Q3
2000
Q1
2001
Q3
2001
Q1
2002
Q3
2002
Q1
2003
Q3
2003
Q1
2004
Q3
2004
Q1
2005
Q3
2005
Q1
2006
Q3
2006
Q1
2007
Q3
2007
Q1
2008
Q3
2008
Q1
2009
Q3
2009
Q1
2010
Q3
2010
Q1
2011
Q3
2011
Q1
2012
Q3
2012
Q1
2013
Q3
2013
Q1
2014
Q3
2014
Indexed employm
ent trendsEm
ploy
men
t gr
owth
YoY
Information and communication
Provision of financial and insurance services
Real estate services
Provision of consultancy, scientific and technical services
Provision of other business services
Public sector
Provision of other services
Annual growthIndexed employment trends
Source: BFS and KPMG Real Estate
Despite the downturn in construction activity in the office market, there is still a clear surplus of supply. The annual volume of approved new office space reached CHF 2bn at the end of October. Whilst planning of new office space has been regressive or stagnant in the commercial zones of the major and medium-sized centres, there has been a slight rise in the planned supply pipeline volume in regions outside
the major and medium-sized centres. Despite the considerable reduction in the volume of approved space since its peak in 2011, office construction activity remains high. This is due to the fact that the planned supply pipeline volume remains considerably high, and that numerous projects planned during the boom years 2011/2012 are now expected to come onto the market after delays caused by insufficient pre-letting rates.
Year-on-year, higher supply indices for office premises were also registered in 2014 across the whole of Switzerland, with a rise in the supply index in nine of the ten biggest office markets. The most important reason for this is that the stock of space in the markets has expanded as a result of new-build and completed renovation projects.
Fig. 5 Supply Index in the 10 Major Office Markets
0%1%2%3%4%5%6%7%8%
2010 2011 2012 2013 2014
Swiss total 2013
Zuric
h
Bas
el
Gen
eva
Ber
n
Laus
anne
Luce
rne
St.
Gal
len
Zug
Luga
no
Bad
en
Swiss total 2014
Source: CSL Immobilien and KPMG Real Estate
The volume of vacancies in the four major urban office markets reached 390,000 sq. m in 2014. This corresponds to an increase of 7% compared to 2013. A historical comparison shows that the volume of vacancies in the Basel and Bern office markets has remained relatively stable, and that office vacancy rates in Geneva and in Zurich in particular are volatile. Between 2013 and 2014, the highest rises were observed in Bern (+19%) and Zurich (+17%). Conversely, a reduction in the volume of vacancies was registered in Geneva (-17%).
Office Market
8 / Swiss Real SnapShot! / Spring 2015

Fig. 6 Office Vacancy Trends in the Major Centres
0
50,000
100,000
150,000
200,000
250,000
300,000
350,000
400,000
2000
2001
2002
2003
2004
2005
2006
2007
2008
2009
2010
2011
2012
2013
2014
Vac
ant
offic
e sp
ace
in m
2
Basel Bern Geneva Zurich
Source: City Statistical Offices and KPMG Real Estate
In contrast to 2013, the sustained imbalance between supply and demand in the office market in 2014 was evident from the lower asking rents. However, asking rents only give a flavour of the reality. This is because in the current market climate they include premises in premium quality properties or locations, but do not reflect the increased willingness of landlords to make concessions in terms of pricing. Current asking rents also tend to gloss over the existing situation in the letting market.
The current uncertainty in terms of commercial real estate has intensified since the scrapping of the Euro exchange rate control. In view of the prospect of stagnating employment growth – particularly in export-oriented sectors which are more sensitive to price fluctuations – a further reduction in demand for premises can be anticipated. We therefore expect higher vacancies and a further reduction in office rents in 2015.
Fig. 7 Rental Price Index for Office Premises in the Major
Centres
90 100 110 120 130 140 150 160 170 180
2000
2001
2002
2003
2004
2005
2006
2007
2008
2009
2010
2011
2012
2013
2014
Ren
tal p
rice
inde
x
Basel Bern Geneva Zurich
Source: W&P and KPMG Real Estate
The uncertain economic climate in Europe makes Switzerland – a country with low public sector debt and a strong currency – a “safe haven” and therefore an attractive destination for foreign companies. However, these essentially positive prospects are currently clouded by political, regulatory and fiscal issues which are causing a sense of insecurity amongst companies and therefore constrain economic development. According to a conference of the Cantonal Ministers of Economic Affairs, the number of companies settling in Switzerland reduced from 379 to 279 per annum between 2010 and 2013.
Mass migration initiative:The adoption of the mass migration initiative in early 2014 envisaged the introduction of a new system to regulate immigration by the Swiss Federal Council by 2017. A draft of the new foreign immigration legislation was approved in early 2015 and the mandate to negotiate with the EU for agreement on freedom of movement was confirmed. The effects of this on employment remain difficult to forecast.
USR III and BEPS:Fiscal aspects and the tense relationship with the EU are also adding to the corporate uncertainty.
The Swiss responded to the EU demand to scrap the privileged tax regime by preparing Business Tax Reform III (USR III). This was launched with the objective of identifying EU-compliant alternatives to the fiscal advantages being lost, to ensure that Switzerland remains an attractive corporate location in future. Examples of objectives included the reduction of a profit tax across Switzerland from an average of 21.8% to 16%. It is unclear whether and to what degree these and other measures can actually compensate for the lost fiscal advantages. The action plan against tax avoidance by multi-national companies (BEPS) initiated by the OECD and presented to the G20 states at the end of 2014 could result in further adjustments to the Swiss tax system. Ultimately, the structure of the relationship between Switzerland and the EU is an important factor for the country’s future attractiveness because, for many international companies, Switzerland is the gateway to the EU market.
Switzerland as an international corporate location
Swiss Real SnapShot! / Spring 2015 / 9

As in 2013, nominal retail sales stagnated, with a growth of only 0.7%. Reasons for this include negative inflation, a deterioration in consumer sentiment and the continued tendency towards shopping tourism abroad. As in 2013, nominal food sales grew by 1.5% and, at -0.2%, growth in non-food sales was negligible.
Fig. 8 Retail Sales and Consumer Sentiment
90
95
100
105
110
115
2010
01
2011
01
2012
01
2013
01
2014
01
2015
01
-30
-25
-20
-15
-10
-5
0
5
10
15
20
Inde
xed
reta
il sa
les
Consum
er sentiment index
Consumer sentiment index (right hand scale)
Nominal seasonally-adjusted retail sales (left hand scale)Real seasonally-adjusted retail sales (left hand scale)
Source: BFS and KPMG Real Estate
Shopping tourism, triggered by the Euro’s poor performance in the past few years, has become a major burden for Swiss retail. According to a study by GfK2, shopping tourism abroad caused a reduction in sales of around CHF 5bn per annum. The study concludes that most money flowed into Germany, and mainly into household and sanitary products, therefore primarily at the expense of Swiss retail. The reasons Swiss consumers gave for shopping tourism were lower prices, the favourable exchange rate, a greater selection of products and more attractive shop opening times.
The SNB’s shock scrapping of the exchange rate control has encouraged Swiss consumers even more to shop in locations close to its borders. This in turn is leading to a rise in the volume of purchasing power lost to the neighbouring countries, Germany, Austria, Italy and France. Before the SNB introduced the exchange rate control in 2012, local retailers reduced their prices to counteract the strong Franc and to tackle the loss in purchasing power to foreign countries. Coop and Migros have already announced further price cuts on numerous products since the exchange rate control was scrapped.
2 Major market research institute
Fig. 9 CHF/EUR Trends and Price Cuts (measured in terms of
products) announced by Coop and Migros
0.60.70.80.91.01.11.21.31.41.51.6
Jan
. 201
0A
pr. 2
010
Jul.
2010
Oct
. 201
0 J
an. 2
011
Apr
. 201
1Ju
l. 20
11O
ct. 2
011
Jan
. 201
2A
pr. 2
012
Jul.
2012
Oct
. 201
2 J
an. 2
013
Apr
. 201
3Ju
l. 20
13O
ct. 2
013
Jan
. 201
4A
pr. 2
014
Jul.
2014
Oct
. 201
4 J
an. 2
015
Apr
. 201
5Ju
l. 20
15O
ct. 2
015
Coop
Migros
1,000 reduced products
500 reduced products
Exc
hang
e ra
te C
HF/
EU
R
Source: Credit Suisse, SNB, Coop and Migros Press Releases and KPMG Real Estate
In addition to shopping tourism, online retail is proving to be a major challenge for over-the-counter retail. The growth in online sales of 8% was much more dynamic than over-the-counter retail in Switzerland in 2014; nevertheless, E-commerce’s penetration of the Swiss market is still relatively low, accounting for only around 5% of total retail sales.
Digitec, a subsidiary of the Migros group, which merged with Galaxus, Migros’ online store in 2014, remains market leader in Swiss online retail, with an annual turnover of CHF 550m and nine branches. The Migros online shop (LeShop.ch) reported higher sales than its Coop counterpart (Coop@home), the latter reporting 10.7% vs. 4.4% stronger sales growth.
Fig. 10 Development of Retail Sales
020406080100120140160180
9095
100105110115120125130135140
2009 2010 2011 2012 2013 2014
Sales in C
HF m
illion
Sal
es t
rend
s, in
dexe
d
Coop@home (right hand scale) LeShop.ch (right hand scale)Retail (left hand scale) Online/mail order retail (left hand scale)
Source: BFS, GFK, Coop & Migros Annual Reports and KPMG Real Estate
Retail Market
10 / Swiss Real SnapShot! / Spring 2015

Foreign online retail is a growing threat to Swiss retail, with GfK reporting stronger growth in sales than Swiss online retail. According to GfK, around CHF 1.2bn flowed into foreign online shops in 2013. Until now, online shopping tourism was constrained by the exchange rate, customs duty, VAT and the fact that some foreign online shops simply did not deliver to customers in Switzerland. This resulted in the establishment of numerous shipping address suppliers, whose business model is based on the setting up of a German shipping address immediately over the Swiss border. The simplification of the purchasing process was already costing Swiss retail CHF 200m in 2013. Online shopping tourism is being made easier and easier for the Swiss consumer, with many companies handling duties and taxes on behalf of Swiss customers in return for a service fee, sending the goods directly to a Swiss address.
With the exception of Mall of Switzerland, which propelled the volume of approved new retail space upward in 2012/2013, the planned supply pipeline of retail space has been on a steady downward path for a number of years. Credit Suisse quoted a supply pipeline volume of approved retail space of around CHF 380m as at October 2014; a reduction of 36% compared to the year before. Following
years of expansion, there is now a clear tendency towards saturation in the retail market. Adding this to the numerous challenges the retail industry is now facing, investors are more cautious in terms of their activity in this real estate segment.
Fig. 11 Supply Index for Retail Premises in the Major Centres
0%
1%
2%
3%
4%
5%
6%
7%
8%
Zurich Bern Basel Geneva Switzerland
2010 2011 2012 2013 2014
0%
1%
2%
3%
4%
5%
6%
7%
8%
2010 2011 2012 2013 2014
Source: W&P and KPMG Real Estate
Swiss Real SnapShot! / Spring 2015 / 11
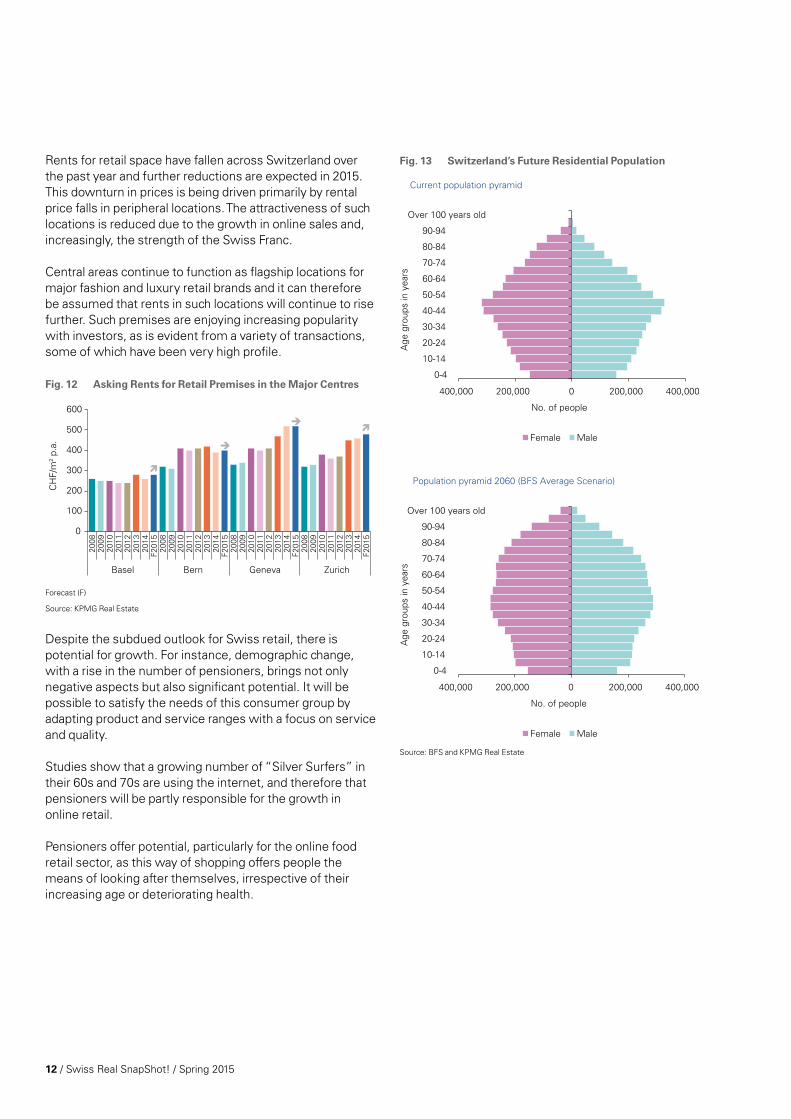
Rents for retail space have fallen across Switzerland over the past year and further reductions are expected in 2015. This downturn in prices is being driven primarily by rental price falls in peripheral locations. The attractiveness of such locations is reduced due to the growth in online sales and, increasingly, the strength of the Swiss Franc.
Central areas continue to function as flagship locations for major fashion and luxury retail brands and it can therefore be assumed that rents in such locations will continue to rise further. Such premises are enjoying increasing popularity with investors, as is evident from a variety of transactions, some of which have been very high profile.
Fig. 12 Asking Rents for Retail Premises in the Major Centres
0
100
200
300
400
500
600
2008
2009
2010
2011
2012
2013
2014
F201
520
0820
0920
1020
1120
1220
1320
14F2
015
2008
2009
2010
2011
2012
2013
2014
F201
520
0820
0920
1020
1120
1220
1320
14F2
015
Basel Bern Geneva Zurich
CH
F/m
2 p.a
.
Forecast (F)
Source: KPMG Real Estate
Despite the subdued outlook for Swiss retail, there is potential for growth. For instance, demographic change, with a rise in the number of pensioners, brings not only negative aspects but also significant potential. It will be possible to satisfy the needs of this consumer group by adapting product and service ranges with a focus on service and quality.
Studies show that a growing number of “Silver Surfers” in their 60s and 70s are using the internet, and therefore that pensioners will be partly responsible for the growth in online retail.
Pensioners offer potential, particularly for the online food retail sector, as this way of shopping offers people the means of looking after themselves, irrespective of their increasing age or deteriorating health.
Fig. 13 Switzerland’s Future Residential Population
400,000 200,000 0 200,000 400,000
0-4
10-14
20-24
30-34
40-44
50-54
60-64
70-74
80-84
90-94
Over 100 years old
No. of peopleA
ge g
roup
s in
yea
rsA
ge g
roup
s in
yea
rs
Current population pyramid
MaleFemale
MaleFemale
400,000 200,000 0 200,000 400,000
0-4
10-14
20-24
30-34
40-44
50-54
60-64
70-74
80-84
90-94
Over 100 years old
No. of people
Population pyramid 2060 (BFS Average Scenario)
Source: BFS and KPMG Real Estate
12 / Swiss Real SnapShot! / Spring 2015
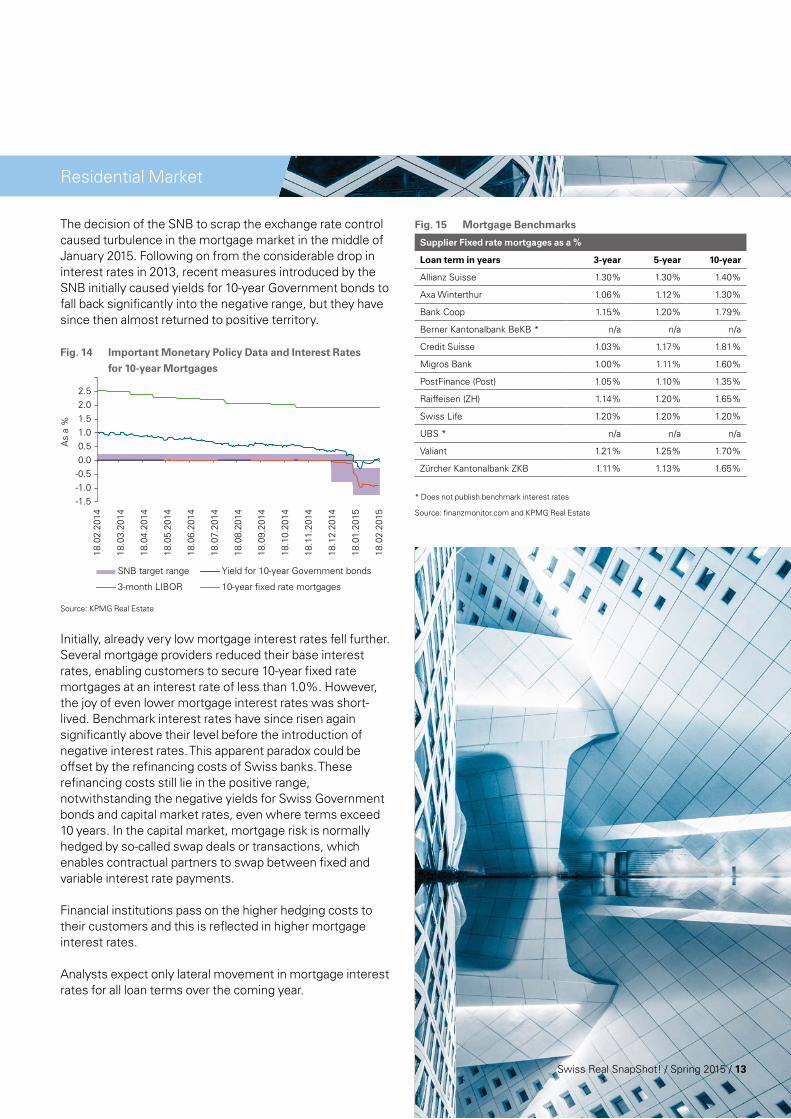
The decision of the SNB to scrap the exchange rate control caused turbulence in the mortgage market in the middle of January 2015. Following on from the considerable drop in interest rates in 2013, recent measures introduced by the SNB initially caused yields for 10-year Government bonds to fall back significantly into the negative range, but they have since then almost returned to positive territory. Fig. 14 Important Monetary Policy Data and Interest Rates
for 10-year Mortgages
-1.5-1.0-0.50.00.51.01.52.02.5
As
a %
SNB target range Yield for 10-year Government bonds
3-month LIBOR
18.0
2.20
14
18.0
3.20
14
18.0
4.20
14
18.0
5.20
14
18.0
6.20
14
18.0
7.20
14
18.0
8.20
14
18.0
9.20
14
18.1
0.20
14
18.1
1.20
14
18.1
2.20
14
18.0
1.20
15
18.0
2.20
15
10-year fixed rate mortgages
Source: KPMG Real Estate
Initially, already very low mortgage interest rates fell further. Several mortgage providers reduced their base interest rates, enabling customers to secure 10-year fixed rate mortgages at an interest rate of less than 1.0%. However, the joy of even lower mortgage interest rates was short-lived. Benchmark interest rates have since risen again significantly above their level before the introduction of negative interest rates. This apparent paradox could be offset by the refinancing costs of Swiss banks. These refinancing costs still lie in the positive range, notwithstanding the negative yields for Swiss Government bonds and capital market rates, even where terms exceed 10 years. In the capital market, mortgage risk is normally hedged by so-called swap deals or transactions, which enables contractual partners to swap between fixed and variable interest rate payments.
Financial institutions pass on the higher hedging costs to their customers and this is reflected in higher mortgage interest rates.
Analysts expect only lateral movement in mortgage interest rates for all loan terms over the coming year.
Fig. 15 Mortgage Benchmarks
Supplier Fixed rate mortgages as a %
Loan term in years 3-year 5-year 10-year
Allianz Suisse 1.30% 1.30% 1.40%
Axa Winterthur 1.06% 1.12% 1.30%
Bank Coop 1.15% 1.20% 1.79%
Berner Kantonalbank BeKB * n/a n/a n/a
Credit Suisse 1.03% 1.17% 1.81%
Migros Bank 1.00% 1.11% 1.60%
PostFinance (Post) 1.05% 1.10% 1.35%
Raiffeisen (ZH) 1.14% 1.20% 1.65%
Swiss Life 1.20% 1.20% 1.20%
UBS * n/a n/a n/a
Valiant 1.21% 1.25% 1.70%
Zürcher Kantonalbank ZKB 1.11% 1.13% 1.65%
* Does not publish benchmark interest rates Source: finanzmonitor.com and KPMG Real Estate
Residential Market
Swiss Real SnapShot! / Spring 2015 / 13

The slightly higher mortgage interest rates in conjunction with regulatory controls such as the tightening of the anti-cyclical capital buffer (AZP) and the self-regulation of banks are helping to calm the market for condominium apartments. This is evident from the reduction in the number of private households switching from renting to home ownership (substitution effect) and, overall, is having a stabilising effect on demand for rental apartments.
The supply pipeline of rental apartments has been high, making it possible to reduce some of the surplus demand from the last few years. The supply index for rental apartments is increasing across Switzerland and is currently in the region of 5.7%, a 5-year high; the supply index in 2013 was only 4.6%. The index has also risen year-on-year in the four major centres analysed. The lowest supply index of 3.6% was observed in Zurich and Geneva, and the highest, of 4.7%, was recorded by Bern. The supply of housing has also grown in the medium-sized cities and their agglomerations, with approximately 13% growth in supply in 2014. Fig. 16 Supply Index for Residential Space in the Major Centres
0%
1%
2%
3%
4%
5%
6%
Zurich Bern Basel Geneva Switzerland
2010 2011 2012 2013 2014
Source: W&P and KPMG Real Estate
According to Homegate.ch and ZKB3, quality-adjusted asking prices for rental apartments increased by 2.1% across Switzerland between 2013 and 2014, a rise of 0.3 percentage points. The highest price rises were observed in the Cantons of Lucerne (3.6%), Vaud and Geneva4 (3.2%). Conversely, a -0.1% fall in rents was observed in the Canton of Thurgau.
3 The index measures the monthly, quality-adjusted change in rents agreed for lettings of new and second-hand apartments.
4 Rental price trends in the Cantons of Vaud and Geneva are analysed using a shared sub-index.
14 / Swiss Real SnapShot! / Spring 2015

Fig. 17 Quality-Adjusted Rental Price Index
90
95
100
105
110
115
120
125
Jan.
09
May
09
Sep
. 09
Jan.
10
May
10
Sep
. 10
Jan.
11
May
11
Sep
. 11
Jan.
12
May
12
Sep
. 12
Jan.
13
May
13
Sep
. 13
Jan.
14
May
14
Sep
. 14
Jan.
15
0%
1%
2%
3%
4%
5%
6%
7%
8%
Inde
xed
rent
al t
rend
s
Change since previous year in S
witzerland
Change since previous year in Switzerland (right hand scale)
Rental price index Switzerland (left hand scale)Rental price index Canton of Zurich (left hand scale)Rental price index Cantons of Geneva and Vaud (left hand scale)
Source: Homegate.ch, ZKB and KPMG Real Estate
The apparent economic slowdown due to the strength of the Franc should lead to a reduction in net inward migration and therefore to a reduction of demand for rental apartments. Combining this with an expansion of supply, we expect to see a slight rise in the volume of vacancies and a stabilisation of rents.
Fig. 18 Asking rents for Residential Space in the Major Centres
0
100
200
300
400
500
600
2008
2009
2010
2011
2012
2013
2014
F201
520
0820
0920
1020
1120
1220
1320
14F2
015
2008
2009
2010
2011
2012
2013
2014
F201
520
0820
0920
1020
1120
1220
1320
14F2
015
Basel Bern Geneva Zurich
CH
F/m
2 p.a
.
90%-Percentile
Median10%-Percentile
Forecast (F)
Source: KPMG Real Estate
One of the apparent beneficiaries of the SNB decision is the market for residential investment properties. The sharp fall in interest rates is increasing the relative attractiveness (lower opportunity costs) of real estate investments. This can be expected to increase pressure to invest in residential properties in excellent locations, as this segment offers a much sought-after risk / return profile.
In the short-term, the SNB decision may provide positive impetus to the Swiss real estate market in certain sub segments (investments in multi-family dwellings and listed real estate investments); however, from an empirical perspective, a long-term decoupling of the real economy
from the real estate market is not possible. GDP growth is the main indicator for rental growth and therefore the rise in purchase prices. The current situation could put rents under pressure on two fronts: firstly, the reference yield for rental apartments will likely fall further (existing rents) and secondly, the deflationary climate will increase the pressure on rents across all use segments. Fig. 19 GDP Development and Rents
1981
1982
1984
1987
19881989
1990
1991
1992
1993
199419951996
19971998
19992000
2002 20062009 2012 2014
-15%
-10%
-5%
0%
5%
10%
15%
-3% -2% -1% 0% 1% 2% 3% 4% 5%
Cha
nge
in r
esid
entia
l ask
ing
rent
s(a
djus
ted
for
infla
tion)
% change in real GDP
1981-19891990-19992000-2014
Source: Seco, W&P and KPMG Real Estate
The consequences for the real estate market of scrapping the exchange rate control cannot yet be fully estimated or accurately quantified, as this is essentially dependent on the long-term exchange rate. What is important is the level at which the exchange rate fluctuates and whether this causes a slowdown in the Swiss economy.
The current stability of the real estate market appears deceptive in view of the potential decoupling effects.
Swiss Real SnapShot! / Spring 2015 / 15
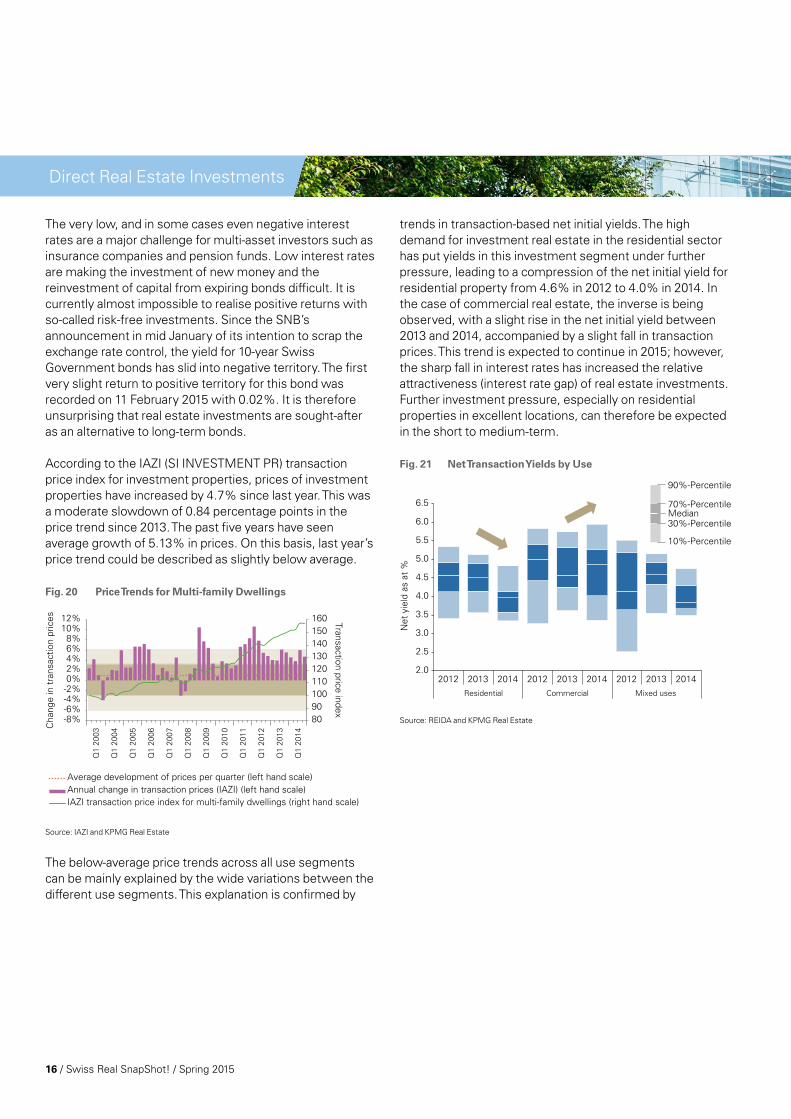
The very low, and in some cases even negative interest rates are a major challenge for multi-asset investors such as insurance companies and pension funds. Low interest rates are making the investment of new money and the reinvestment of capital from expiring bonds difficult. It is currently almost impossible to realise positive returns with so-called risk-free investments. Since the SNB’s announcement in mid January of its intention to scrap the exchange rate control, the yield for 10-year Swiss Government bonds has slid into negative territory. The first very slight return to positive territory for this bond was recorded on 11 February 2015 with 0.02%. It is therefore unsurprising that real estate investments are sought-after as an alternative to long-term bonds.
According to the IAZI (SI INVESTMENT PR) transaction price index for investment properties, prices of investment properties have increased by 4.7% since last year. This was a moderate slowdown of 0.84 percentage points in the price trend since 2013. The past five years have seen average growth of 5.13% in prices. On this basis, last year’s price trend could be described as slightly below average.
Fig. 20 Price Trends for Multi-family Dwellings
-8%-6%-4%-2%0%2%4%6%8%
10%12%
Q1
2003
Q1
2004
Q1
2005
Q1
2006
Q1
2007
Q1
2008
Q1
2009
Q1
2010
Q1
2011
Q1
2012
Q1
2013
Q1
2014
8090100110120130140150160 Transaction price index
Cha
nge
in t
rans
actio
n pr
ices
Annual change in transaction prices (IAZI) (left hand scale)IAZI transaction price index for multi-family dwellings (right hand scale)
Average development of prices per quarter (left hand scale)
Source: IAZI and KPMG Real Estate
The below-average price trends across all use segments can be mainly explained by the wide variations between the different use segments. This explanation is confirmed by
trends in transaction-based net initial yields. The high demand for investment real estate in the residential sector has put yields in this investment segment under further pressure, leading to a compression of the net initial yield for residential property from 4.6% in 2012 to 4.0% in 2014. In the case of commercial real estate, the inverse is being observed, with a slight rise in the net initial yield between 2013 and 2014, accompanied by a slight fall in transaction prices. This trend is expected to continue in 2015; however, the sharp fall in interest rates has increased the relative attractiveness (interest rate gap) of real estate investments. Further investment pressure, especially on residential properties in excellent locations, can therefore be expected in the short to medium-term.
Fig. 21 Net Transaction Yields by Use
2.0
2.5
3.0
3.5
4.0
4.5
5.0
5.5
6.0
6.5
2012 2013 2014 2012 2013 2014 2012 2013 2014Residential Commercial Mixed uses
Net
yie
ld a
s at
%
Median
10%-Percentile
30%-Percentile
90%-Percentile
70%-Percentile
Source: REIDA and KPMG Real Estate
Direct Real Estate Investments
16 / Swiss Real SnapShot! / Spring 2015
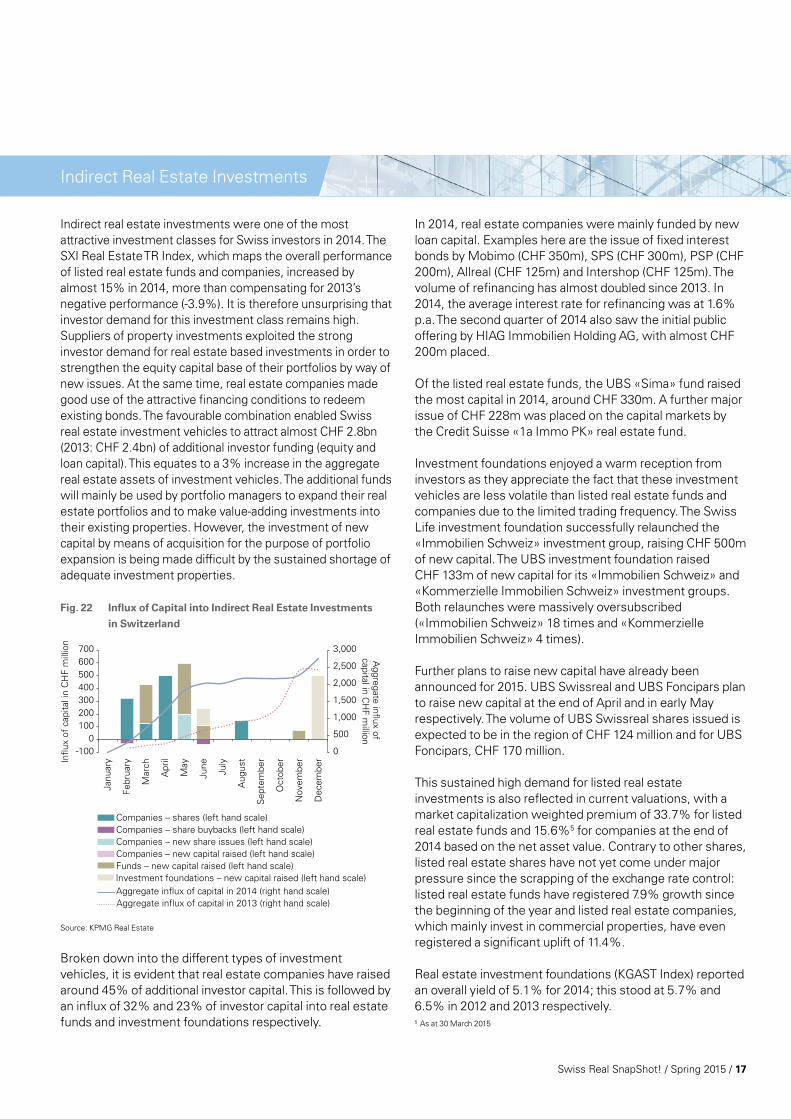
Indirect real estate investments were one of the most attractive investment classes for Swiss investors in 2014. The SXI Real Estate TR Index, which maps the overall performance of listed real estate funds and companies, increased by almost 15% in 2014, more than compensating for 2013’s negative performance (-3.9%). It is therefore unsurprising that investor demand for this investment class remains high. Suppliers of property investments exploited the strong investor demand for real estate based investments in order to strengthen the equity capital base of their portfolios by way of new issues. At the same time, real estate companies made good use of the attractive financing conditions to redeem existing bonds. The favourable combination enabled Swiss real estate investment vehicles to attract almost CHF 2.8bn (2013: CHF 2.4bn) of additional investor funding (equity and loan capital). This equates to a 3% increase in the aggregate real estate assets of investment vehicles. The additional funds will mainly be used by portfolio managers to expand their real estate portfolios and to make value-adding investments into their existing properties. However, the investment of new capital by means of acquisition for the purpose of portfolio expansion is being made difficult by the sustained shortage of adequate investment properties.
Fig. 22 Influx of Capital into Indirect Real Estate Investments
in Switzerland
0
500
1,000
1,500
2,000
2,500
3,000
-1000
100200300400500600700
Janu
ary
Dec
embe
r
Nov
embe
r
Oct
ober
Sep
tem
ber
Aug
ust
July
June
May
Apr
il
Mar
ch
Febr
uary
Aggregate influx of
capital in CH
F million
Influ
x of
cap
ital i
n C
HF
mill
ion
Companies – shares (left hand scale)
Companies – new share issues (left hand scale)Companies – share buybacks (left hand scale)
Companies – new capital raised (left hand scale)Funds – new capital raised (left hand scale)Investment foundations – new capital raised (left hand scale)Aggregate influx of capital in 2014 (right hand scale) Aggregate influx of capital in 2013 (right hand scale)
Source: KPMG Real Estate
Broken down into the different types of investment vehicles, it is evident that real estate companies have raised around 45% of additional investor capital. This is followed by an influx of 32% and 23% of investor capital into real estate funds and investment foundations respectively.
In 2014, real estate companies were mainly funded by new loan capital. Examples here are the issue of fixed interest bonds by Mobimo (CHF 350m), SPS (CHF 300m), PSP (CHF 200m), Allreal (CHF 125m) and Intershop (CHF 125m). The volume of refinancing has almost doubled since 2013. In 2014, the average interest rate for refinancing was at 1.6% p.a. The second quarter of 2014 also saw the initial public offering by HIAG Immobilien Holding AG, with almost CHF 200m placed.
Of the listed real estate funds, the UBS «Sima» fund raised the most capital in 2014, around CHF 330m. A further major issue of CHF 228m was placed on the capital markets by the Credit Suisse «1a Immo PK» real estate fund.
Investment foundations enjoyed a warm reception from investors as they appreciate the fact that these investment vehicles are less volatile than listed real estate funds and companies due to the limited trading frequency. The Swiss Life investment foundation successfully relaunched the «Immobilien Schweiz» investment group, raising CHF 500m of new capital. The UBS investment foundation raised CHF 133m of new capital for its «Immobilien Schweiz» and «Kommerzielle Immobilien Schweiz» investment groups. Both relaunches were massively oversubscribed («Immobilien Schweiz» 18 times and «Kommerzielle Immobilien Schweiz» 4 times).
Further plans to raise new capital have already been announced for 2015. UBS Swissreal and UBS Foncipars plan to raise new capital at the end of April and in early May respectively. The volume of UBS Swissreal shares issued is expected to be in the region of CHF 124 million and for UBS Foncipars, CHF 170 million.
This sustained high demand for listed real estate investments is also reflected in current valuations, with a market capitalization weighted premium of 33.7% for listed real estate funds and 15.6%5 for companies at the end of 2014 based on the net asset value. Contrary to other shares, listed real estate shares have not yet come under major pressure since the scrapping of the exchange rate control: listed real estate funds have registered 7.9% growth since the beginning of the year and listed real estate companies, which mainly invest in commercial properties, have even registered a significant uplift of 11.4%.
Real estate investment foundations (KGAST Index) reported an overall yield of 5.1% for 2014; this stood at 5.7% and 6.5% in 2012 and 2013 respectively. 5 As at 30 March 2015
Indirect Real Estate Investments
Swiss Real SnapShot! / Spring 2015 / 17
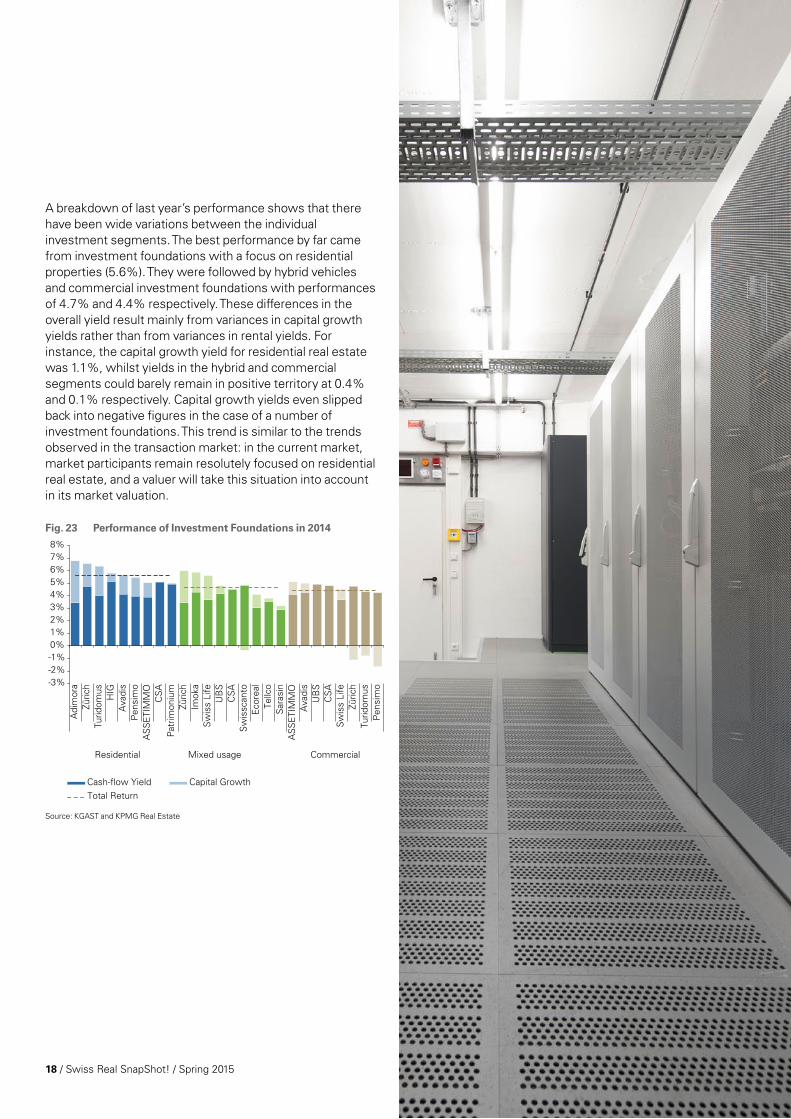
A breakdown of last year’s performance shows that there have been wide variations between the individual investment segments. The best performance by far came from investment foundations with a focus on residential properties (5.6%). They were followed by hybrid vehicles and commercial investment foundations with performances of 4.7% and 4.4% respectively. These differences in the overall yield result mainly from variances in capital growth yields rather than from variances in rental yields. For instance, the capital growth yield for residential real estate was 1.1%, whilst yields in the hybrid and commercial segments could barely remain in positive territory at 0.4% and 0.1% respectively. Capital growth yields even slipped back into negative figures in the case of a number of investment foundations. This trend is similar to the trends observed in the transaction market: in the current market, market participants remain resolutely focused on residential real estate, and a valuer will take this situation into account in its market valuation.
Fig. 23 Performance of Investment Foundations in 2014
-3%-2%-1%0%1%2%3%4%5%6%7%8%
Adi
mor
aZü
rich
Turid
omus
HIG
Ava
dis
Pen
sim
oA
SS
ETI
MM
OC
SA
Pat
rimon
ium
Züric
hIm
oka
Sw
iss
Life
UB
SC
SA
Sw
issc
anto
Eco
real
Tellc
oS
aras
inA
SS
ETI
MM
OA
vadi
sU
BS
CS
AS
wis
s Li
feZü
rich
Turid
omus
Pen
sim
o
Residential Mixed usage Commercial
Cash-flow Yield Capital GrowthTotal Return
Source: KGAST and KPMG Real Estate
18 / Swiss Real SnapShot! / Spring 2015

Data CentresInvestments in data centres have become an attractive niche segment in the USA. Worthy of mention is Digital Reality Trust, an investment vehicle for investments in data centres with a market capitalization of more than USD 9bn. This vehicle was created by Calpers, the largest US pension fund, and the private equity firm GI Partners in 2001. Very little institutional capital has flowed into data centres in Switzerland so far. Reasons for this could be the lack of knowledge and expertise, potential risk clusters or limited alternative use potential.
According to Broadgroup, the total area of data centres operated by external suppliers in Switzerland in 2013 was estimated at around 150,000 sq. m. Within Europe, Switzerland has the sixth largest area provided by external suppliers6. Only the United Kingdom, Germany, France, the Netherlands and Spain offer more. The density of data centres7 in Europe is only higher in Ireland, which reinforces the importance of Switzerland as a location for data centres.
Security is the key factor when selecting the location of a data centre. Suppliers of data centres favour locations with the least possible unforeseeable risks and which offer economic, political and social stability. Switzerland, with its tradition of discretion and strict data protection regulations, is one such location. Other important criteria include the speed of the broadband network and security from natural disasters; unfortunately, in the former, Switzerland is only classified as average in an international comparison. Another crucial factor is a secure and inexpensive electricity supply, as data centres are of critical importance and their operations have high energy requirements.
Fig. 24 Swiss Ranking in the Data Centre Risk Index 2013
1
Tota
l ran
king
Ene
rgy
cost
Inte
rnat
iona
l B
road
band
Cap
acity
Sim
plifi
ed
corp
orat
e ac
tivity
Taxe
s of
lega
l ent
ities
Labo
ur c
osts
Pol
itica
l sta
bilit
y
Sus
tain
abili
ty
Sec
urity
aga
inst
na
tura
l dis
aste
rs
Trai
ning
Ene
rgy
secu
rity
GD
P p
er c
apita
Infla
tion
Wat
er r
esou
rces
10
20
30
119
1517
1
29
5
9
13
18
11
31
13
Source: Source8, hurleypalmerflatt and Cushman&Wakefield
In contrast to traditional investment properties, modern data centres must meet greater infrastructure and security requirements. In terms of infrastructure, requirements for cooling, electricity supply and networks are higher. In order to ensure the safe storage of highly sensitive data, data centres must also offer maximum protection from fundamental risks (e.g. earthquakes, fire, flooding), internal risks (e.g. sabotage, data theft), external risks (e.g. terrorism) and of course the risk of technical breakdown. Standard security measures include redundant infrastructure, access controls, heat and infrared sensors, camera surveillance, fixed fire extinguishing systems and emergency generators. The construction of a data centre therefore requires a high initial investment and a high degree of constructional knowledge and expertise.
Despite a good market outlook, investors remain cautious in terms of investments in data centres. An investor-operator model lends itself well to investments in data centres. In such instances, the institutional investor performs the role of the owner of a data centre and receives a standard market rental income from the operator (external supplier). Sale-and-leaseback models have a similar purpose, i.e. the institutional investor acquires an “in-house” data centre and is guaranteed a long-term rental income from the seller; the institutional investor has the opportunity to diversify its portfolio; and the external supplier and seller of an “in-house” data centre can release capital for investment in further expansion or in its core business. As marketability improves, it may be possible to introduce new investment vehicles with a focus on data centres, or to position data centre operator bonds through the capital market in Switzerland. In view of Switzerland’s appeal as a data centre hub and the rapid advance of digitalization, this niche segment has an interesting investment profile.
5 The data centre landscape in Switzerland can be divided into two categories: the classic “in-house” data centres, i.e. data centres which are operated by companies in their own premises for their own purposes; and the growing number of specialist suppliers (external suppliers) whose core business is the operation of data centres.
6 Defined as the total area of data centres per capita operated by external suppliers.
Swiss Real SnapShot! / Spring 2015 / 19

In order to realize your chances, to optimize results and to minimize risks in the fragmented real estate markets you need to cut through complexity. KPMG Real Estate can provide an all-encompassing, interdisciplinary approach to support you as you face challenges arising from the wide-ranging factors influencing your real estate related business activities.
Please contact us on a non-binding basis with all real estate related questions you may have. We will put the team together that offers you the best solutions to meet your goals as your one-stop shop. KPMG provides you with local, national, international and global knowledge and expertise to enhance your success. Don’t hesitate to ask for our list of references!
M&A/Capital Market Structuring and execution of transactions (Lead Advisory)
– Asset deals: Acquisition and disposal of properties and portfolios – Share deals: Mergers, spin-offs, IPOs, private placements Arrangement of indirect investments, such as funds or trusts Fund raising for specific projects Debt advisory
Investment Advisory Investment advisory for national or international indirect real estate investments Structuring of real estate investments within portfolios Qualitative and quantitative analysis of investment products Monitoring and investment controlling, portfolio performance measurement
Strategy/Organization Strategy development and implementation
– Business planning/business modelling – Corporate/public real estate management – Asset and portfolio management Analysis of organization and processes; organizational development, internal
control system (ICS) Performance management/MIS/investment monitoring Risk management and financial modelling Major Project Adivisory
Valuation/Due Diligence DCF-valuations of properties and real estate portfolios
or companies Independent valuation reports for financial statements Valuations for acquisitions or disposals Feasibility studies and valuation of real estate developments Transaction-focused due diligence and process management
All-encompassing Real Estate Advisory from one Source
20 / Swiss Real SnapShot! / Spring 2015


The information contained herein is of a general nature and is not intended to address the circumstances of any particular individual or entity. Although we endeavor to provide accurate and timely information, there can be no guarantee that such information is accurate as of the date it is received, or that it will continue to be accurate in the future. No one should act on such information without appropriate professional advice after a thorough examination of the particular situation.
© 2015 KPMG AG is a subsidiary of KPMG Holding AG, which is a member of the KPMG network of independent firms affiliated with KPMG International Cooperative (“KPMG International”), a Swiss legal entity. All rights reserved.
Please contact us KPMG AG Advisory, Real Estate Badenerstrasse 172PO Box 8036 Zürich
KPMG SARue de Lyon 111 P.O. Box 3471211 Genève 13
KPMG AG Bogenstrasse 7P.O. Box 11429001 St. Gallen
kpmg.ch/RealEstate
Beat SegerPartnerReal Estate M&AT: +41 58 249 29 46E: [email protected]
Philipp SchelbertDirectorReal EstateT: +41 58 249 77 59E: [email protected]
Ulrich PrienPartnerHead of Real Estate SwitzerlandT: +41 58 249 62 72E: [email protected]
Oliver SpeckerSenior ManagerReal Estate St. GallenT: +41 58 249 41 74E: [email protected]
Arnaud de Montmollin ManagerReal Estate Suisse RomandeT: +41 58 249 28 17E: [email protected]
Alfonso Tedeschi, CFAAssistant ManagerReal Estate ResearchT: +41 58 249 28 83E: [email protected]