Swift design session - public object storage scalability
6
© 2009 IBM Corporation Public Object Storage Performance Insight Alan Jiang, IBM Cloud Division, [email protected] 5/14/2015
-
Upload
alan-jiang -
Category
Technology
-
view
188 -
download
0
Transcript of Swift design session - public object storage scalability

© 2009 IBM Corporation
Public Object Storage Performance Insight
Alan Jiang, IBM Cloud Division, [email protected]
5/14/2015

© 2009 IBM Corporation 2
Source: If applicable, describe source origin
Public Object Storage Performance Insight
Public object storage Performance issue:
• High customer request latency • Deviation in request response time • Throughput deviation in sustained request. Some data points of the cluster: • Object size on GET: Mean 2.9MB, Median 700B • Object size on PUT: Mean 285KB, Median 13KB • More GET than PUT.
Background:
IBM Confidential 12
Distribution of object size on GET
Mean: 2965KB
Median: 700B
99 percentile: 3MB
NONE 1-9 B 10-99 B 100-999 B 1-9 KB 10-99 KB 100-999 KB 1-9 MB 10-99 MB 100-999 MB 1-9 GB
0
500,000,000
1,000,000,000
1,500,000,000
2,000,000,000
2,500,000,000
3,000,000,000
3,500,000,000
Distribution of "GET" Object Sizes
Object Size
Num
ber
of O
bje
cts
Distribution of "GET" Object Size
1-9 B
10-99 B
100-999 B
1-9 KB
10-99 KB
100-999 KB
1-9 MB
10-99 MB
100-999 MB
1-9 GB
0 2 4 6 8 10 12
0
0.2
0.4
0.6
0.8
1
CDF of Object Size on GET
Log10 of object size in bytes
IBM Confidential 11
Distribution of object size on PUT
Mean: 285KB
Median: 13KB
99 percentile: 1MB
NONE 1-9 B 10-99 B 100-999 B 1-9 KB 10-99 KB 100-999 KB 1-9 MB 10-99 MB 100-999 MB 1-9 GB
0
100,000,000
200,000,000
300,000,000
400,000,000
500,000,000
600,000,000
700,000,000
800,000,000
900,000,000
1,000,000,000
Distribution of Object Sizes
Object Size
Num
ber
of O
bjec
ts
Distribution of "PUT" Object Size
1-9 B
10-99 B
100-999 B
1-9 KB
10-99 KB
100-999 KB
1-9 MB
10-99 MB
100-999 MB
1-9 GB
0 1 2 3 4 5 6 7 8 9 10
0
0.2
0.4
0.6
0.8
1
CDF of Object Size on PUT
Log10 of Object Size in Bytes

© 2009 IBM Corporation 3
Source: If applicable, describe source origin
Public Object Storage Performance Insight

© 2009 IBM Corporation
What we learned so far:
§ Replicator handoff_first and handoff_delete are tricky: Non-default value sometime can cause request latency issue.
§ Replicator partition delete can cause high system load – A lot of swift-object-server threads are in the “ D “ state. (~75% of swift-object-server) – Worst node: Average disk response time ~680 ms , write:read i/o request ratio ~2:1 – What do we see from kernel stack: ( A lot of are in xfs metadata i/o path)
• _xfs_buf_ioapply --- metadata i/o
4

© 2009 IBM Corporation
Pain points:
§ Operation challenges:
– Frequent capacity expansion
– Compressed replication time for ring rebalance – SLA: low request Latency, consistent throughput
§ Tuning challenges:
– Too many nubs for system: Kernel VM, XFS, i/o scheduler, disk, ….. – What is Swift tuning best practices for large public swift cluster. – How to tune clusters to serve different workloads in the Public swift cluster.
§ Problem determination in production challenges: – Connecting the dots between swift metrics and system metrics
– We have hundred’s of nodes to look at now L
5
© 2009 IBM Corporation
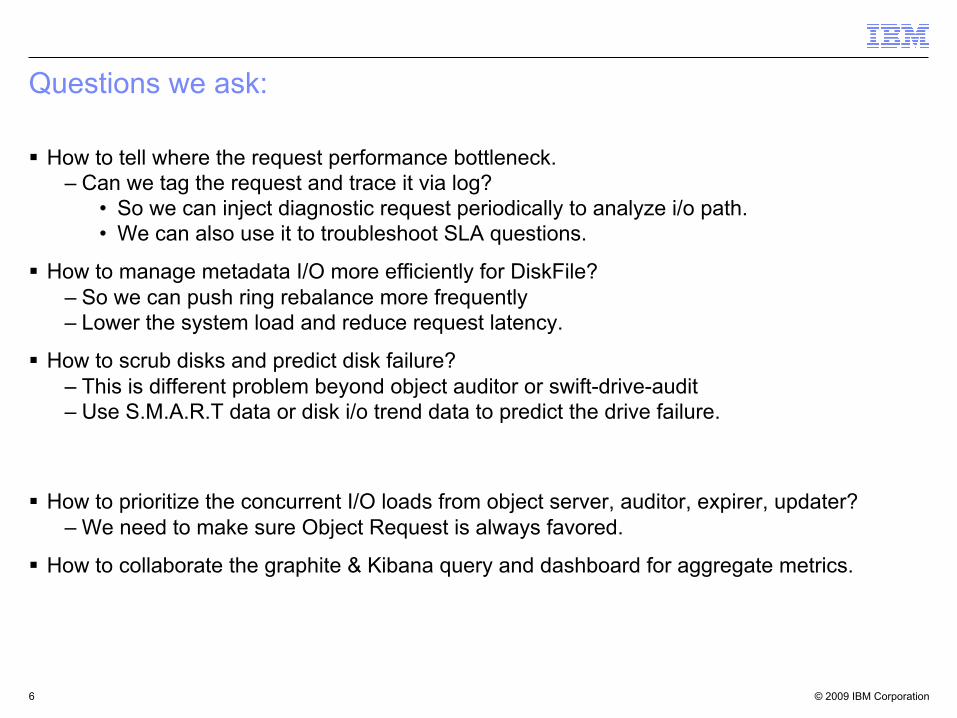
Questions we ask:
§ How to tell where the request performance bottleneck. – Can we tag the request and trace it via log?
• So we can inject diagnostic request periodically to analyze i/o path. • We can also use it to troubleshoot SLA questions.
§ How to manage metadata I/O more efficiently for DiskFile? – So we can push ring rebalance more frequently – Lower the system load and reduce request latency.
§ How to scrub disks and predict disk failure? – This is different problem beyond object auditor or swift-drive-audit – Use S.M.A.R.T data or disk i/o trend data to predict the drive failure.
§ How to prioritize the concurrent I/O loads from object server, auditor, expirer, updater? – We need to make sure Object Request is always favored.
§ How to collaborate the graphite & Kibana query and dashboard for aggregate metrics.
6