SWIFT: A Dynamical Model of Saccade Generation During...
37
SWIFT: A Dynamical Model of Saccade Generation During Reading Ralf Engbert, Antje Nuthmann, Eike M. Richter, and Reinhold Kliegl University of Potsdam Mathematical models have become an important tool for understanding the control of eye movements during reading. Main goals of the development of the SWIFT model (R. Engbert, A. Longtin, & R. Kliegl, 2002) were to investigate the possibility of spatially distributed processing and to implement a general mechanism for all types of eye movements observed in reading experiments. The authors present an advanced version of SWIFT that integrates properties of the oculomotor system and effects of word recognition to explain many of the experimental phenomena faced in reading research. They propose new procedures for the estimation of model parameters and for the test of the model’s performance. They also present a mathematical analysis of the dynamics of the SWIFT model. Finally, within this framework, they present an analysis of the transition from parallel to serial processing. In modern society, reading is a central skill, which demonstrates how efficiently a range of different cognitive processes (e.g., visual information processing, word recognition, attention, oculo- motor control) can work together to perform a complex everyday task. Consequently, a full account of how we read is among the crucial problems of cognitive research. Here, we focus on the fact that eye movements in reading represent an important example for a coupled cognitive–motor system. Therefore, a detailed analysis of the interface between high-level cognition (word recognition) and eye-movement control (saccade generation) is essential to contribute to our knowledge of reading. The measurement, analysis, and modeling of eye movements is one of the most powerful approaches to studying the way visual information is (a) processed by the human mind and (b) used to guide our actions (Findlay & Gilchrist, 2003). Measurements of fixation durations on words or on regions of text are central for investigating cognitive processes underlying reading (Liversedge & Findlay, 2000; Rayner, 1998). Therefore, it is of central impor- tance to develop a detailed understanding of how the experimental observables are related to the underlying cognitive systems. Over the last decades, there has been a considerable increase of knowledge about eye movements and visual information process- ing (e.g., Hyo ¨na ¨, Radach, & Deubel, 2003; Radach, Kennedy, & Rayner, 2004; Rayner, 1998). The question of how the contribut- ing cognitive subsystems for a specific task such as reading are coordinated is a research problem representative of questions that we believe cannot be investigated without fully quantitative math- ematical models. Although it is still possible to investigate aspects of eye-movement control (e.g., word skipping or programming of refixations) in a nonmathematical way, a fully quantitative ap- proach in which most of the experimental phenomena are inte- grated is necessary to test the interaction of different theoretical assumptions (e.g., the potential impact of a mechanism for word skipping on refixation behavior). In perspective, computational models can be approximated with analytical means to check the numerically obtained results and to derive the foundations of a rigorous theory of eye-movement control during reading (e.g., Engbert & Kliegl, 2003a). Our main goal in this article is to propose a mathematical model for the control of eye movements during reading that is both psychologically and neurophysiologically plausible and that ac- counts for most of the known experimental findings. The model presented here is an advanced and substantially extended version of the SWIFT 1 model proposed earlier (Engbert, Longtin, & Kliegl, 2002). The model is motivated by many different experi- mental results, which we discuss in detail. The model incorporates neurophysiological properties of the oculomotor system. Further- more, the SWIFT model is compatible with a general framework of the generation of saccades developed by Findlay and Walker (1999) and shares concepts with the dynamic field theory of movement preparation by Erlhagen and Scho ¨ner (2002). As our cognitive systems have never been under evolutionary pressure to optimize reading abilities (i.e., there has been no special adaptation of humans for reading), plausible models of eye movements in reading must have the potential for generalization to task manip- ulations (e.g., reading with a scotoma) and nonreading tasks (e.g., visual search). We discuss the issue of generalizability later in this article. The model that we develop here is a minimal model, which is related to two aspects of model design. First, the model is based on only a few core principles. This is a challenging problem, because even when reading relatively simple sentences, patterns of eye movements turn out to be very complex. As an example, we observe several different types of saccades including word skip- ping (no fixation on the skipped word), refixations (more than one fixation on the same word), and even interword regressions (back- ward saccades landing on a previously fixated region of text). The 1 (Autonomous) Saccade-Generation With Inhibition by Foveal Targets. Ralf Engbert, Antje Nuthmann, Eike M. Richter, and Reinhold Kliegl, Department of Psychology, University of Potsdam, Potsdam, Germany. This work was supported by Deutsche Forschungsgemeinschaft Grants KL 955/3 and KL 955/6. We thank Erik D. Reichle and Francoise Vitu- Thibault for their valuable comments on the manuscript. Correspondence concerning this article should be addressed to Ralf Engbert, Department of Psychology, University of Potsdam, P.O. Box 60 15 53, 14415 Potsdam, Germany. E-mail: [email protected] Psychological Review Copyright 2005 by the American Psychological Association 2005, Vol. 112, No. 4, 777– 813 0033-295X/05/$12.00 DOI: 10.1037/0033-295X.112.4.777 777
Transcript of SWIFT: A Dynamical Model of Saccade Generation During...

SWIFT: A Dynamical Model of Saccade Generation During Reading
Ralf Engbert, Antje Nuthmann, Eike M. Richter, and Reinhold KlieglUniversity of Potsdam
Mathematical models have become an important tool for understanding the control of eye movementsduring reading. Main goals of the development of the SWIFT model (R. Engbert, A. Longtin, & R.Kliegl, 2002) were to investigate the possibility of spatially distributed processing and to implement ageneral mechanism for all types of eye movements observed in reading experiments. The authors presentan advanced version of SWIFT that integrates properties of the oculomotor system and effects of wordrecognition to explain many of the experimental phenomena faced in reading research. They propose newprocedures for the estimation of model parameters and for the test of the model’s performance. They alsopresent a mathematical analysis of the dynamics of the SWIFT model. Finally, within this framework,they present an analysis of the transition from parallel to serial processing.
In modern society, reading is a central skill, which demonstrateshow efficiently a range of different cognitive processes (e.g.,visual information processing, word recognition, attention, oculo-motor control) can work together to perform a complex everydaytask. Consequently, a full account of how we read is among thecrucial problems of cognitive research. Here, we focus on the factthat eye movements in reading represent an important example fora coupled cognitive–motor system. Therefore, a detailed analysisof the interface between high-level cognition (word recognition)and eye-movement control (saccade generation) is essential tocontribute to our knowledge of reading.
The measurement, analysis, and modeling of eye movements isone of the most powerful approaches to studying the way visualinformation is (a) processed by the human mind and (b) used toguide our actions (Findlay & Gilchrist, 2003). Measurements offixation durations on words or on regions of text are central forinvestigating cognitive processes underlying reading (Liversedge& Findlay, 2000; Rayner, 1998). Therefore, it is of central impor-tance to develop a detailed understanding of how the experimentalobservables are related to the underlying cognitive systems.
Over the last decades, there has been a considerable increase ofknowledge about eye movements and visual information process-ing (e.g., Hyona, Radach, & Deubel, 2003; Radach, Kennedy, &Rayner, 2004; Rayner, 1998). The question of how the contribut-ing cognitive subsystems for a specific task such as reading arecoordinated is a research problem representative of questions thatwe believe cannot be investigated without fully quantitative math-ematical models. Although it is still possible to investigate aspectsof eye-movement control (e.g., word skipping or programming ofrefixations) in a nonmathematical way, a fully quantitative ap-
proach in which most of the experimental phenomena are inte-grated is necessary to test the interaction of different theoreticalassumptions (e.g., the potential impact of a mechanism for wordskipping on refixation behavior). In perspective, computationalmodels can be approximated with analytical means to check thenumerically obtained results and to derive the foundations of arigorous theory of eye-movement control during reading (e.g.,Engbert & Kliegl, 2003a).
Our main goal in this article is to propose a mathematical modelfor the control of eye movements during reading that is bothpsychologically and neurophysiologically plausible and that ac-counts for most of the known experimental findings. The modelpresented here is an advanced and substantially extended versionof the SWIFT1 model proposed earlier (Engbert, Longtin, &Kliegl, 2002). The model is motivated by many different experi-mental results, which we discuss in detail. The model incorporatesneurophysiological properties of the oculomotor system. Further-more, the SWIFT model is compatible with a general frameworkof the generation of saccades developed by Findlay and Walker(1999) and shares concepts with the dynamic field theory ofmovement preparation by Erlhagen and Schoner (2002). As ourcognitive systems have never been under evolutionary pressure tooptimize reading abilities (i.e., there has been no special adaptationof humans for reading), plausible models of eye movements inreading must have the potential for generalization to task manip-ulations (e.g., reading with a scotoma) and nonreading tasks (e.g.,visual search). We discuss the issue of generalizability later in thisarticle.
The model that we develop here is a minimal model, which isrelated to two aspects of model design. First, the model is based ononly a few core principles. This is a challenging problem, becauseeven when reading relatively simple sentences, patterns of eyemovements turn out to be very complex. As an example, weobserve several different types of saccades including word skip-ping (no fixation on the skipped word), refixations (more than onefixation on the same word), and even interword regressions (back-ward saccades landing on a previously fixated region of text). The
1 (Autonomous) Saccade-Generation With Inhibition by Foveal Targets.
Ralf Engbert, Antje Nuthmann, Eike M. Richter, and Reinhold Kliegl,Department of Psychology, University of Potsdam, Potsdam, Germany.
This work was supported by Deutsche Forschungsgemeinschaft GrantsKL 955/3 and KL 955/6. We thank Erik D. Reichle and Francoise Vitu-Thibault for their valuable comments on the manuscript.
Correspondence concerning this article should be addressed to RalfEngbert, Department of Psychology, University of Potsdam, P.O. Box 6015 53, 14415 Potsdam, Germany. E-mail: [email protected]
Psychological Review Copyright 2005 by the American Psychological Association2005, Vol. 112, No. 4, 777–813 0033-295X/05/$12.00 DOI: 10.1037/0033-295X.112.4.777
777

formulation of separate assumptions for these different types ofeye movements would violate the principle of minimal modeling.Therefore, we aim at a general mechanism underlying all types ofsaccades—the fundamental principle of our model. Second, thecore assumptions of our model are idealizations, which will beformulated mathematically in a parsimonious way (i.e., with asfew parameters as possible). Minimal modeling is also related togeneralizability, because, with an increasing number of assump-tions specific to reading, the model would be more and moreinflexible to explain eye movements in different tasks. How wecontrol eye movements in visual search should be in agreementwith the main control principles guiding the eyes during reading.
A theoretical framework for the dynamics of movement prepa-ration with a very general claim is the dynamic field theory(Erlhagen & Schoner, 2002). In this theory, a field of activation—the mathematical term for a function of space and time—is spa-tially distributed over a number of potential movement targets.Using concepts from the theory of nonlinear dynamical systems,the dynamic field theory proposes laws governing the temporalevolution of such activation fields. In the dynamic field theory,there is continuous cross talk between different cognitive sub-systems (e.g., memory system, perceptual input, movement plan-ning). This continuous interaction of cognition and motor controlmakes the theory highly relevant to eye-movement control duringreading, as the selection of words as saccade targets must beperformed on the basis of partial knowledge, because saccadelatency requires an early start of the next saccade program duringfixation. Thus, a temporally continuous interaction between pro-cesses of word recognition and saccade generation is essential in aplausible model of eye-movement control during reading. Al-though we do not refer to the explicit formalism proposed byErlhagen and Schoner (2002), we use the concept of an activationfield already developed in the first version of the SWIFT model(Engbert et al., 2002). Note, however, that the assumption of anactivation field already has strong implications. A theory builtaround the core assumption of a dynamically changing activationfield necessarily involves spatially distributed processing. In read-ing, words are the elementary targets for the saccadic system. Tobuild up an activation field, several words must be activated inparallel. This parallel processing, however, is not necessarily re-lated to word recognition, but could be limited to early stages ofword processing. We discuss this important aspect of our modellater and derive different types of parallel processing of words.
The first version of our model of eye-movement control inreading2 (Engbert et al., 2002) was developed as a viable alterna-tive to the models based on sequential shifts of attention, a prin-ciple that motivated the development of the currently most ad-vanced model, E-Z Reader (Reichle, Pollatsek, Fisher, & Rayner,1998; Reichle, Rayner, & Pollatsek, 1999, 2003; see also Engbert& Kliegl, 2001). Because of the success of the E-Z Reader model,which is based on strictly sequential processing, some researchersspeculated that an alternative model based on parallel processingof words could not perform similarly well. For example, Starr andRayner (2001, p. 162) concluded that “such a model seems rathercomplicated and would be difficult to implement in a computa-tional model. Thus, a challenge for proponents of a parallel mech-anism of attention during reading is to delineate the parameters ofsuch a framework.” From this perspective, the development of thefirst version SWIFT-I was important in order to keep the scientific
debate open and to demonstrate a viable alternative to E-Z Readerand/or the principle of sequential attention shifts.
Once we have developed a mathematical model based on par-allel processing of words, we can investigate the problem of serialversus parallel processing by computational means. We show laterin this article that it is possible to introduce a continuous spectrumfrom strictly serial to fully parallel models by a parametrization ofthe type of processing. Thus, we show how a computational modelmight contribute to this long-standing research problem. In per-spective, we hope to stimulate new experimental and theoreticalwork motivated by the results obtained from the SWIFT-II model.
Before we present our model and its mathematical analysis, webriefly review three theoretical approaches to the control of eyemovements in reading, formulate the goals for our modeling ap-proach, and present the core theoretical assumptions as a basis forthe SWIFT-II model.
Models of Eye-Movement Control in Reading
During reading, saccadic eye movements are necessary to movewords to the center of the visual field, the fovea, where high visualacuity enables efficient word recognition. Thus, reading may belooked upon as a case study in active vision (Findlay & Gilchrist,2003), the notion that eye movements are essential for almost allvisual perception.
Given the complexity of eye-movement patterns and the con-siderable amount of variance in fixation durations, it is unclearwhether eye movements are directly guided by high-level languageprocesses. With respect to model categorization, we are interestedin the problem of whether cognitive models, mainly driven bylanguage-related properties of words (e.g., word recognition), aremore adequate than primary oculomotor control (POC) models.Models that fall into the latter category exploit low-level informa-tion (e.g., word length) to reproduce some of the basic patterns ofeye movements. For example, Reilly and O’Regan (1998) assumedthat the eye is directed to the longest word in the area of about 20characters to the right of fixation and that oculomotor errors (e.g.,overshoot or undershoot of the center of a target word) lead toproperties of within-word corrections necessary for word recogni-tion (see also O’Regan, 1990, 1992; O’Regan & Levy-Schoen,1987). McConkie, Kerr, and Dyre (1994) developed a two-statemodel, which provided a good account of within-word landingpositions (McConkie, Kerr, Reddix, & Zola, 1988). It is importantto note that effects of lexical processing on eye-movement controlare not completely excluded in POC; however, it is assumed thatthese higher level influences only modulate a control strategy thatis primarily based on low-level visual information.
Another recent primary oculomotor model was suggested byYang and McConkie (2001, 2004). The key assumption of theircompetition–interaction theory is that the temporal aspect of sac-cade planning is basically independent of lexical processing. Pro-cessing difficulty, however, can inhibit the oculomotor systemfrom initiating a saccade program.
To give new insights into the debate about cognitive versus POCmodels, it is necessary to develop a detailed model of eye-
2 We refer to the first version as SWIFT-I. For direct comparisons, thecurrent version of our model is labeled SWIFT-II.
778 ENGBERT, NUTHMANN, RICHTER, AND KLIEGL
movement control that integrates experimentally observed phe-nomena from both approaches. As an example, such a modelshould reproduce effects of word difficulty (e.g., measured byprinted word frequency) as well as oculomotor effects (e.g., sys-tematic errors in initial landing positions).
Following the terminology we proposed earlier (see Engbert etal., 2002), cognitive models may be further divided into subclassesaccording to their principles of allocation of visual attention. Twoimportant concepts are control by sequential attention shifts (SAS)and guidance by attentional gradients (GAG).
SAS models are generally based on Morrison’s (1984) proposalthat covert shifts of attention are generically performed duringfixation. On the basis of these attentional shifts, saccadic eyemovements are prepared (Deubel & Schneider, 1996; Kowler,Anderson, Dosher, & Blaser, 1995; Kustov & Robinson, 1996). Atthe same time, parafoveal information is used to start word rec-ognition. The mechanism of SAS provided a straightforward ac-count of selective skipping of short high-frequency words.
The E-Z Reader model (Reichle et al., 1998) represents the mostadvanced attempt to build a theory of eye-movement control basedon SAS. The development of this model was motivated by twoimportant findings incompatible with Morrison’s (1984) model.First, preview benefit, the shortening of processing time on sub-sequent words originating from time spent on the foveal word, ismodulated by foveal processing load (Henderson & Ferreira, 1990;Kennison & Clifton, 1995). Second, one often observes “spillover”effects due to word frequency (Rayner & Duffy, 1986); that is,lower frequency words induce longer fixation durations not onlylocally but also lengthen the fixation duration on the succeedingword. Recent further developments of E-Z Reader include landingsite distributions (Reichle et al., 1999) and improved refixationbehavior (Reichle et al., 2003), thus extending the model to repro-duce effects generated by oculomotor control principles, in addi-tion to effects of lexical processing. The interface between cogni-tion and eye-movement control in E-Z Reader was reevaluatedrecently (Pollatsek, Reichle, & Rayner, in press). In a variant of anSAS model, Engbert and Kliegl (2001) showed that it is possibleto relax the strong assumption of lexically driven saccade pro-gramming. Therefore, the SAS framework is compatible with theassumption of autonomously generated saccades, saccades that arenot induced by a lexical control loop.
In models based on GAG, there is a continuous distribution oflexical processing rate over the fixated region of text. Legge, Klitz,and Tjan (1997) proposed a gradient-type model with a saccade-targeting mechanism that minimizes the uncertainty about thecurrent word, called the ideal-observer model of reading (see alsoLegge, Hooven, Klitz, Mansfield, & Tjan, 2002).
In SWIFT-I (Engbert et al., 2002), we proposed that four wordsare processed in parallel. Processing rate is highest for the fovealword and decreases to the parafoveal words to the left and to theright of the fixated word, and there is still some parafoveal pro-cessing on the second word to the right. Although this assumptionwas rather simplified without word lengths taken into account, thismodel turned out as a viable alternative to models based on theSAS principle. To extend the range of phenomena explained bySWIFT-II and to investigate the question of serial versus parallelprocessing of words, we develop an advanced version of SWIFT inthis article. Before we start to explain the core principles of our
new model, it is necessary to clarify the goals of our attempt tomodel the control of eye movements during reading.
Modeling Goals
The reduction of a real-world problem to a number of simplerules is among the key principles of mathematical modeling. Thelevel of detail may vary across model components. As noted in arecent viewpoint article by May (2004), an approach that includesas many experimentally observed details as possible represents anabuse of mathematical modeling, because many of the knowndetails of a problem may turn out to be irrelevant to the model andsome important ingredients might be missing:
Perhaps most common among abuses, and not always easy to recog-nize, are situations where mathematical models are constructed withan excruciating abundance of detail in some aspects, whilst otherimportant facets of the problem are misty or a vital parameter isuncertain to within, at best, an order of magnitude. (p. 793)
As stated above, the main objective in our modeling approach isthe interface of visual processing of words and eye-movementcontrol. In mathematical models developed over the last few years,it turned out that the control of eye movements in reading can becaptured by a theoretical model without integrating an advancedmodel of language processing (see Reichle et al., 2003). Most ofthe variance in eye-movement patterns and many of the experi-mental phenomena can be explained by models on the basis ofrather simplified rules for word recognition and mechanisms forsaccade programming. Thus, although language comprehension isthe function of reading, many higher level linguistic processesessential to language comprehension typically have a rather smallimpact on the details of eye-movement control during reading. Tomake our modeling approach more transparent, we briefly discussthe experimentally observed phenomena that we attempt to repro-duce with our model and how to evaluate the model’sperformance.
Quantitative Measures for Goodness of Fit
The performance of computational models can be evaluated byquantitative and qualitative measures. Eye-movement patternsclearly depend on properties of lexical difficulty, which is mostcommonly characterized by printed word frequency and wordpredictability (i.e., the probability of guessing a word from thesequence of previous words of the sentence; Kliegl, Grabner,Rolfs, & Engbert, 2004; see Rayner, 1998, for a review). Althoughprinted word frequency can be computed from large text corporaand independent of context, word predictability incorporates manyaspects of a reader’s knowledge of language, depends strongly oncontext, and must therefore be estimated from experiments, ob-tained from incremental reading tasks, for each word of a givensentence. An important physical word parameter influencing eye-movement control is word length. For example, word-length in-formation acquired parafoveally is used in computing the nextsaccade length (e.g., Morris, Rayner, & Pollatsek, 1990; O’Regan,1979; Rayner, 1979). From these considerations, word frequency,word predictability, and word length will serve as independentvariables for the analysis of dependent measures discussed in thissection.
779THE SWIFT MODEL

Among the quantitative measures for the control of eye move-ments in reading are temporal variables (fixation durations), spatialvariables (probabilities for different types of saccades), and anumber of experimentally observed effects, which mainly repre-sent conditional variables, that is, more complicated combinationsof spatial and temporal measures such as fixation durations con-ditional on the fixation location within a word.
Fixation durations. Inspection times are central for evaluatingvisual information processing in reading. An important measurefor word difficulty is gaze duration (e.g., Rayner, 1998), the sumof the first fixation and all immediate refixation durations. Becauseof the large number of ways in which fixations sum up to gazeduration, gaze duration is an average measure over many differentpatterns of fixations, such as whether two successive fixations in aword occur in a forward or backward sequence. For a moredetailed look into the model’s dynamics, we aim at a representa-tion of the experimental data by nonoverlapping measures.3 There-fore, we separately calculate single fixation duration for all casesin which words receive one fixation. For the evaluation of refix-ations, we use first fixation duration4 and second fixation duration.These measures are limited to first-pass reading (i.e., fixationsafter regressions to previous words do not contribute)—irrespec-tive of whether this word had been skipped or fixated initially.Finally, we calculate total reading time, the sum of all fixationsregardless of the eye’s trajectory that generates these fixations.5
Fixation probabilities. The four measures of fixation dura-tions are complemented by four measures of fixation probabilities.The fixation-probability measures characterize the spatial aspect ofeye-movement patterns. On the basis of first-pass reading, wecalculate skipping probability, the probability for two fixations,and the probability for three or more fixations.6 Inasmuch as ourmodel inherently produces interword regressions, we also calculatethe regression probability or, more precisely, the probability that aword is the target of an interword regression.7
Effects of word length versus word frequency. Means of theabove eight measures of fixation durations and fixation probabil-ities broken down by logarithmic word-frequency classes haveachieved the status of benchmark data for the first cohort ofcomputational models of eye-movement control in reading (e.g.,Engbert & Kliegl, 2001; Engbert et al., 2002; Reichle et al., 1998).These summary statistics also proved useful for estimating modelparameters. As effects of word length and word frequency arepotentially variables of equal importance, however, we will com-pute model fits on the basis of individual words in this article.Thus, each word contributes a “data point” to the dependentvariables. This opens the possibility for a detailed inspection of themodel’s performance on single sentences. Furthermore, by aver-aging over classes of word length and frequency, we can easilydetermine effects of word length and frequency based on thesummary statistics of the earlier studies.
Within-word landing positions. An important impact of theoculomotor system on reading behavior arises from oculomotorerrors. In addition to random errors, which occur in all motorsystems, we observe a systematic component (McConkie et al.,1988). As a consequence, the preferred viewing location (Rayner,1979) is a point left of the center of a word.
Effect of inverted optimal viewing position (IOVP) of fixationdurations. As visual acuity decreases from the maximum in thecenter of the visual field (the fovea) to the parafovea and periph-
ery, word recognition is fastest when fixating an isolated word inthe center (O’Regan & Jacobs, 1992; O’Regan & Levy-Schoen,1987; O’Regan, Levy-Schoen, Pynte, & Brugaillere, 1984). Con-trary to this finding in isolated word recognition, Vitu, McConkie,Kerr, and O’Regan (2001; see also Nuthmann, Engbert, & Kliegl,2005) reported for continuous reading that first and single fixationdurations are longer for fixation positions in the word center thanfor fixation positions near word boundaries. Without further the-oretical specification, this effect is opposite to predictions ofcognitive models, which assume word recognition to be fastest(rather than slowest) near word centers.
In addition to the well-established phenomena described above,we also investigate model performance in relation to recent, stillsomewhat controversial, issues, because one major motivation forbuilding mathematical models is to generate predictions for futureresearch directions.
Fixation duration before word skipping. Fixation durationsbefore skipped words provide a fingerprint for sequential alloca-tion of attention, postulated in SAS models. The assumption thatthe default target of an automatically started saccade program isthe next word implies that word skipping involves the cancelationof this saccade program and a restart of a new saccade program tothe word beyond the next one. Such saccade cancelation increasesfixation durations before skipped words; that is, it leads to skippingcosts. In a recently published analysis, this theoretical predictionwas not consistently supported with experimental data from con-tinuous reading (Kliegl & Engbert, 2005). Therefore, we investi-gate fixation durations before word skipping as a model test.
Lag and successor effects. Fixation durations on a given worddepend not only on the length, frequency, and predictability of thefixated word but also on these properties of the previous (i.e., lag)and the next (i.e., successor) words (Kliegl, Nuthmann, & Engbert,2005). Indeed, lag effects are of similar strength to the effects offixated word properties, inducing a longer average fixation dura-tion on words following low-frequency, low-predictable, or longwords. One of several possible interpretations of this phenomenonis that processing time spills over from word n � 1 to word n (e.g.,Rayner & Duffy, 1986). Analogously, we can study successoreffects of word n � 1 on fixation durations of word n, a subset ofwhich are called parafoveal-on-foveal effects (Kennedy, 2000a,2000b; Kennedy & Pynte, 2004). Mechanisms that reproduce theseexperimental observations might lead to qualitative differencesbetween different models.
3 Nevertheless, we use gaze duration as a derived measure in Appen-dix D.
4 In the following, we compute first fixation durations as an average ofall cases with a second (or more) fixation, excluding single-fixation cases.Traditionally, however, first fixation durations include single-fixationcases (e.g., Rayner, 1998).
5 This category is necessary to collect all possible fixation sequences ina “rest” category.
6 By definition, the probability for a single fixation can be calculated by1 minus the sum of the probability of skipping and the probabilities of twoand three or more fixations.
7 In the following, we use the expression regression for interwordregressions exclusively; refixations oriented to the left are called regressiverefixations.
780 ENGBERT, NUTHMANN, RICHTER, AND KLIEGL

Qualitative Aspects of Model Fitting
Several of the dependent variables mentioned above representqualitative measures of model performance. For example, modelsmay differ in (a) whether they account for regressions, (b) whetherthey reproduce the IOVP effect, (c) whether they exhibit costs for(or benefits from) word skipping, and (d) whether they reproducepatterns of lag and successor effects. Such qualitative aspects ofmodel fitting are very important to test whether a model’s mech-anism for reproducing an experimentally observed effect is correct,whether it is the only possible explanation, and whether it ispossible to develop alternative mechanisms.
Given the substantial amount of knowledge about the neuralfoundation of saccade generation, the neurophysiological plausi-bility of models of eye-movement control is a further qualitativecriterion for the evaluation of theoretical models. A very generalmodel for the generation of saccades has been proposed by Findlayand Walker (1999); this model is built on the assumption of twoseparate pathways concerned with the spatial and the temporalprogramming of eye movements. From this perspective, readingmight be looked on as a case study for the control of eye move-ments in a well-structured environment. Therefore, we require thatmodeling assumptions should be special cases of the generalprinciples proposed by Findlay and Walker.
Closely related to this point is model generalizability. In read-ing, eye movements are effectively one-dimensional along thehorizontal axis (except for return sweeps to the next line of text).Here we can ask whether and how the model’s control principlescan be extended to two-dimensional trajectories, for example, invisual search. Ideally, a model for the control of eye movements inreading should be generalizable to and theoretically enrich theanalysis of eye movements in visual search.
Core Concepts of Our Model
Before we present the detailed mathematical formulation, wesummarize the core principles of the SWIFT-II model in briefstatements (see Table 1). The principles are elaborated and dis-cussed in detail in the following paragraphs.
Spatially distributed processing of an activation field (Principle1): In our dynamic-field approach (e.g., Erlhagen & Schoner,2002), all types of saccades are generated inherently to the model,as target selection is due to a competition among words withdifferent activations. The parallel build-up of activations overseveral words implies that processing is distributed across severalwords at a time.
Separate pathways for saccade timing and saccade target se-lection (Principle 2): Motivated by neurophysiological findings,temporal and spatial aspects of saccade generation are controlledon different pathways (Findlay & Walker, 1999). Therefore, theproblems of when to start the next saccade program and where togo next, are decoupled.
Autonomous saccade generation with time-delayed foveal inhi-bition (Principle 3): Saccade programs are generated autono-mously, so that fixation durations are basically realizations of arandom variable. This stochastic process is modulated by a fovealinhibition process to extend the inspection times for difficultwords. Because this inhibitory process is based on a slower word-recognition circuit (compared with the short brainstem saccadegenerator; e.g., Carpenter, 2000), the inhibitory process includes atime delay.
Two-stage saccade programming with labile and nonlabile lev-els (Principle 4): Programming of saccades is a two-stage process,motivated by results from the double-step paradigm (Becker &Jurgens, 1979). During the labile stage, the oculomotor system isprepared for the next saccade program. A new initiation of asaccade program during the labile stage leads to a cancelation ofthe first saccade program and starts a new saccade program. At theend of the labile stage, the target is selected from the field ofactivations, a point-of-no-return is passed, and the saccade can nolonger be canceled.
Systematic and random errors in saccade lengths (Principle 5):The oculomotor system inherently produces saccadic errors, thatcan be decomposed into systematic and random components (Mc-Conkie et al., 1988). As a consequence, in addition to randomvariability in fixation positions, systematic shifts in within-wordlanding position distributions as a function of launch-site distanceare observed. Misguided saccades may also lead to fixations onunintended words (mislocated fixation, see below).
Error correction of mislocated fixations (Principle 6): Experi-mental data suggest and our simulations show that saccades fre-quently land on unintended words, which leads to mislocatedfixations (Nuthmann et al., 2005; see also Rayner, Warren, Juhasz,& Liversedge, 2004). In this case, we assume that a new saccadeprogram starts immediately, that is, the autonomous timer is over-ruled. The target of this saccade will be determined at the end ofthe labile saccade stage according to the general rule (Principle 4).This error-correcting mechanism can explain the IOVP effect offixation durations.
Modulation of saccade latency by intended saccade amplitude(Principle 7): As a final principle, we assume that saccade latencyis modulated by the amplitude of the intended saccade. Because inour model saccade target selection is performed at the end of thelabile stage of the saccade program—the intended saccade ampli-tude is computed at the end of the labile stage—only the nonlabilestage can be influenced by the intended saccade amplitude. Wewill show that this principle, which is motivated by basic oculo-motor research (e.g., Wyman & Steinman, 1973), contributes tothe explanation of the IOVP effect in fixation durations.
Given the core principles, there is no unique way for a transla-tion into mathematics, of course. Therefore, we discuss the specificchoice of mathematical equations in the next section. Once for-mulated mathematically, we can implement the model on a com-puter to generate artificial data, which can be analyzed using thesame algorithms as applied for the analysis of experimental data.
Table 1Core Principles of the SWIFT Model
No. Principle
1 Spatially distributed processing of an activation field2 Separate pathways for saccade timing and saccade target selection3 Random saccade generation with time-delayed foveal inhibition4 Two-stage saccade programming with labile and nonlabile stages5 Systematic and random errors in saccade lengths6 Error correction of mislocated fixations7 Modulation of saccade latency by saccade length
781THE SWIFT MODEL

Moreover, semianalytical techniques may add to our understand-ing of the control principles underlying eye movements in reading(e.g., Engbert & Kliegl, 2003a).
Mathematical Formulation of the Model
Dynamic Field of Activations
Our model is a cognitive model with word recognition drivingeye movements. In SWIFT, a one-dimensional field of activations{an(t)} for words n � 1, 2, 3, . . . , Nw at time t functions as asaliency map, from which potential saccade targets are computed(Principle 1). It is no limitation of the formalism that the numberof words, Nw, in a given sentence is unknown when reading thefirst words of the sentence, as the number of words could bespecified later in the reading process. Furthermore, it will turn outthat word j with index j � n � 4 typically has close to zeroactivation during fixation on word n. Thus, there is a limitedhorizon of saccade targets constrained by target selection proba-bilities at any time.8
The activation field {an(t)} changes over time because of wordrecognition. Activation is built up in a preprocessing stage anddecreases during a later lexical completion process. The relativeamount of activation will determine the probability that a word isselected as a saccade target. It is important to note the dynamicalnature of the interplay between lexical processing and eye-movement control. Fixation position has a strong impact on word-recognition time, which determines the temporal evolution of theactivation field. Because the activation field determines saccadetargets, our model inherently exhibits historicity, that is, a strongdependence on the previous sequence of fixations. Historicity is akey property of nonlinear dynamical systems. Formulated from ageneral mathematical viewpoint, nonlinearity of the underlyingequations in SWIFT adds a new source of complexity in eyemovements to the stochastic origins in previous models (Engbert,Kliegl, & Longtin, 2004).
Word Difficulty
The assumption of an activation field still leaves open howlexical difficulty of words is represented. Here we assume that themaximum activation Ln of word n is related to the word’s process-ing difficulty. Our approach to this problem is based on a proposalby Reichle et al. (1998) that word difficulty depends on printedword frequency (per million words) and predictability. Previoustheoretical models were based on a multiplicative interaction ofword frequency and predictability (Engbert & Kliegl, 2001, 2003b;Engbert et al., 2002, 2004; Reichle et al., 1998, 1999, 2003).
Recently, Rayner, Ashby, Pollatsek, and Reichle (2004) pub-lished an experimental study demonstrating that fixation durationsonly mildly departed from an additive combination of word fre-quency and predictability: Predictability effects were larger forlow-frequency than for high-frequency words. Additional numer-ical simulations using different variants of the E-Z Reader modelindicated that an additive model of word frequency and predict-ability fit better than the previous multiplicative one. Thus, Rayneret al.’s (2004) results suggest that the specific mathematical inter-action of word frequency and predictability is additive (or a
mixture of additive and multiplicative) rather than strictlymultiplicative.
Here, we propose an alternative view on the interaction of wordfrequency and predictability. The combination of word frequencyfn and predictability pn of word n in a single equation for worddifficulty might be problematic because of the temporal charac-teristics inherent in the two variables. Whereas word frequencyinformation unfolds during the word-recognition process, wordpredictability is by definition independent of visual input. Thus,we suggest different processes of how the two variables generatecertain modulations of processing times. First, we assume thatword difficulty—as a variable in our model—can be estimatedfrom word frequency alone, that is,
Ln � ��1 � �log fn
F � , (1)
where � is the intercept value of the lexical access time, which ismodulated by the (natural) logarithm of word frequency, fn, withslope parameter �. The constant F � 11 is used to scale the valuesof log fn to a range in the interval [0; 1], so that the coefficient �is dimensionless and characterizes the strength of the frequencyeffect.
Second, we assume that word predictability modulates process-ing rates. As a consequence, the impact of predictability pn on thetime course of processing of word n might be earlier than theimpact of word frequency. The mathematical implementation ofthese processes is described below in the section on the equation ofmotion of our model. We speculate that such a process dissociationunderlying effects of word frequency and predictability will yieldneither a strictly additive nor a strictly multiplicative interaction,which could be compatible with the above experimental results byRayner et al. (2004).
Lexical Processing Rate
For spatially distributed processing, we assume that lexicalprocessing rate, denoted by � � 0, is a function of the distance(eccentricity) of a word to the current fixation position. Thisdistance must be a function of the eccentricities of all letters of theword. We show later that this assumption has strong implicationsfor spatial aspects of lexical processing.
The fixation position at time t is denoted by k(t), where the rangeof k can be from 1 to the number of all characters, spaces, andpunctuation marks in the sentence.9 Motivated by the well-knownbias of processing in the direction of reading, fixations on thespaces between words are counted as fixations on the words to theright of the spaces. The processing rate of word n is a function ofprocessing rates of all letters j � 1, 2, 3, . . . , Mn, where Mn is thenumber of letters of word n. We assume that processing speed ismainly limited by visual acuity, which is a function of the distancefrom the center of the visual field (i.e., the fovea). The distance ofletter j of word n from the current fixation position is given by theeccentricity
8 Note that this horizon is the result of the model’s dynamics, not an adhoc choice in building the model.
9 In the first version of our model (Engbert et al., 2002), we neglectedword length, and fixation position k was the index of the fixated word.
782 ENGBERT, NUTHMANN, RICHTER, AND KLIEGL
�nj�t� � xnj � k�t�, (2)
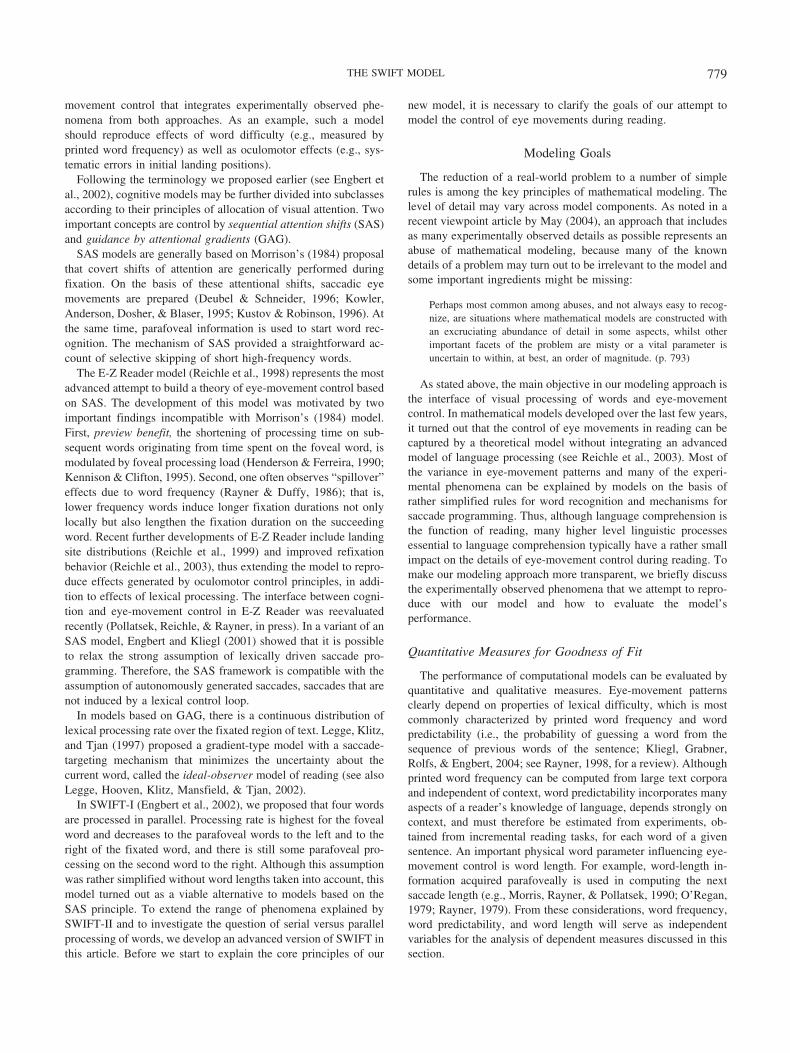
where xnj is the position of letter j of word n. Lexical processingrate is a function of eccentricity, � � �(�). The size of theperceptual span decreases from at least 10 letters in central visionto 1.7 letters at an eccentricity of 15° (Legge, Mansfield, & Chung,2001). This decrease is related to a corresponding reduction ofreading rate. Because of the asymmetry of the perceptual span(McConkie & Rayner, 1976; Rayner, Well, & Pollatsek, 1980), weassume an asymmetric Gaussian function as the mathematicalrelation between lexical processing rate and eccentricity, that is,
���� � �0 exp �� �2
22� with � � L, if � 0 � R, if � � 0 , (3)
where L characterizes the extension of the processing rate to theleft and R applies to the processing of letters to the right of thecurrent fixation position (see Figure 1). The normalization constant�0 of the lexical processing rate function, Equation 3, can easily becalculated from the normalization condition
1 � ���
��
����d� � ���
0
�0 exp�� �2
2L2�d�
� �0
��
�0 exp�� �2
2R2�d�, (4)
which yields the relation10
�0 � �2
�
1
R � L. (5)
Using the normalization, total lexical processing rate is fixed at aconstant value of 1. This value is the theoretical maximum oflexical processing rate, which can be reached if letters are arrangedalong the horizontal axis from �� to ��. In a realistic situation,this will never occur, of course. Thus, the total lexical processingrate will effectively be bounded between 0 and 1.
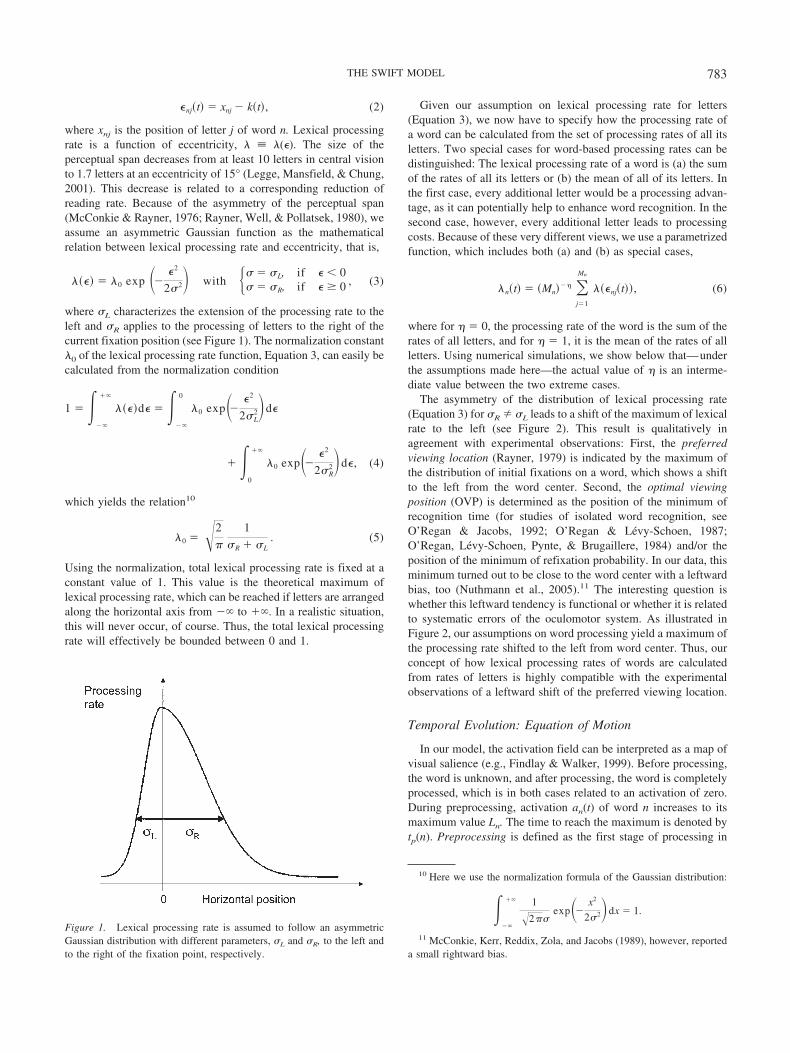
Given our assumption on lexical processing rate for letters(Equation 3), we now have to specify how the processing rate ofa word can be calculated from the set of processing rates of all itsletters. Two special cases for word-based processing rates can bedistinguished: The lexical processing rate of a word is (a) the sumof the rates of all its letters or (b) the mean of all of its letters. Inthe first case, every additional letter would be a processing advan-tage, as it can potentially help to enhance word recognition. In thesecond case, however, every additional letter leads to processingcosts. Because of these very different views, we use a parametrizedfunction, which includes both (a) and (b) as special cases,
�n�t� � �Mn��� �
j�1
Mn
���nj�t��, (6)
where for � � 0, the processing rate of the word is the sum of therates of all letters, and for � � 1, it is the mean of the rates of allletters. Using numerical simulations, we show below that—underthe assumptions made here—the actual value of � is an interme-diate value between the two extreme cases.
The asymmetry of the distribution of lexical processing rate(Equation 3) for R L leads to a shift of the maximum of lexicalrate to the left (see Figure 2). This result is qualitatively inagreement with experimental observations: First, the preferredviewing location (Rayner, 1979) is indicated by the maximum ofthe distribution of initial fixations on a word, which shows a shiftto the left from the word center. Second, the optimal viewingposition (OVP) is determined as the position of the minimum ofrecognition time (for studies of isolated word recognition, seeO’Regan & Jacobs, 1992; O’Regan & Levy-Schoen, 1987;O’Regan, Levy-Schoen, Pynte, & Brugaillere, 1984) and/or theposition of the minimum of refixation probability. In our data, thisminimum turned out to be close to the word center with a leftwardbias, too (Nuthmann et al., 2005).11 The interesting question iswhether this leftward tendency is functional or whether it is relatedto systematic errors of the oculomotor system. As illustrated inFigure 2, our assumptions on word processing yield a maximum ofthe processing rate shifted to the left from word center. Thus, ourconcept of how lexical processing rates of words are calculatedfrom rates of letters is highly compatible with the experimentalobservations of a leftward shift of the preferred viewing location.
Temporal Evolution: Equation of Motion
In our model, the activation field can be interpreted as a map ofvisual salience (e.g., Findlay & Walker, 1999). Before processing,the word is unknown, and after processing, the word is completelyprocessed, which is in both cases related to an activation of zero.During preprocessing, activation an(t) of word n increases to itsmaximum value Ln. The time to reach the maximum is denoted bytp(n). Preprocessing is defined as the first stage of processing in
10 Here we use the normalization formula of the Gaussian distribution:
���
�� 1
�2�exp�� x2
22�dx � 1.
11 McConkie, Kerr, Reddix, Zola, and Jacobs (1989), however, reporteda small rightward bias.
Figure 1. Lexical processing rate is assumed to follow an asymmetricGaussian distribution with different parameters, L and R, to the left andto the right of the fixation point, respectively.
783THE SWIFT MODEL
our model.12 In a second stage, called lexical completion, theactivation tends to zero until it is completely processed. An addi-tional process is decay of activation, assuming a nonidealizedmemory with leakage.
The temporal evolution of activations during reading of a sen-tence consisting of Nw words is governed by a system of Nw
coupled ordinary differential equations (ODEs),
dan�t�
dt� Fn�t�n�t� � , (7)
where• Fn(t) is a preprocessing factor, modulated by predictability,• n(t) is a stochastic variable for processing rate, and• gives the strength of the global decay process.
Now we discuss these three processes in more detail. The decayprocess is introduced as a global parameter, which induces a slowdecrease of activations of all words with a constant rate and maybe interpreted as a memory leakage, which prevents the exacttracking of processing states for all words.
The preprocessing factor Fn(t) introduces an asymmetry be-tween preprocessing and lexical completion, which is also modu-lated by predictability. First, during preprocessing, preliminaryinformation on a specific word will be accumulated for potentialtarget selection. The preprocessing factor introduces an asymmetrywith a fast increase and a slower decrease of activation. Thequestion of how much lexical (orthographic or semantic) informa-tion can be accessed using parafoveal information is an openresearch problem and clearly beyond the scope of the currentarticle (see Rayner & Juhasz, 2004, for a recent review). We returnto this problem below. We would like to comment here thatpreprocessing of a word is a rather preliminary stage of processingin our model, which mainly adds the word to the set of possiblesaccade targets, that is, all words with an(t) � 0.
Second, as noted above in the section on word difficulty, weassume that the predictability pn of word n modulates the process-ing rate. We assume that for high-predictable words, that is, withpn close to 1, processing rate is decreased during preprocessing aslong as the word is not fixated. This assumption is motivated bythe fact that for a high-predictable word there is a high probabilitythat the word can be guessed without (or with minimal) visualinput. As a consequence, the activation of a parafoveal high-predictable word should build up more slowly than the activationof a parafoveal low-predictable word. Because activations repre-sent a measure for target selection probability in our model, therewill be a higher skipping probability for high-predictable words.Because word recognition will be faster for high-predictable wordsthan for low-predictable words, however, we assume that process-ing rate increases with predictability once the word is in the lexicalcompletion state, that is, the state with decreasing activation.Mathematically we formulate these mechanisms as
Fn�t� � ��f�1 � �pn� if t tp�n� and k � n
(parafoveal preprocessing)�f if t tp�n� and k � n
(foveal preprocessing)��1 � �pn� if t � tp�n�
�lexical completion�
, (8)
where f � 1 indicates that preprocessing is faster than lexicalcompletion and the factors (1 � �pn) generate the proposed mod-ulations by predictability.
Finally, lexical completion is implemented as a memory-retrieval process, which is known to be inherently stochastic (e.g.,Ratcliff, 1978). As a consequence, we explicitly simulate a randomwalk for the temporal evolution of activations, that is, for bothpreprocessing and lexical completion. Therefore, we assume thatthe lexical processing rate �n(t) of word n fluctuates around itsmean with a standard deviation proportional to its mean,
n�t� � �n�t��1 � ��t�, (9)
where �t represents Gaussian noise with zero mean and a standarddeviation of one. Noise samples are uncorrelated between integra-tion time steps. For all simulations presented here, we chose � �2, which produces a reasonable amount of stochasticity in wordrecognition. An example for the resulting stochastic activationprocess is illustrated in Figure 3.13
Saccade Target Selection
Given the principles for the temporal evolution of the set oflexical activations, {an(t)}, assumptions on saccade target selec-tion are straightforward.14 Saccade target selection is a competitiveprocess among all activated words, that is, among all words with
12 Note that the distinction between preprocessing and lexical comple-tion does not refer to parafoveal versus foveal processing.
13 For a study of the role of noise in a model of eye-movement control,see Engbert and Kliegl (2003b).
14 Whereas the lexical processing assumption had to be modifiedstrongly because of letter-based metrics of words in the new version of ourmodel, the mechanism of saccade target selection is effectively the same asin the first version of our model (Engbert et al., 2002).
Figure 2. Lexical processing rate as a function of word length andfixation position relative to word center. The within-word maxima areshifted to the left with increasing word length. For � � 0.5, lexicalprocessing rate shows an absolute maximum of � � 0.32 at relativefixation position k � �1.37 for word length 7. In this example, theparameters of the asymmetric Gaussian are chosen as R � 3.6 letters andL � 1.4 letters. The bold lines correspond to within-word fixation posi-tions; the dashed lines indicate fixation positions beyond the word edges.
784 ENGBERT, NUTHMANN, RICHTER, AND KLIEGL

an(t) � 0. As a consequence, if words are activated in parallelsubstantially,15 the model can potentially generate all types ofsaccades observed in experiments (e.g., word skipping,refixations).
In mathematical terms, we assume that target selection is astochastic process. The probability �(n, t) to select word n as asaccade target at time t is given by its relative lexical activation,
��n, t� �an
��t�
�j�1
Nw
aj��t�
, (10)
where the exponent � is a measure for the stochasticity in the targetselection process. We can consider two special or extreme cases ofhow target words are selected,
• � � 0: Target selection probability for all words with nonzerolexical activation is equal (random target selection), and
• � 3 �: Target selection is deterministic; the word withhighest activation is the next saccade target (“winner-takes-all”).
Previous simulations have shown that � � 1 gives the best fits.In this case, target selection probability is proportional to relativelexical activation, which is known as Luce’s (unbiased) choice rule(Luce, 1959).
Control of Fixation Duration by Foveal Inhibition
According to Principle 3, saccade timing is a stochastic process,which is modulated by the amount of foveal activation. We assumethat the time interval between two commands to initiate a saccadeprogram is purely stochastic with a predefined mean tsac, which isrelated to a reader’s individual reading rate. The inhibitory mod-ulation of this random process will be derived in two steps.
First, the fixation duration on word n is modulated by theamount of foveal activation. Let us denote the time of initiation ofthe saccade program for saccade i by ti. The next command forstarting a new saccade program i � 1 will happen after a stochasticinterval ti�1 with mean value tsac. This interval will, however, beprocrastinated by an inhibitory top-down signal from the lexical
processing module. The next command for starting saccade pro-gram i � 1 is generated, if
t � ti � ti�1 � hak�t�, (11)
where h gives the strength of the foveal inhibition process. Notethat the prolongation is limited even for arbitrarily high values ofthe constant h. Using an analytical approximation (Kliegl & Eng-bert, 2003), we have shown that the maximum inhibition time T isgiven by
T ��
��0� � 1/hO¡h3 � �
��0�, (12)
where �(0) is the foveal processing rate defined in SWIFT-I(Engbert et al., 2002).
Second, processes of word recognition are much slower than thefast brainstem saccade generator (e.g., Sparks, 2002). Therefore,word recognition can impact the saccadic system only with a timedelay. This assumption is motivated by the plausibility argumentthat the module for lexical processing performing word recogni-tion is physiologically separated from the oculomotor nuclei of thebrainstem, which will produce a time delay for the impact ofprocessing difficulty on the control of fixation durations. To sup-press noise, we introduce an additional integral average over theinterval from t � � to 0 for the inhibition process and replaceEquation 11 by
t � ti � ti�1 � h�ak��, (13)
where
�ak�� �1
� �t��
0
ak�t��dt�. (14)
Thus, the average delay is �/2. An important property of thisimplementation is that for a time delay of the order of the averagefixation time, the evaluated activation in Equation 14 refers to aprevious fixation, which frequently occurred on the previous word.Thus, the concept of time-delayed foveal inhibition can potentiallyexplain lag effects of processing.16
Saccade Programming
Programming of saccades is a two-stage process involving alabile and a nonlabile stage. First, after starting a saccade program,a labile stage with an average duration �lab is entered. If there isanother saccade command in this period of time, the labile stagecan be canceled. In principle, saccade cancelation can happensuccessively. Using numerical simulations of our model, we foundthat 90.0% of all saccades are not canceled during the labile stage,8.6% are canceled once, and 1.1% are canceled twice (all othercases are negligible).
15 The degree of parallel activation is not only a question of the modelarchitecture. It will depend on the values of model parameters.
16 A simpler but both psychologically and neurophysiologically lessplausible generalization of foveal inhibition would have been to add a newterm �h1ak�1(t) to the right-hand side of Equation 11.
Figure 3. Illustration of the time evolution of stochastic activation by theequations of motion (Equations 7–9). The activation is a random-walkmodel, which accounts for the inherent stochasticity in the memory-retrieval process underlying word identification.
785THE SWIFT MODEL

Second, the nonlabile stage with average duration �nl is enteredafter the labile stage terminates. The transition from labile tononlabile stage triggers the target selection process (Equation 10).The two-stage organization is illustrated in Figure 4. The saccadeexecution is included in the model with average duration �ex.
During saccades, sensitivity to visual input is reduced, an effectcalled saccadic suppression (Matin, 1974). Because visual inputstops during saccades, preprocessing is paused in SWIFT. Becauseof an eye-to-brain lag of approximately 50 ms (e.g., Foxe &Simpson, 2002; see also Reichle et al., 2003), preprocessing isinterrupted for the duration of the saccade with a temporal delay of50 ms (for both onset and offset of the saccade).17 Because lexicalcompletion should not depend critically on new visual input, weassume that lexical completion continues during saccades.
In the context of programming of saccades during reading, theassumption of two stages was first introduced by Reichle et al.(1998; see also Engbert & Kliegl, 2001) and later used in SWIFT-I(Engbert et al., 2002). The main motivation for the assumptionderives from the double-step paradigm in saccade generation(Becker & Jurgens, 1979), which was used to demonstrate thatpresentation of a second target earlier than approximately 250 msafter the first could induce a cancelation of the saccade to the firsttarget. A later presentation, however, led to fixations of bothtargets in a sequence. This effect is captured by passing a “point-of-no-return” at the transition from labile to nonlabile stages ofsaccade programming in our model.
Oculomotor Errors in Saccade Generation
Our assumptions on saccadic errors inherent to the oculomotorsystem are based on results by McConkie et al. (1988). Thetheoretical assumption underlying their analyses was that saccadesare directed toward the center of a target word. These saccades,however, are modified by random as well as systematic errorcomponents, so that, on average, a small deviation of the initiallanding position from the word center is observed. The systematicerror component is known as the range effect (see also Kapoula,1985; Poulton, 1981). Let us denote the intended saccade ampli-
tude, the distance to the optimal viewing position of the next targetword, by A. The realized saccade length l is given by the sum ofthe intended saccade amplitude A and two error terms,
l � A � lSRE � lG, (15)
where lSRE is called the saccade range error (systematic error) andlG is Gaussian-distributed random error with zero mean.
The systematic deviation of the saccade length l from theintended saccade amplitude A can be interpreted as a limitedadaptivity of the oculomotor system to arbitrary saccade lengths. Ifthe intended saccade amplitude A differs from an optimal saccadeamplitude A0, we observe undershoot for A � A0 and overshoot forA � A0. In a linear approximation of this effect, we can write thesaccade range error as
lSRE � �SRE�A0 � A�, (16)
where �SRE gives the strength of the saccade range error.The oculomotor noise is a Gaussian-distributed random compo-
nent of the saccadic errors with zero mean. Generally, we observean increase in random errors with movement amplitude in almostall processes of motor control (Poulton, 1981). For simplicity, weassume, again in a linear approximation, that the standard devia-tion of the random error can be approximated by the linear relation
G � �0 � �1A. (17)
From the perspective of minimal modeling, we aim at a modelwith as few parameters as possible. Fortunately, oculomotor errorsdo not add free parameters to the model, as all parameters inEquations 16 and 17 can be estimated directly from experimentaldata (McConkie et al., 1988). The four parameters (�SRE, A0, �0,and �1), however, may have different values for forward saccades,refixations, and regressions. Using the data obtained on the Pots-dam Sentence Corpus (Kliegl et al., 2005), we estimated theparameters of the saccade range error separately for these threetypes of saccades and used the same value in the case of therandom error component (see Table 2). The result indicates that theparameters are very similar for forward saccades and refixations.18
For regression, we observe a much smaller coefficient, �SRE, whichis in agreement with Radach and McConkie’s (1998) observationof a negligible saccade range error for interword regressions.
Mislocated Fixations and Error Correction
In the previous section, we discussed oculomotor errors insaccade generation with systematic and random components. Al-though even small errors will influence processing rates due to ourassumption of a processing gradient, which is limited by visualacuity, saccadic undershoot and overshoot can lead to fixations onunintended words (see Figure 5). These mislocated fixations aremost likely to happen close to word boundaries (Nuthmann et al.,2005). We assume that these misguided saccades are immediatelycorrected by starting a new saccade program, if there is currently
17 Using numerical simulations, we found no significant impact of theeye-to-brain lag on our results. We kept this assumption, however, forphysiological plausibility.
18 The negative sign of the factor �SRE is due to the definition of thesaccade range error in Equation 16.
Figure 4. Temporal scheme of saccade programming. After the start ofthe saccade program, a labile (lab) stage is entered, which signals theengagement of the oculomotor system. At the end of the labile stage, thesaccade target is determined and the saccade can no longer be canceledduring the nonlabile (nl) stage. Finally, the saccade is executed (ex) and thefixation position shifts to a new position.
786 ENGBERT, NUTHMANN, RICHTER, AND KLIEGL

no labile saccade program active.19 To implement this assumptionin the simulation algorithm, we introduce a vanishing intersaccadeinterval,
timisloc � 0, (18)
for mislocated fixations. Thus, the mean interval between twosaccade program initiations, ti, will be shortened by thismechanism.
On average, the shortening of the intersaccade interval willinduce a decreased fixation duration close to word boundaries—atbeginnings and ends of words—which was observed in the IOVPeffect of fixation duration by Vitu et al. (2001). Generally, such amechanism is compatible with all models of eye-movement con-trol that (a) specify a target word for each saccade and (b) includeoculomotor errors (see Nuthmann et al., 2005 for details).
What are potential mechanisms for the immediate start of anerror-correcting saccade program? It is commonly accepted thatsaccade amplitudes are determined by population-coded activa-tions in the superior colliculus (e.g., Sparks, 2002, for a recentreview). Accordingly, a single saccade is controlled by an effer-ence copy of the motor signal to the eye muscles (Carpenter, 2000;Wurtz, 1996). Thus, errors are monitored during saccades. Re-cently, the idea that activation in the superior colliculus representssaccade vectors was challenged by Bergeron, Matsuo, and Guitton(2003), who demonstrated that collicular activation is related togaze error in multistep gaze shifts. Regardless of whether saccadesteps during reading are best described as single movements ormultistep vectors (see also Krauzlis & Carello, 2003), the bottom-line from our current knowledge on the function of motor maps in
the superior colliculi is that gaze errors are monitored continu-ously, which potentially provides a very fast detection of saccadeerrors. Thus, neurophysiological findings support the fast error-correction mechanism assumed in our model.
Saccade Latency Modulation
The error-correction mechanism in case of mislocated fixationsdiscussed in the previous section will lead to decreased fixationdurations near word boundaries. This effect, however, will turn outto be more pronounced in experimental data compared with modelsimulations for first fixations. Assuming that the center of the wordis the unique saccade target, the programming of a refixation witha first fixation placed very close to the word center is a very specialsituation, in which the intended saccade amplitude is rather small(i.e., one to two letters). Thus, if we assume an increased saccadeprogramming time for small intended saccade amplitudes, we canexplain the pronounced peak in first fixation durations. A basicdependence of saccade latency on intended amplitude has beendemonstrated in several studies (Adams, Wood, & Carpenter,2000; Kalesnykas & Hallett, 1994; Wyman & Steinman, 1973). Itseems appropriate to remark, however, that such an effect will bevery difficult to test experimentally in continuous reading.
From these considerations, we introduce a modulation of sac-cade programming time by intended saccade amplitude. In princi-ple, such a modulation could occur at all stages of saccade gen-eration, that is at the level of intersaccade intervals or the labile andnonlabile program stages. In SWIFT, the most likely saccadetarget can be read off from the activation fields any time thisinformation is required. For simplicity, we assume that the non-labile saccade stage, �nl, is affected by the intended saccadeamplitude, A, that is, that the modulation occurs after targetselection.
The impact of a dependence �nl � �nl(A) on reading behaviordepends on the range of the intended saccade amplitude A consid-ered. For short amplitudes, A � 4, the saccades are mainly intra-word movements, whereas for longer amplitudes, A � 6, mostsaccades are interword movements to the right. Therefore, forshort saccades the functional relation �nl(A) will modulate theIOVP effect, whereas for longer saccades the relation will affectsuccessor effects, because a decreasing saccade latency with in-creasing intended saccade amplitude will produce shorter fixationdurations before long parafoveal words compared with shortparafoveal words. Consequently, it will be very difficult to disen-
19 If there is already an active saccade program, the process of (potential)error correction cannot be accelerated.
Table 2Parameter Values for Oculomotor Error Relations
Error type ParameterForwardsaccade
Forwardrefixation
Regressiverefixation Regression Reference
Saccade �SRE 0.41 0.49 �0.5 �0.15 Equation 16Range error A0 5.4 5.7 4.3 10.0 Equation 16
Gaussian �0 0.87 Equation 17Random error �1 0.084 Equation 17
Figure 5. Saccadic undershoot and overshoot can result in fixations onunintended words (mislocated fixations). (a) Unintended forward saccadedue to undershoot. (b) Unintended skipping due to overshoot.
787THE SWIFT MODEL

tangle latency modulation from effects of lexical processingexperimentally.20
For simplicity, we assume that the average duration of thenonlabile saccade stage is a Gaussian-type function of the intendedsaccade amplitude A,
�nl�A� � �nl0 � �0 exp ���1A
2�, (19)
where the parameter �nl0 is the average asymptotic nonlabile sac-
cade programming time, �0 represents the strength of the modu-lation, and �1 determines the width of the modulation by theintended saccade amplitude. In all simulations presented here, wefix �1 at a value of 0.1.
Stochasticity in Saccade Programming
After the nonlabile stage of saccade programming terminates,the saccade will be executed. We assumed that the mean saccadeexecution time is �ex � 25 ms. For the simulation of noise in bothsaccade programming and saccade execution, we use a gammadistribution with a relation between standard deviation and meanof 1/3, a gamma distribution of 8th order.
Model Overview
In this section, we briefly summarize how the different sub-systems of our model are orchestrated (see Figure 6) before weaddress the numerical simulations of the model. Word recognitionis implemented as a spatially distributed process (Principle 1). Aset of lexical activations keeps track of the actual state of wordprocessing and controls saccade target selection (“where”) andsaccade timing (“when”) via foveal inhibition using two separatepathways (Principle 2). The lexical decision circuit, which is acortical long-loop control system compared with the brainstemsaccade generator, can influence saccade timing by foveal inhibi-tion only with a time delay � (Principle 3). Saccade programmingis a two-stage process (Principle 4). After a labile stage, a point ofno return is passed and the nonlabile stage is entered. Targetselection occurs at the transition from labile to nonlabile stage.21
Numerical Simulations and Model Parameters
On the basis of Principles 1 to 7 of the model (see Table 1), wediscussed the precise mathematical formulation and some motiva-tions for the underlying assumptions in the last section. Next, wecarry out numerical simulations to fit the model’s parameters andto compare the model’s performance with experimental data.22
Compared with the first version SWIFT-I (Engbert et al., 2002),we completely redesigned the numerical and statistical proceduresand proposed a new and more detailed test of computationalmodels of eye-movement control in reading.
First, we used a recently published experimental study with thePotsdam Sentence Corpus (for details on the sentence corpus, seeKliegl et al., 2004), which was meanwhile extended from 65 to 222participants (Kliegl et al., 2005). With this amount of experimentaldata, we were able to analyze all of the discussed phenomena onthe same data set. Because many effects are produced by highlynonlinear interactions, deviations in one empirical observable canpotentially produce considerable deviations in other measures.Therefore, a strong test of model performance must be based on asingle complete data set.23
Second, we computed all experimental measures for each word.The Potsdam Sentence Corpus consists of 1,138 words from 144sentences. For statistical analyses, we currently exclude the firstand last words from each sentence from our analysis. Therefore,we obtained a maximum of eight measures (four fixation durationsand four fixation probabilities) for each of 850 words, yielding atotal of 6,800 data points for model fitting. This procedure is amajor advantage compared with the parameter-fitting proceduresused for SWIFT-I and E-Z Reader 1–7. In these analyses, for onlysix measures (three fixation durations and three fixation probabil-ities), statistical averages were calculated on the basis of fiveclasses of word frequency, yielding an empirical basis of 30 datapoints. The possible range of data patterns that could be explainedby those models was very limited because of nonlinear interactionsof parameters. Therefore, although we still believe that the previ-ous method produced reliable results, we clearly suggest that theprocedure proposed here should be used in future modelingstudies.
Third, given the word-based nature of the measures, we com-puted chi-square-type statistics to evaluate the model (see Appen-dix A for details). Furthermore, we investigated effects of wordfrequency, predictability, and word length by averaging word-based measures over classes. Finally, we tested more specificeffects (e.g., IOVP, lag effects) based on the same simulated dataset.
20 Note, however, that with our choice of �1 � 0.1 in Equation 19,latency modulation will predominantly affect IOVP effects in our model.
21 Principles 5 to 7 (see Table 1) are related to saccadic errors andsaccade program latencies; we did not include these principles in theschematic diagram of SWIFT organization in Figure 6.
22 The implementation of SWIFT-II used in this article is available athttp://www.psych.uni-potsdam.de/computational/
23 This principle was not implemented in tests of the E-Z Reader model.As an example, McConkie et al.’s (1988) results on initial landing positionswere combined with statistics of fixation durations obtained by Schilling,Rayner, and Chumbley (1998).
Figure 6. Model overview. A basic principle of SWIFT is that spatial(“where”) and temporal (“when”) pathways of saccade programming areseparated.
788 ENGBERT, NUTHMANN, RICHTER, AND KLIEGL

Numerical Simulations
As model input, for all words of the Potsdam Sentence Corpus,word length, word frequency, and predictability were available(Kliegl et al., 2005). The temporal evolution of our model is basedon an equation of motion, which is generated as a coupled systemof Nw ODEs (Equation 7), where Nw is the number of words in agiven sentence. The coupling of the ODEs is given by the saccadedynamics, mainly driven by target selection (Equation 10), andchange of lexical processing rates by updating eccentricity aftersaccades (Equation 2). The ODEs are discretized using the Eulermethod,24
an�t � �t� an�t� � �Fn�t�n�t� � ��t, (20)
where the integration step size is �t � 2 ms. It is important to notethat the noise level of the processing rate (Equation 9) depends on�t, because a different realization for the processing rate is chosenin each time step �t.
Model Parameters
The estimation of model parameters was performed using word-based measures for
• four measures of fixation durations (first fixation duration,second fixation duration, single fixation duration, and total readingtime),
• four measures of fixation probabilities (skipping probability,probability for two fixations, probability for three or more fixa-tions, and regression probability); additionally we used
• the distributions of the four measures of fixation durations and• the relations between fixation duration and within-word fix-
ation position (IOVP effects) for first and single fixation durations.The details of the fitting procedure are presented in Appendix A.
The performance of the model is defined as a sum of mean squared
normalized errors of fixation durations and fixation probabilitiesper word. An optimization procedure was applied to find a set ofparameters, which yielded estimates of parameters and errors (seeTable 3).
To keep the number of free model parameters as small aspossible, we fixed some of the parameters. The noise level oflexical processing was estimated from experimentally observeddistributions; � � 2 yielded comparable results. Target selectionweight � � 1 was motivated by Luce’s (1959) choice rule and wastested in SWIFT-I (Engbert et al., 2002). The parameter �1 � 0.1(Equation 19), which represents the range of the latency modula-tion, was fixed at a reasonable value in advance.25 We tested a fewcombinations of fixed values for these parameters in advance, tocheck the stability of our simulations.
On the basis of the finding that the model is in agreement withexperimental data within a certain range of parameter errors, weassume that this error is a plausible value for the simulation ofinterindividual variance of parameters. In each run, parametererrors were used to simulate interindividual differences. This ap-proach is self-consistent, because parameter uncertainties representerror ranges for parameters, for which the model’s dynamics arestable. During the procedure of parameter estimation, the param-eter errors converged and settled to specific values indicating thesensitivities of parameters (see also Appendix A). The introductionof parameter errors turns out as a viable solution to the general
24 Because the temporal evolution of the ODE system is linear duringfixations, it is not necessary to apply a more advanced numerical integra-tion method (e.g., 4th-order Runge-Kutta).
25 The value of 1/�2�1 � 2.2 represents the range of intended saccadelength, where the latency modulation is strongest, because �1 derives froma Gaussian-type formula.
Table 3Model Parameters
Parameter Symbol Value Error Min Max Reference
Lexical parametersFrequency, intercept � 63.5 2.0 10 150 Equation 1Frequency, slope � �0.20 0.03 �0.5 0 Equation 1Predictability � 0.11 0.09 0 1 Equation 8
Visual processingVisual span, right R 3.74 0.08 1 7 Equation 3Visual span, left L 2.41 0.15 0 5 Equation 3Word length exponent � 0.448 0.035 0 1 Equation 6Preprocessing factor f 70.2 20.6 1 200 Equation 7Global decay 0.01 Equation 7Processing noise � 2 Equation 9
Saccade timingRandom timing (ms) tsac 179.0 3.6 100 250 Equation 13Inhibition factor h 2.62 0.15 0 10 Equation 13Time delay (ms) � 375.7 30.0 0 600 Equation 13Target selection weight � 1 Equation 10
Saccade programmingLabile stage (ms) �lab 108.0 1.5 50 150 Figure 4Nonlabile stage �nl
0 6.1 2.7 5 50 Equation 19Latency modulation �0 105.2 2.7 0 200 Equation 19Latency modulation �1 0.1 Equation 19
Note. Min � minimum; Max � maximum.
789THE SWIFT MODEL

problem that model results typically show less variance thanexperimental data.
Simulation Results
We start the discussion of modeling results with an example fora single eye-movement trajectory generated by the model. Thisexample already demonstrates the general mechanism of saccadetarget selection from the activation field underlying all types ofsaccades: forward saccades, word skipping, refixations, and re-gressions. Next, we present examples for word-based measures(four fixation durations and four fixation probabilities), which arecomputed from 200 runs of the model. These word-based measureswere averaged over classes of word frequency and word length insubsequent analyses to evaluate related effects statistically.
After these basic comparisons, we investigate the model’s per-formance on more specific effects. We discuss distributions ofinitial landing positions, refixation probabilities as a function oflanding position, the effect of inverted optimal viewing position offixation durations and lag and successor effects, and whether ourmodel produces costs for skipping.
Simulation Example
A typical numerical output of the SWIFT-II model is illustratedin Figure 7 by plotting the time evolution of the set of activations{an(t)} and the fixation position k(t) along the vertical axis. Thesequence of words fixated in this example is
�1, 2, 3, 5, 4, 5, 6, 6, 8, 9�.
We now briefly explain some of the phenomena observed in thisexample.
Word skipping occurs for Word 4 and for Word 7 in first-passreading. The mechanism for word skipping can be seen clearly inboth examples, as we observe parallel activation of several words.
Word skipping is the result of competing activation for targetselection. Thus, in our model, words need not to be fully identifiedin order to be skipped. Refixations are likely in difficult or longwords or both. In the example shown here, the refixation on Word6 is the result of a first fixation on the space before Word 6, whichis counted as a fixation on the word. As a consequence of thisfixation far from the word’s center, the activation is still very highwhen the next saccade target is computed. As a result of thesaccade range error and saccadic noise, the second fixation occurson the last letter of Word 6. Because the realized trajectory inFigure 7 is the result of both target selection and oculomotorprocesses, it cannot be decided from the plot whether this refix-ation was “intended” by the model, but of course, we can tell bylooking “inside” the model. In the framework of SWIFT, a regres-sion can occur because of unfinished lexical access before thecorresponding region of text is left. In the example shown here,Word 4 was skipped in the first pass and later fixated with aregression, because parafoveal processing did not lead to fulllexical access. Unlike in real data, within the confines of our modelwe are always in a perfect state of knowledge about the causes andconsequences of specific reading patterns.
Word-Based Measures
As the next step toward the statistical evaluation of our model’sperformance, we analyzed average fixation durations and fixationprobabilities for each word. We used 200 runs of the model andcalculated averages for four measures of fixation duration and fourmeasures of fixation probabilities, as discussed before.26 Modelsimulations were in good agreement with experimental data. Mainpatterns of fixation durations and fixation probabilities were re-produced at the level of individual words, as illustrated in Figure 8.Deviations for first and last words are due to their exclusion fromparameter fitting.
Summary Statistics
To investigate effects of word frequency (CELEX FrequencyNorms; Baayen, Piepenbrock, & van Rijn, 1999) and word length,we averaged word-based measures over classes of word frequency(Class 1: 1–10, Class 2: 11–100, Class 3: 101–1,000, Class 4:1,001–10,000, and Class 5: �10,000; frequencies per millionwords) and word length (Classes 2 to 11: 2–11, Class 12: �12).Figure 9 shows the results for model simulations with the resultsobtained from experiments. The patterns of fixation durations andfixation probabilities are in good agreement, in particular, ourmodel reproduces the effects of both word length and word fre-quency correctly. Results on gaze durations are also reported inAppendix D.
Next, we compared the distributions of fixation durations inmodel simulations with the corresponding distributions observedin experiments. From the agreement between simulated and ex-perimental data (see Figure 10), we concluded that the random-walk process assumption for word processing generates a reason-able amount of variability to reproduce the observed distributionsof fixation durations.
26 These measures were already used in the parameter estimationprocedure.
Figure 7. Example of the numerical simulation of the SWIFT model.Time evolves (from top to bottom) along the vertical axis. The fixationposition k(t) is indicated by the dark black line in units of letters. Activa-tions an(t) are indicated by the gray areas, whereas saccades are indicatedby the lighter horizontal lines.
790 ENGBERT, NUTHMANN, RICHTER, AND KLIEGL

Effects of Word Length and Word Frequency
A well-known problem in assessing the independent contribu-tions of word length and word frequency to visual and lexicalprocesses is the large correlation between the two variables (�.62for the 850 corpus words used in our simulations, excluding thefirst and last words of each sentence). In order to investigateeffects of word length and word frequency, every sentence of thePotsdam Sentence Corpus contains a target word. These targetwords are uncorrelated in length and frequency (correlation be-tween word length and log frequency � �.004) and constitute anorthogonal Word Length (3) � Word Frequency (2) design, with24 words in each cell. Figure 11 displays the results for twoduration measures from the word-based summary statistics (seeFigure 9), now restricted to target words. For experimental as wellas simulated data, each duration measure exhibits both a wordlength and a frequency effect. For simulated data, however, thefrequency effect with longer durations for low-frequency words isconsiderably smaller than for experimental data. This problemprobably reflects the fact that with printed frequency, only one ofmany other possible lexical variables (such as neighborhood fre-quency) is explicitly specified in the model.
Initial Landing Positions
Given the general agreement between measures of fixationdurations and measures of fixation probabilities at the level of
single words and at the level of summary statistics for classes ofword length and word frequency, we now compare more detailedaspects related to the oculomotor assumptions in our model. Dis-tributions of initial fixations in words show a rich pattern ofvariation. Following McConkie et al.’s (1988) study, it is impor-tant to analyze corresponding distributions as a function of wordlength and launch site distance (see Figure 12).
First, model simulations were in good agreement with experi-mental data. Second, our model simulations reproduced the effectsthat (a) the standard deviations of distributions of initial landingpositions increase with both word length and modulus of launchsite distance and (b) the maxima of the distributions are shifted tothe end of the words for short saccades (launch site �1) and areshifted to the beginning of words for long saccades (launch sites�5 and �7). Thus, the effects of the implemented saccade rangeerror were clearly visible in the model simulations.
Refixation Probability
Refixations indicate the optimal viewing position in reading,because the minimum of the probability for performing a refix-ation—as a function of the initial landing position—indicates thebest fixation position for processing a word. First, our modelincludes assumptions on oculomotor control based on McConkieet al.’s (1988) work to produce a realistic variance in initial landingpositions. Second, the assumption of a processing gradient turns
Figure 8. Example of the simulation results on the level of mean values over 200 runs of the model for fourdifferent measures of fixation durations (a and b) and four measures of fixation probabilities per word (c and d).
791THE SWIFT MODEL
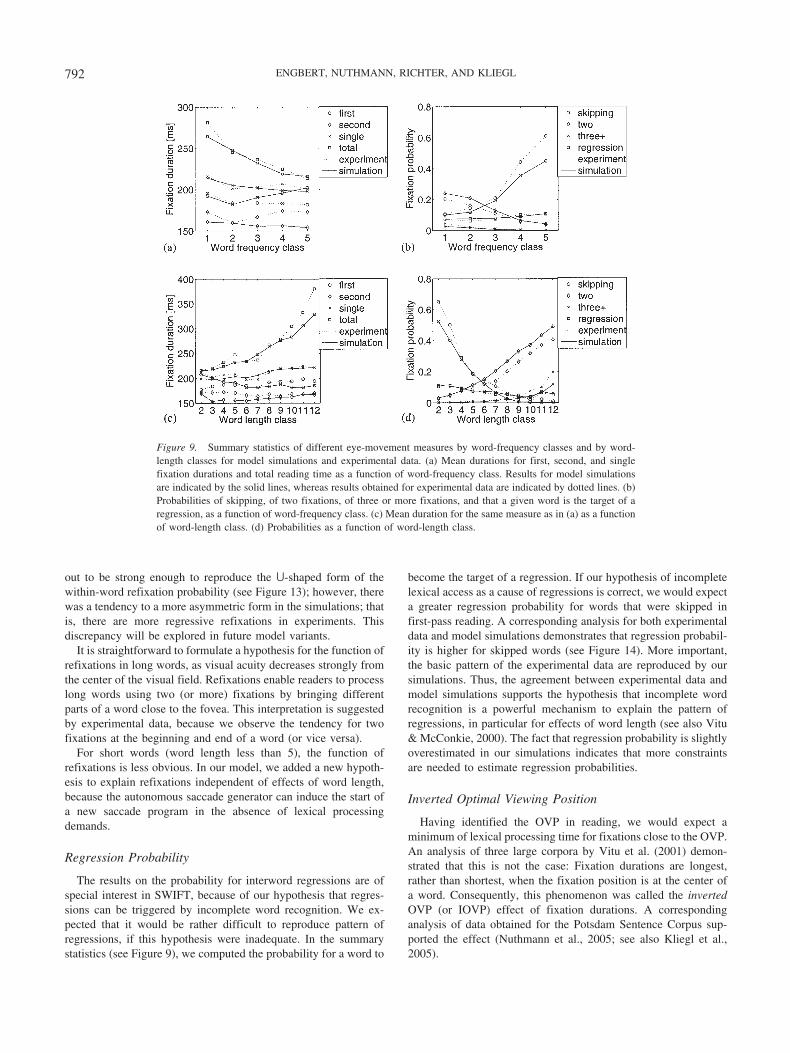
out to be strong enough to reproduce the U-shaped form of thewithin-word refixation probability (see Figure 13); however, therewas a tendency to a more asymmetric form in the simulations; thatis, there are more regressive refixations in experiments. Thisdiscrepancy will be explored in future model variants.
It is straightforward to formulate a hypothesis for the function ofrefixations in long words, as visual acuity decreases strongly fromthe center of the visual field. Refixations enable readers to processlong words using two (or more) fixations by bringing differentparts of a word close to the fovea. This interpretation is suggestedby experimental data, because we observe the tendency for twofixations at the beginning and end of a word (or vice versa).
For short words (word length less than 5), the function ofrefixations is less obvious. In our model, we added a new hypoth-esis to explain refixations independent of effects of word length,because the autonomous saccade generator can induce the start ofa new saccade program in the absence of lexical processingdemands.
Regression Probability
The results on the probability for interword regressions are ofspecial interest in SWIFT, because of our hypothesis that regres-sions can be triggered by incomplete word recognition. We ex-pected that it would be rather difficult to reproduce pattern ofregressions, if this hypothesis were inadequate. In the summarystatistics (see Figure 9), we computed the probability for a word to
become the target of a regression. If our hypothesis of incompletelexical access as a cause of regressions is correct, we would expecta greater regression probability for words that were skipped infirst-pass reading. A corresponding analysis for both experimentaldata and model simulations demonstrates that regression probabil-ity is higher for skipped words (see Figure 14). More important,the basic pattern of the experimental data are reproduced by oursimulations. Thus, the agreement between experimental data andmodel simulations supports the hypothesis that incomplete wordrecognition is a powerful mechanism to explain the pattern ofregressions, in particular for effects of word length (see also Vitu& McConkie, 2000). The fact that regression probability is slightlyoverestimated in our simulations indicates that more constraintsare needed to estimate regression probabilities.
Inverted Optimal Viewing Position
Having identified the OVP in reading, we would expect aminimum of lexical processing time for fixations close to the OVP.An analysis of three large corpora by Vitu et al. (2001) demon-strated that this is not the case: Fixation durations are longest,rather than shortest, when the fixation position is at the center ofa word. Consequently, this phenomenon was called the invertedOVP (or IOVP) effect of fixation durations. A correspondinganalysis of data obtained for the Potsdam Sentence Corpus sup-ported the effect (Nuthmann et al., 2005; see also Kliegl et al.,2005).
Figure 9. Summary statistics of different eye-movement measures by word-frequency classes and by word-length classes for model simulations and experimental data. (a) Mean durations for first, second, and singlefixation durations and total reading time as a function of word-frequency class. Results for model simulationsare indicated by the solid lines, whereas results obtained for experimental data are indicated by dotted lines. (b)Probabilities of skipping, of two fixations, of three or more fixations, and that a given word is the target of aregression, as a function of word-frequency class. (c) Mean duration for the same measure as in (a) as a functionof word-length class. (d) Probabilities as a function of word-length class.
792 ENGBERT, NUTHMANN, RICHTER, AND KLIEGL

The IOVP effect for single fixation durations is reproduced byour model (see Figure 15) by implementing Principle 6: errorcorrection of misguided saccades. Near word boundaries for fix-ation position on the first or last letter of words, the probability for
mislocated fixation is higher than close to word centers. If amisguided saccade leads to a fixation on an unintended word, weimplemented the immediate start of a new saccade program, whichis potentially error correcting. This mechanism induces the de-
Figure 10. Distributions of fixation durations for experimental data (dotted lines) and model simulations (solidlines): (a) first fixation durations, (b) second fixation durations, (c) single fixation durations, and (d) total reading time.
Figure 11. Effects of word length and word frequency in target words. Summary statistics for target words:Mean single fixation duration and total reading time for target words of different lengths (3–4, 5–7, 8–9) andfrequencies (high vs. low).
793THE SWIFT MODEL

crease of mean fixation durations near word boundaries, which canexplain the IOVP effect. The model reproduced the inverted pat-tern. Thus, from performance on single fixation durations, weconclude that the proposed error correction mechanism for mislo-cated fixations is a potential explanation of the IOVP effect.
Although the basic mechanism seems compatible with othermodels of eye-movement control (e.g., E-Z Reader), we would liketo discuss an advantage of the SWIFT model here: There is noneed to specify the target of the upcoming new saccade, as saccadetarget selection is performed by computing probabilities from theactivation field, according to the general rule for all saccades
(Equation 10). A fixed-target saccade, which needs to be imple-mented necessarily in E-Z Reader, may be too hardwired, inas-much as saccade targeting is based on partial knowledge and manysaccades may turn out to be no longer required when they start. Inthe case of mislocated fixations, the intended word may be pro-cessed from the parafovea as well and, consequently, an error-correcting saccade is no longer necessary. Therefore, the flexiblemechanism in saccade target selection turns out to be an architec-tural advantage of our model.
For a precise understanding of the mechanism producing theIOVP effect on fixation durations in the model, we performed a
Figure 12. Distributions of initial landing positions by word length and launch site. The rows of panels showdistributions for word lengths 4, 6, and 8, and the columns of panels account for launch sites �1, �3, �5, and�7 for saccades. Rel. Freq. � relative frequency.
Figure 13. Probability distributions for refixations as a function of the initial landing position. Experimentaldata (b) show a U-shaped curve without systematic influence of word length. In model simulations (a), the resultsare reproduced qualitatively.
794 ENGBERT, NUTHMANN, RICHTER, AND KLIEGL

detailed analysis of mislocated fixations (Nuthmann et al., 2005).As shown above, our model reproduced the distributions of initiallanding positions very precisely. Assuming that the landing distri-butions (see Figure 16a) can be extrapolated smoothly, we canestimate the probability for mislocated fixations. First, we fitnormal distributions to the simulated data. Second, we estimatedthe overlap of these distributions to neighboring words to obtainthe relative fraction (i.e., the probability of mislocated fixations asa function of word length; see Figure 16b). For details of thealgorithms see Nuthmann et al. The estimated curves obtainedfrom experimental data (dotted lines) and exact results for themodel simulations (solid lines) are in good agreement, whichdemonstrates that the hypothesis of overlapping distributions ofinitial landing positions serves as a useful explanation of the IOVPeffect in single fixations.27
Next, we investigated the IOVP effects in two-fixation cases.The IOVP effect has not been found for gaze durations as afunction of initial fixation position, because we observe a trade-offin durations for first and second fixation durations (see Figure 17),so that effects in first and second fixation durations cancel eachother.28 Whereas the IOVP effect is qualitatively the same for firstfixation durations as for single fixation durations (Figure 15),average second fixation durations show a U-shaped pattern whenplotted as a function of the position of the first fixation. Thisfinding suggests that the amount of processing time spent on theword during the first fixation is saved during the following fixa-tions. Therefore, second fixation durations are shortest near wordcenters. As an alternative explanation, Vitu et al. (2001) arguedthat the fixation-duration trade-off effect in two-fixation casesresults from the fact that the IOVP effect is found for both first andsecond fixation durations, combined with the statistical fact thatinitial fixations near the center of a word (which tend to be longer)are more likely to be followed by a fixation toward one end (whichtend to be shorter), and vice versa.
To explain the complicated interaction of first and second fix-ation durations, we implemented a new mechanism of modulation
of saccade latencies as a function of intended saccade lengths(Principle 7) in addition to the principle of error correction ofmislocated fixations (Principle 6). For two-fixation cases, errorcorrection could not explain the strength of the inverted U shape ofmean first fixation durations. Because the saccade following thefirst fixation in a two-fixation case has a very short length onaverage, the nonlabile saccade latency increases strongly becauseof our assumption in Equation 19. This assumption is physiolog-ically plausible, because the production of a saccade with verysmall amplitude is a difficult problem for the oculomotor system(Adams et al., 2000; Kalesnykas & Hallett, 1994; Wyman &Steinman, 1973), as an extremely short neuronal pulse must beproduced by the brainstem saccade generator (e.g., Sparks, 2002).An additional analysis presented in Appendix B shows that thelatency modulation specifically contributes to explain the IOVPeffect in first fixation cases, whereas for single fixation durations,the error correction mechanism alone is sufficient to reproduce theinverted U shape of the curve.
Finally, we investigated the influence of word frequency on theIOVP effect. Our analysis is based on corpus target words (seeabove in section “Effects of Word Length and Word Frequency”).Figure 18 displays results for mean single fixation durations ontarget words of different lengths and frequency (high [�50 permillion] vs. low [1 to 4 per million]) as a function of the landingzone initially fixated. Words of all lengths were divided into fivezones (cf. Vitu et al., 2001), and data for each zone were averagedacross word lengths and subjects. The empirical data show afrequency effect on fixation durations that was independent oflanding zone (Nuthmann et al., 2005; see also Rayner, Sereno, &Raney, 1996; Vitu et al., 2001). The simulated data reproduce thisfrequency effect qualitatively. The effects of word frequency,however, turned out to be smaller in simulations than in experi-mental data.
Model Predictions on Current Topics
Whereas the quantitative fits to data are related to well-established experimental findings, we now present model predic-tions on more recently investigated phenomena. First, we investi-gate whether our model generates costs for skipping, and second,we analyze lag and successor effects.
Costs for Skipping
The analysis of average fixation durations before skipped wordsis an interesting test of models of eye-movement control. Ingeneral, there are two different processes that potentially contrib-ute to increased fixation durations before skipped words in theo-retical models of eye-movement control. First, in models based onSAS, word n � 1 is the default saccade target during fixation ofword n. As a consequence, word skipping can only occur after asaccade cancelation of the default saccade to word n � 1 and theprogramming of a new saccade to word n � 2. Because of the
27 Note that we validated our algorithm for the estimation of the per-centage of mislocated fixation from empirical data by the simulations ofour model.
28 O’Regan and Levy-Schoen (1987), first reporting a trade-off effect,postulated that a constant amount of time is required for processing a word.
Figure 14. Statistics for interword regressions. Experimental data (dottedlines) demonstrate that regression probability decreases with word length.Moreover, regression probability is much higher for words, which wereskipped in first-pass reading. Although the qualitative patterns are repro-duced by model simulations (solid lines), regression probability is gener-ally higher in simulations than in experimental data.
795THE SWIFT MODEL

saccade latency and the fact that the cancelation can happen onlylater than the default saccade to word n � 1, there are increasedfixation durations before skipped words. Thus, SAS models ge-nerically predict skipping costs. The amount of skipping costs,however, might be reduced by the additional assumption of auton-omous saccade programs (Engbert & Kliegl, 2001). In SWIFT,word skippings are not causally linked to saccade cancelationsbecause of the general principle of activation-based saccade targetselection.29
Second, word processing based on GAG will allow parallelprocessing of words, which implies a longer accumulation ofparafoveal information. As a consequence, the probability of skip-ping word n � 1 will increase if the fixation duration on word nincreases. Thus, in GAG models, long fixation durations are acause, not a consequence, of skipping. In these models, however,the link between fixation durations and subsequent skipping ismuch less tight because there is no strict assumption about defaultsaccade targets as in SAS models. Moreover, in the SWIFT model,saccades are generated autonomously with only a limited modu-latory influence from time-delayed foveal inhibition, that is, with-out triggering by word recognition. In summary, an analysis ofskipping costs in SWIFT seems impossible without carrying outnumerical simulations.
Experimentally, there have been rather contradictory results onthe difference between average fixation durations before skippedand nonskipped words ranging from �26 ms (Radach & Heller,2000, Table 2) to �84 ms (Pynte, Kennedy, & Ducrot, 2004, Table3). A solution to this controversy was proposed recently by Kliegland Engbert (2005) using a statistical analysis that involved patternmatching and a Monte Carlo type of resampling procedure.
In a first step, Kliegl and Engbert (2005) selected three-wordsegments (triplets) that were read with one fixation per word inforward direction (see Figure 19, top panel: nonskip). For thesubsequent statistical analysis, four-word segments were identifiedthat differed from the triplets only by skipping word n � 1 (seeFigure 19, bottom panel: before-skip). In addition, it was checkedthat word n was never the target of a regression. To excludepotential influences from within-word fixation position, Kliegl andEngbert matched fixation sequences on word n and fixation zonewithin word n. To test the differences of fixation durations on wordn between patterns, they applied a three-step procedure using 100Monte Carlo samplings (see Kliegl & Engbert, 2005, for details).
The main results obtained from this analysis were that therewere strong effects of word frequency and word length on skippingcosts. First, in model simulations (see Figure 20a), there wereglobal skipping costs, that is, average fixation duration was in-creased before word skipping compared to nonskip cases. Thedifference curve indicates a linear relation between the increase infixation duration and the length of the skipped word (Figure 20b).For experimental data, the main results are plotted in Figure 20 (cand d). Fixation durations before short words were shorter whensubsequent words were skipped compared with when they werefixated. With increasing word length, this effect is reversed toproduce longer fixations before long words. Thus, different frommodel simulations, there were benefits from skipping short wordsand costs from skipping long words. As in the model simulations,however, the differences between nonskip and before-skip casesturned out to be roughly linearly increasing with word length (seeKliegl & Engbert, 2005).
In summary, the SWIFT-II model generates global skippingcosts, which is in contradiction to our own results from experi-mental data (Kliegl & Engbert, 2005). Although there are diverg-ing results from different experiments, this might indicate that inthe current version of our model, the effects of preview as aconsequence of long fixation durations are a dominant process,which causes word skipping. Therefore, it is an open problemwhether the model can be modified to generate reduced fixationdurations before skippings as well.
Lag and Successor Effects
A key assumption for eye-movement research is that proper-ties of the fixated word are the dominant variables modulatingfixation duration. This immediacy-of-processing assumption(see Rayner, 1998, for a review) is a platform for much ofpsycholinguistic research. Using a detailed analysis of a largedata basis from continuous reading, we recently showed thatthere are multiple nonlocal effects of word difficulty (Kliegl etal., 2005).
29 Saccade cancelations can occur in SWIFT during the labile stage ofsaccade programming; however, these cancelations do not represent thedriving mechanism for word skippings.
Figure 15. Effect of inverted optimal viewing position for single fixation durations as a function of initialfixation position for model simulations (a) and experimental data (b).
796 ENGBERT, NUTHMANN, RICHTER, AND KLIEGL

In a sequence of three first-pass single fixations, we computedfixation duration on word n (the center word) as a function offrequencies, predictabilities, and lengths of word n � 1, word n,and word n � 1 (see Figure 21). A first glance at Figure 21 showsthat there are strong effects in both experimental data and modelsimulations. Most important, however, simulation results generallyshow the same trend as the experimental data.
Lag effects. The strongest effect (more than 40 ms in aver-age single fixation duration) is produced by the last word’slength, which is even stronger than the effect induced by thecurrent word’s length (see Figure 21, bottom panels). In theSWIFT-II model, there are two mechanisms that are responsiblefor this lag effect. First, a fixation on word n � 1 will generateless preview on word n, when word n � 1 is longer. As aconsequence, the fixation on word n will last longer on average,if word n � 1 was a long word. The same argument also appliesto the lag effect for the word-frequency plot (see Figure 21, toppanels) because of the correlation between word length andword frequency.
Second, we implemented a time delay in the foveal inhibitionprocess (Equation 13) to account for the neurophysiological factthat the word-recognition loop will operate much more slowly thanthe fast brainstem saccade generator. The numerical value of thetime delay was estimated as � � 375.7 ms (see Table 3). Given anaverage single fixation duration of 200 ms, the current word’sfixation duration is effectively controlled by inhibition from thelast word. Thus, the time-delayed foveal inhibition will producespillover effects.
Successor effects. The performance of our model with respectto successor effects (i.e., effects of the features of the successorword n � 1 on fixation durations of word n) is rather interesting,because there are no explicit mechanisms for modulations offoveal processing by processing of words to the right of thecurrently fixated word. As a consequence, all effects in Figure 21are effects due to spatial selections in the perceptual span. A noteof caution: Successor effects are small compared with the lageffects in both experimental and simulated data (Kliegl et al.,2005). Thus, future model modifications might change the data
Figure 16. Analysis of mislocated fixations from overlapping initial landing positions. (a) Relative frequencyof initial landing positions for different word lengths. (b) The probability of mislocated fixations as a functionof letter position for different word lengths. The estimated curves (dotted lines) are calculated from extrapola-tions of the distributions in (a), whereas the exact results (solid lines) are directly computed from modelsimulations.
Figure 17. Effects of optimal viewing position on fixation durations of two-fixation cases. In the experimentaldata (b), there is a clear trade-off effect between first and second fixation durations, with a pronounced U-shapedcurve for second fixation durations as a function of the position of the first fixation. In the results from thenumerical simulations (a), the model reproduced the U-shaped curve for second fixation durations, whereas theinverted optimal viewing position effect for first fixation durations was less pronounced than in the experimentaldata.
797THE SWIFT MODEL

pattern on successor effects more strongly than other effects. Wereport the predictions about successor effects to stimulate futureresearch.
Is Word Processing Parallel or Serial?
In the SWIFT model, all words are processed in parallel becauseof the assumption of a processing gradient. The processing rate,however, decreases very rapidly with increasing eccentricity.Thus, the number of words with effectively changing activations ismuch smaller than the number of words Nw in a sentence. Adynamical analysis shows that SWIFT’s behavior can be investi-gated qualitatively by the activations of only three words, ak(t),ak�1(t), and ak�2(t), during fixation of word k. In terms of dynam-ical systems theory (e.g., Kaplan & Glass, 1995), we can show thatthe dynamics of SWIFT can be approximated by a two-
dimensional subspace embedded in an Nw-dimensional state space(see Appendix C). Therefore, the potential number of dynamicaldegrees of freedom are reduced by the estimated model parametersvalues in a psychologically plausible way, so that only a fewactivated words determine SWIFT’s behavior at a time.
The two alternative theoretical concepts of serial (SAS; e.g.,Engbert & Kliegl, 2001; Reichle et al., 2003) versus parallel(SWIFT) processing of words are asymmetrically related to eachother with respect to generalization. Whereas serial processingmay be looked upon as a special case of a model of parallelprocessing, new assumptions must be made in a serial model toextend the model to parallel processing. On the basis of theseconsiderations, we introduce a parametrization for a continuoustuning of the SWIFT model from strictly serial to parallel process-ing. Thus, the distinction between serial and parallel processing isnot necessarily dichotomous, and we can study both processingtypes within the same model.
Given the gradient-type assumption of parallel processing ofwords, we can add restrictions on parallel processing to include serialprocessing as a special case in SWIFT’s behavior. Because wordrecognition is a two-stage process in SWIFT, there are two differentversions of the serial model: Model A, in which global processing(preprocessing and lexical completion) is serial, and Model B, inwhich lexical completion is serial and preprocessing is parallel.
For both Versions (Models A and B) of serial versus parallelprocessing, we can define a parametrization, which introduces acontinuous transition between serial and parallel processing by tuninga single parameter �. The basic assumption is that processing ismodulated by the number of words with nonvanishing activation to
Figure 18. Inverted optimal viewing position curves as a function of word frequency, for experimental data(first row) and model simulations (second row). Displayed are mean single fixation durations on target wordsof different lengths (3 and 4; 5–7; and 8 and 9) and frequencies (high vs. low) as a function of the landing zoneinitially fixated. Words of all lengths were divided into five zones, and data for each zone were averaged acrossword lengths and subjects.
Figure 19. Pattern selection for the analysis of skipping costs. For com-paring fixation durations, matched fixation sequences for nonskip cases(top panel) and before-skip cases (bottom panel) were selected.
798 ENGBERT, NUTHMANN, RICHTER, AND KLIEGL
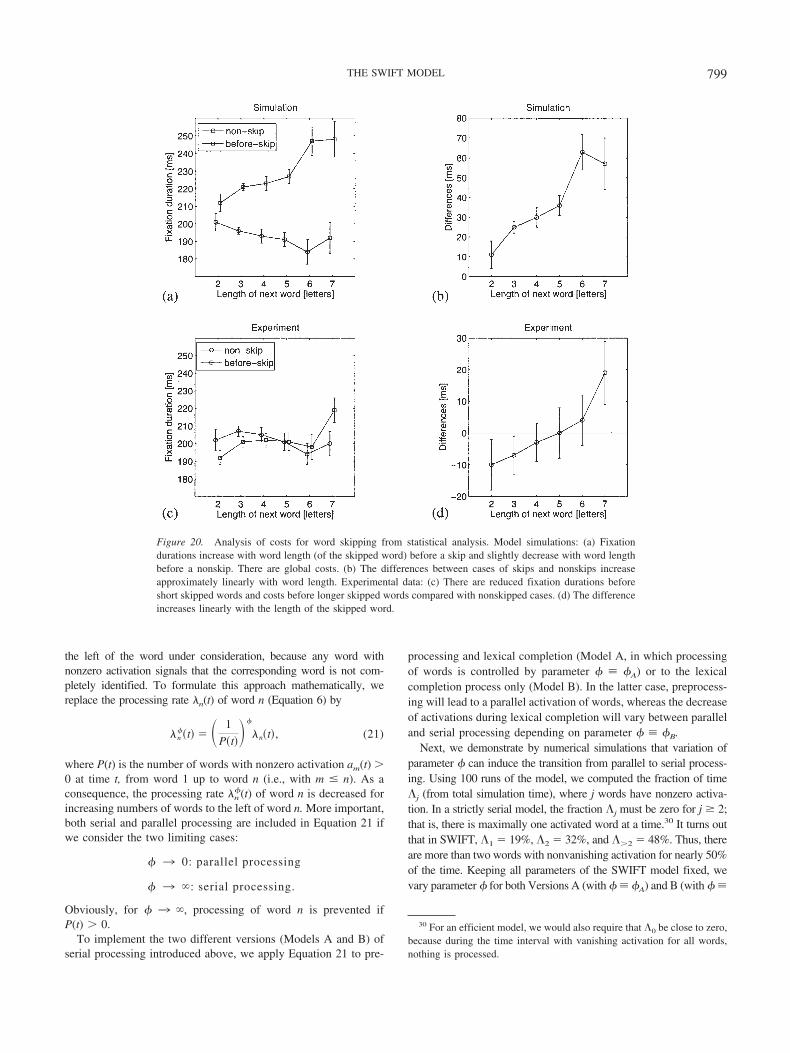
the left of the word under consideration, because any word withnonzero activation signals that the corresponding word is not com-pletely identified. To formulate this approach mathematically, wereplace the processing rate �n(t) of word n (Equation 6) by
�n��t� � � 1
P�t���
�n�t�, (21)
where P(t) is the number of words with nonzero activation am(t) �0 at time t, from word 1 up to word n (i.e., with m � n). As aconsequence, the processing rate �n
�(t) of word n is decreased forincreasing numbers of words to the left of word n. More important,both serial and parallel processing are included in Equation 21 ifwe consider the two limiting cases:
� 3 0: parallel processing
� 3 �: serial processing.
Obviously, for � 3 �, processing of word n is prevented ifP(t) � 0.
To implement the two different versions (Models A and B) ofserial processing introduced above, we apply Equation 21 to pre-
processing and lexical completion (Model A, in which processingof words is controlled by parameter � � �A) or to the lexicalcompletion process only (Model B). In the latter case, preprocess-ing will lead to a parallel activation of words, whereas the decreaseof activations during lexical completion will vary between paralleland serial processing depending on parameter � � �B.
Next, we demonstrate by numerical simulations that variation ofparameter � can induce the transition from parallel to serial process-ing. Using 100 runs of the model, we computed the fraction of timej (from total simulation time), where j words have nonzero activa-tion. In a strictly serial model, the fraction j must be zero for j � 2;that is, there is maximally one activated word at a time.30 It turns outthat in SWIFT, 1 � 19%, 2 � 32%, and �2 � 48%. Thus, thereare more than two words with nonvanishing activation for nearly 50%of the time. Keeping all parameters of the SWIFT model fixed, wevary parameter � for both Versions A (with � � �A) and B (with � �
30 For an efficient model, we would also require that 0 be close to zero,because during the time interval with vanishing activation for all words,nothing is processed.
Figure 20. Analysis of costs for word skipping from statistical analysis. Model simulations: (a) Fixationdurations increase with word length (of the skipped word) before a skip and slightly decrease with word lengthbefore a nonskip. There are global costs. (b) The differences between cases of skips and nonskips increaseapproximately linearly with word length. Experimental data: (c) There are reduced fixation durations beforeshort skipped words and costs before longer skipped words compared with nonskipped cases. (d) The differenceincreases linearly with the length of the skipped word.
799THE SWIFT MODEL

�B) and compute the resulting fractions j (see Figure 22). TheSWIFT model is retained for � � 0, but our simulations show that themodel’s behavior will be rather stable up to � � 0.1.
If processing rates are modified by Equation 21 for both pre-processing and lexical completion (Model A), we observe a sharptransition from parallel to serial processing, which is indicated bythe rise of 1 close to 100% at � � 10 (note that the direction ofthe abscissa is inverted; i.e., � increases from right to left inFigure 22a). If we restrict the lexical completion stage of wordprocessing only (Model B), the distribution of activations changesless drastically (see Figure 22b). It is interesting that the fraction oftime with one activated word, 1, decreases with increasing �.Therefore, if lexical completion becomes more serial, the distri-bution of activation will be broader. This effect is caused by thefact that there are no restrictions on preprocessing: Several wordsare preprocessed at a time, but the model must wait to start lexicalcompletion until all words to the left of the word under consider-ation are completely identified.
Because we demonstrated that the SWIFT model can be used asa framework to study the transition from parallel to serial process-ing, it may be an important tool to generate predictions on anumber of phenomena, which are currently investigated to deter-mine experimental boundary conditions on the possibility of par-allel processing and on the limitations of serial processing. In thisrespect, two candidate phenomena are the analysis of skippingcosts and lag and successor effects discussed in the previoussection.
General Discussion
In this article, we developed an advanced and substantiallyextended SWIFT-II model based on the first version, SWIFT-I(Engbert et al., 2002). An incremental study of the effect of addingthe various mechanisms to the basic framework is carried out inAppendix B. We showed that the new model can reproduce andexplain many experimentally observed phenomena of eye move-ments during reading. Whereas the model’s intended level ofmathematical detail with respect to word processing and saccadeprogramming agrees with the E-Z Reader framework (Reichle etal., 1998, 2003), the core assumption of spatially distributed pro-cessing in SWIFT turned out as a viable alternative to the strictlyserial allocation of attention assumed in E-Z Reader.
Motivated by recent advances in the dynamic field theory ofmovement preparation (Erlhagen & Schoner, 2002), we imple-mented SWIFT as a computational model for saccade generationbased on a spatially distributed activation field. There is similarityof the SWIFT model with the dynamic field concept; however, wedid not refer to the formal theory of Erlhagen and Schoner. Themain reason was that saccade generation in reading is not only aproblem of movement planning, but also a problem of wordprocessing, so that many properties related to word processing hadto be combined with ideas proposed in the dynamic field theory.Thus, the dynamic field concept motivated our model, but theformal framework was simplified in order to focus on aspects ofword recognition in order to reproduce effects of word difficulty in
Figure 21. Analysis of lag and successor effects. Bottom row: Average single fixation durations as a functionof word length of the previous word (word n � 1, left column), the current word (word n, middle column), andthe next word (word n � 1, right column). Middle and top rows: Corresponding plots as a function ofword-predictability class and word-frequency class, respectively.
800 ENGBERT, NUTHMANN, RICHTER, AND KLIEGL

eye-movement data. In perspective, we believe, however, that thegeneral concept of interactions between local excitation and globalinhibition in the dynamic field theory is a potentially very usefulframework for a coherent explanation of eye movements duringreading.
Neurophysiological Background
The investigation of the brainstem circuitry of saccade genera-tion has been an active field of research for many years, resultingin a very detailed level of understanding of the immediate presac-cadic processes (Moschovakis, Scudder, & Highstein, 1996;Sparks, 2002). One of the key results is that there exist bothomnipause and burst cells in the brainstem. Whereas omnipausecells fire during fixations and cease activation during saccades, theburst cells show the opposite activity pattern; that is, burst cells fireat a high rate for the duration of a saccade. Because omnipausecells show no specificity, but burst cells code the spatial metrics ofsaccade, there are at least two descending pathways in the neuro-physiology of the oculomotor system. One carries spatial informa-tion (“where”), whereas the other serves as a trigger and is in-volved in temporal aspects of saccades (“when”).31 The competingprocesses between fixation and saccade generation have beenfurther investigated by Munoz and Wurtz in a series of publica-tions (Munoz & Wurtz, 1993a, 1993b, 1995a, 1995b; Wurtz,1996). Their work has focused on the superior colliculus, whichcarries a representation of the fovea of the visual field. Thesuperior colliculus shows distributed coding as an important prop-erty (McIlwain, 1991). Visual cells turned out to have unexpect-edly large receptive fields. Thus, a cell in the collicular map can beactivated from a rather wide range of visual space. Motivated by
these neurophysiological results, Findlay and Walker (1999) pro-posed a general model for the control of eye movements. Themodel is organized into five different levels, all of which areseparated into “where” and “when” pathways. Moreover, Findlayand Walker suggested that processes of competitive interactionoperate within a salience map (their Level 2) to compute a uniquesaccade goal.
In the SWIFT model, we adopted the fundamental separationbetween “where” and “when” pathways as a key principle ofmodel design. As a consequence, we implemented temporal andspatial control of saccades with as little interaction as possible. Itturned out in the development of SWIFT-I (Engbert et al., 2002)that foveal inhibition of an autonomous random timer is a minimalmodel of the control processes necessary to adjust fixation dura-tions. Here, we included a time delay for the inhibition process toseparate the slower word-recognition system from the fast brain-stem saccade generator. Given the neurophysiological organizationof the contributing neural systems, the time-scale separation isvery plausible. The competition between alternative saccade tar-gets is a powerful mechanism for generating all types of saccades(forward saccade, word skipping, refixations, regressions) from asingle underlying mechanism. Therefore, the neurophysiologicalfoundations of saccade generation in reading are compatible withour mathematical model.
31 The concept of separate “where” and “when” pathways was firstintroduced by oculomotor physiologists (Van Gisbergen, Gielen, Cox,Bruijns, & Kleine Schaars, 1981).
Figure 22. The transition from parallel to serial processing in the SWIFT model. (a) If the processing rate iscontrolled by parameter � for both preprocessing and lexical completion (Model A), then we observe a sharptransition to serial processing 1 � 100% for � � 10. (b) When lexical completion is modulated by � withpreprocessing fully parallel (Model B), the distribution of activation over words is even broader than in theSWIFT model.
801THE SWIFT MODEL

Phenomena Reproduced by SWIFT
Word-based measures. Using experimental data obtained forthe Potsdam Sentence Corpus (Kliegl et al., 2005), we fittedword-based fixation durations and probabilities. For all of the 850words of the corpus (all words of the corpus excluding first andlast words of the sentences), the model reproduced averages offirst, second, single, and total fixation durations as well as prob-abilities for skipping, two fixations, three or more fixations, andregressions. Word-based fitting is a major advantage comparedwith fitting averages representing classes of word frequency, aswas done in previous studies (Engbert & Kliegl, 2001; Engbert etal., 2002; Reichle et al., 1998, 2003), because word-based analysesprovide a new level of detail for analyses of model performance.
Effects of length and frequency. The obtained word-basedmeasures are the basis for additional analyses of effects of bothword length and word frequency by averaging dependent variablesover classes of length and frequency, respectively. This analysisdemonstrated that SWIFT accurately captures effects of both wordlength and word frequency. Thus, SWIFT is the first computa-tional model that reproduces effects of word length and wordfrequency to a comparable level of accuracy.
Distributions of fixation durations. Fixation durations in read-ing are highly variable and show broad distributions. Therefore, itis important that computational models reproduce these distribu-tions. There are two main sources of variability for fixation dura-tions in SWIFT. First, the standard deviations of fixation durationsare modulated by the stochastic assumptions on the random-walkprocess for word recognition. This simple assumption can bereplaced in a future version of our model without changing themodel’s architecture. Furthermore, foveal inhibition can influencethe variability of fixation durations in a more complicated way(compared with the random-walk process). As an example, a broaddistribution of fixation durations will induce a broader distributionof the variability created by foveal inhibition and, hence, amplifythe noise. Such complicated interactions of stochasticity and non-linearity typically occur in nonlinear dynamical systems (e.g.,Millonas, 1996; Moss & McClintock, 1989).
Refixations. The within-word position of the minimum of theprobability for refixating a word defines the optimal viewingposition. In SWIFT, refixations on short words occur as a conse-quence of autonomous saccade timing. For longer words, refix-ations are necessary because of visual acuity limitations, which areincorporated in SWIFT by the assumption of the processinggradient.
Regressions. Liversedge and Findlay (2000) put the mecha-nisms underlying regressive saccades on the list of outstandingproblems in eye-movement research. In normal reading, regres-sions are the rule rather than the exception. Following Rayner(1998), 10% to 15% of all saccades are regressive. As a conse-quence, for a typical sentence of eight words, the probability for aregression is about 2/3 (ranging from .57 to .73).32 In SWIFT,regressions are triggered by incomplete word recognition. This isa simple and psychologically plausible explanation, which is sup-ported by our analysis of patterns of words that were targeted bya regression after skipping during first-pass reading.
Initial landing positions. Following the hypothesis first pro-posed by McConkie et al. (1988) that oculomotor errors can bedivided into systematic and random components, we included
these two types of saccadic errors in our model. Our simulationsshow that the distributions of experimentally observed initial land-ing positions are reproduced by the model. This is a nontrivialresult, because it proves that the assumptions on oculomotor con-trol made in SWIFT are compatible with the error pattern found byMcConkie et al.
IOVP effects and mislocated fixations. The presence of ocu-lomotor errors induces mislocated fixations (Nuthmann et al.,2005). It is likely that the cognitive control system responds tothese errors with some correction mechanism. Such a mechanismrepresents a coupling of word processing and oculomotor systems.Computational models are ideal tools to test the hypothesis on theconsequences of mislocated fixations. In SWIFT, we implementedan error-correction program as a response to mislocated fixations,as proposed earlier by Nuthmann et al. Because mislocated fixa-tions are more frequent near word boundaries, the immediatetriggering of a new saccade program reduced fixation duration atword edges. Therefore, our model can explain IOVP effects. Anadditional modulation of saccade program duration by intendedsaccade length was used to reproduce IOVP for the first of twofixations.
Costs for skipping. The SWIFT model reproduces the mainfeatures of data pattern in skipping costs. From a careful analysisof experiments, Kliegl and Engbert (2005) reported skipping ben-efits for short words and skipping costs for long words, respec-tively: Fixations prior to skipped words were shorter for short orhigh-frequency words and longer for long or low-frequency wordscompared with nonskipped controls. These results were not repro-duced by our simulations, which indicated global skipping costs;however, the model could reproduce a linear increase of skippingcosts with the length of the skipped word, which was found inexperimental data.
Lag effects. Nonlocal effects of word properties (e.g., wordlength and word frequency) are not surprising in a model ofspatially distributed processing. We checked two effects to inves-tigate whether SWIFT makes realistic predictions about theseeffects. The lag effect, the influence of the word length and wordfrequency of the previously fixated word on the currently fixatedword, is reproduced qualitatively by two underlying mechanismsin SWIFT. First, when the previous word is a long word, there hasbeen less preview on the current word than in the case of a shortsuccessor word, which will lead to an increase in fixation duration.Second, foveal inhibition is time delayed, so that the word recog-nition loop can modulate fixation duration only with a time delay.
Further problems. There were and still are numerous datapatterns hidden in the Potsdam Sentence Corpus that challengedthe model and will continue to do so. For example, in its currentversion, the model still tends to overestimate the effect of wordlength and to underestimate the effect of word frequency (seeFigures 11 and 18). We also had considered it plausible that lageffects should be found in SWIFT simulations once we had dis-covered the pattern in the experimental data. Unfortunately, thiswas not the case for the simulation results. The solution was todelay the inhibition of saccade programs by foveal activation (seeEquation 13). It is a physiologically highly plausible generalization
32 Sentences with regressions are regularly excluded from modeling inE-Z Reader.
802 ENGBERT, NUTHMANN, RICHTER, AND KLIEGL
of our foveal inhibition mechanism to introduce a time delay forthe control of fixation durations by word-recognition processes.Moreover, this modification of the model did not interfere withother successful simulation results despite the nonlinearities in themodel. The bottom line is that obviously the model can still befalsified by experimental data, probably in many ways. And, ofcourse, we will look for modifications that accommodate theseresults without compromising the core set of theoretical principles.
From Parallel to Serial Processing of Words
In SWIFT, several words are active at a time and lexicalcompletion of words is not strictly tied to their serial order in thesentences. This is sometimes advanced as an argument againstparallel models, because in SAS models, words become availablein the order of appearance in the text, just like in spoken language.Of course, we could simply “delegate” the task of serialization inSWIFT to higher order structures such as Baddeley’s (2000)episodic buffer or Ericsson and Kintsch’s (1995) long-term work-ing memory. Indeed, experimental results about failures to noticemissing function words or to overlook their repetition suggest thatreading may not be as strictly serial as envisioned by SAS propo-nents. Koriat, Greenberg, and Kreiner (2002) argued that, forexample, function words such as the become available earlier andserve to generate a sentence structure into which meanings ofcontent words are then integrated (see also Kennedy, 2000a, for acollection of arguments why reading is not like listening; Deubel,O’Regan, & Radach, 2000; Inhoff, Radach, Starr, & Greenberg,2000). The failures associated with function words mentionedabove are assumed to arise from a faster decay of activationcompared with content words (conceptually compatible withSWIFT).
There is good evidence that silent reading activates phonologi-cal representations (e.g., Pollatsek, Lesch, Morris, & Rayner,1992; Van Orden, 1987). At first glance this may even appear tosupport the assumption of sequential lexical access, as enforced,for example, in E-Z Reader. We note, however, that oral reading ischaracterized by a strikingly unserial sequence of fixations, withthe eye running ahead of the voice, but also frequent regressions tobriefly synchronize voice and eye (Buswell, 1920). Oral readingbehavior appears to be in better agreement with SWIFT’s assump-tions. Modeling such dynamics of eye and voice will provide newconstraints for the coupling between ocular and attentional move-ments; it certainly represents a challenge of generalizability forcomputational models of silent reading such as SWIFT and E-ZReader.
Finally, at the other end of conscious control during reading,mindless reading constitutes evidence prima facie for a loosecoupling between ocular and attentional control (Rayner & Fi-scher, 1996; Vitu, O’Regan, Inhoff, & Topolski, 1995). Readersfrequently find themselves at a location in the text without anyawareness about how they got there or any awareness about whatthey just read. Clearly, in this situation their thoughts strayed offthe text and accessed “meanings” different from the ones writtenabout in the text. We think this situation is analogous to theexperience of walking while carrying out an intensive conversa-tion. One’s movements are clearly guided by environmental cuesbut there is little awareness of this behavior. The two systems must
be coupled at some level, but, in our opinion, a strict coupling isnot very plausible.
A conceptual advantage of SWIFT as a parallel model ofword processing is that we can include serial processing as aspecial case. Furthermore, by implementing a tuning parameter,we showed that the dichotomy of serial versus parallel process-ing can be replaced by a continuum of models. There are twodifferent versions of the restriction to serial processing. In thefirst version, we restricted all processing (i.e., preprocessingand lexical completion), whereas in the second version, werestricted lexical completion only (i.e., preprocessing is stillfully parallel). For the first version, we were able to demon-strate by numerical simulations that SWIFT can be restricted toprocess words serially. A signature of strictly serial processingwas that there is only one word activated at a time. In thesecond version, based on the relaxed assumption on serialprocessing that preprocessing is still parallel but lexical com-pletion is serial, we showed that the distribution of activationsover words was even broader than in the original model. Thus,the SWIFT model may prove to be very useful to furtherexplore the transition from serial to parallel processing in futureresearch.
Comparison With the E-Z Reader Model
A possible classification of models of eye-movement controlin reading categorizes the approaches into POC, models basedon the principle of GAG, and models driven by SAS. Severalcomputational models have been developed in each of the threecategories. Because most models focus only on a very specialaspect of eye-movement control (e.g., oculomotor theories donot account for effects of word frequency) or have not beenimplemented on a computer to generate data for quantitativeevaluation, we will compare the SWIFT-II model as a viableimplementation of GAG with the E-Z Reader model in its latestversion (Reichle et al., 2003) as the most advanced model ofSAS. Both SWIFT and E-Z Reader reproduce a comparablenumber of experimentally observed phenomena, but are basedon very different principles, parallel word processing in SWIFTand serial word processing in E-Z Reader. We point out, how-ever, that we adopted a few of E-Z Reader’s principles: thatlexical difficulty is related to word frequency and predictability,the concept of two-stage lexical processing, and the two-levelprogramming of saccades. Moreover, both models adopted theconcept of systematic and random errors of saccades (Mc-Conkie et al., 1988).
The evaluation of different theoretical explanations is amongthe central problems of research, in particular in mathematicalmodeling of experimental data (e.g., Myung, Forster, &Browne, 2000). To guide the evaluation and comparison ofdifferent models, a number of criteria were proposed by Jacobsand Grainger (1994). Here we discuss the following criteria: (a)plausibility, (b) interpretability, (c) generalizability, and (d)complexity. Note that the relative importance of these criteriamight depend strongly on the types of models discussed and theresearch field.
(a) Plausibility and explanatory adequacy. To check theplausibility and explanatory adequacy of the models, we askwhether the theoretical explanation the models offer are biologi-
803THE SWIFT MODEL

cally and psychologically plausible and consistent with the knowl-edge in the corresponding field of research.
The E-Z Reader model is motivated by SAS driving eye move-ments in reading.33 The mechanism of SAS was introduced first byMorrison (1984), motivated by the attentional “spotlight” metaphorfrom attentional cuing experiments (Posner, 1980). Basic research onthe relation between attention shifts and saccade programming re-sulted in the observation that attentional shifts precede saccadesobligatorily (e.g., Deubel & Schneider, 1996; Kowler et al., 1995). Inthe E-Z Reader model, however, the basic mechanism for starting asaccade program is a preliminary stage of word processing called thefamiliarity check. Thus, the attentional shift occurs after the start ofthe eye-movement program. In an analysis of the E-Z Reader model,Deubel et al. (2000, p. 357) argued that “the assumption that saccadescan be programmed without an obligatory, preceding shift of attentionis certainly in conflict with most of the more recent investigations onthe relation of attention and saccade control.” From these consider-ations, one of the basic assumptions of the E-Z Reader model seemsquestionable.
An alternative view on the role of attention shifts for eye-movement control during reading has been discussed recently(Reichle, Pollatsek, & Rayner, in press). According to these argu-ments, visual processing is not sufficient for word identification,which requires, in addition, that attention be focused on the word.This hypothesis is based on findings that attention is essential for“binding” together features of visual objects for encoding single,unified representations (Treisman & Gelade, 1980; Treisman &Souther, 1986; Wheeler & Treisman, 2002; Wolfe, 1994; Wolfe &Bennett, 1996). From this line of evidence, Reichle et al. (in press)further argued that attention must be allocated to each word“object” so that it can be identified. Obviously, the role of theseprocesses for word recognition in a continuous task such as read-ing, in particular with respect to the time lines involved forattention shifts, remains an open research problem.
The separation into “where” and “when” pathways for spatialand temporal control of saccade programs, respectively, is one ofthe key findings in basic research about the oculomotor system(e.g., Wurtz, 1996). The SWIFT model is built around this prin-ciple, requiring a dynamically changing activation field for sac-cade target selection (dynamic field theory; Erlhagen & Schoner,2002, see below). Using this concept, the allocation of visualattention is specified by a gradient function in the SWIFT model.Furthermore, there is no direct coupling between attentional andoculomotor systems, inasmuch as attention is not necessarilyword-based in SWIFT. Thus, the time course of attentional shiftsin E-Z Reader is in contrast with the less explicit Gaussian-distributed attention in SWIFT.
(b) Interpretability. Both SWIFT and E-Z Reader have anumber of parameters that can be interpreted psychologicallyand/or neurophysiologically. As a consequence, these models areideal tools for testing alternative assumptions through the evalua-tion of obtained parameter values. As an example, we fit the labileand nonlabile saccade latency parameters to check whether thenumerical values obtained by parameter estimation are plausible. Itturned out that the corresponding values are in good agreementwith results from basic oculomotor research. We suspect that sucha test would be very interesting for the E-Z Reader model, as theSAS mechanisms might exert strong constraints on the durationsof saccade program stages.
(c) Generalizability. When we consider visual tasks differentfrom reading, many of the involved cognitive and oculomotor sub-systems overlap or are even the same. Whereas the tremendousvariability of stimuli in general scene perception currently precludes afully quantitative approach for models of eye-movement control,visual search tasks that include eye movements (e.g., Gilchrist &Harvey, 2000; Hooge & Erkelens, 1998) are good candidate para-digms for extending and/or generalizing mathematical models.
The most important complication is that in a visual search task,eye movements must be controlled in two dimensions. Reading,however, is effectively a one-dimensional task, because returnsweeps from one line of text to the next are not dominating thereading process. Using the concept of an evolving activation fieldin combination with Gaussian-distributed attention, it is straight-forward to generalize the SWIFT model to two-dimensional tasks(for a visual search task see Trukenbrod & Engbert, 2005). In E-ZReader, attention must be directed to the next item by a randomprocess, because simultaneous preprocessing of several items isprohibited in the SAS framework. Whereas we speculate that theremight be an advantage for the SWIFT model, the details of howcomputational models of eye-movement control perform in visualsearch tasks involving eye movements must be worked out infuture research, of course.
(d) Complexity. A general principle in the design of mathe-matical models is to keep the model’s complexity low. There is,however, no general theory of complexity or even of model com-plexity (see Badii & Politi, 1997).34 Although an analysis of modelcomplexity might unveil new insights into the underlying princi-ples of the models, currently it does not seem appropriate tocompare models quantitatively using concepts of complexity.
The SWIFT model generates all types of saccades within acoherent framework, the dynamic field theory of movement prep-aration (Erlhagen & Schoner, 2002). Thus, we proposed a singlemechanism for forward saccades, word skippings, refixations, andregressions, whereas in the E-Z Reader model, forward saccadesand word skippings are naturally explained by the SAS mecha-nism. The generation of refixations is added to the model byassuming an additional refixation program to each of the model’sinternal state, which increases the number of states from 8 to 14(Reichle et al., 1998).35
The number of model parameters is comparable betweenSWIFT and E-Z Reader. Whereas for E-Z Reader, dependentmeasures were averaged over classes of word frequency, the fittingprocedure proposed here is word-based. As a consequence, therelation of number of free parameters to number of data points ismuch smaller for SWIFT. Therefore, besides offering a viablealternative to the highly successful E-Z Reader model, we pro-
33 The relationship between attention and eye movements was first notedby Rayner, McConkie, and Ehrlich (1978).
34 A quantitative approach to estimating model complexity has beendeveloped recently based on the concept of minimum description length(Pitt, Myung, & Zhang, 2002). This approach, however, was applied tosimple models rather than to more complicated computational models suchas SWIFT and E-Z Reader.35 In E-Z Reader 7, the internal states of the model are no longer described,but we speculate that the number is much greater than 14.
804 ENGBERT, NUTHMANN, RICHTER, AND KLIEGL
posed a new approach for model fitting, which permits the analysisof computational models to much greater detail, and more reliably.
Summary
The control of eye movements during reading requires thecoordination of information processing and action selection onmany different cognitive levels. The SWIFT model represents apsychologically and neurophysiologically plausible computationalmodel of how this coordination could be achieved in a unifyingframework for almost all types of eye movements observed inreading experiments: forward saccades, refixations, word skip-pings, and regressions. The model can reproduce a number ofwell-established measures of eye-movement control during read-ing, average fixation durations and fixation probabilities, distribu-tions of within-word landing positions, and interword regressions.Finally, the SWIFT model can explain the IOVP effect of fixationdurations based on error correction of mislocated fixations.
References
Adams, M. W. J., Wood, D., & Carpenter, R. H. S. (2000). Expectationacuity: The spatial specificity of the effect of prior probability onsaccadic latency. Journal of Physiology—London, 527, 140P–141P.
Baayen, R. H., Piepenbrock, R., & van Rijn, H. (1993). The CELEX lexicaldatabase (Release 1) [CD-ROM]. Philadelphia, PA: Linguistic DataConsortium, University of Pennsylvania [Distributor].
Baddeley, A. (2000). The episodic buffer: A new component of workingmemory? Trends in Cognitive Science, 4, 417–423.
Badii, R., & Politi, A. (1997). Complexity. Cambridge, England: Cam-bridge University Press.
Becker, W., & Jurgens, R. (1979). An analysis of the saccadic system bymeans of double step stimuli. Vision Research, 19, 1967–1983.
Bergeron, A., Matsuo, S., & Guitton, D. (2003). Superior colliculus en-codes distance to target, not saccade amplitude, in multi-step gaze shifts.Nature Neuroscience, 6, 404–413.
Buswell, G. T. (1920). An experimental study of the eye–voice span inreading. Supplementary Educational Monographs, 17.
Carpenter, R. H. S. (2000). The neural control of looking. Current Biology,10, R291–R293.
Deubel, H., O’Regan, J. K., & Radach, R. (2000). Attention, informationprocessing, and eye movement control. In A. Kennedy, R. Radach, D.Heller, & J. Pynte (Eds.), Reading as a perceptual process (pp. 355–376). Amsterdam: Elsevier.
Deubel, H., & Schneider, W. X. (1996). Saccade target selection and objectrecognition: Evidence for a common attentional mechanism. VisionResearch, 36, 1827–1837.
Engbert, R., & Kliegl, R. (2001). Mathematical models of eye movementsin reading: A possible role for autonomous saccades. Biological Cyber-netics, 85, 77–87.
Engbert, R., & Kliegl, R. (2003a). The game of word skipping: Who are thecompetitors? Behavioral and Brain Sciences, 26, 481–482.
Engbert, R., & Kliegl, R. (2003b). Noise-enhanced performance in reading.Neurocomputing, 50, 473–478.
Engbert, R., Kliegl, R., & Longtin, A. (2004). Complexity of eye move-ments in reading. International Journal of Bifurcation and Chaos, 14,493–503.
Engbert, R., Longtin, A., & Kliegl, R. (2002). A dynamical model ofsaccade generation in reading based on spatially distributed lexicalprocessing. Vision Research, 42, 621–636.
Ericsson, K. A., & Kintsch, W. (1995). Long-term working memory.Psychological Review, 102, 211–245.
Erlhagen, W., & Schoner, G. (2002). Dynamic field theory of movementspreparation. Psychological Review, 109, 545–572.
Findlay, J. M., & Gilchrist, I. D. (2003). Active vision: The psychology oflooking and seeing. Oxford, England: Oxford University Press.
Findlay, J. M., & Walker, R. (1999). A model of saccade generation basedon parallel processing and competitive inhibition. Behavioral and BrainSciences, 22, 661–721.
Foxe, J. J., & Simpson, G. V. (2002). Flow of activation from V1 to frontalcortex in humans. Experimental Brain Research, 142, 139–150.
Gilchrist, I. D., & Harvey, M. (2000). Refixation frequency and memorymechanisms in visual search. Current Biology, 10, 1209–1212.
Glass, L., & Mackey, M. C. (1988). From clocks to chaos. The rhythms oflife. Princeton, NJ: Princeton University Press.
Goldberg, D. E. (1989). Genetic algorithms in search, optimization, andmachine learning. Reading, MA: Addison-Wesley.
Guckenheimer, J., & Holmes, P. (1983). Nonlinear oscillations, dynamicalsystems, and the bifurcation of vector fields. New York: Springer.
Henderson, J. M., & Ferreira, F. (1990). Effects of foveal processingdifficulty on the perceptual span in reading: Implications for attentionand eye movement control. Journal of Experimental Psychology: Learn-ing, Memory, and Cognition, 16, 417–429.
Holland, J. H. (1975). Adaptation in natural and artificial systems. AnnArbor: University of Michigan Press.
Hooge, I. T. C., & Erkelens, C. J. (1998). Adjustment of fixation durationin visual search. Vision Research, 38, 1295–1302.
Hyona, J., Radach, R., & Deubel, H. (Eds.). (2003). The mind’s eye:Cognitive and applied aspects of eye movement research. Oxford, En-gland: Elsevier.
Inhoff, A. W., Radach, R., Starr, M., & Greenberg, S. (2000). Allocationof visuo–spatial attention and saccade programming during reading. InA. Kennedy, R. Radach, D. Heller, & J. Pynte (Eds.), Reading as aperceptual process (pp. 221–246). Amsterdam: Elsevier.
Jacobs, A. M., & Grainger, J. (1994). Models of visual word recognition—Sampling the state of the art. Journal of Experimental Psychology:Human Perception and Performance, 20, 1311–1334.
Kalesnykas, R. P., & Hallett, P. E. (1994). Retinal eccentricity and thelatency of eye saccades. Vision Research, 34, 517–531.
Kaplan, D. T., & Glass, L. (1995). Understanding nonlinear dynamics.New York: Springer.
Kapoula, Z. (1985). Evidence for a range effect in the saccadic system.Vision Research, 25, 1155–1157.
Kennedy, A. (2000a). Attention allocation in reading: Sequential or paral-lel? In A. Kennedy, R. Radach, D. Heller, & J. Pynte (Eds.), Reading asa perceptual process (pp. 193–220). Oxford, England: Elsevier.
Kennedy, A. (2000b). Parafoveal processing in word recognition. Quar-terly Journal of Experimental Psychology: Human Experimental Psy-chology, 53A, 429–455.
Kennedy, A., & Pynte, J. (2004). Parafoveal-on-foveal effects in normalreading. Vision Research, 45, 153–168.
Kennison, S. M., & Clifton, C. (1995). Determinants of parafoveal previewbenefit in high and low working memory capacity readers: Implicationsfor eye movement control. Journal of Experimental Psychology: Learn-ing, Memory, and Cognition, 21, 68–81.
Kliegl, R., & Engbert, R. (2003). SWIFT explorations. In J. Hyona, R.Radach, & H. Deubel (Eds.), The mind’s eye: Cognitive and appliedaspects of eye movement research (pp. 103–117). Oxford, England:Elsevier.
Kliegl, R., & Engbert, R. (2005). Fixation durations before word skippings inreading eye movements. Psychonomic Bulletin & Review, 12, 132–138.
Kliegl, R., Grabner, E., Rolfs, M., & Engbert, R. (2004). Length, fre-quency, and predictability effects of words on eye movements in read-ing. European Journal of Cognitive Psychology, 16, 262–284.
Kliegl, R., Nuthmann, A., & Engbert, R. (2005). Tracking the mind during
805THE SWIFT MODEL

reading: The influence of past, present, and future words on fixationdurations. Manuscript submitted for publication.
Koriat, A., Greenberg, S. N., & Kreiner, H. (2002). The extraction ofstructure during reading: Evidence from reading prosody. Memory &Language, 30, 270–280.
Kowler, E., Anderson, E., Dosher, B., & Blaser, E. (1995). The role ofattention in the programming of saccades. Vision Research, 35, 1897–1916.
Krauzlis, R. J., & Carello, C. D. (2003). Going for the goal. NatureNeuroscience, 6, 332–333.
Kustov, A. A., & Robinson, D. L. (1996). Shared neural control ofattentional shifts and eye movements. Nature, 384, 74–77.
Legge, G. E., Hooven, T. A., Klitz, T. S., Mansfield, J. S., & Tjan, B. S.(2002). Mr. Chips 2002: New insights from an ideal-observer model ofreading. Vision Research, 42, 2219–2234.
Legge, G. E., Klitz, T. S., & Tjan, B. S. (1997). Mr. Chips: An ideal-observer model of reading. Psychological Review, 104, 524–553.
Legge, G. E., Mansfield, J. S., & Chung, S. T. L. (2001). Psychophysics ofreading XX: Linking letter recognition to reading speed in central andperipheral vision. Vision Research, 41, 725–743.
Liversedge, S. P., & Findlay, J. M. (2000). Saccadic eye movements andcognition. Trends in Cognitive Science, 4, 6–14.
Luce, R. D. (1959). Individual choice behavior: A theoretical analysis.New York: Wiley.
Matin, E. (1974). Saccadic suppression: A review. Psychological Bulletin,81, 899–917.
May, R. M. (2004). Uses and abuses of mathematics in biology. Science,303, 790–793.
McConkie, G. W., Kerr, P. W., & Dyre, B. P. (1994). What are “normal”eye movements during reading: Toward a mathematical description. InJ. Ygge & G. Lennerstrand (Eds.), Eye movements in reading (pp.331–343). Amsterdam: Pergamon Press.
McConkie, G. W., Kerr, P. W., Reddix, M. D., & Zola, D. (1988). Eyemovement control during reading: I. The location of initial fixations onwords. Vision Research, 28, 1107–1118.
McConkie, G. W., Kerr, P. W., Reddix, M. D., Zola, D., & Jacobs, A. M.(1989). Eye movement control during reading: II. Frequency of refixat-ing a word. Perception & Psychophysics, 46, 245–253.
McConkie, G. W., & Rayner, K. (1976). Asymmetry of the perceptual spanin reading. Bulletin of the Psychonomic Society, 8, 365–368.
McIlwain, J. T. (1991). Distributed coding in the superior colliculus: Areview. Visual Neuroscience, 6, 3–13.
Millonas, M. (1996). Fluctuations and order: The new synthesis. NewYork: Springer.
Morris, R. K., Rayner, K., & Pollatsek, A. (1990). Eye movement guidance inreading: The role of parafoveal letter and space information. Journal of Exper-imental Psychology: Human Perception and Performance, 16, 268–281.
Morrison, R. E. (1984). Manipulation of stimulus onset delay in reading:Evidence for parallel programming of saccades. Journal of ExperimentalPsychology: Human Perception and Performance, 10, 667–682.
Moschovakis, A. K., Scudder, C. A., & Highstein, S. M. (1996). Themicroscopic anatomy and physiology of the mammalian saccadic sys-tem. Progress in Neurobiology, 50, 133–254.
Moss, F., & McClintock, P. V. E. (1989). Noise in nonlinear dynamicalsystems (Vol. 2). Cambridge, England: Cambridge University Press.
Munoz, D. P., & Wurtz, R. H. (1993a). Fixation cells in monkey superiorcolliculus: I. Characteristics of cell discharge. Journal of Neurophysiol-ogy, 70, 559–575.
Munoz, D. P., & Wurtz, R. H. (1993b). Fixation cells in monkey superiorcolliculus: II. Reversible activation and deactivation. Journal of Neuro-physiology, 70, 576–589.
Munoz, D. P., & Wurtz, R. H. (1995a). Saccade-related activity in monkeysuperior colliculus: I. Characteristics of burst and build-up cells. Journalof Neurophysiology, 73, 2313–2333.
Munoz, D. P., & Wurtz, R. H. (1995b). Saccade-related activity in monkey
superior colliculus: I. Spread of activity during saccades. Journal ofNeurophysiology, 73, 2334–2348.
Myung, I. J., Forster, M., & Browne, M. W. (Eds.). (2000). Model selection[Special issue]. Journal of Mathematical Psychology, 44 (1–2).
Nuthmann, A., Engbert, R., & Kliegl, R. (2005). Mislocated fixationsduring reading and the inverted optimal viewing position effect. VisionResearch, 45, 2201–2217.
O’Regan, J. K. (1979). Eye guidance in reading: Evidence for the linguisticcontrol hypothesis. Perception & Psychophysics, 25, 501–509.
O’Regan, J. K. (1990). Eye movements and reading. In E. Kowler (Ed.),Eye movements and their role in visual and cognitive processes (pp.395–453). Amsterdam: Elsevier.
O’Regan, J. K. (1992). Optimal viewing position in words and thestrategy–tactics theory of eye movements in reading. In K. Rayner (Ed.),Eye movements and visual cognition: Scene perception and reading (pp.333–354). Berlin, Germany: Springer-Verlag.
O’Regan, J. K., & Jacobs, A. M. (1992). Optimal viewing position effectin word recognition: A challenge to current theory. Journal of Experi-mental Psychology: Human Perception and Performance, 18, 185–197.
O’Regan, J. K., & Levy-Schoen, A. (1987). Eye movement strategy andtactics in word recognition and reading. In M. Coltheart (Ed.), Attentionand performance XII: The psychology of reading (pp. 363–383). Hills-dale, NJ: Erlbaum.
O’Regan, J. K., Levy-Schoen, A., Pynte, J., & Brugaillere, B. (1984).Convenient fixation location within isolated words of different lengthand structure. Journal of Experimental Psychology: Human Perceptionand Performance, 10, 250–257.
Pitt, M. A., Myung, I. J., & Zhang, S. (2002). Toward a method of selectingamong computational models of cognition. Psychological Review, 109,472–491.
Pollatsek, A., Lesch, M., Morris, R. M., & Rayner, K. (1992). Phonologicalcodes are used in integrating information across saccades in wordidentification and reading. Journal of Experimental Psychology: HumanPerception and Performance, 18, 148–162.
Pollatsek, A., Reichle, E. D., & Rayner, K. (in press). Tests of the E-ZReader model: Exploring the interface between cognition and eye-movement control. Cognitive Psychology.
Posner, M. I. (1980). Orienting of attention. Quarterly Journal of Exper-imental Psychology, 32, 3–25.
Poulton, E. C. (1981). Human manual control. In V. B. Brooks (Ed.), Hand-book of physiology: Vol. II. Motor control: Section 1. The nervous system(Part 2, pp. 1337–1389). Bethesda, MD: American Physiological Society.
Pynte, J., Kennedy, A., & Ducrot, S. (2004). The influence of parafovealtypographical errors on eye movements in reading. European Journal ofCognitive Psychology, 16, 178–202.
Radach, R., & Heller, D. (2000). Relations between spatial and temporalaspects of eye movement control. In A. Kennedy, R. Radach, D. Heller,& J. Pynte (Eds.), Reading as a perceptual process (pp. 165–192).Oxford, England: Elsevier.
Radach, R., Kennedy, A., & Rayner, K. (Eds.). (2004). Eye movements andinformation processing during reading [Special issue]. European Jour-nal of Cognitive Psychology, 16(1/2).
Radach, R., & McConkie, G. W. (1998). Determinants of fixation positionsin words during reading. In G. Underwood (Ed.), Eye guidance inreading and scene perception (pp. 77–100). Oxford, England: Elsevier.
Ratcliff, R. (1978). A theory of memory retrieval. Psychological Review,85, 59–108.
Rayner, K. (1979). Eye guidance in reading: Fixation locations withinwords. Perception, 8, 21–30.
Rayner, K. (1998). Eye movements in reading and information processing:20 years of research. Psychological Bulletin, 124, 372–422.
Rayner, K., Ashby, J., Pollatsek, A., & Reichle, E. D. (2004). The effectsof frequency and predictability on eye fixations in reading: Implications
806 ENGBERT, NUTHMANN, RICHTER, AND KLIEGL

for the E-Z Reader model. Journal of Experimental Psychology: HumanPerception and Performance, 30, 720–732.
Rayner, K., & Duffy, S. A. (1986). Lexical ambiguity and fixation times inreading: Effects of word frequency, verb complexity, and lexical ambi-guity. Memory & Cognition, 14, 191–201.
Rayner, K., & Fischer, M. H. (1996). Mindless reading revisited: Eyemovements during reading and scanning are different. Perception &Psychophysics, 58, 734–747.
Rayner, K., & Juhasz, B. J. (2004). Eye movements in reading: Oldquestions and new directions. European Journal of Cognitive Psychol-ogy, 16, 340–352.
Rayner, K., McConkie, G. W., & Ehrlich, S. F. (1978). Eye movements andintegrating information across fixations. Journal of Experimental Psy-chology: Human Perception and Performance, 4, 529–544.
Rayner, K., Sereno, S. C., & Raney, G. E. (1996). Eye movement control inreading: A comparison of two types of models. Journal of ExperimentalPsychology: Human Perception and Performance, 22, 1188–1200.
Rayner, K., Warren, T., Juhasz, B. J., & Liversedge, S. P. (2004). Theeffect of plausibility on eye movements in reading. Journal of Experi-mental Psychology: Learning, Memory, and Cognition, 30, 1290–1301.
Rayner, K., Well, A. D., & Pollatsek, A. (1980). Asymmetry of the effectivevisual field in reading. Perception & Psychophysics, 27, 537–544.
Reichle, E. D., Pollatsek, A., Fisher, D. L., & Rayner, K. (1998). Toward amodel of eye movement control in reading. Psychological Review, 105,125–157.
Reichle, E. D., Pollatsek, A., & Rayner, K. (in press). E-Z Reader: Acognitive-control, serial attention model of eye-movement behavior dur-ing reading. Cognitive Systems Research.
Reichle, E. D., Rayner, K., & Pollatsek, A. (1999). Eye movements controlin reading: Accounting for initial fixation locations and refixationswithin the E-Z Reader model. Vision Research, 39, 4403–4411.
Reichle, E. D., Rayner, K., & Pollatsek, A. (2003). The E-Z Reader modelof eye movement control in reading: Comparisons to other models.Behavioral and Brain Sciences, 26, 446–526.
Reilly, R., & O’Regan, J. K. (1998). Eye movement control in reading: Asimulation of some word-targeting strategies. Vision Research, 38, 303–317.
Schilling, H. E. H., Rayner, K., & Chumbley, J. I. (1998). Comparingnaming, lexical decision, and eye fixation times: Word frequency effectsand individual differences. Memory & Cognition, 26, 1270–1281.
Spall, J. C. (2004). Stochastic optimization. In J. E. Gentle, W. Hardle, &Y. Mori (Eds.), Handbook of computational statistics (pp. 169–197).Berlin: Springer.
Sparks, D. L. (2002). The brainstem control of saccadic eye movements.Nature Reviews Neuroscience, 3, 952–964.
Starr, M. S., & Rayner, K. (2001). Eye movements during reading: Somecurrent controversies. Trends in Cognitive Sciences, 4, 158–163.
Strogatz, S. H. (1994). Nonlinear dynamics and chaos. Reading, MA:Perseus Books.
Treisman, A. M., & Gelade, G. (1980). Feature-integration theory ofattention. Cognitive Psychology, 12, 97–136.
Treisman, A., & Souther, J. (1986). Illusory words: The roles of attention andof top-down constraints in conjoining letters to form words. Journal ofExperimental Psychology: Human Perception and Performance, 12, 3–17.
Trukenbrod, H. A., & Engbert, R. (2005). Eye movements in visual search:Experiment and computational modeling. Manuscript in preparation.
Van Gisbergen, J. A. M., Gielen, S., Cox, H., Bruijns, J., & Kleine Schaars,H. (1981). Relation between metrics of saccades and stimulus trajectoryin visual target tracking; Implications for models of the saccadic system.In A. F. Fuchs & W. Becker (Eds.), Progress in oculomotor research(pp. 19–27). New York: Elsevier/North Holland.
Van Orden, G. C. (1987). A ROWS is a ROSE: Spelling, sound, andreading. Memory & Cognition, 15, 181–198.
Vitu, F., & McConkie, G. W. (2000). Regressive saccades and wordperception in adult reading. In A. Kennedy, R. Radach, D. Heller, & J.Pynte (Eds.), Reading as a perceptual process (pp. 301–326). Amster-dam: Elsevier.
Vitu, F., McConkie, G. W., Kerr, P., & O’Regan, J. K. (2001). Fixationlocation effects on fixation durations during reading: An inverted opti-mal viewing position effect. Vision Research, 41, 3513–3533.
Vitu, F., O’Regan, J. K., Inhoff, A. W., & Topolski, R. (1995). Mindlessreading: Eye movement characteristics are similar in scanning letterstrings and reading texts. Perception & Psychophysics, 57, 352–364.
Wheeler, M. E., & Treisman, A. M. (2002). Binding in short-term visualmemory. Journal of Experimental Psychology: General, 131, 48–64.
Wolfe, J. M. (1994). Guided search 2.0: A revised model of visual search.Psychonomic Bulletin & Review, 1, 202–238.
Wolfe, J. M., & Bennett, S. C. (1996). Preattentive object files: Shapelessbundles of basic features. Vision Research, 37, 25–43.
Wurtz, R. H. (1996). Vision for the control of movement. InvestigativeOphthalmology and Visual Science, 37, 2131–2145.
Wyman, D., & Steinman, R. M. (1973). Latency characteristics of smallsaccades. Vision Research, 13, 2173–2175.
Yang, S.-N., & McConkie, G. W. (2001). Eye movements during reading:A theory of saccade initiation time. Vision Research, 41, 3567–3585.
Yang, S.-N., & McConkie, G. W. (2004). Saccade generation duringreading: Are words necessary? European Journal of Cognitive Psychol-ogy, 16, 226–261.
(Appendixes follow)
807THE SWIFT MODEL
Appendix A
Fitting Model Parameters
For the estimation of model parameters, we used a genetic algorithmapproach. This method turned out to be very efficient for the type ofoptimization problems we face here. The method was developed andsuccessfully applied to SWIFT-I (Engbert et al., 2002) and to a three-state SAS model (Engbert & Kliegl, 2001). For each sentence, 200model realizations were run with a new set of pseudorandom numbers.For all 850 words, eight statistical measures were computed from theseruns.
Genetic Algorithm Procedure
For the genetic algorithm (Goldberg, 1989; Holland, 1975; Spall,2004), we started with a population of 50 combinations (chromosomes)of parameter values, which were chosen randomly from the specifiedrange for each parameter (Table 3). The individual ranges of para-meters were chosen in advance according to mathematical or plausibil-ity considerations. As an example, the predictability coefficient � inEquation 1 is naturally restricted to the interval between 0 and 1. Forparameters defined on an unlimited range, we chose a plausiblerange of values (e.g., a range from 100 ms to 300 ms for the randomtimer).
Using selection, mutation, and recombination (crossover) for thetemporal evolution of the population of genes, we iterated the popula-tion for several 1,000 generations. A reduction of the parameter vari-ance over the best 50 chromosomes of the population indicated con-vergence of the estimates of model parameters. Also, we calcu-lated errors of the parameter estimates from these 50 chromo-somes (Table 3).A1 The number of iterations of Equation 20 necessaryfor this procedure of parameter fitting can be estimated as 103 itera-tions � 102 sentences � 102 runs (virtual participants) � 103 genera-tions in the genetic algorithm, which gives the order of 1010 iterations.Numerical simulations were run on a cluster of 12 Apple G5 (dualprocessor) computers, which performed these computations in less than48 hr.
The performance of the model is defined as mean squared normalizederrors of fixation durations and fixation probabilities per word. Fixationdurations obtained from model simulations are denoted by T n
j , wherethe subscript denotes the word (n � 1, 2, 3, . . . , 850) and the super-script indicates the type of measure: first fixation duration (j � 1),second fixation duration (j � 2), single fixation duration (j � 3), andtotal reading time (j � 4).A2 Next, we compute the deviation from theexperimentally observed value, T� k
j ,
T � �j�1
4 �k�1
850 �T kj � T� k
j
�T kj � �
2
, (A1)
where (T kj ) denotes the standard deviation of the simulated fixation
durations.The four different measures of fixation probabilities P k
j —skipping prob-ability (j � 1), probability for two fixations (j � 2), probability for threeor more fixations (j � 3), and regression probability (j � 4)—wereevaluated analogously to measures of fixation durations,
P � �j�1
4 �k�1
850 �P kj � P� k
j
�P kj � �
2
, (A2)
where (P kj ) represents the standard deviations of the probabilities.
In order to fit the distributions of fixation durations, we com-puted the deviation of the simulated distribution of fixation dura-
tions from the corresponding distributions obtained from experi-mental data. Distributions of average fixation durations were calculated sep-arately for the four measures of fixation durations from 500 bins ranging from0 to 500 ms in steps of 1 ms. The corresponding values were denoted by D k
j ,with the subscript indicating the bin (k � 1, 2, 3, . . . , 500) and the superscriptindicating the fixation duration measure (as for T k
j , see above). Thus, weobtain a third measure of deviation,
D � �j�1
4 �k�1
500 �Dkj � D� k
j
D� kj � 1 �
2
, (A3)
where N Fj is the total number of fixations in each measure j.
To fit the IOVP effects for first and single fixation durations, weincluded an additional deviation measure. Let us denote the averagefirst and single fixation duration on a word of length k with a fixationposition on letter j as Ik
1(j) and Ik2(j), respectively. To reduce noise in the
empirical data, we considered only words of lengths 4 to 8, that is,
I,v � 1000 �k�4
8 �j�0
k � I kv�j� � �I k
v�j��I k
v�j� � 2
, (A4)
where v � 1 and v � 2 represent first and single fixation durations,respectively. Because single fixations represent the majority of all fixa-tions, we doubled the weight for I,2, that is,
I � I,1 � 2 I,2. (A5)
Finally, we combined the above four mean squared error measures in asingle deviation measure,
� T � P � D � I. (A6)
Because all realizations of the model simulations are stochastic, the devi-ation measures (Equation A6) fluctuate as well. Five runs of the model(using 200 virtual participants) resulted in the following numerical values: � 6921 � 47, where T � 4223 � 52, P � 1744 � 27, D � 390 �13, and I � 565 � 27.
Parameter Sensitivity and Model Stability
Using the genetic algorithm procedure, we were able to analyze theevolution of parameters and errors over the iteration of generations(Figure A1). First, the complicated time course of the best parameter valuesover time indicated the presence of nonlinear correlations between modelparameters. Second, the noise level seen in parameter uncertainty de-creased over the evolution of the population of chromosomes. The relativestrength of parameter errors varied considerably across parameters. Weused the errors of parameters to simulate interindividual differences (seesection on model parameters).
A1 To further check the reliability of the optimization procedure, wecarried out several runs of the genetic algorithm procedure, which repro-duced the results within the error bars obtained from one simulation.
A2 If one of the measures was not computable (e.g., for a word neverfixated or never fixated more than once), we excluded the specific wordfrom this analysis.
808 ENGBERT, NUTHMANN, RICHTER, AND KLIEGL
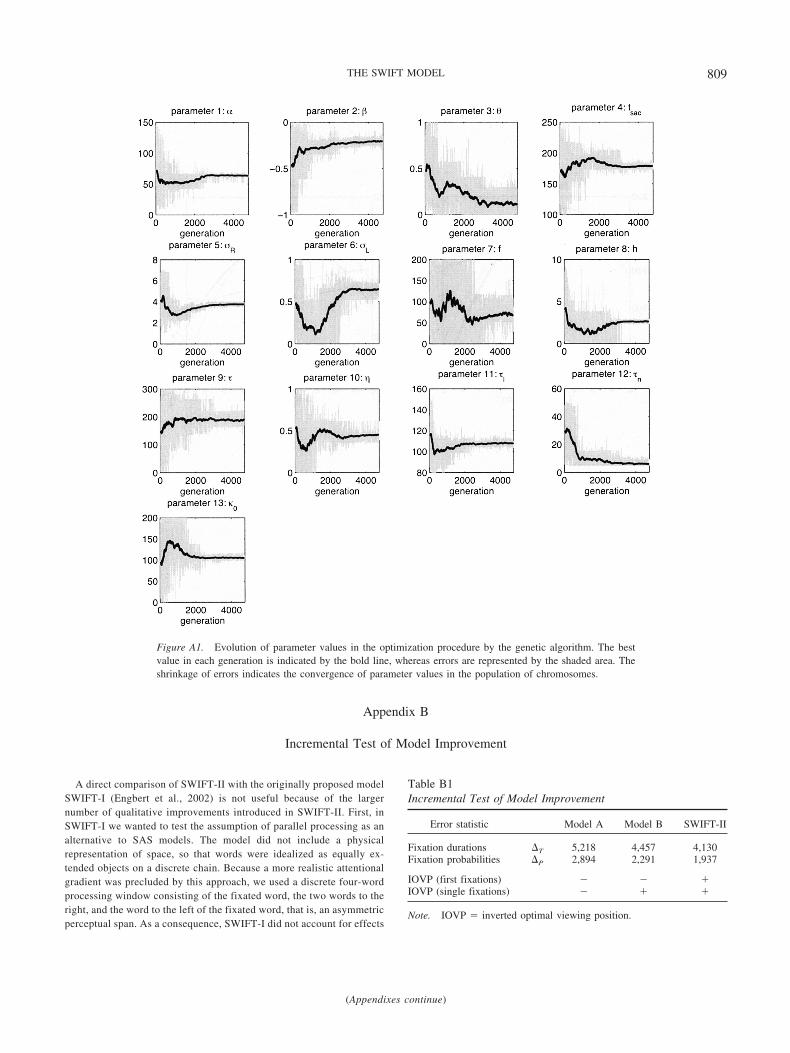
Appendix B
Incremental Test of Model Improvement
A direct comparison of SWIFT-II with the originally proposed modelSWIFT-I (Engbert et al., 2002) is not useful because of the largernumber of qualitative improvements introduced in SWIFT-II. First, inSWIFT-I we wanted to test the assumption of parallel processing as analternative to SAS models. The model did not include a physicalrepresentation of space, so that words were idealized as equally ex-tended objects on a discrete chain. Because a more realistic attentionalgradient was precluded by this approach, we used a discrete four-wordprocessing window consisting of the fixated word, the two words to theright, and the word to the left of the fixated word, that is, an asymmetricperceptual span. As a consequence, SWIFT-I did not account for effects
(Appendixes continue)
Figure A1. Evolution of parameter values in the optimization procedure by the genetic algorithm. The bestvalue in each generation is indicated by the bold line, whereas errors are represented by the shaded area. Theshrinkage of errors indicates the convergence of parameter values in the population of chromosomes.
Table B1Incremental Test of Model Improvement
Error statistic Model A Model B SWIFT-II
Fixation durations T 5,218 4,457 4,130Fixation probabilities P 2,894 2,291 1,937
IOVP (first fixations) � � �IOVP (single fixations) � � �
Note. IOVP � inverted optimal viewing position.
809THE SWIFT MODEL

of word length, variations of within-word viewing positions, and ocu-lomotor errors. Second, the model was implemented using an Englishtext corpus by Schilling, Rayner, and Chumbley (1998) with a ratherlimited data basis (average fixation durations and fixation probabilitiesfor classes of word frequency). Taken together, a comparison ofSWIFT-II and its predecessor SWIFT-I is neither useful nor achievablein a straightforward way.
To demonstrate the power of some of our model’s principles, how-ever, we performed an incremental model comparison using two sim-plified versions of SWIFT-II. In Model A, we did not include Principles6 (error correction of mislocated fixations) and 7 (saccade latencymodulation), whereas in Model B we removed only the saccade latencymodulation (Principle 7). Both model versions A and B were fitted toexperimental data by the same techniques as SWIFT-II, described inAppendix A.B1
Using the optimal sets of parameters for all three models, we per-formed a separate run to generate data for an analysis of goodness of fiton measures for fixation durations and fixation probabilities (see Ap-pendix A). Goodness of fit decreases (i.e., T and P increase) in thereduced Models A and B (see Table B1). Generally, we expected costs(in terms of a poorer fit) if we implemented mechanisms for theexplanation of IOVP effects, which were not compatible with theimplicit pattern in the experimental data. Because goodness of fitincreased both with respect to fixation durations, T , and with respectto fixation probabilities, P , the additional Principles 6 and 7 arecompatible with the experimental data.
Next, we investigated the performance of each of the models on theIOVP effect qualitatively. To determine the form of the curves for
average fixation durations as a function of within-word fixation posi-tions, we estimated coefficients for a second-order polynomial for a plotof IOVP effects for both first and single fixation durations (e.g., Figure15). The resulting polynomial fits are plotted in Figure B1. AlthoughModel A fails to reproduce any of the inverted U-shaped curves, theadditional mechanism of error correction of mislocated fixations (Prin-ciple 6) in Model B can explain the inverted U shape in the IOVP effectfor single fixation durations (see Figure B1a). Thus, these simulationsillustrate that the additional value of the latency modulation (Principle7) in the full model, SWIFT-II, is to reproduce the IOVP effect for firstfixation durations (see Figure B1b).
In summary, our simulations of the SWIFT model suggest that theIOVP effect of single fixation durations is generated by a mechanism oferror correction of mislocated fixations (Principle 6), whereas for firstfixation durations it seems necessary to include a latency modulation ofsaccade programming (Principle 7) to reproduce the IOVP effect. Thesefindings can also explain the discrepancies between experimental dataand simulation results obtained from a “toy” model (based on Principle6) of the IOVP effect discussed in a recent article (Nuthmann et al.,2005).
B1 Because the IOVP effect cannot be explained by Models A and B,however, the deviation measures for the IOVP effects of first and singlefixation duration were not included in the parameter estimation procedure(see Appendix A, Equation A6).
Figure B1. Average inverted optimal viewing position (IOVP) curves in different model versions. (a) Resultsfor single fixation durations. The IOVP effect is generated by SWIFT and Model B (without latency modulation),whereas Model A (without error correction of mislocated fixations) cannot reproduce the inverted form of thecurve. (b) Results for first fixation durations. The inverted form of the fixation duration as a function ofwithin-word fixation position is reproduced by SWIFT, whereas the reduced Models A and B fail to explain theIOVP effect.
810 ENGBERT, NUTHMANN, RICHTER, AND KLIEGL

Appendix C
Dynamical Analysis of SWIFT
The SWIFT model is a (stochastic) nonlinear dynamical system withtime delay, a class of models that can generate very rich behavior (Glass &Mackey, 1988). Although the complexity of behavior generated by ourmodel is qualitatively as rich as the experimentally observed eye move-ments, the mathematical analysis of model simulations provides newinsight into the underlying principles of eye-movement control. Our anal-ysis is based on concepts developed in the theory of dynamical systems(Guckenheimer & Holmes, 1983; Kaplan & Glass, 1995; Strogatz, 1994).
The SWIFT model is based on the set of Nw lexical activations {an(t)},where Nw is the number of words in a given sentence. Thus, the dynamicalbehavior can be represented in an Nw-dimensional state space.C1 Here, weshow that the dynamical behavior can actually be approximated by asimpler system in two dimensions during each fixation. Analyses of thistype may prove very useful for comparing computational models of eye-movement control in reading with respect to underlying model complexity.
The two main sources of stochasticity are related to saccade timing andsaccade target selection, because the temporal control of fixation duration isperformed by an autonomous saccade generator, which produces stochasticintervals, and the spatial control of fixation position is performed by a sto-chastic target selection mechanism (Equation 10) and additional oculomotornoise. During fixations, the temporal evolution of the set of activations (Equa-tion 7), is a system of ordinary differential equations, which will generatedeterministic behavior, although this system is perturbed by noise, becauseword processing is implemented as a random walk. Because SWIFT combinesproperties of stochastic and deterministic dynamical systems, we investigatethe degree of determinism of the dynamics.
In the first step of our analysis, we compare several runs of the model inthe same plot of the set of activations {an(t)} over time t (see Figure C1).Although the time evolutions of activations are rather similar across runsfor the first words of the sentence, the plot indicates that there is a fastdivergence of the trajectories between different model runs toward the end
of the sentence. Thus, we cannot directly compute the variance of trajec-tories from a simple plot of activations over time.
One solution to this problem is to trace the time evolution of determin-istic dynamical systems in a vector space, called the phase space. Thephase space is important for uniquely defining the dynamical state of themodel, which permits (short-term) predictions of its future temporal evo-lution. In SWIFT, the change of activation during fixation can be visual-ized in a vector space with as many dimensions as there are words in agiven sentence (i.e., the phase space is Nw-dimensional). During fixation ofword n, however, the activation for most of the words is close to zero (seeFigure C1). This is reflected by the observation that the most frequentsaccades are (one-word) forward saccades (54%), word skippings (two-words forward, 19%), and refixations (16%). Thus, activations an(t),an�1(t), and an�2(t) capture the dynamics in 89% of all saccades. There-fore, we introduce the locally reduced phase space for fixation on word nas the vector space (an(t), an�1(t), an�2(t)).
A further reduction of the dimension of the locally reduced phase spaceis obtained by the mapping from activations {an(t)} to probabilities {�n(t)}(see Equation 10). The fact that saccades targeting words n, n � 1, and n �2 represent 89% of all saccades is reflected by the observation that �n(t) ��n�1(t) � �n�2(t) � 1 for all t. As a consequence, we can eliminate �n(t)as a dynamical variable (i.e., the dimension is further reduced by 1).Therefore, we use the two-dimensional locally reduced phase space � �[�n�1(t), �n�2(t)] (during fixation of word n) for the analysis of SWIFT(Figure C2a). For each run of the model we obtain a trajectory in phasespace. Because �n�1(t) � �n�2(t) � 1 for all t, trajectories are bounded tothe left triangle of the panels. A glance at the plot in Figure C2a shows thatthe trajectories are rather erratic.
C1 For the representation of a dynamical system, we use the morerigorous concept of the phase space as described below.
Figure C1. Temporal evolution of activations {an(t)} for N � 20 runs of the SWIFT model using Sentence 17of the Potsdam Sentence Corpus. The temporal evolution of the model induces a fast separation of activationsbetween different runs.
(Appendixes continue)
811THE SWIFT MODEL

To extract the phase flow generated by the SWIFT model, wecompute average directional vectors from many runs of the model in acoarse-grained version of the locally reduced phase space � (Kaplan &Glass, 1992).C2 The phase space � is coarse-grained into a 20 � 20grid. Each pass k of a trajectory through box j generates a vector of unitlength, called the trajectory vector v�kj. After simulation of 200 trajec-tories, we calculate the resultant vector from the vector addition of allpasses through the box
V� j �1
nj�k�1
nj
v�kj, (C1)
where nj is the number of passes through box j. The result is a coarse-grained estimate of the vector field of the model (see Figure C2b).
To describe the time evolution qualitatively, we use the illustration inFigure C3. Trajectories enter the plane when fixation on word n starts; thatis, an(t) dominates the set of activations. Therefore, trajectories start withsmall values �n�1 � �n�2, because word n � 1 typically received morepreview than word n � 2. Because lexical processing rate will be higher for
C2 This method was originally proposed for the analysis of experimentaldata.
Figure C2. Visualization of SWIFT’s temporal evolution in reduced phase space. (a) Plot of probabilities�n�2(t) versus �n�1(t) during fixation of word n for 20 runs of the model. (b) Phase flow estimated by averagedirectional vectors in a coarse-grained version of the locally reduced phase space � from 200 runs.
812 ENGBERT, NUTHMANN, RICHTER, AND KLIEGL

word n � 1 than for word n � 2, the trajectory will show a slope �1initially. Whenever point F is reached, a forward saccade will occur withprobability 1, because �n�1 � 1 and �n�2 � 0. Alternatively, the skippingpoint S can be reached by the trajectory, which results in a skipping,because �n�1 � 0 and �n�2 � 1. For infinitely long fixation durations onword n, both word n � 1 and word n � 2 will be completely processed; thatis, the origin of the plane is globally absorbing.
The qualitative analysis demonstrates that the time evolution of the set oflexical activations shows clear properties of a deterministic dynamical system.This is a qualitative difference to SAS models, which are based on stochastictransition rules for a finite number of internal states (Engbert & Kliegl, 2001;Reichle et al., 1998). Furthermore, the dynamics are low-dimensional and canbe described by the two variables �n�1 and �n�2. The Nw-dimensional phasespace collapses onto a two-dimensional subspace, where the dynamical be-havior of the model unfolds. Thus, whereas the SWIFT model can potentiallygenerate high-dimensional behavior (i.e., parallel processing of many words),the dynamical behavior is low-dimensional, with three words typically acti-vated at a time.
Appendix D
Results on Gaze Duration
An important measure of eye-movement behavior during reading is gazeduration, which is defined as the sum of the duration of the first fixationand the durations of all direct refixations. We argued that gaze durationmight be not a good measure of fixation duration for model fitting, becauseit represents a processing measure from a variety of different eye trajec-tories. For the same reason, we used an alternative definition of firstfixation duration: First fixation duration is the average of the durations ofall first fixations, which are followed by at least a second fixation. Thisdefinition explicitly excludes cases of single fixations.
To complement the simulation results, however, we present the resultson gaze duration and on the traditional measure of first fixation duration(including single fixations) in Figure D1.
Finally, we note that there is no single measure of fixation durationthat gives a comprehensive characterization of processing time. Thisfact is adequately reflected in Rayner’s (1998, p. 377) statement that “Itthus appears that any single measure of processing time per word is apale reflection of the reality of cognitive processing.”
Received November 22, 2004Revision received April 25, 2005
Accepted May 9, 2005 �
Figure D1. Results for gaze duration and traditionally defined first fixation duration. (a) Fixation duration asa function of word-frequency class. (b) Fixation duration as a function of word length.
Figure C3. Schematic illustration of the phase flow in locally reducedphase space � during fixation of word n.
813THE SWIFT MODEL