Swiber Holdings Limitedswiber.listedcompany.com/newsroom/Swiber_3Q06... · Charter offshore support...
48
A niche service provider to the offshore oil and gas industry Swiber Holdings Limited Corporate Presentation 23 November 2006
Transcript of Swiber Holdings Limitedswiber.listedcompany.com/newsroom/Swiber_3Q06... · Charter offshore support...

A niche service provider to the offshore oil and gas industry
Swiber Holdings Limited
Corporate Presentation23 November 2006
Forward Looking Statements – Important Note
The following presentation contain forward looking statements by the management of Swiber Holdings Limited (“Swiber”), relating to financial trends for future periods, compared to the results for previous period.
Some of the statements contained in this presentation that are not historical facts are statements of future expectations with respect to the financial conditions, results of operations and businesses, and related plans and objectives. Forward looking information is based on management’s current views and assumptions including, but not limited to, prevailing economic and market conditions. These statements include known and unknown risks and uncertainties that could cause actual results, performance or events to differ materially from those in the statements as originally made. Such statements are not, and should not be construed as a representation as to future performance of Swiber. It should be noted that the actual performance of Swiber may vary significantly from such targets.
A niche service provider to the offshore oil and gas industry
Corporate Profile

Business Overview
Swiber is a niche service provider to the offshore oil and gasoffshore oil and gasindustry, with a complementary business in offshore marine support
Engineering,
Procurement,
Construction,
Installation &
Commissioning (EPCIC) contractor
In-house marine support
capabilities
EPCIC solutions closely integrated withsupply of support vessels

Proxy to the Offshore Oil & Gas Industry
ExplorationExploration
• Seismic surveys• Drilling of potential oil wells
DevelopmentDevelopment
• Setting up of production platform• Assembly of FSOs, FPSOs & SPM buoys• Offshore pipelines installation
ProductionProduction
• Extracting oil and gas from fields• Storage of oil and gas in FSOs & FPSOs
PostPost--productionproduction
• Disconnecting components of production platform
Our services are relevant at each stage of an offshore oil & gas project
=

ExplorationExploration
ProductionProduction
PostPost--productionproduction
DevelopmentDevelopment
Services at each stage of an Offshore O&G Project
Offshore EPCIC ServicesMarine Services O&G Project Stage
• Installing mooring systems for FSOs or FPSOs
• Installing SPM buoys
• Laying offshore pipelines
• Launching jackets
• Installing jackets or topsides
• Maintaining and refurbishing SPM buoys and mooring systems
Charter offshore support vessels and/or offshore
logistics support to transport
equipment, components,
crew/personnel, food and fuel
(where applicable)
Contracts range from 3 to 6 months for all or part of the EPCIC components in a project
Varying periods for charter contracts & may
extend up to 1 year
RevenueRevenueStructureStructure
Industry Overview
ExplorationExploration
ProductionProduction
PostPost--productionproduction
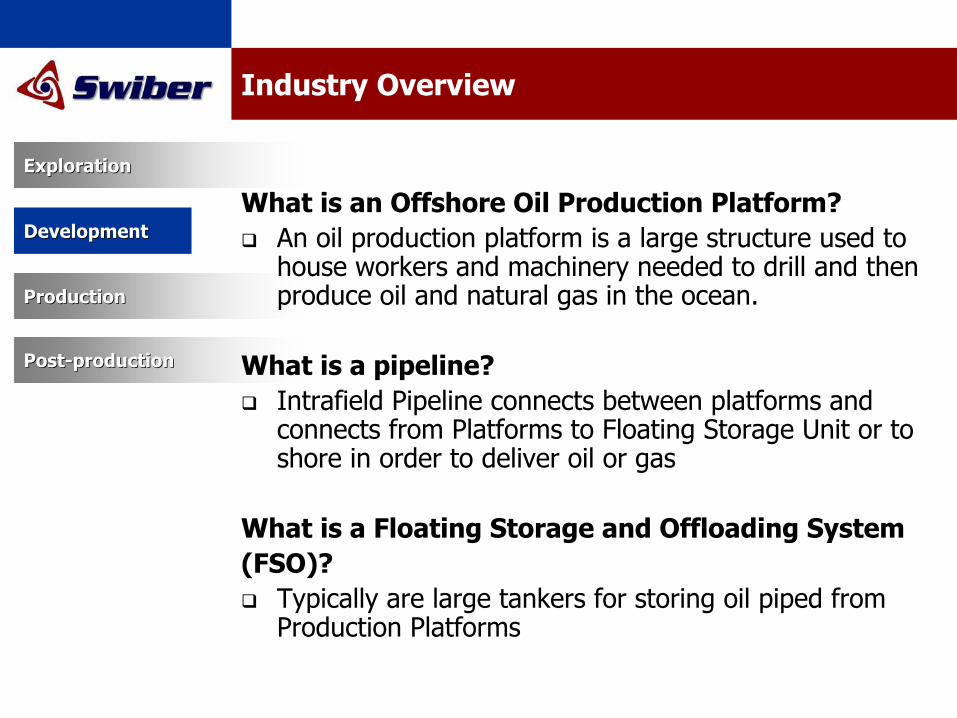
DevelopmentDevelopmentWhat is an Offshore Oil Production Platform?
An oil production platform is a large structure used to house workers and machinery needed to drill and then produce oil and natural gas in the ocean.
What is a pipeline?Intrafield Pipeline connects between platforms and connects from Platforms to Floating Storage Unit or to shore in order to deliver oil or gas
What is a Floating Storage and Offloading System (FSO)?
Typically are large tankers for storing oil piped from Production Platforms
Industry Overview
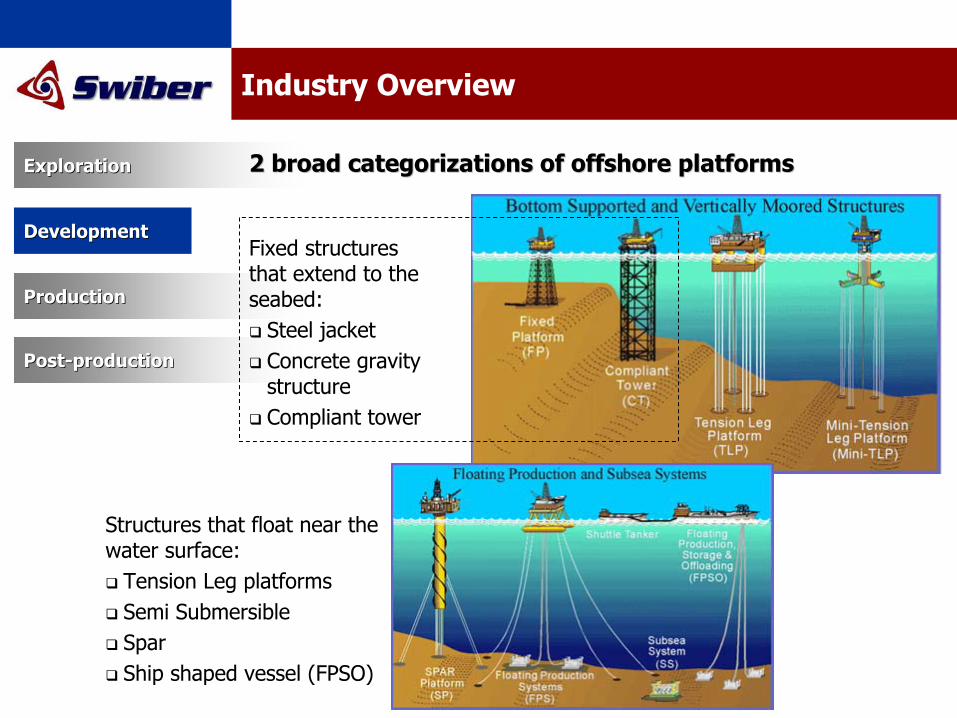
Structures that float near the water surface:
Tension Leg platformsSemi SubmersibleSparShip shaped vessel (FPSO)
ExplorationExploration
ProductionProduction
PostPost--productionproduction
DevelopmentDevelopment
2 broad categorizations of offshore platforms2 broad categorizations of offshore platforms
Fixed structures that extend to the seabed:
Steel jacketConcrete gravity structureCompliant tower

Industry Overview
A typical offshore platform has a deck structure containing a Main Deck, a Cellar Deck and a Helideck. The deck structure is supported by deck legs connected to the top of the piles. The piles extend from above the Mean Low Water through the seabed and into the soil
ExplorationExploration
ProductionProduction
PostPost--productionproduction
DevelopmentDevelopment
Jacketed PlatformJacketed Platform: A space framed structure with tubular members supported on piled foundations.
Underwater, the piles are contained inside the legs of a “jacket” structure which serves as bracing for the piles against lateral loads. The jacket also serves as a template for the initial driving of the piles95% of offshore platforms around the world are jacket supported.
ExplorationExploration
ProductionProduction
PostPost--productionproduction
DevelopmentDevelopment
Installation of Components
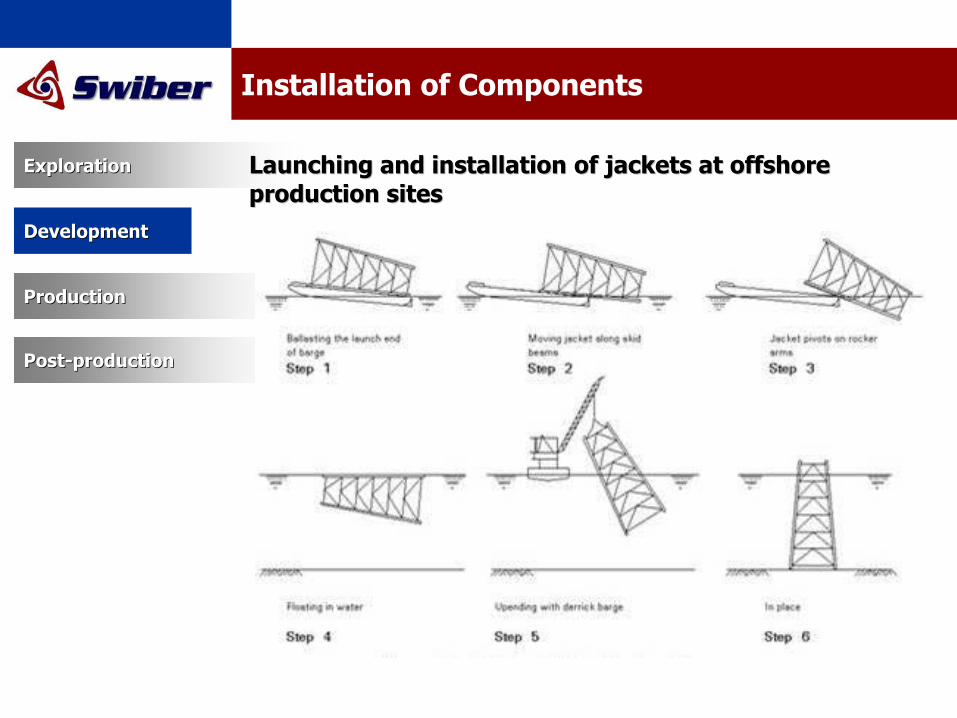
Launching and installationLaunching and installation of jackets at offshore of jackets at offshore production sitesproduction sites

ExplorationExploration
ProductionProduction
PostPost--productionproduction
DevelopmentDevelopment
Installation of Components
Launching and installationLaunching and installation of jackets at offshore of jackets at offshore production sitesproduction sites
Installation of Components
ExplorationExploration
ProductionProduction
PostPost--productionproduction
DevelopmentDevelopment
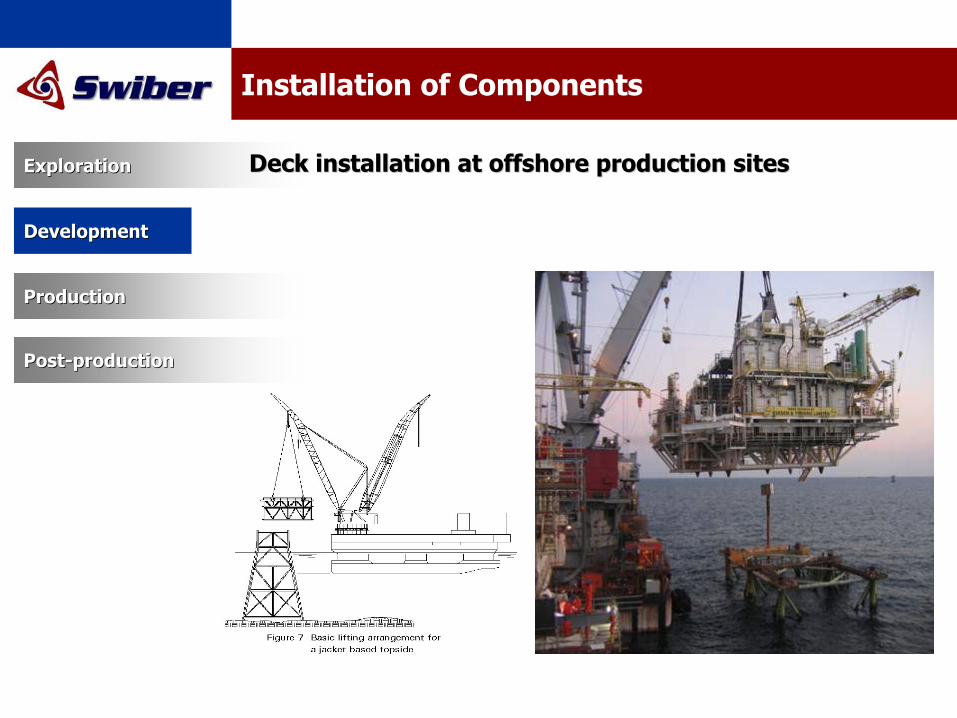
Deck installation at offshore production sitesDeck installation at offshore production sites
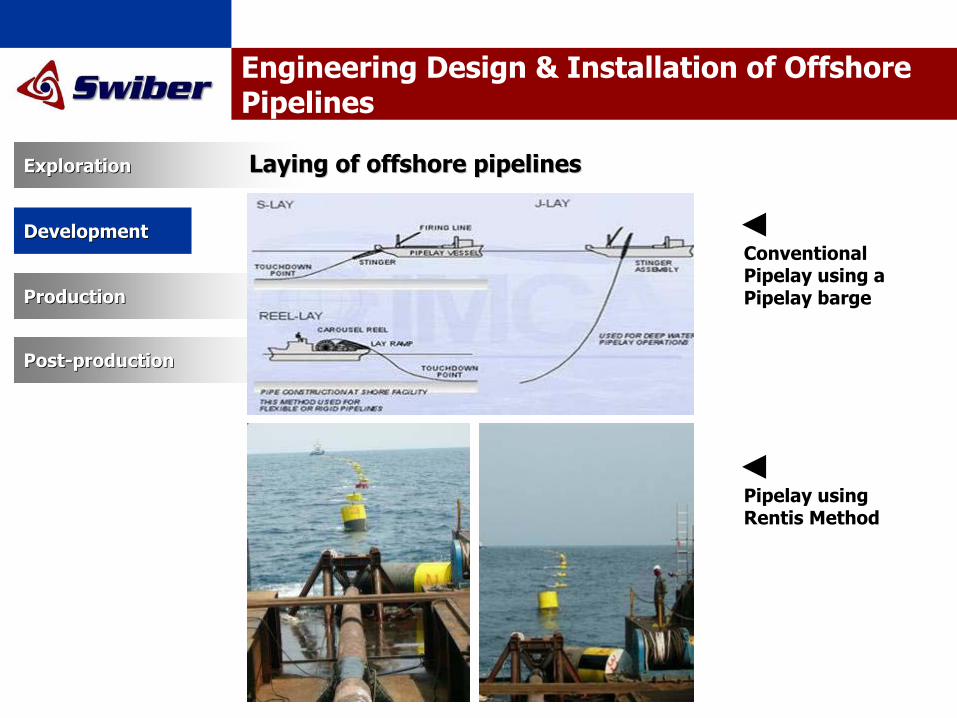
Engineering Design & Installation of Offshore Pipelines
Pipelay using Rentis Method
ExplorationExploration
ProductionProduction
PostPost--productionproduction
DevelopmentDevelopment
Laying of offshore pipelinesLaying of offshore pipelines
Conventional Pipelay using a Pipelay barge
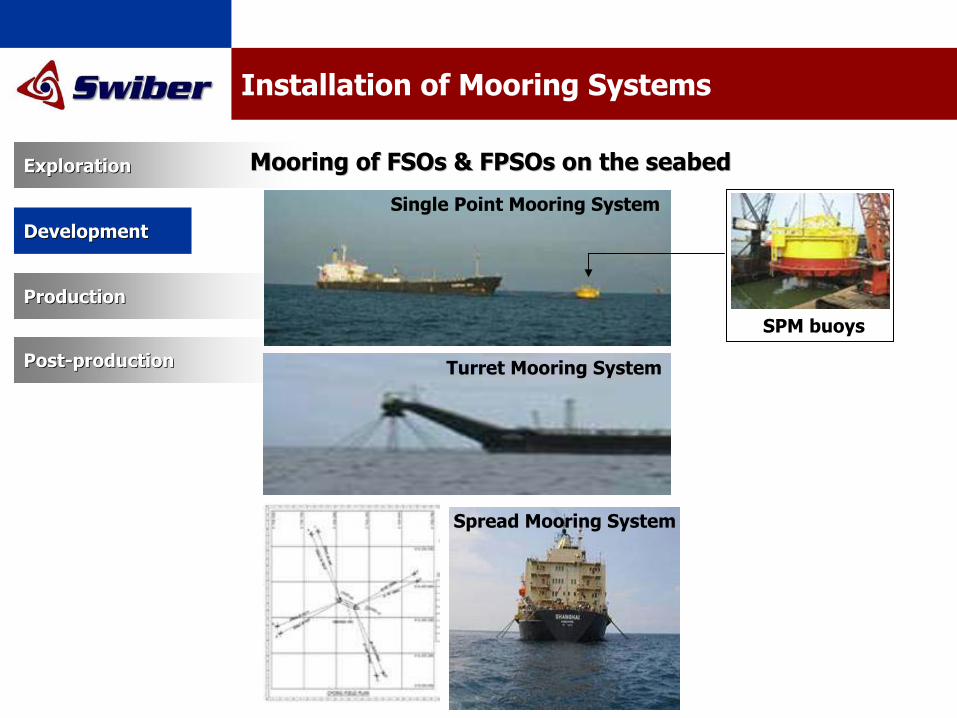
Installation of Mooring Systems
Spread Mooring System
ExplorationExploration
ProductionProduction
PostPost--productionproduction
DevelopmentDevelopment
Mooring of Mooring of FSOsFSOs & & FPSOsFPSOs on the seabedon the seabed
Turret Mooring System
Single Point Mooring System
SPM buoys

A niche service provider to the offshore oil and gas industry
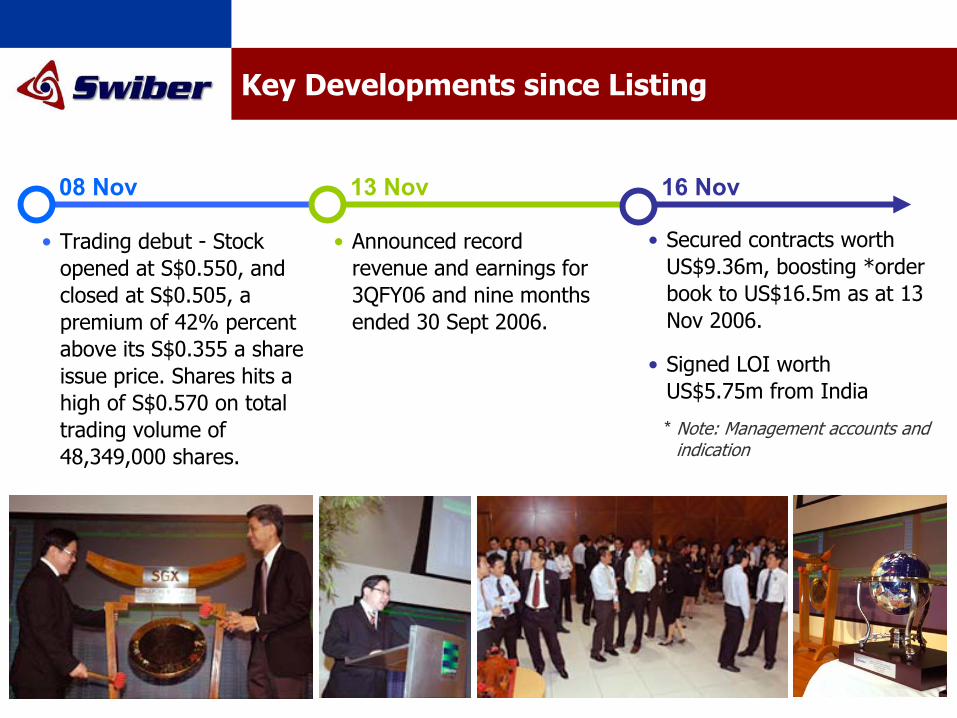
Key Developments since Listing
Key Developments since Listing
08 Nov 13 Nov 16 Nov
• Trading debut - Stock opened at S$0.550, and closed at S$0.505, a premium of 42% percent above its S$0.355 a share issue price. Shares hits a high of S$0.570 on total trading volume of 48,349,000 shares.
• Announced record revenue and earnings for 3QFY06 and nine months ended 30 Sept 2006.
• Secured contracts worth US$9.36m, boosting *order book to US$16.5m as at 13 Nov 2006.
• Signed LOI worth US$5.75m from India
* Note: Management accounts and indication
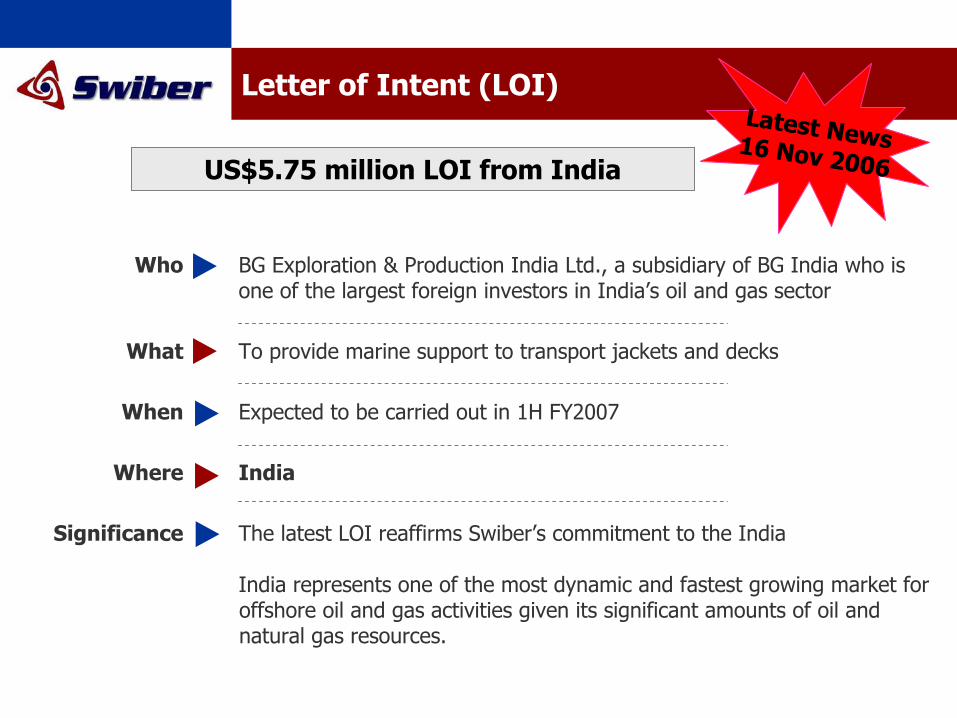
The latest LOI reaffirms Swiber’s commitment to the India
India represents one of the most dynamic and fastest growing market for offshore oil and gas activities given its significant amounts of oil and natural gas resources.
Significance
IndiaWhere
Expected to be carried out in 1H FY2007When
To provide marine support to transport jackets and decksWhat
BG Exploration & Production India Ltd., a subsidiary of BG India who is one of the largest foreign investors in India’s oil and gas sector
Who
US$5.75 million LOI from India
Latest News16 Nov 2006
Letter of Intent (LOI)
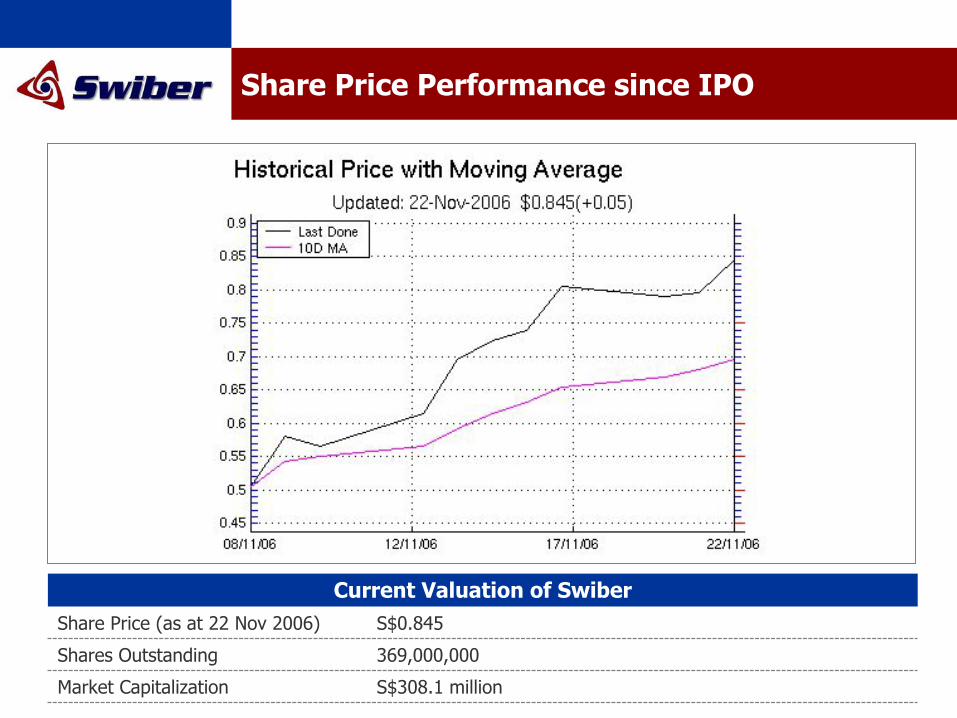
Share Price Performance since IPO
S$308.1 millionMarket Capitalization
369,000,000Shares Outstanding
Current Valuation of SwiberS$0.845Share Price (as at 22 Nov 2006)
A niche service provider to the offshore oil and gas industry
Financial Performance

Revenue
0
5
10
15
20
25
30
35
40
45
FY2003 FY2004 FY2005 9 mths FY05 9 mths FY06
US
$'m
15.47
9.60
18.40
12.3
43.2
250%
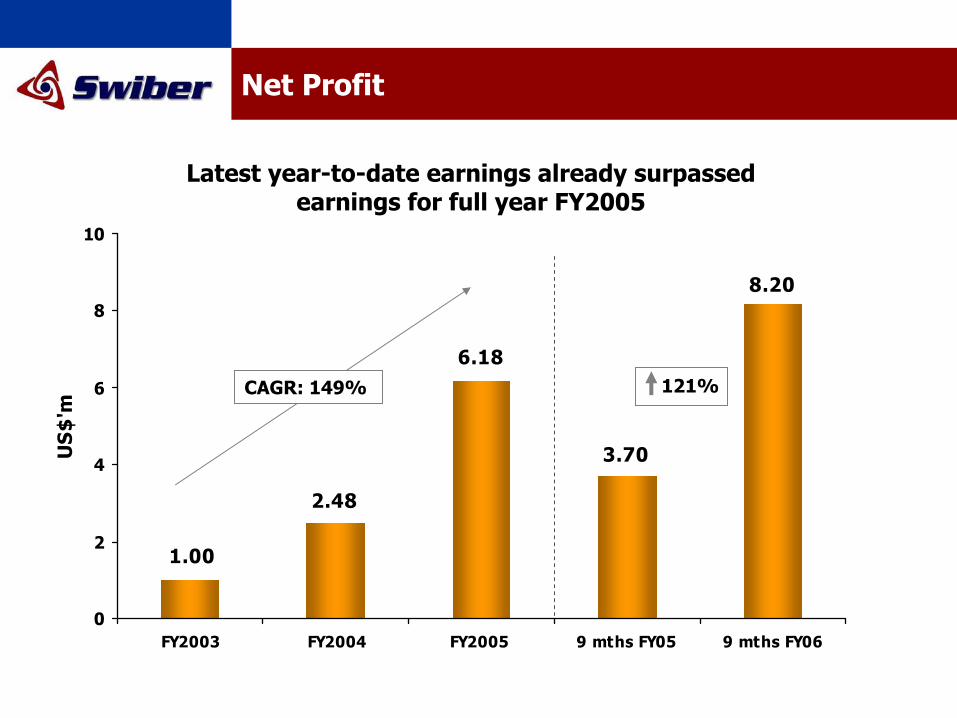
Net Profit
8.20
3.70
6.18
1.00
2.48
0
2
4
6
8
10
FY2003 FY2004 FY2005 9 mths FY05 9 mths FY06
US
$'m
CAGR: 149% 121%
Latest year-to-date earnings already surpassed earnings for full year FY2005

Key Financial Highlights for 3Q and 9 months ended 30 September 2006
+120.63.597.93+301.31.335.33Net Profit before MI
+67.21.803.01EPS (US cents)
+124.83.658.22+310.31.375.62Net Profit
+130.33.979.15+313.91.476.09Profit Before Tax
+124.44.7310.61+352.11.506.80Gross Profit
+250.312.343.19+748.43.4529.25Revenue
Change (%)
3QFY05 (9M)
3QFY06 (9M)
Change (%)
3QFY05 (3M)
3QFY06 (3M)US$’m
Record revenue and profits
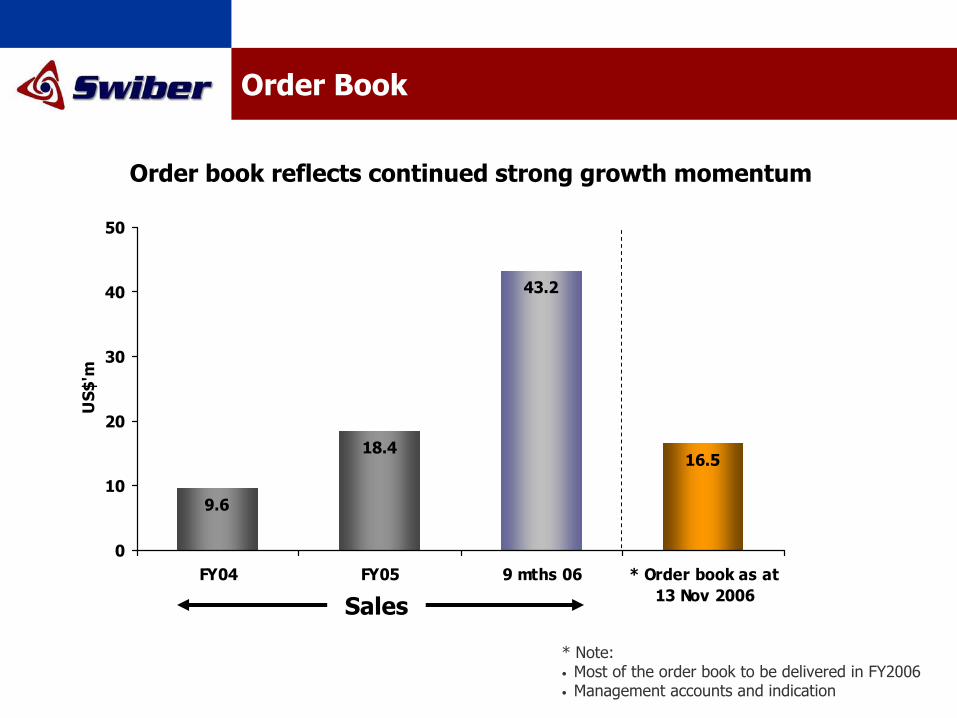
43.2
9.6
18.416.5
0
10
20
30
40
50
FY04 FY05 9 mths 06 * Order book as at13 Nov 2006
US$
'mOrder Book
Order book reflects continued strong growth momentum
Sales
* Note:• Most of the order book to be delivered in FY2006• Management accounts and indication
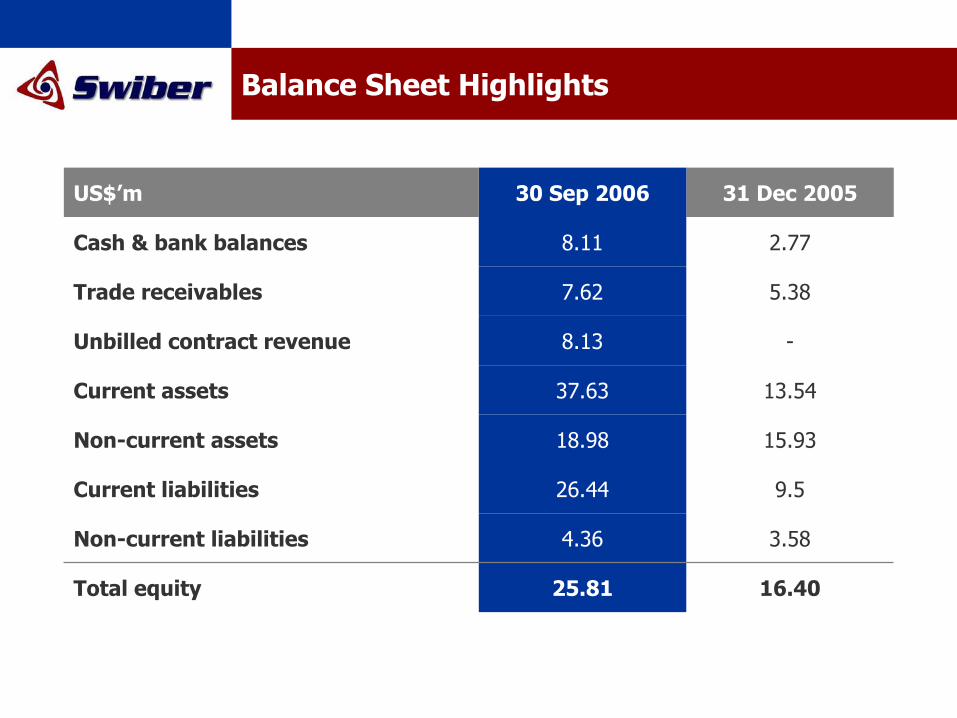
Balance Sheet Highlights
16.4025.81Total equity
3.584.36Non-current liabilities
15.9318.98Non-current assets
9.526.44Current liabilities
13.5437.63Current assets
-8.13Unbilled contract revenue
5.387.62Trade receivables
2.778.11Cash & bank balances
31 Dec 200530 Sep 2006US$’m
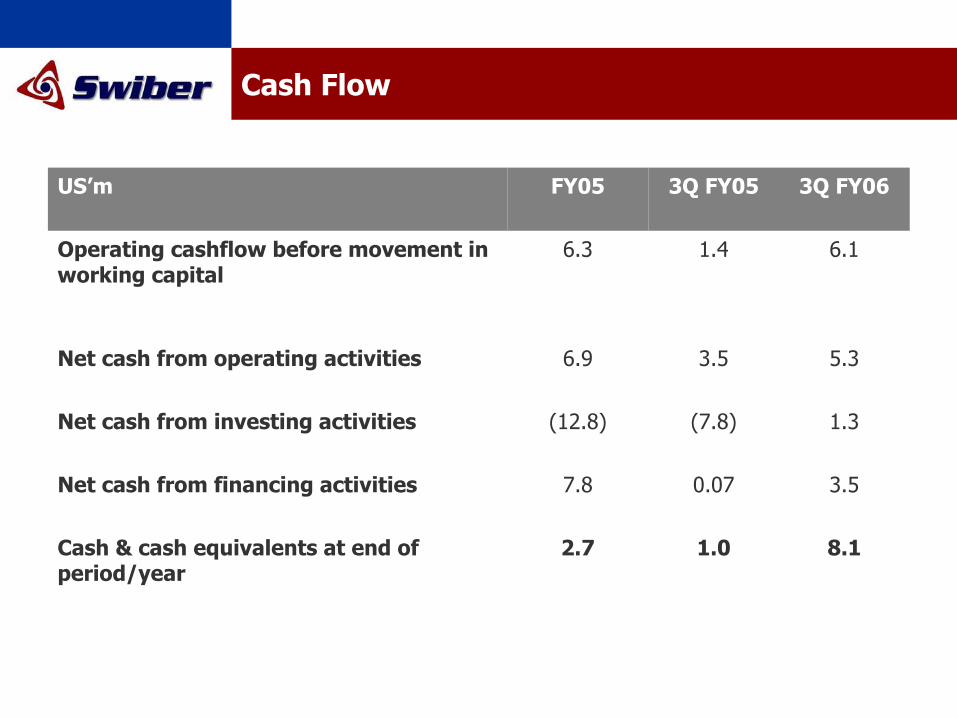
Cash Flow
1.0
0.07
(7.8)
3.5
1.4
3Q FY05
8.1
3.5
1.3
5.3
6.1
3Q FY06
2.7
7.8
(12.8)
6.9
6.3
FY05
Operating cashflow before movement in working capital
Net cash from operating activities
Cash & cash equivalents at end of period/year
Net cash from financing activities
Net cash from investing activities
US’m
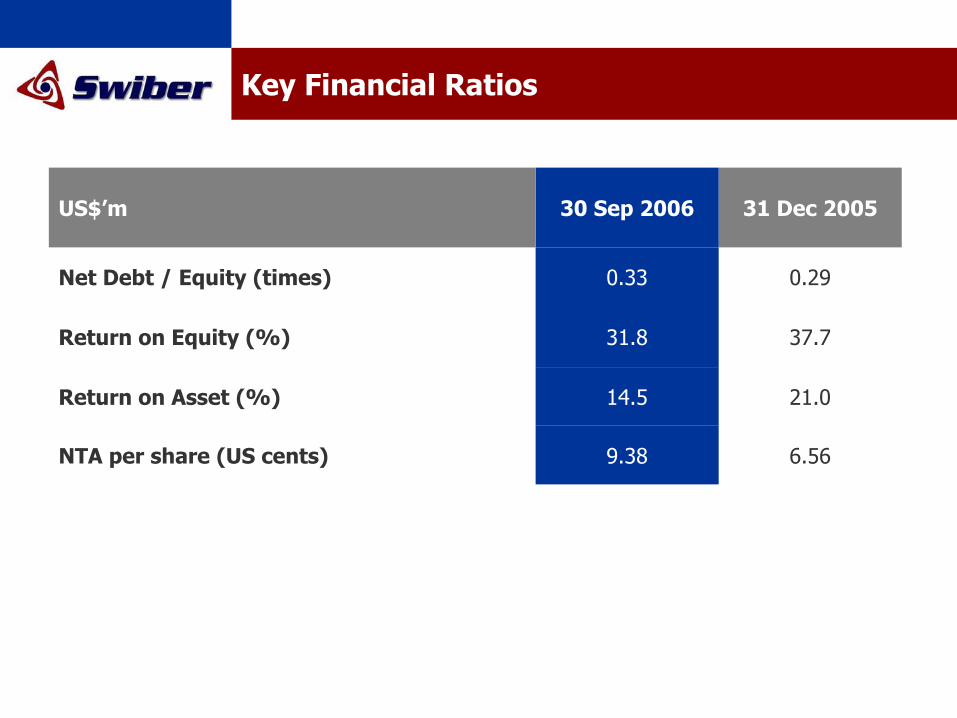
Key Financial Ratios
6.569.38NTA per share (US cents)
21.014.5Return on Asset (%)
37.731.8Return on Equity (%)
0.290.33Net Debt / Equity (times)
31 Dec 200530 Sep 2006US$’m

A niche service provider to the offshore oil and gas industry
What’s Next
- Prospects -
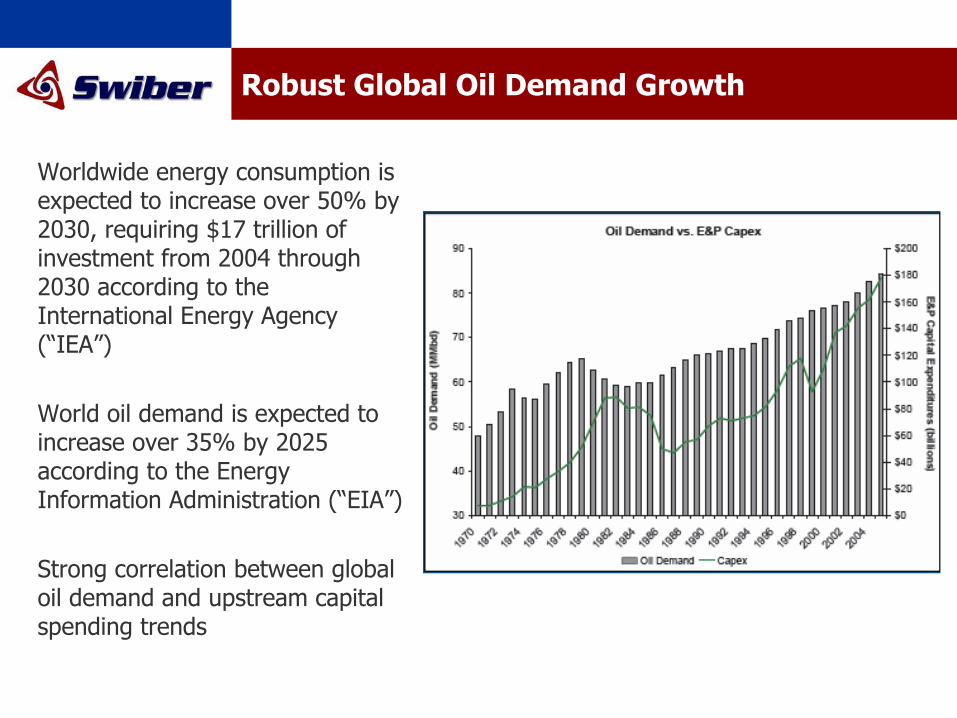
Robust Global Oil Demand Growth
Worldwide energy consumption is expected to increase over 50% by 2030, requiring $17 trillion of investment from 2004 through 2030 according to the International Energy Agency (“IEA”)
World oil demand is expected to increase over 35% by 2025 according to the Energy Information Administration (“EIA”)
Strong correlation between global oil demand and upstream capital spending trends

World Oil Production (Million Barrels per day)

Growing Offshore Construction Trends
Recent market research“Daily offshore oil and gas production, currently standing at around 43 MMboe, is forecast to grow to 53 MMboe in 2010 and drive industry annual expenditure from $193bn in 2006 to $248 bn by 2010”
- Douglas-Westwood
“A raft of new deepwater facilities and facility expenditure that averages over $3bn per annum will continue”
“In value terms the fixed platform market is still a hugely significant one with annual expenditure in 2004 of $6.7bn, much of which related to local fabrication”
“Not only is the [pipeline] expenditure over the next five years predicted to be higher that that of the previous five, but the make-up of projects is more diverse and the geographical split even more so”
- Infield Systems
Source : Mc Dermott presentation 31 May 2006
Demand for Swiber EPCIC services is driven by capital expenditures of offshore operators

A niche service provider to the offshore oil and gas industry
What’s Next
- Future Plans -

Main Growth Drivers Going Forward
Expand Expand Resources Resources
Expand existing spread of vessels to include vessels Expand existing spread of vessels to include vessels commonly required for offshore EPCIC operationscommonly required for offshore EPCIC operations
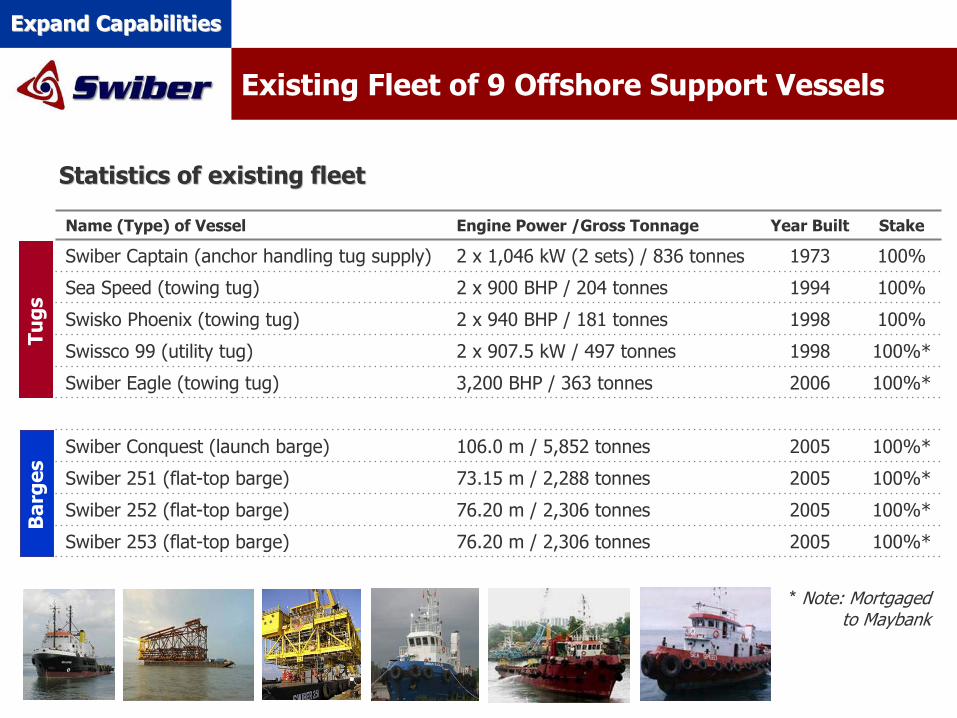
Existing Fleet of 9 Offshore Support Vessels
Expand CapabilitiesExpand Capabilities
Statistics of existing fleetStatistics of existing fleet
100%*200576.20 m / 2,306 tonnesSwiber 253 (flat-top barge)
2005
2005
2005
2006
1998
1998
1994
1973
Year Built
100%*
100%*
100%*
100%*
100%*
100%
100%
100%
Stake
76.20 m / 2,306 tonnesSwiber 252 (flat-top barge)
73.15 m / 2,288 tonnesSwiber 251 (flat-top barge)
106.0 m / 5,852 tonnesSwiber Conquest (launch barge)
3,200 BHP / 363 tonnesSwiber Eagle (towing tug)
2 x 907.5 kW / 497 tonnesSwissco 99 (utility tug)
2 x 940 BHP / 181 tonnesSwisko Phoenix (towing tug)
2 x 900 BHP / 204 tonnesSea Speed (towing tug)
2 x 1,046 kW (2 sets) / 836 tonnesSwiber Captain (anchor handling tug supply)
Engine Power /Gross TonnageName (Type) of Vessel
Tugs
Bar
ges
* Note: Mortgaged to Maybank

Completion Dates of our New Vessels
Sep 06
Oct 06
120 feetFlat-top barge
66.60m / 1,400 tonnes
Jack-up barge
85.34m / 2,946 tonnes
Flat-top barge
76.20m / 2,306 tonnes
Flat-top barge
2 x 1,600 BHPTowing tug
2 x 1,600 BHPTowing tug
2 x 1,920 kWAnchor handling tug
2 x 2,000 BHPAnchor handling tug
4,000 BHPAnchor handling tug
Jul 07
Jun 07
May 07
Apr 07
Mar 07
Feb 07
Jan 07
Dec 06
Nov 06
Engine Power/ Gross Tonnage
Type of Vessel
Tugs
Bar
ges
New vessels driving growthNew vessels driving growth
Expand CapabilitiesExpand Capabilities
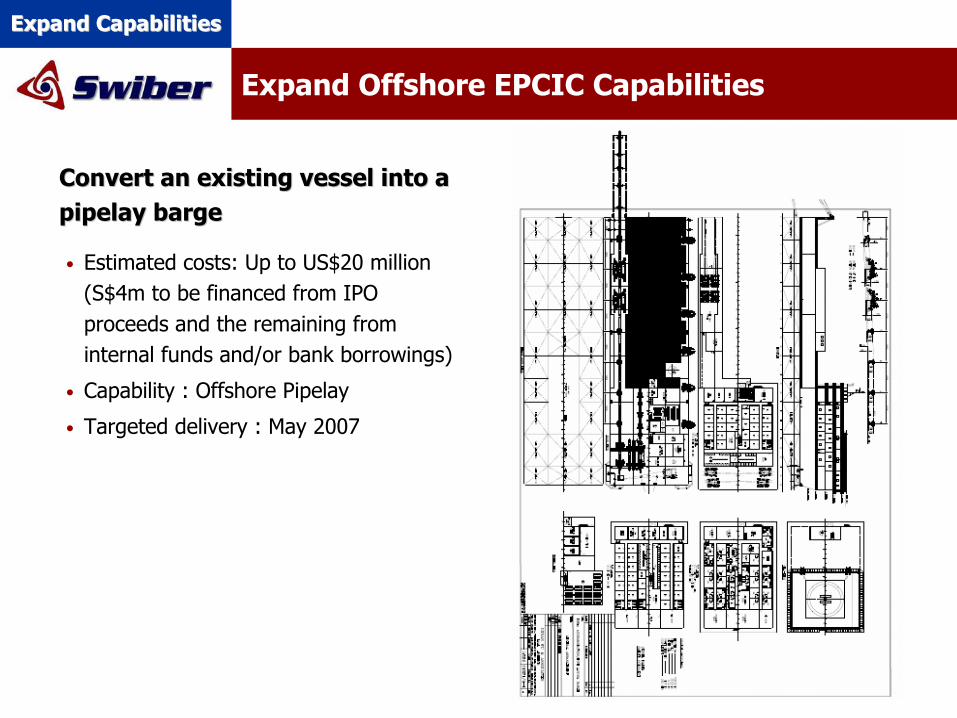
Expand Offshore EPCIC Capabilities
Convert an existing vessel into a Convert an existing vessel into a pipelaypipelay bargebarge
Expand CapabilitiesExpand Capabilities
• Estimated costs: Up to US$20 million (S$4m to be financed from IPO proceeds and the remaining from internal funds and/or bank borrowings)
• Capability : Offshore Pipelay
• Targeted delivery : May 2007
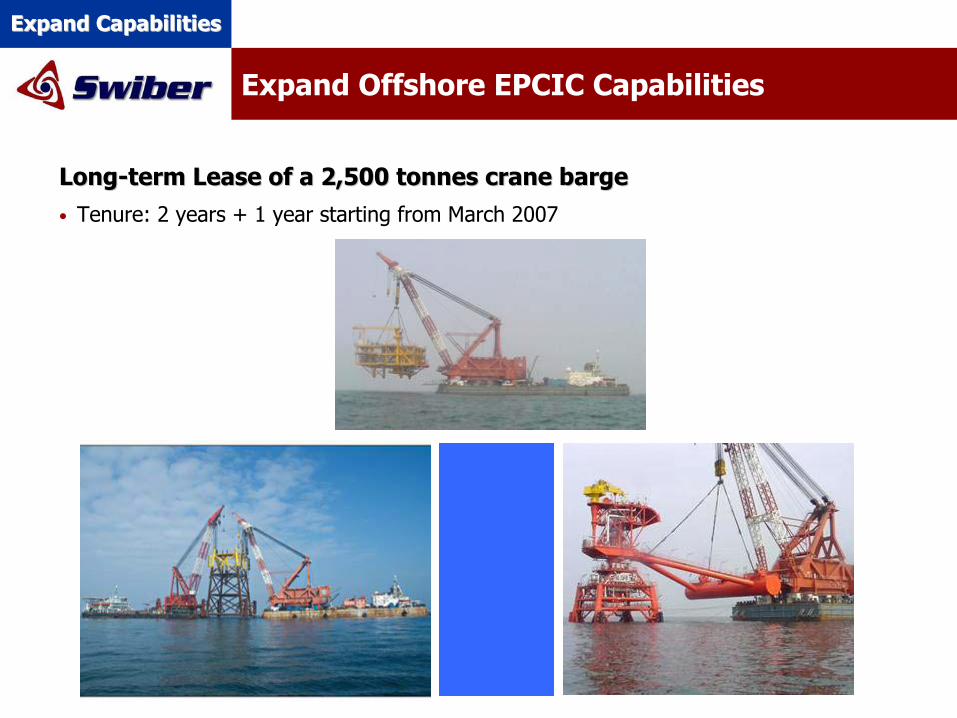
Expand Offshore EPCIC Capabilities
LongLong--term Lease of a 2,500 term Lease of a 2,500 tonnestonnes crane bargecrane barge• Tenure: 2 years + 1 year starting from March 2007
Expand CapabilitiesExpand Capabilities
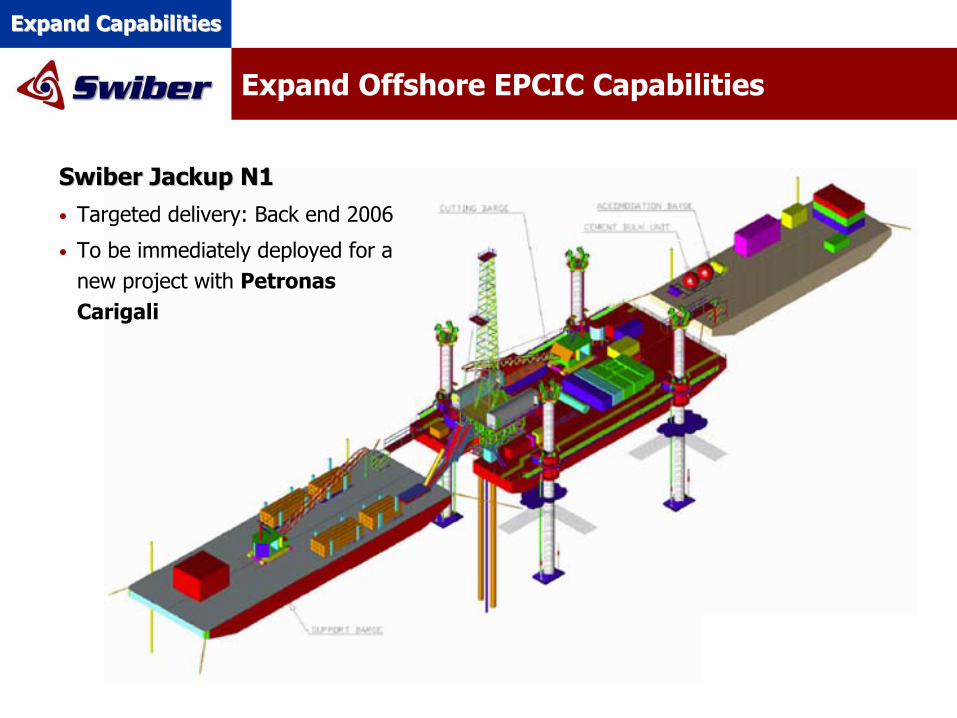
Expand Offshore EPCIC Capabilities
Swiber Swiber JackupJackup N1N1• Targeted delivery: Back end 2006
• To be immediately deployed for a new project with Petronas Carigali
Expand CapabilitiesExpand Capabilities
Main Growth Drivers Going Forward
Expand Expand Resources Resources
Expand existing spread of vessels to include vessels Expand existing spread of vessels to include vessels commonly required for offshore EPCIC operationscommonly required for offshore EPCIC operations
MarketMarketDevelopmentDevelopment Develop the India marketDevelop the India market
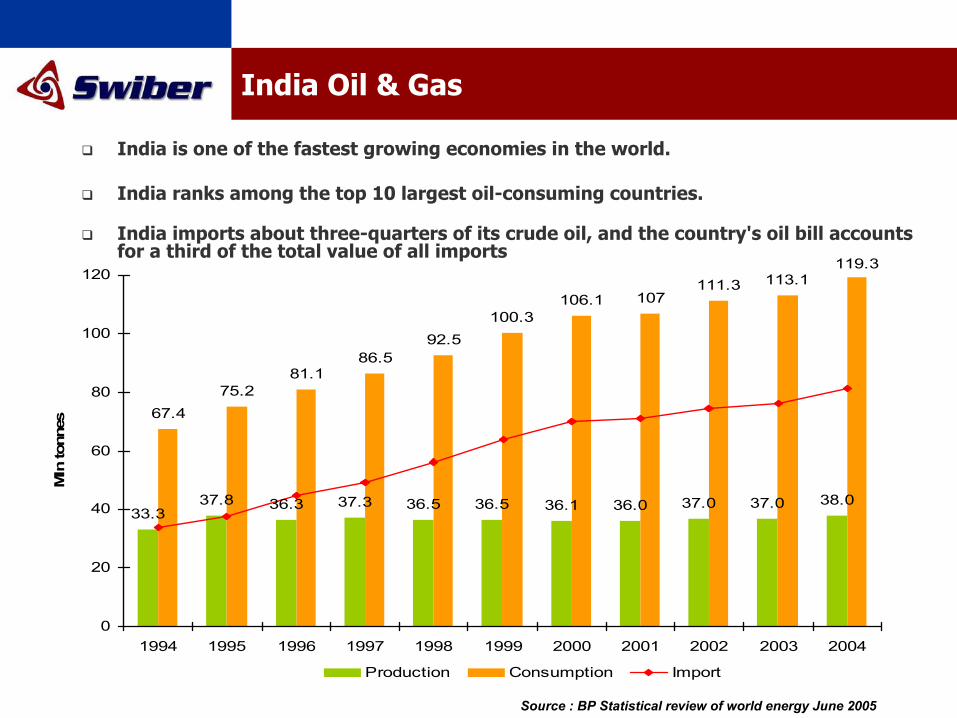
India Oil & Gas
India is one of the fastest growing economies in the world.
India ranks among the top 10 largest oil-consuming countries.
India imports about three-quarters of its crude oil, and the country's oil bill accounts for a third of the total value of all imports
33.337.8 36.3 37.3 36.5 36.5 36.1 36.0 37.0 37.0 38.0
67.475.2
81.186.5
92.5100.3
106.1 107111.3 113.1
119.3
0
20
40
60
80
100
120
1994 1995 1996 1997 1998 1999 2000 2001 2002 2003 2004
Mln
tonn
es
Production Consumption Import
Source : BP Statistical review of world energy June 2005
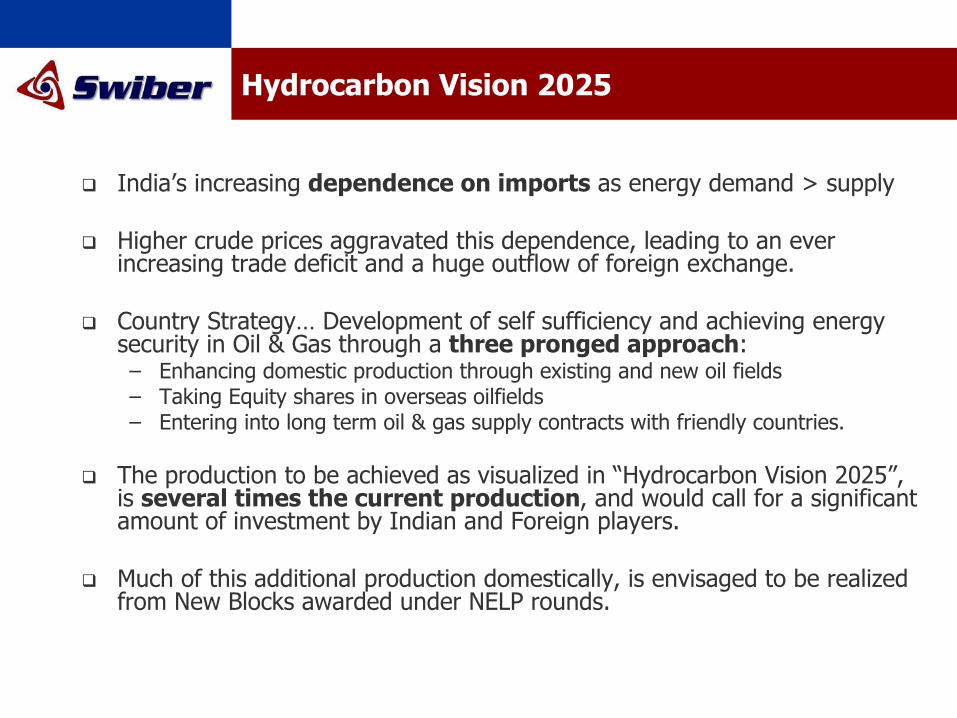
Hydrocarbon Vision 2025
India’s increasing dependence on imports as energy demand > supply
Higher crude prices aggravated this dependence, leading to an ever increasing trade deficit and a huge outflow of foreign exchange.
Country Strategy… Development of self sufficiency and achieving energy security in Oil & Gas through a three pronged approach:– Enhancing domestic production through existing and new oil fields– Taking Equity shares in overseas oilfields– Entering into long term oil & gas supply contracts with friendly countries.
The production to be achieved as visualized in “Hydrocarbon Vision 2025”, is several times the current production, and would call for a significant amount of investment by Indian and Foreign players.
Much of this additional production domestically, is envisaged to be realized from New Blocks awarded under NELP rounds.
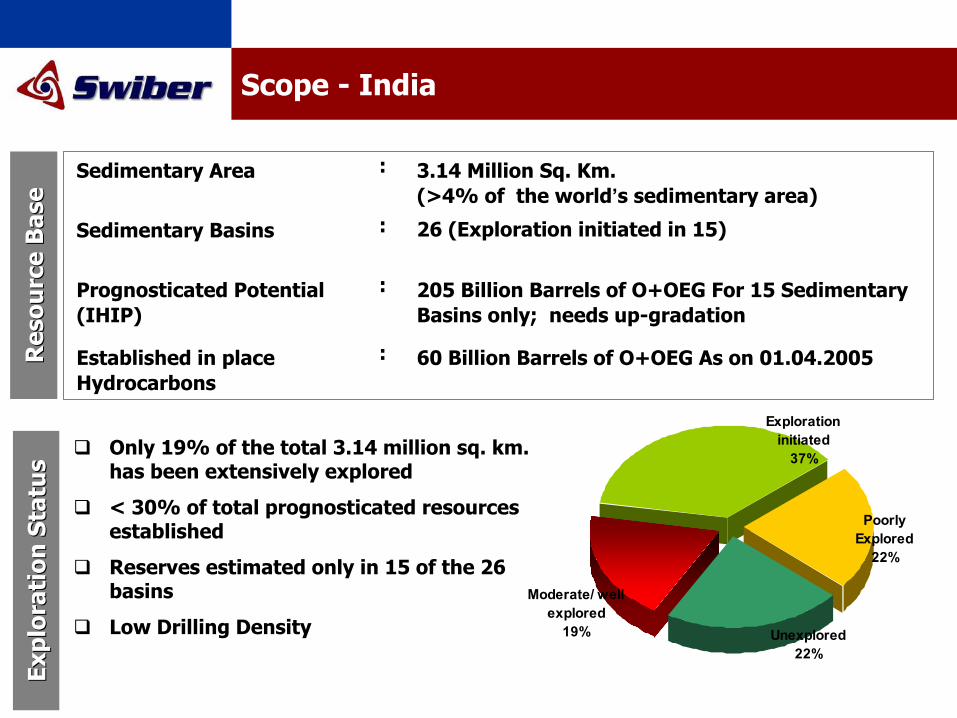
Scope - India
Res
ourc
e B
ase
Res
ourc
e B
ase
60 Billion Barrels of O+OEG As on 01.04.2005:Established in place Hydrocarbons
205 Billion Barrels of O+OEG For 15 Sedimentary Basins only; needs up-gradation
:Prognosticated Potential (IHIP)
26 (Exploration initiated in 15):Sedimentary Basins
3.14 Million Sq. Km. (>4% of the world’s sedimentary area)
:Sedimentary Area
Only 19% of the total 3.14 million sq. km. has been extensively explored
< 30% of total prognosticated resources established
Reserves estimated only in 15 of the 26 basins
Low Drilling Density Unexplored22%
Exploration initiated
37%
Poorly Explored
22%
Moderate/ well explored
19%
Expl
orat
ion
Sta
tus
Expl
orat
ion
Sta
tus
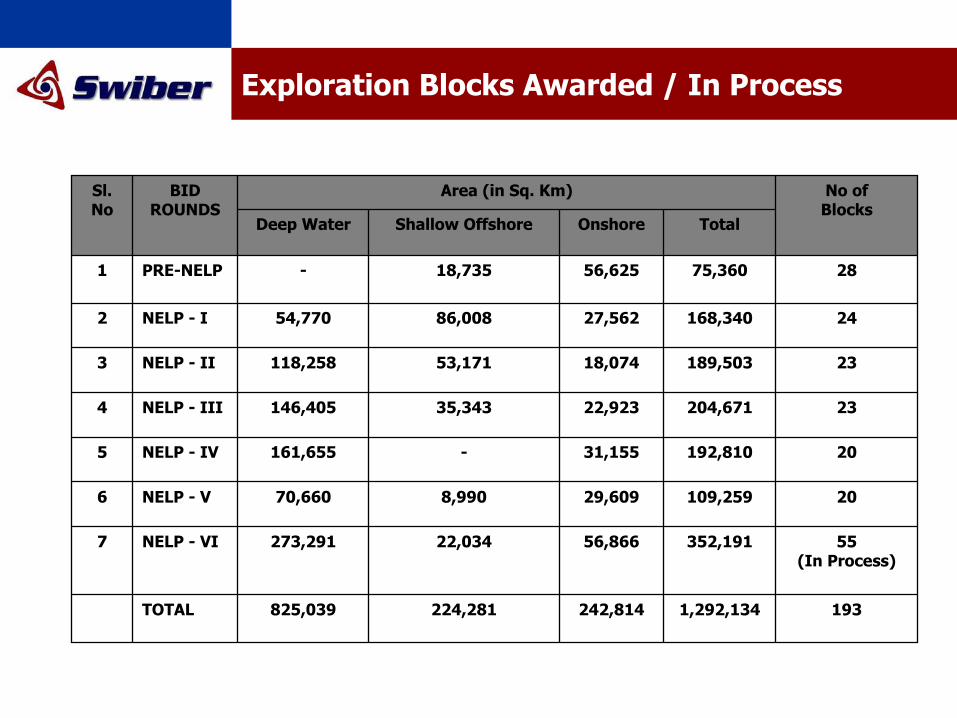
Exploration Blocks Awarded / In Process
1931,292,134242,814224,281825,039TOTAL
28 75,36056,62518,735-PRE-NELP1
55(In Process)
352,19156,86622,034273,291NELP - VI7
20109,25929,6098,99070,660NELP - V6
20192,81031,155-161,655NELP - IV5
23204,67122,92335,343146,405NELP - III4
23189,50318,07453,171118,258NELP - II3
24168,34027,56286,00854,770NELP - I2
TotalOnshoreShallow OffshoreDeep Water
No of Blocks
Area (in Sq. Km)BID ROUNDS
Sl. No
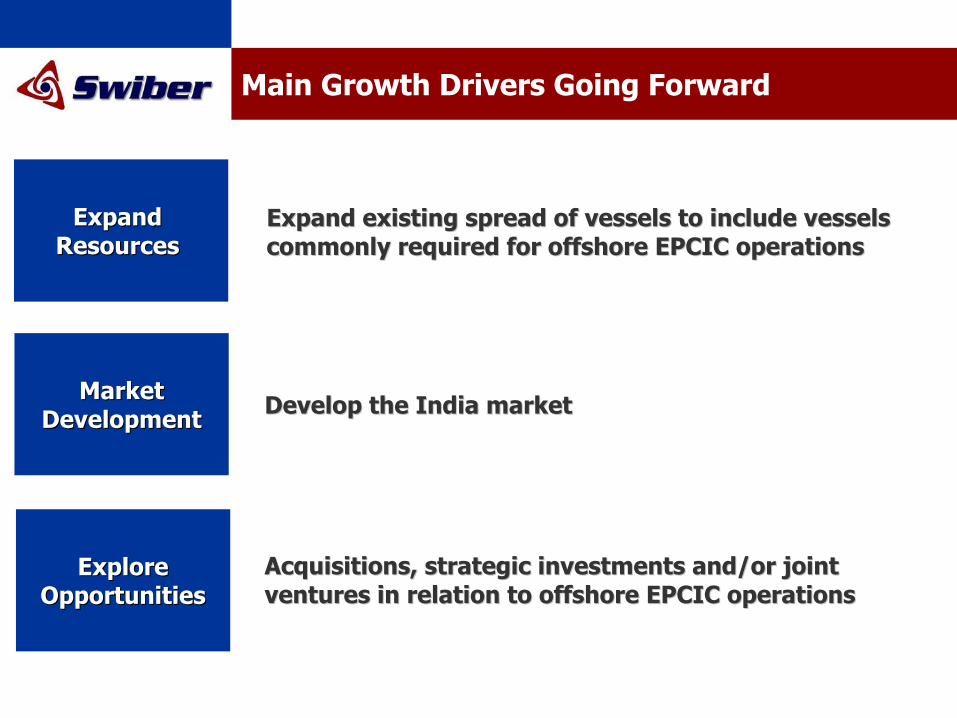
Main Growth Drivers Going Forward
Expand Expand Resources Resources
MarketMarketDevelopmentDevelopment
Expand existing spread of vessels to include vessels Expand existing spread of vessels to include vessels commonly required for offshore EPCIC operationscommonly required for offshore EPCIC operations
Develop the India marketDevelop the India market
ExploreExploreOpportunitiesOpportunities
Acquisitions, strategic investments and/or joint Acquisitions, strategic investments and/or joint ventures in relation to offshore EPCIC operationsventures in relation to offshore EPCIC operations
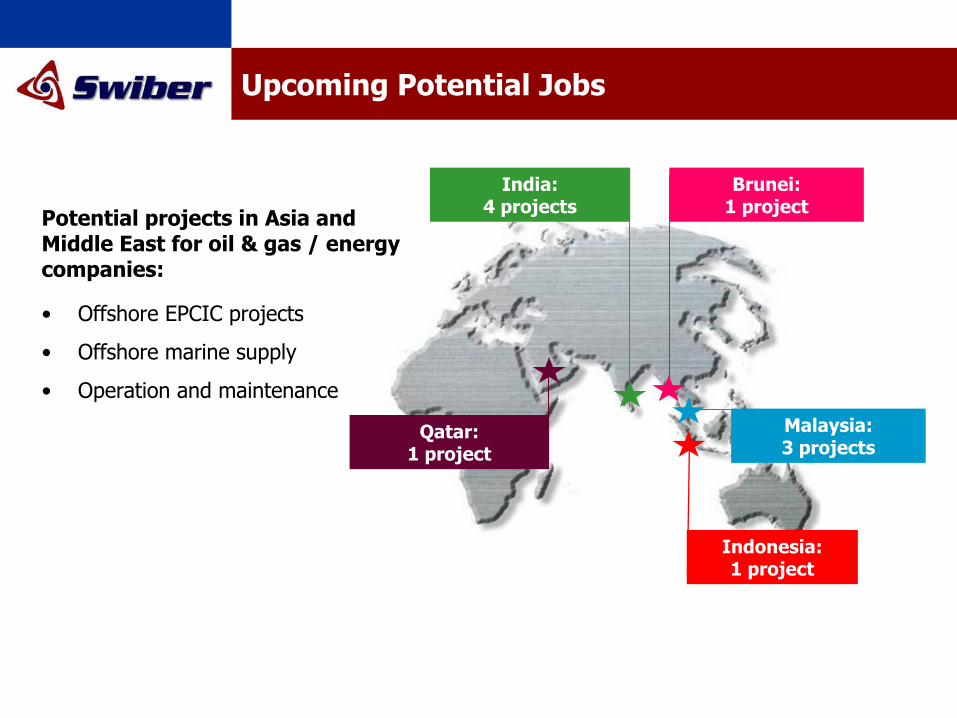
Upcoming Potential Jobs
Indonesia: 1 project
Brunei: 1 project
India: 4 projects
Malaysia:3 projects
Qatar: 1 project
Potential projects in Asia and Middle East for oil & gas / energy companies:
• Offshore EPCIC projects
• Offshore marine supply
• Operation and maintenance
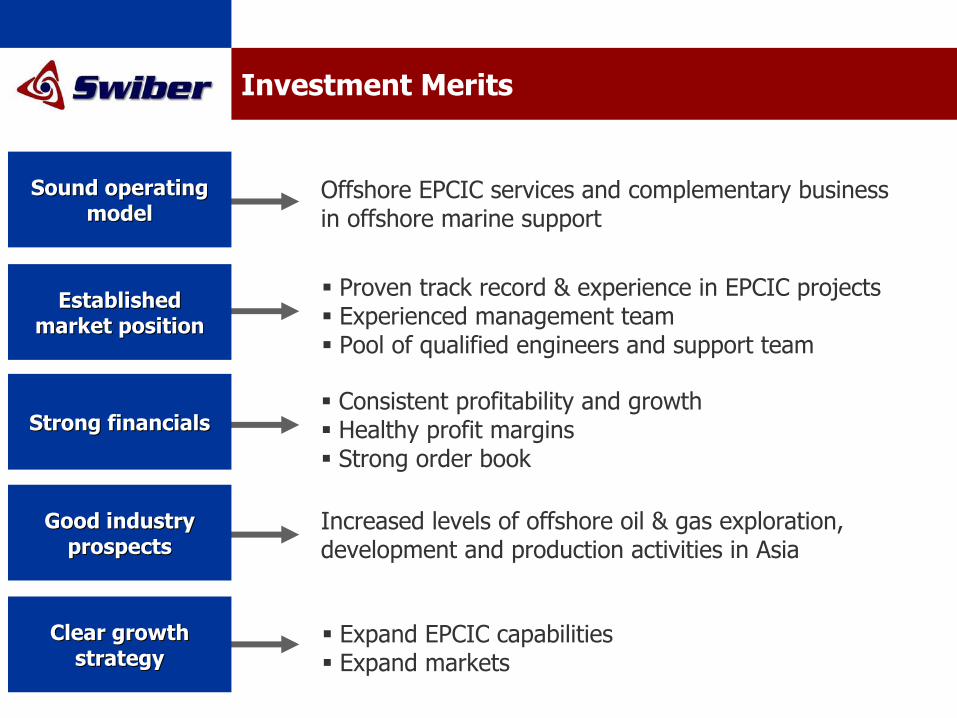
Investment Merits
Sound operating Sound operating modelmodel
Established Established market positionmarket position
Strong financialsStrong financials
Good industry Good industry prospectsprospects
Clear growth Clear growth strategystrategy
Offshore EPCIC services and complementary business in offshore marine support
Proven track record & experience in EPCIC projectsExperienced management teamPool of qualified engineers and support team
Consistent profitability and growthHealthy profit marginsStrong order book
Increased levels of offshore oil & gas exploration, development and production activities in Asia
Expand EPCIC capabilitiesExpand markets
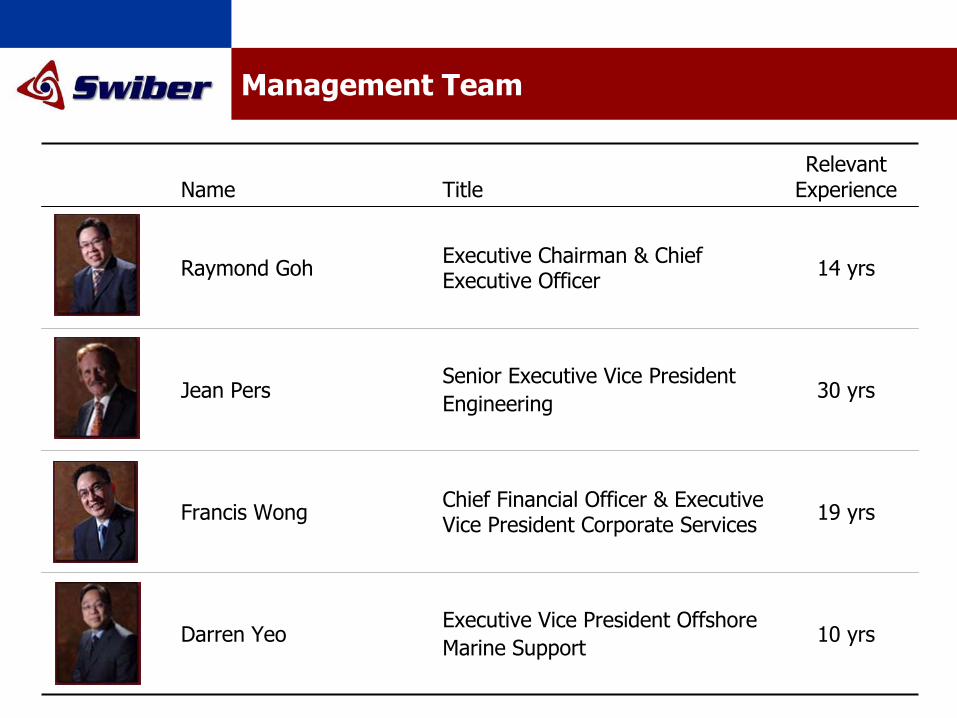
Management Team
19 yrsChief Financial Officer & Executive Vice President Corporate Services Francis Wong
10 yrsExecutive Vice President Offshore Marine Support
Darren Yeo
30 yrsSenior Executive Vice President Engineering
Jean Pers
14 yrsExecutive Chairman & Chief Executive Officer Raymond Goh
Relevant ExperienceTitleName
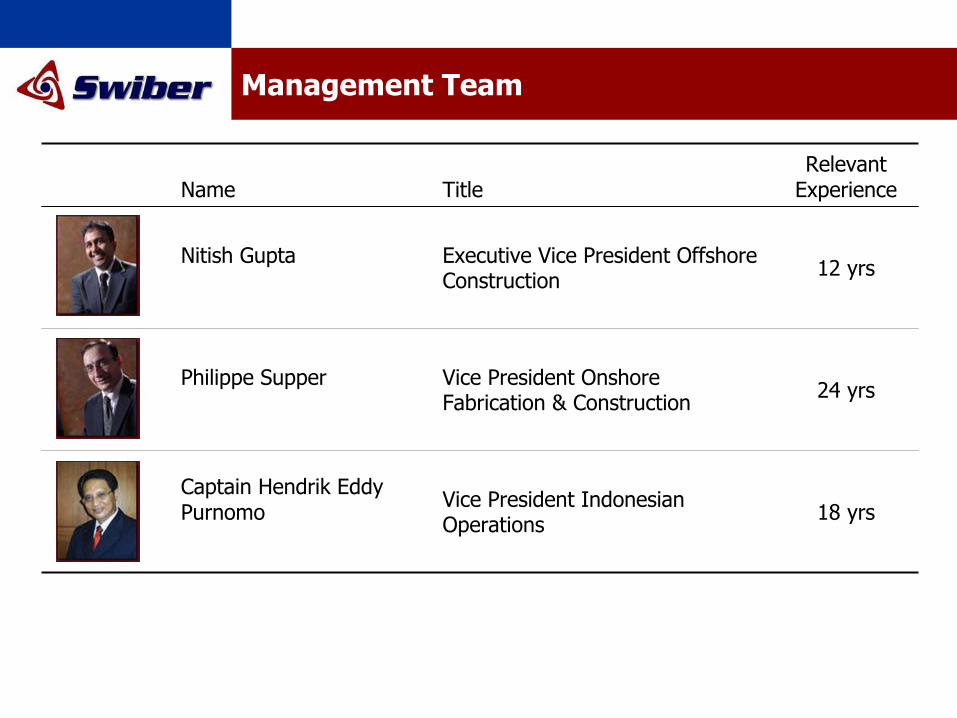
Management Team
18 yrsVice President Indonesian Operations
Captain Hendrik Eddy Purnomo
24 yrsVice President Onshore Fabrication & Construction
Philippe Supper
12 yrsExecutive Vice President Offshore Construction
Nitish Gupta
Relevant ExperienceTitleName

A niche service provider to the offshore oil and gas industry
Thank You
Questions & Answers