
Swedish Interconnectors
21
SVENSKA KRAFTNÄT Ärendenr: 2020/226. Version: 1.0 Swedish Interconnectors COMP Case No 39351 Monitoring Report No 17
Transcript of Swedish Interconnectors

SVENSKAKRAFTNÄT
Ärendenr: 2020/226. Version: 1.0
Swedish Interconnectors
COMP Case No 39351
Monitoring Report No 17

IntroductionThis report is submitted to comply with section 5 (Monitoring provisions) of Svenska kraftnät's Commitments (26 January 2010) under Artide 9 of Coundl Regula- tion No. 1/2003 in connection with the European Commission investigation in Case COMP/39351 - Swedish Interconnectors. The Commitments were adopted and made binding by dedsion of the Commission on 14 April 2010. Regarding this, Svenska kraftnät would like to emphasize that that we are monitoring the develop- ment of the European legislation on the internal electricity market continuously and how it will reläte to our Commitment.
The development of the European legislation on the internal electridty market will have an impact on the management of the Swedish interconnectors, but the major impact is expected after the commitments expires. More specifically, the imple- mentation of the 70 % minimum capacity criterion and the Nordic capacity calcula- tion methodology according to CACM changes how the capacity will be allocated on the Swedish interconnectors.
The report is prepared in good faith and aims at providing any information the Commission may need in order to judge whether Svenska kraftnät is proceeding in accordance with the Commitments. Additional information can be provided to the Commission upon request.
In accordance with what was stated in last (sixteenth) monitoring report this seven- teenth monitoring report has been submitted by 14 June 2020 at the latest.
Svenska kraftnät confirms that the report does not contain any confidential information and may be freely distributed to third parties.

Table of Contents
1 Svenska kraftnäfs commitment......................................................................... 7
2 Period January 1 - April 19, 2020....................................................................... 7
2.1 Allocation oftrading capacity............................................................... 92.2 Comments on each interconnector...................................................... 12
2.2.1 SEi-FI, North Finland............................................................ 122.2.2 SE1-NO4, North Norway....................................................... 132.2.3 SE2-NO3, Central Norway.................................................... 132.2.4 SE2-NO4, North Norway....................................................... 132.2.5 SE3-DK1, Western Denmark................................................. 132.2.6 SE3-FI, Southeim Finland...................................................... 132.2.7 SE3-NO1, Southern Norway.................................................. 132.2.8 SE4-DE, Germany.................................................................. 142.2.9 SE4-DK2, Eastern Denmark.................................................. 142.2.10 SE4-PL, Poland....................................................................... 142.2.11 SE4-LT, Lithuania.................................................................. 14
Appendix A -Explanation of Attachments...............................................................15
Appendix B -January 1 - April 19, 2020................................................................... 18
i Svenska kraftnäPs commitmentAs committed, Svenska kraftnät has subdivided the Swedish part of the Nordic electricity market into several bidding zones and the Swedish Transmission System is operated on this basis since November l, 2011. Congestion in the Swedish Transmission System, with exception of Congestion in the West Coast Corridor, is gener- ally managed without limiting Trading Capacity on Interconnectors. This particu- larly evident in Table 3.
2 Period January i - April 19, 2020This section describes operational experience and measures regarding allocation of trading capacity in the period January l to April 19, 2020.
In the period, totally 2 639 hours, the main direction of the power flow was south- bound.
Table 1 below shows the average prices in Sweden and all neighbouring areas for the above mentioned period (excluding Germany and Poland). Table 2 summarises the number of hours where price differences occurred between the respective zones.
7

Table l. Average, maximum, and minimum prices for areas within Nord Pool.
Area Average Price Level
(EUR)
Maximum Price
(EUR)
Minimum Price
(EUR)
SEi 13-60 70.76 -0.20
SE2 13-60 70.76 -0.20
SE3 16.67 70.76 -0.20
SE4 18.73 70.76 -0.20
DKi 19.05 64.70 -55-77
DK2 21.19 70.76 -42.66
Fl 22.87 121.03 -0.20
NOi 13.27 32.04 1.24
NO3 13.50 31.76 1.04
NO4 13-50 31.76 1.04
LT 26.20 121.03 0.07
8
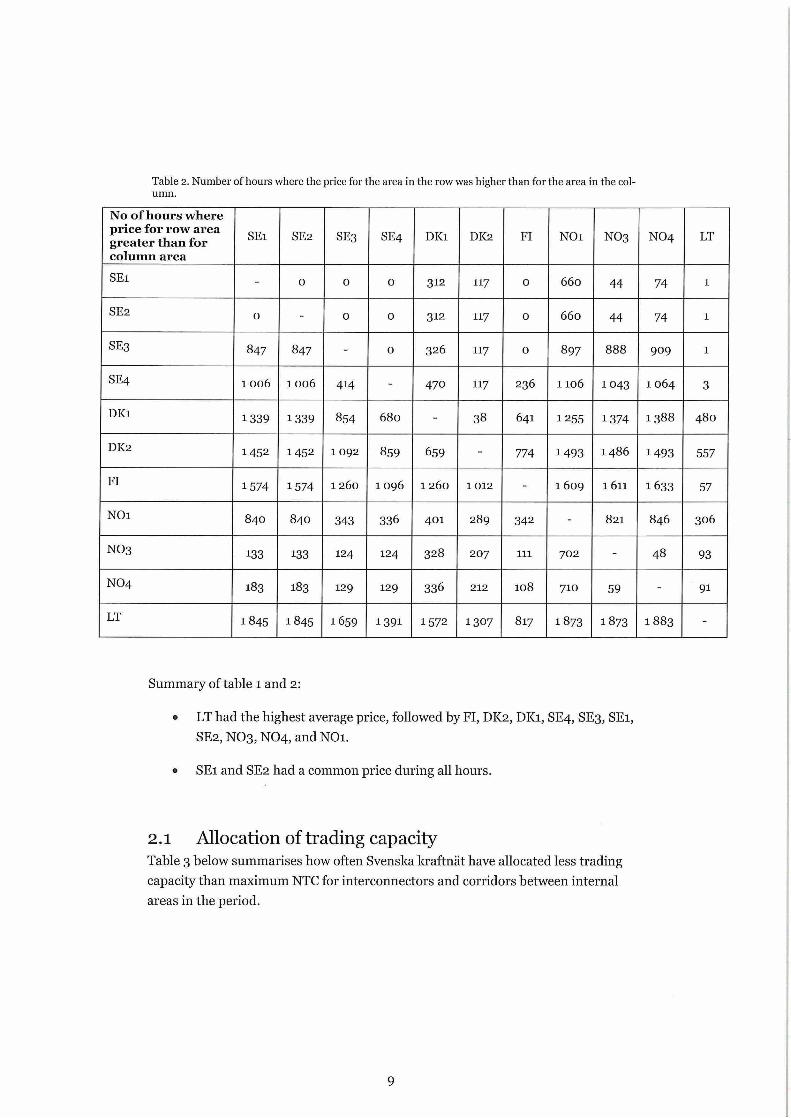
Table 2. Number of hours where the price for the area in the row was higher than for the area in the col- umn.
No of hours where price for row area greater than for column area
SEi SE2 se3 SE4 DKl DK2 FI NOl N03 NO4 LT
SEi - 0 0 O 312 117 0 660 44 74 1
SE2 0 - 0 0 312 117 0 660 44 74 1
se3 847 847 - 0 326 117 0 897 888 909 1
SE4 1006 1006 414 - 470 117 236 1106 1043 1064 3
DKl 1339 1339 854 680 - 38 641 1255 1374 1388 480
DI<2 1452 1452 1092 859 659 - 774 1493 1486 1493 557
Fl 1574 1574 1260 1096 1 260 1 012 - 1 609 1 611 1633 57
NOl 840 840 343 336 401 289 342 - 821 846 306
NO3 133 133 124 124 328 207 111 702 - 48 93
NO4 183 183 129 129 336 212 108 710 59 - 91
LT 1845 1845 1659 1391 1572 1307 817 1873 1873 1883 -
Summaiy of table 1 and 2:
• LT had the highest average price, followed by Fl, DK2, DKl, SE4, SE3, SEi, SE2, NO3, NO4, and NOl.
• SEi and SE2 had a common price during all hours.
2.1 Allocation of trading capacityTable 3 below summarises how often Svenska kraftnät have allocated less trading capacity than maximum NTC for interconnectors and corridors between internal areas in the period.
9
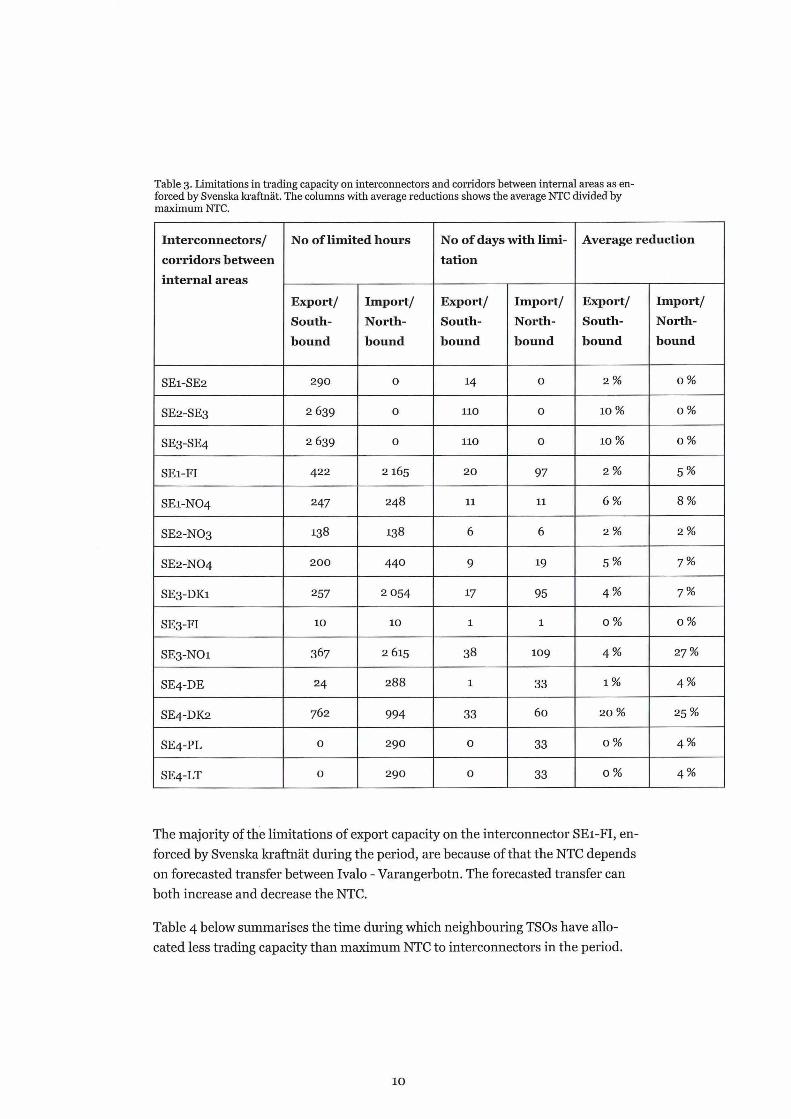
Table 3. Limitations in trading capacity on interconnectors and corridors between interna] areas as en-forced by Svenska kraftnät. The columns with average reductions shows the average NTC divided bymaximum NTC.
Interconnectors/
corridors between
internal areas
No of limited hours No of days with limi-
tation
Average reduction
Export/
South-
bound
Import/
North-
bound
Export/
South-
bound
Import/
North-
bound
Export/
South-
bound
Import/
North-
bound
SE1-SE2 290 0 14 0 2% 0%
SE2-SE3 2639 0 110 0 10 % 0%
SE3-SE4 2639 0 110 0 10% 0%
SEi-FI 422 2 165 20 97 2% 5%
SE1-NO4 247 248 11 11 6% 8%
SE2-NO3 138 138 6 6 2% 2%
SE2-NO4 200 440 9 19 5% 7%
SE3-DK1 257 2054 17 95 4% 7%
SE3-FI 10 10 1 1 0% 0%
SE3-NO1 367 2615 38 109 4% 27%
SE4-DE 24 288 1 33 1% 4%
SE4-DK2 762 994 33 60 20 % 25%
SE4-PL 0 290 0 33 0% 4%
SE4-LT 0 290 0 33 0% 4%
The majority of the limitations of export capacity on the interconnector SEi-FI, en- forced by Svenska kraftnät during the period, are because of that the NTC depends on forecasted transfer between Ivalo - Varangerbotn. The forecasted transfer can both increase and decrease the NTC.
Table 4 below summarises the time during which neighbouring TSOs have allo- cated less trading capacity than maximum NTC to interconnectors in the period.
10
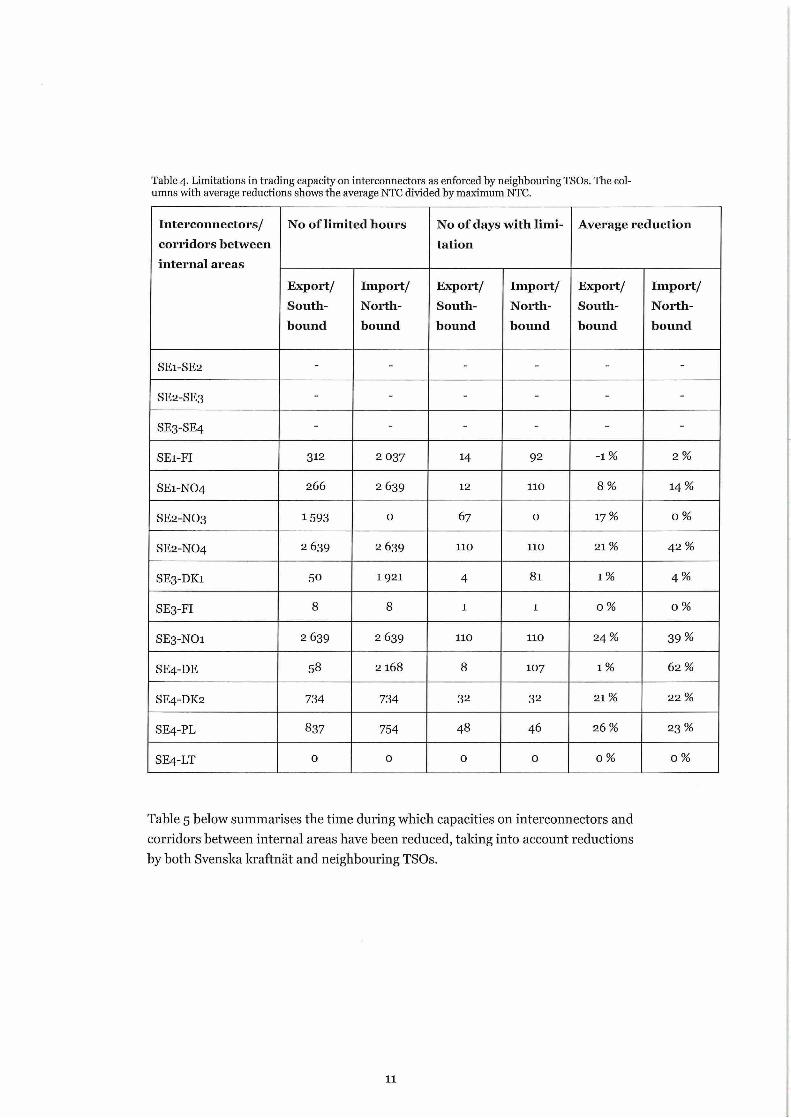
Table 4. Limitations in trading capacity on interconnectors as enforced by neighbouring TSOs. The col-umns with average reductions shows the average NTC divided by maximum NTC.
Interconnectors/
corridors between
internal areas
No of limited hours No of days with limi-
tation
Average reduction
Export/
South-
bound
Import/
North-
bound
Export/
South-
bound
Import/
North-
bound
Export/
South-
bound
Import/
North-
bound
SE1-SE2 - - - - - -
SE2-SE3 - - - - - -
SE3-SE4 - - - - - -
SEi-FI 312 2037 14 92 -1% 2%
SE1-NO4 266 2 639 12 110 8% 14%
SE2-NO3 1593 0 67 0 17 % 0%
SE2-NO4 2 639 2 639 110 110 21 % 42 %
SE3-DK1 50 1 921 4 81 1% 4%
SE3-FI 8 8 1 1 0% 0%
SE3-NO1 2 639 2 639 110 110 24 % 39%
SE4-DE 58 2 168 8 107 1% 62%
SE4-DIC2 734 734 32 32 21 % 22 %
SE4-PL 837 754 48 46 26% 23%
SE4-LT 0 0 0 0 0% 0 %
Table 5 below summarises the time during which capacities on interconnectors and corridors between internal areas have been reduced, taking into account reductions by both Svenska kraftnät and neighbouring TSOs.
11

Table 5. Final limitations in trading capacity on interconnectors and corridors between internal areas asenforced by both Svenska kraftnät and neighbouring TSOs. The columns with average reductions showsthe average NTC divided by maximum NTC.
Interconnectors/
corridors between
internal areas
No of limited hours No of days with limi
tation
Average reduction
Export/
South-
bound
Import/
North-
bound
Export/
South-
bound
Import/
North-
bound
Export/
South-
bound
Import/
North-
bound
SE1-SE2 290 0 14 0 2% 0%
SE2-SE3 2639 0 110 0 10 % 0%
SE3-SE4 2639 0 110 0 10% 0%
SEi-FI 422 2 165 20 97 2% 5%
SE1-NO4 375 2639 17 110 8% 16%
SE2-NO3 1593 138 67 6 17% 2%
SE2-NO4 2 639 2 639 110 110 22 % 42 %
SE3-DK1 297 2 080 20 97 5% 8%
SE3-FI 10 10 1 1 0% 0%
SE3-NO1 2639 2639 110 110 26% 43%
SE4-DE 82 2194 9 107 2% 62%
SE4-DK2 762 994 33 60 22 % 25%
SE4-PL 837 928 48 59 26% 26%
SE4-LT 0 290 0 33 0 % 4%
Detailed information for each limitation is provided in the tables Bl to B4 in appen- dix B and in the attachment. This information includes the reason for each limitation.
2.2 Comments on each interconnector
2.2.1 SEi-FI, North FinlandSvenska kraftnät has reduced the export and import capacity for 422 and 2 165 hours, respectively, on the interconnector between SEi and Fl, because the NTC depends on forecasted transfer between Ivalo - Varangerbotn, and because of
12

planned outage of the interconnector. In total, the export and import on the inter- connector have been reduced for 422 and 2 165 hours, respectively.
2.2.2 SE1-NO4, North NorwaySvenska kraftnät has reduced the export and import capacity for 247 and 248 hours, respectively, on the interconnector between SEi and NO4. The reasons for reductions set by Svenska kraftnät were planned outage on the interconnector and planned outage near the interconnector. In total, the export and import on the interconnector have been reduced for 375 and 2 639 hours, respectively.
2.2.3 SE2-NO3, Central NorwaySvenska kraftnät has reduced the export and import capacity for 138 and 138 hours, respectively, on the interconnector between SE2 and NO3. The reasons for reductions set by Svenska kraftnät were planned outage on the interconnector and planned outage near the interconnector. In total, the export and import on the interconnector have heen reduced for 1593 and 138 hours, respectively.
2.2.4 SE2-NO4, North NorwaySvenska kraftnät has reduced the export and import capacity for 200 and 440 hours, respectively, on the interconnector between SE2 and NO4. The reasons for reductions set by Svenska kraftnät were planned outage of the interconnector and planned outage near the interconnector. In total, the export and import on the interconnector have heen reduced for all hours, respectively.
2.2.5 SE3-DK1, Western DenmarkSvenska kraftnät has reduced the export and import capacity for 257 and 2 054 hours, respectively, on the interconnector between SE3 and DKi. The reasons for reductions set by Svenska kraftnät were congestion in the West Coast Corridor, planned outage on the interconnector, planned outage near the interconnector, and failure on and near the interconnector. In total, the export and import on the interconnector have been reduced for 297 and 2 080 hours, respectively.
2.2.6 SE3-FI, Southern FinlandSvenska kraftnät has reduced the export and import capacity for 10 and 10 hours, respectively, on the interconnector between SE3 and FL The reason for reductions set by Svenska kraftnät was maintenance. In total, the export and import on the interconnector have been reduced for 10 and 10 hours, respectively.
2.2.7 SE3-NO1, Southern NorwaySvenska kraftnät has reduced the export and import capacity for 367 and 2 615 hours, respectively, on the interconnector between SE3 and NOl. The reasons for reductions set by Svenska kraftnät were congestion in the West Coast Corridor, planned outage on the interconnector, planed outage near the interconnector, and
13
unavailable system protection. In total, the export and import on the intercon- nector have been reduced for all hours, respectively.
2.2.8 SE4-DE, GermanySvenska kraftnät has reduced the export and import capacity for 24 and 288 hours, respectively, on the interconnector between SE4 and DE. The reasons for reduc- tions set by Svenska kraftnät were congestion in the West Coast Corridor and fail- ure near the interconnector. In total, the export and import on the interconnector have been reduced for 82 and 2 194 hours, respectively.
2.2.9 SE4-DK2, Eastern DenmarkSvenska kraftnät has reduced the export and import capacity for 762 and 994 hours, respectively, on the interconnector between SE4 and DI<2. The reasons for reductions set by Svenska kraftnät were congestion in the West Coast Corridor, fail- ure near the interconnector, and planned outage on the interconnector. In total, the export and import on the interconnector have been reduced for 762 and 994 hours, respectively.
2.2.10 SE4-PL, PolandSvenska kraftnät has reduced the export and import capacity for o and 290 hours, respectively, on the interconnector between SE4 and PL. The reason for reductions set by Svenska kraftnät was congestion in the West Coast Corridor. In total, the export and import on the interconnector have been reduced for 837 and 928 hours, respectively.
2.2.11 SE4-LT, LithuaniaSvenska kraftnät has reduced the export and import capacity for o and 290 hours, respectively, on the interconnector between SE4 and LT. The reason for reductions set by Svenska kraftnät was congestion in the West Coast Corridor. In total, the export and import on the interconnector have been reduced for o and 290 hours, respectively.
14

Appendix A -Explanation of AttachmentsThe attached spreadsheets contain data for each hour during the period. Each value in the spreadsheets is explained in the table below.
Table Al. Explanation of data in the attached spreadsheets.
Value Explanation
Maximum NTC export/southbound (MW)Maximum NTC import/northbound (MW)
Maximum NTC for export/import, as agreed by TSOs on both sides, and maximum NTC forcorridors between internal areas in south/north direction.These values normally only change after the network has been rein-forced.
Svk NTC export (MW)Svk NTC import (MW)
Svenska kraftnät’s view of NTC for export/import.
Svk Reduction export (Y/N)Svk Reduction import (Y/N)
Yes (Y), if Svenskakraftnäts view of NTC for export/import is lower than maximumNTC, otherwise No (N).
Svk Reduction export (MW)Svk Reduction import (MW)
Difference betweenmaximum NTC andSvenska kraftnäts viewof NTC.
15

Svk Reason for export reductionSvk Reason for import reduction
Reason codes for Svenska kraftnät’s reduction of capacities. Reduction codes are accordingNord Pool’s instruc- tions only reported when the reduction is greater than 100 MW. Because of this princi- ple, there might be mis- matches between the figures shown in table 3 and 5 and tables A2 to A5. See separate sheet in spreadsheet file for explanation of the codes.
Neighbouring TSO NTC export (MW)Neighbouring TSO NTC import (MW)
Neighbouring TSO’s view of NTC for ex- port/import.
Final NTC export/southbound (MW)Final NTC import/northbound (MW)
Final NTC for corridorsbetween internal areas in south/north direc- tion, and the minimum of Svenska kraftnät’s view and the neighbouring TSO’s view of the export/import NTC on interconnectors.
Final Reduction export/southbound (Y/N)Final Reduction import/northbound (Y/N)
Yes (Y), if the final NTCis lower than the maximum NTC, otherwiseNo (N).
Final Reduction export/southbound (MW)Final Reduction import/northbound (MW)
Difference betweenmaximum NTC and final NTC.
i6

Final Reason for export/southbound reductionFinal Reason for import/northbound reduction
Reason codes for reduction of the final capaci- ties. Reduction codes are according NordPool’s instructions only reported when the reduction is greater than 100 MW. Because of this principle, there might be mismatches between the figures shown in table 3 and 5 and tables A2 to A5. See separate sheet in spreadsheet file for ex- planation of the codes.
Registered physical flow (positive for imports and negative for exports/positive for southbound and negative for northbound)
Measured flow on inter-connectors and corri-dors between internalareas.
Electricity price levelSE1/SE2/SE3/SE4/DK1/DK2/NO1/NO3/NO4/FI/LT(EUR)
Price level in SEi, SE2, SE3, SE4, DKi, DK2, NOl, NO3, NO4, Fl,and LT. Prices for DEand PL are not availa- ble, since they are not part of Nord Pool. Red figures indicate a higher price than neighbouring SE-area, and blue indicates a lower price.
Price difference (Y/N) Yes (Y), if there is a price difference between neighbouring SE-area and currentarea, otherwise No (N).Blank for DE and PL.
17
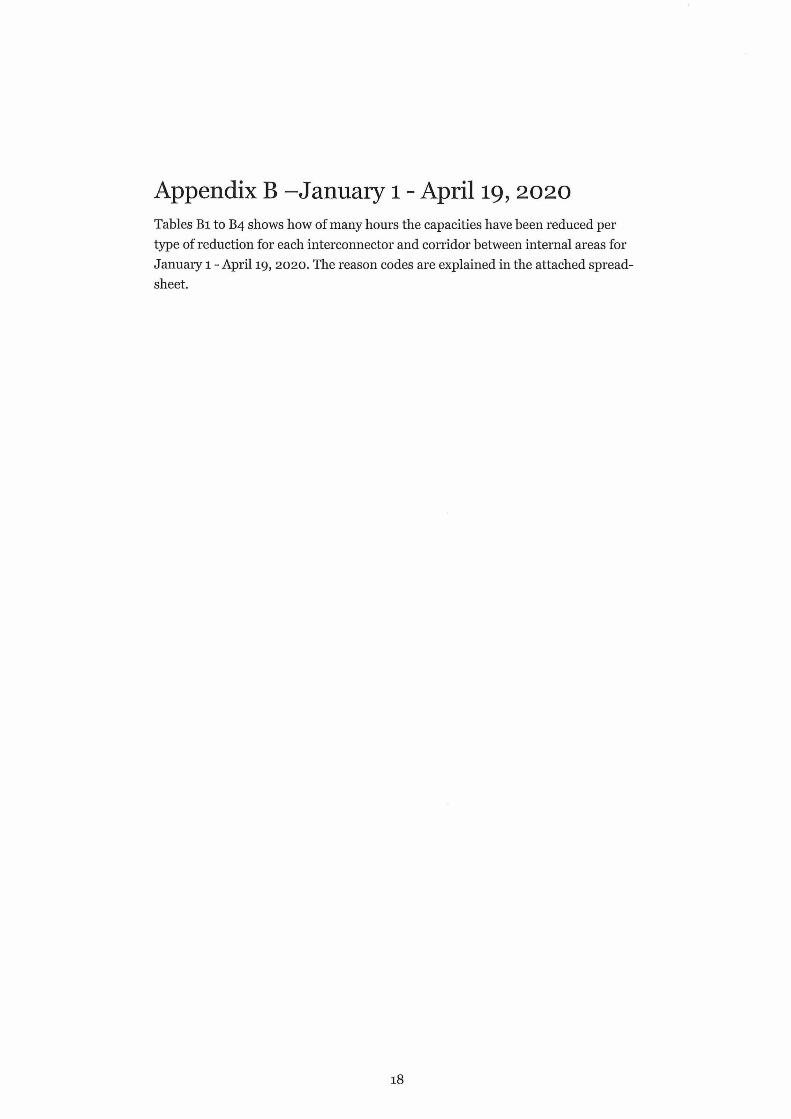
Appendix B -January l - April 19, 2020Tables Bl to B4 shows how of many hours the capacities have been reduced per type of reduction for each interconnector and corridor between internal areas for January 1 - April 19, 2020. The reason codes are explained in the attached spread- sheet.
18

Table Bi. Number of hours per type of export reduction (for interconnectors) and per type of southbound reduction (for corridors between internal areas) enforced by Svenska kraftnät.
IOIO 1115 1126 1155 1156 1157 1421 1422 1425 1426 1431 1432 1433 1457 1458 1523 1533 1622 1623 1624 1625 1823
SE1-SE2 2380 122 13 124
SE2-SE3 18 176 15 227 1116
SE3-SE4 894 227 24 120 704 22
SEl-FI 2494 26 115
SE1-NO4 2 501 138
SE2-NO3 2 501 42 96
SE2-NO4 2 439 138 62
SE3-DK1 2 392 4 45 24 132
SE3-FI 2629 8
SE3-NO1 2 355 12 268
SE4-DE 2615 24
SE4-DK2 1877 716 18 24
SE4-PL 2639
SE4-LT 2639
1833 1923 1933 1934 2033 2034 2214 2222 2226 2257 2258 2326 2357 2522 2523 2533
SE1-SE2
SE2-SE3 24 264 720 79
SE3-SE4 8 24 72 16 4 66 386 72
SEl-FI 1 1 2
SE1-NO4
SE2-NO3
SE2-NO4
SE3-DK1 42
SE3-FI 2
SE3-NO1 4
SE4-DE
SE4-DK2 2 2
SE4-PL
SE4-LT
19
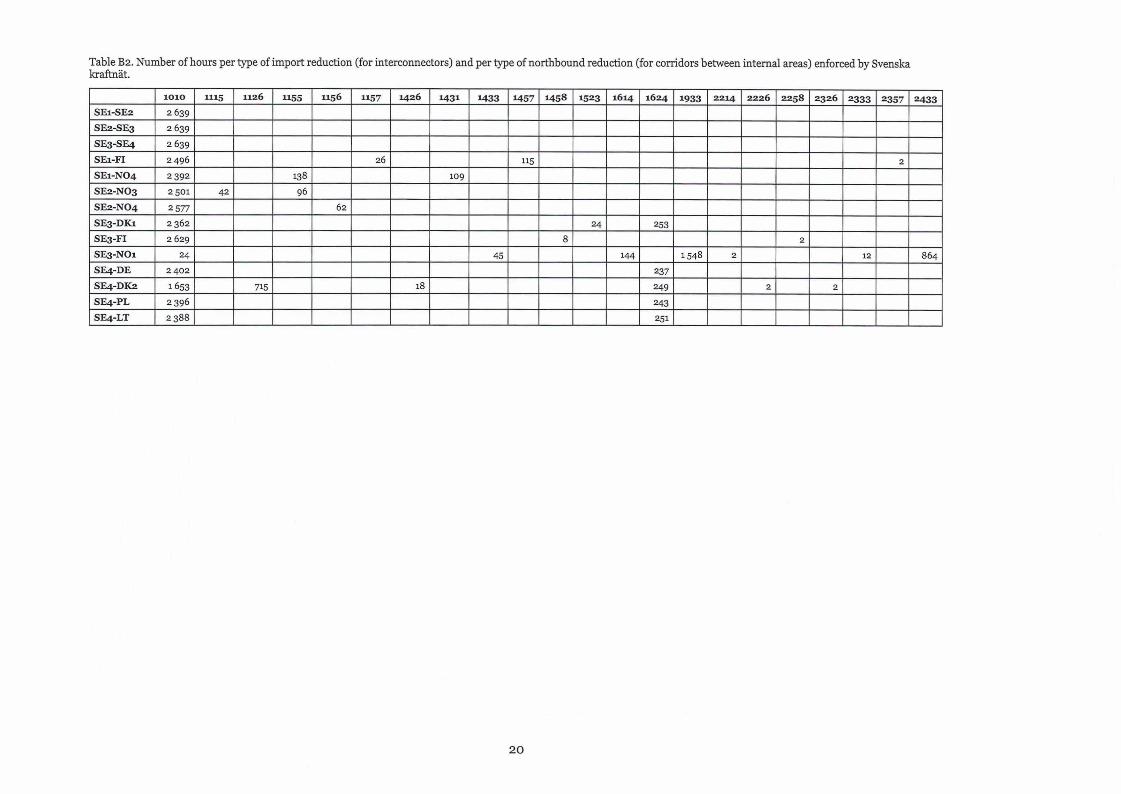
Table B2. Number of hours per type of import reduction (for interconnectors) and per type of northbound reduction (for corridors between intemal areas) enforced by Svenskakraftnät.
IOIO 1115 1126 1155 1156 1157 1426 1431 1433 1457 1458 1523 1614 1624 1933 2214 2226 2258 2326 2333 2357 2433SE1-SE2 2639
SE2-SE3 2639
SE3-SE4 2639
SEi-FI 2496 26 115 2
SE1-NO4 2 392 138 109
SE2-NO3 2 501 42 96
SE2-NO4 2 577 62
SE3-DK1 2362 24 253SE3-FI 2 629 8 2
SE3-NOX 24 45 144 1548 2 12 864
SE4-DE 2 402 237SE4-DK2 1653 715 18 249 2 2
SE4-PL 2396 243SE4-LT 2388 251
20
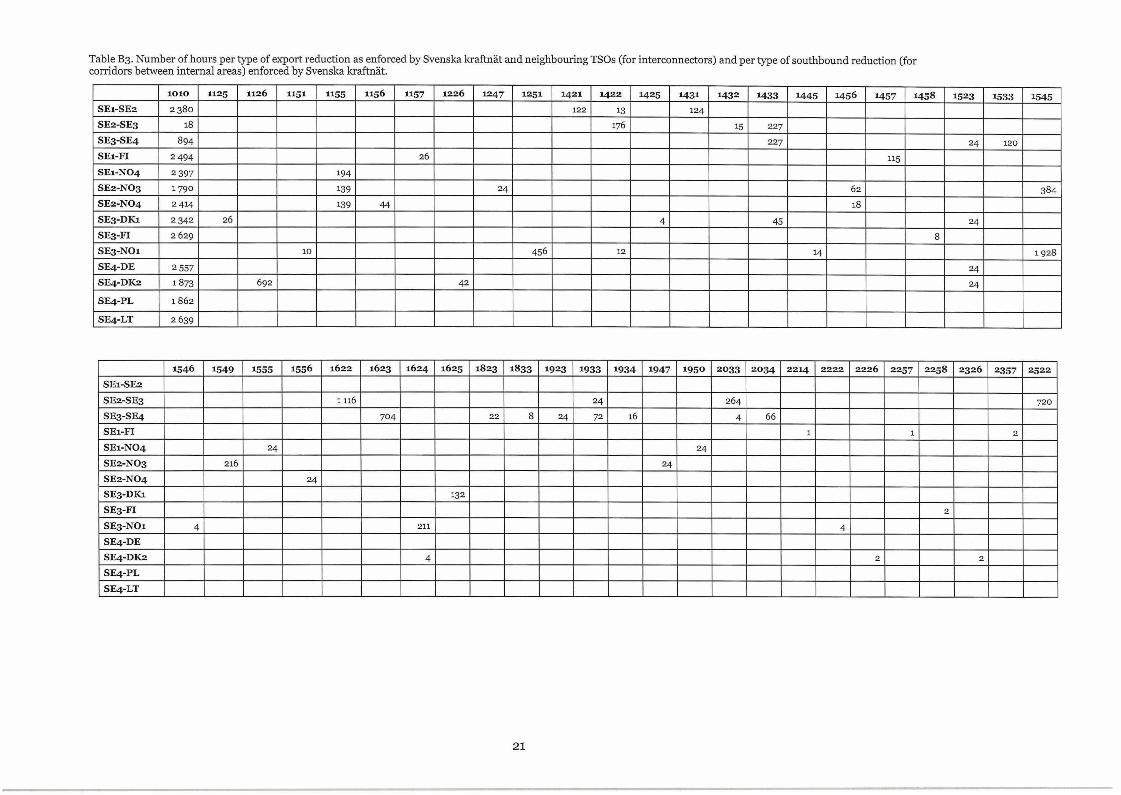
Table B3. Number of hours per type of export reduction as enforced by Svenska kraftnät and neighbouring TSOs (for interconnectors) and per type of southbound reduction (forcorridors betvveen internal areas) enforced by Svenska kraftnät.
IOIO 1125 1126 1151 1155 1156 1157 1226 1247 1251 1421 1422 1425 1431 1432 1433 1445 1456 1457 1458 1523 1533 1545SE1-SE2 2380 122 13 124
SE2-SE3 18 176 15 227
SE3-SE4 894 227 24 120
SEl-FI 2494 26 115
SE1-NO4 2 397 194
SE2-NO3 1790 139 24 62 384
SE2-NO4 2414 139 44 18
SE3-DK1 2 342 26 4 45 24
SE3-FI 2 629 8
SE3-NO1 10 456 12 14 1928
SE4-DE 2 557 24
SE4-DK2 1873 692 42 24
SE4-PL 1 862
SE4-LT 2 639
1546 1549 1555 1556 1622 1623 1624 1625 1823 1833 1923 1933 1934 1947 1950 2033 2034 2214 2222 2226 2257 2258 2326 2357 2522SE1-SE2
SE2-SE3 1116 24 264 720
SE3-SE4 704 22 8 24 72 16 4 66
SEl-FI 1 1 2
SE1-NO4 24 24
SE2-NO3 216 24
SE2-NO4 24
SE3-DK1 132
SE3-FI 2
SE3-NO1 4 211 4
SE4-DESE4-DK2 4 2 2
SE4-PLSE4-LT
21
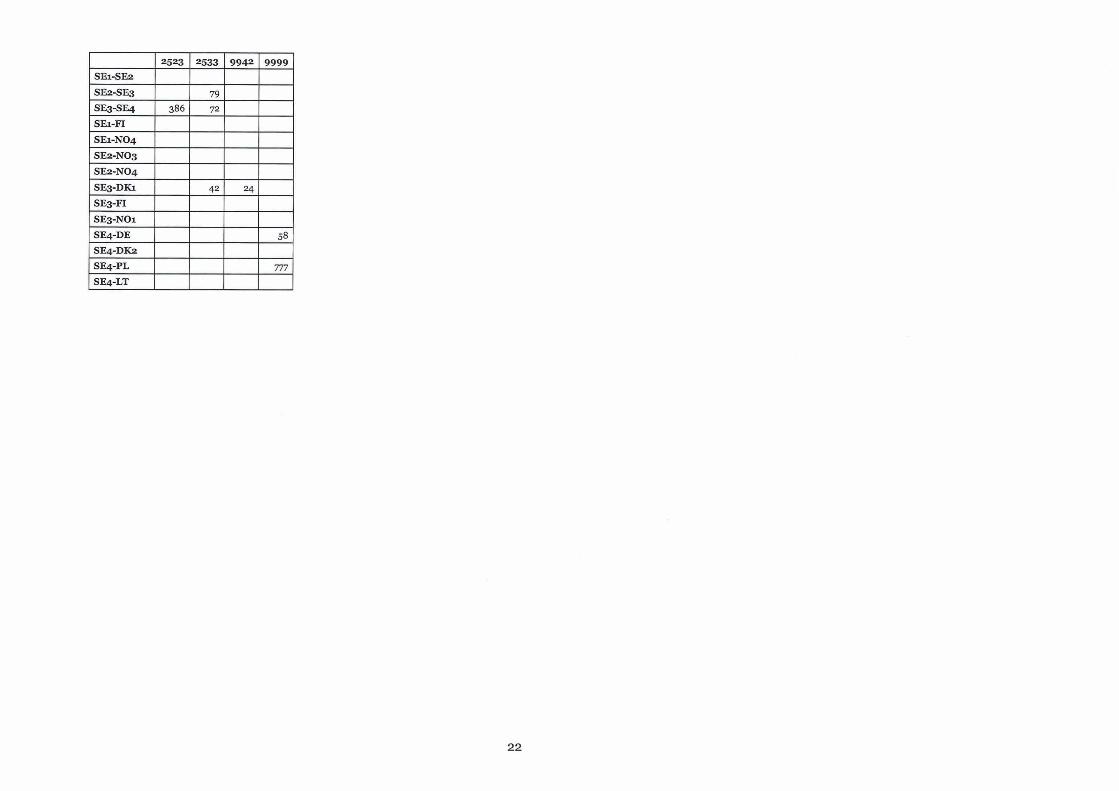
2523 2533 9942 9999SE1-SE2
SE2-SE3 79
SE3-SE4 386 72
SEl-FISE1-N04
SE2-NO3SE2-NO4SE3-DK1 42 24SE3-FI
SE3-NO1SE4-DE 58SE4-DK2SE4-PL 777SE4-LT
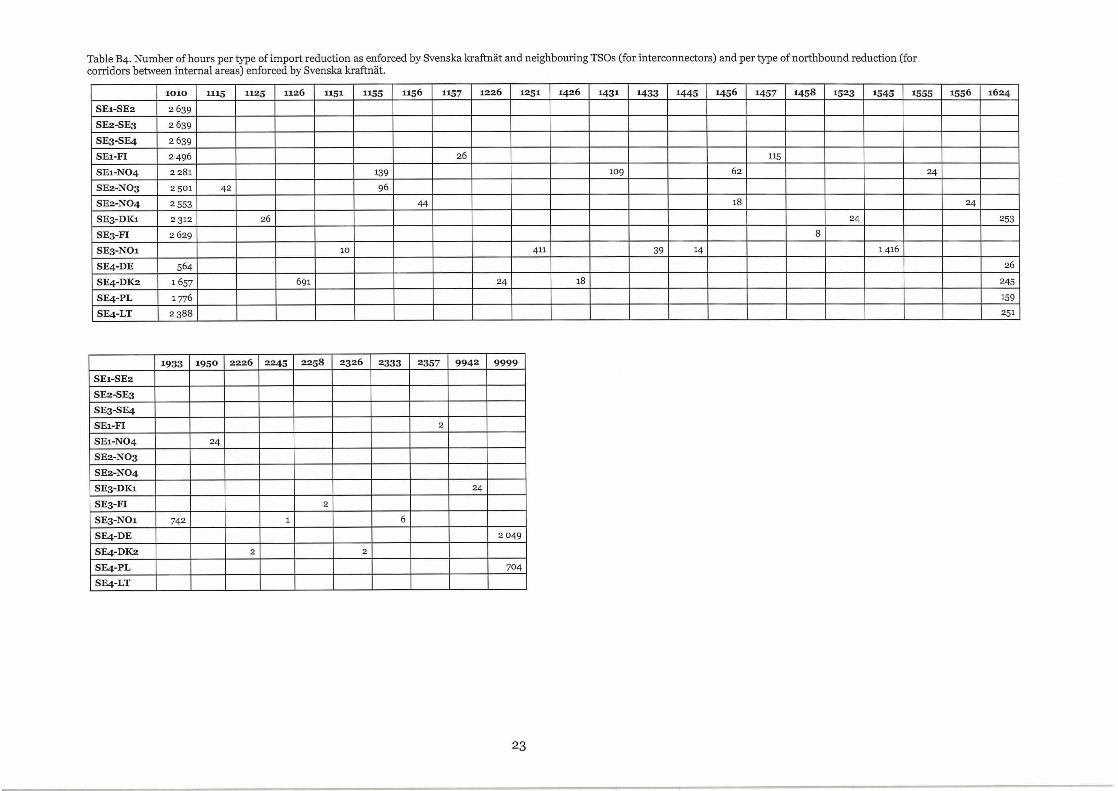
Table B4. Number of hours per type of import reduction as enforced by Svenska kraftnät and neighbouring TSOs (for interconnectors) and per type of northbound reduction (forcorridors between intemal areas) enforced by Svenska kraftnät.
IOIO 1115 1125 1126 1151 1155 1156 1157 1226 1251 1426 1431 1433 1445 1456 1457 1458 1523 1545 1555 1556 1624
SE1-SE2 2639
SE2-SE3 2639
SE3-SE4 2 639
SEl-FI 2496 26 115
SE1-NO4 2281 139 109 62 24
SE2-NO3 2 501 42 96
SE2-NO4 2 553 44 18 24
SE3-DK1 2 312 26 24 253
SE3-FI 2 629 8
SE3-NO1 10 411 39 14 1416
SE4-DE 564 26
SE4-DK2 1657 691 24 18 245
SE4-PL 1776 159
SE4-LT 2388 251
1933 1950 2226 2245 2258 2326 2333 2357 9942 9999
SE1-SE2SE2-SE3SE3-SE4SEl-FI 2
SE1-NO4 24
SE2-NO3SE2-NO4SE3-DK1 24
SE3-FI 2
SE3-NO1 742 1 6
SE4-DE 2049
SE4-DK2 2 2
SE4-PL 704
SE4-LT
23

Vz