Swedbanks first quarter results 2011 CEO presentation
24
Swedbank’s first quarter 2011 results Michael Wolf, CEO Erkki Raasuke, CFO Göran Bronner, CRO
-
Upload
swedbank -
Category
Economy & Finance
-
view
593 -
download
3
description
Swedbank's CEO Michael Wolf presents the first quarter results 28 April 2011.
Transcript of Swedbanks first quarter results 2011 CEO presentation

Swedbank’s first quarter 2011 resultsMichael Wolf, CEOErkki Raasuke, CFOGöran Bronner, CRO

Strong start to the year
• Net profit of SEK 3.9bn for Q1
• Core Tier 1 capital ratio of 14.9 per cent
• Return on equity of 16.1 per cent in Q1
2
Q1 10 Q2 10 Q3 10 Q4 10 Q1 11
Net profit performance
Lehman contribution

Follow-up on priorities 2011
• Customer focus
• Growth in selected segments
• Quality and effectiveness
• Robust and low-risk balance sheet
3

NII supported by higher interest rates• One-offs and higher stability fee shadowing underlying NII growth• Improving deposit margins in Retail • Government guarantee cost kept within Treasury
4
Net interest income
4 023 3 799 3 980
4 527
Retail LC&I Baltic Banking
Russia, Ukraine
Treasury, Other
173
2 925
117
850
-171 997
29 188
-148
-433
Q1 10 Q2 10 Q3 10 Q4 10 Q1 11
(SE
Km
)
4 527
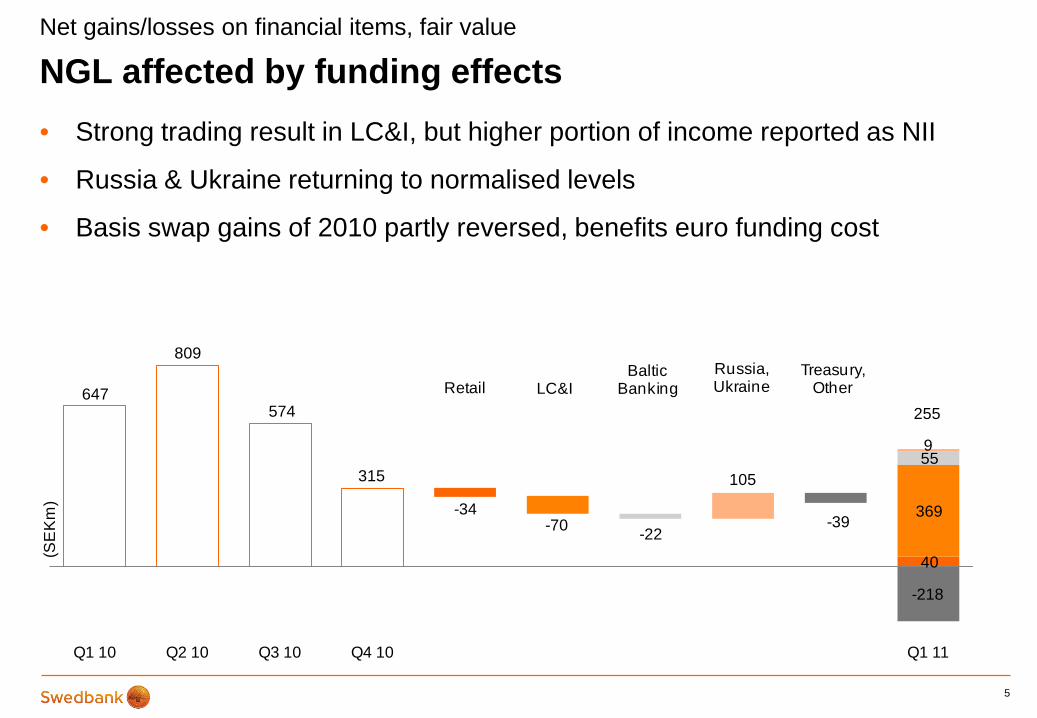
NGL affected by funding effects• Strong trading result in LC&I, but higher portion of income reported as NII
• Russia & Ukraine returning to normalised levels
• Basis swap gains of 2010 partly reversed, benefits euro funding cost
5
Net gains/losses on financial items, fair value
647
809
574
315
Retail LC&IBaltic
BankingRussia, Ukraine
Treasury, Other
-34
40
-70369
-22
55 105
9
-39
-218
Q1 10 Q2 10 Q3 10 Q4 10 Q1 11
(SE
Km
)
255

Stable year-on-year expenses• Enhancing internal capabilities
– Key recruitments in Q1– Lower consultancy costs
• Improving cost/income ratio driven by one-off income
6
Expenses
4 391 4 423 4 238 4 590
Retail LC&I Baltic Banking
Russia, Ukraine
Treasury,Other
-30
2 193
-18
859
-39
658
-39172
-80 502
0.57 0.57 0.55 0.580.52
Q1 10 Q2 10 Q3 10 Q4 10 Q1 11
(SE
Km
)
4 384

7
First quarter 2011 results
Income statementSEKm Q1 11 Q4 10 Δ Q1 10Net interest income 4 527 4 527 0 4 023
Net commission income 2 301 2 538 -237 2 282
Net gains/losses 255 315 -60 647
Other 1 369 578 791 715
Total income 8 452 7 958 494 7 667
Total expenses 4 384 4 590 -206 4 391
Profit before impairments 4 068 3 368 700 3 276
Total impairments - 970 - 77 -893 2 260
Operating profit 5 038 3 445 1 593 1 016
Tax expense 1 182 693 489 469
Profit attributable to shareholders 3 852 2 750 1 102 536

8
First quarter 2011 results
Key ratios
Volumes, SEKbn Q1 11 Q4 10 Δ Q1 10Lending to the public 1 141 1 146 -5 1 168
Deposits from the public 502 517 -15 496
Covered bonds 477 410 66 389
Key ratios Q1 11 Q4 10 Q1 10Return on equity, % 16.1 11.7 2.4
Cost-income ratio 0.52 0.58 0.57
Core funding ratio, %* 114 121 127
Core Tier 1 capital ratio, %** 14.9 13.9 12.3
* Lending/(deposits+covered bonds+retail bonds), ** Basel 2

SEK 91bn term funding issued in Q1 2011
9
Liquidity & Funding
Issuance Q1 & maturities full year 2011 • First US covered bond issue (144A), dual tranche of USD 1bn each
• Two EUR benchmark covered bonds
• Maturities of nominal SEK 121bn for the remainder of 2011
• Average maturity of wholesale funding, including short-term funding, 30 months (39 months for covered bonds)
(nominal SEKbn)
-80
-60
-40
-20
0
20
40
60
Jan Feb Mar Apr May Jun Jul Aug Sep Oct Nov Dec

Continued improvements
• Asset quality – Decreasing impaired loans– FR&R/Ektornet according to plan
• Substantial recoveries – all countries
• Lehman income
• RWA decreased by SEK 22.3bn in Q1– SEK 11.0bn lower credit risk– SEK 8.7bn lower market risk
• Strong funding position
10
Risk highlights

Net recoveries of SEK 972m in Q1
• Net recoveries in all CEE countries
• Sweden – also recoveries
• Collateral revaluations, repayments and rating migration
11
Asset quality
2 210
963
120
-483-972
-1 500
-1 000
-500
0
500
1 000
1 500
2 000
2 500
Q1 10 Q2 10 Q3 10 Q4 10 Q1 11
SEKmCredit impairments
Retail LC&I Baltic Banking Russia & Ukraine Other

One-off income in US commercial real estate lending
• One-off pre-tax income of SEK 716m in Q1 after agreement with Lehman
• Remaining gross exposure was USD 1.1bn as of 31 March 2011, consisting of 35 assets
• No. of repossessed assets are expected to increase (2 as of today)
• Over-collateralisation still intact
12
Asset quality

Corporate risk weights – focus on capital efficiency
• Several different work streams
• Expected gradual effect in small steps
• History not enough to predict future– Stress tests key steering tool– Transparency
13
Capital management
Source: SEB Enskilda Equity Research
0
10
20
30
40
50
60
70
80
90
Handelsbanken Swedbank SEB Nordea
%Corporate risk weights,
development Q1 09 - Q4 10

Buy-back programme
• As of 31 March the excess capital amounts to SEK 9.9bn
• Gradually during four quarters
• Both A-shares and preference shares
14
Capital management
13.0%
Risk appetite(ICAAP buffer,SEK 15.6bn)
Regulatory requirement(SEK 36.3bn)
Excess capital (SEK 9.9bn)
10.0%
7.0%
Extra buffer due to prevailing circumstances(SEK 15.6bn)
14.9%

Appendix
15
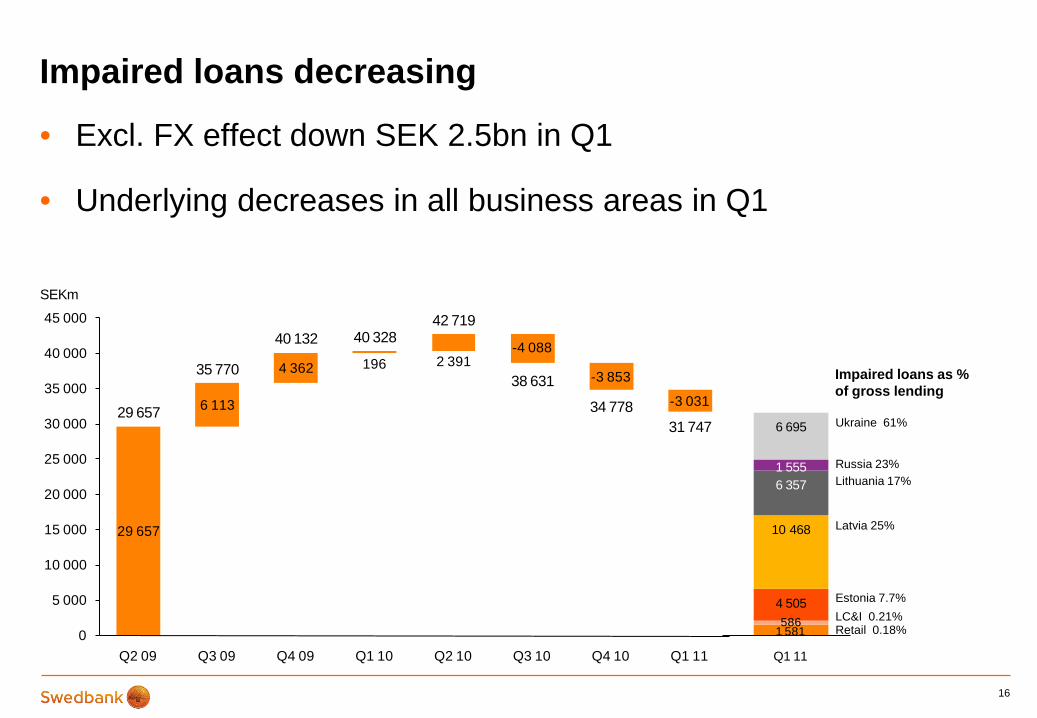
Impaired loans decreasing
• Excl. FX effect down SEK 2.5bn in Q1
• Underlying decreases in all business areas in Q1
16
Ukraine 61%
Russia 23%Lithuania 17%
Latvia 25%
Estonia 7.7%LC&I 0.21%Retail 0.18%
Impaired loans as % of gross lending
29 657
6 113
4 362 196 2 391-4 088
-3 853
-3 03129 657
35 770
40 132 40 32842 719
38 631
34 77831 747
0
5 000
10 000
15 000
20 000
25 000
30 000
35 000
40 000
45 000
Q2 09 Q3 09 Q4 09 Q1 10 Q2 10 Q3 10 Q4 10 Q1 11
SEKm
1 581586
4 505
10 468
6 3571 555
6 695
Q1 11

Loans past due 60 days – performance Q/Q
17
-150
-100
-50
0
50
100
150
200
250
Q1
10Q
2 10
Q3
10Q
4 10
Q1
11
Q1
10Q
2 10
Q3
10Q
4 10
Q1
11
Q1
10Q
2 10
Q3
10Q
4 10
Q1
11
Q1
10Q
2 10
Q3
10Q
4 10
Q1
11
Q1
10Q
2 10
Q3
10Q
4 10
Q1
11
EURm
Estonia Latvia Lithuania RussiaUkraine
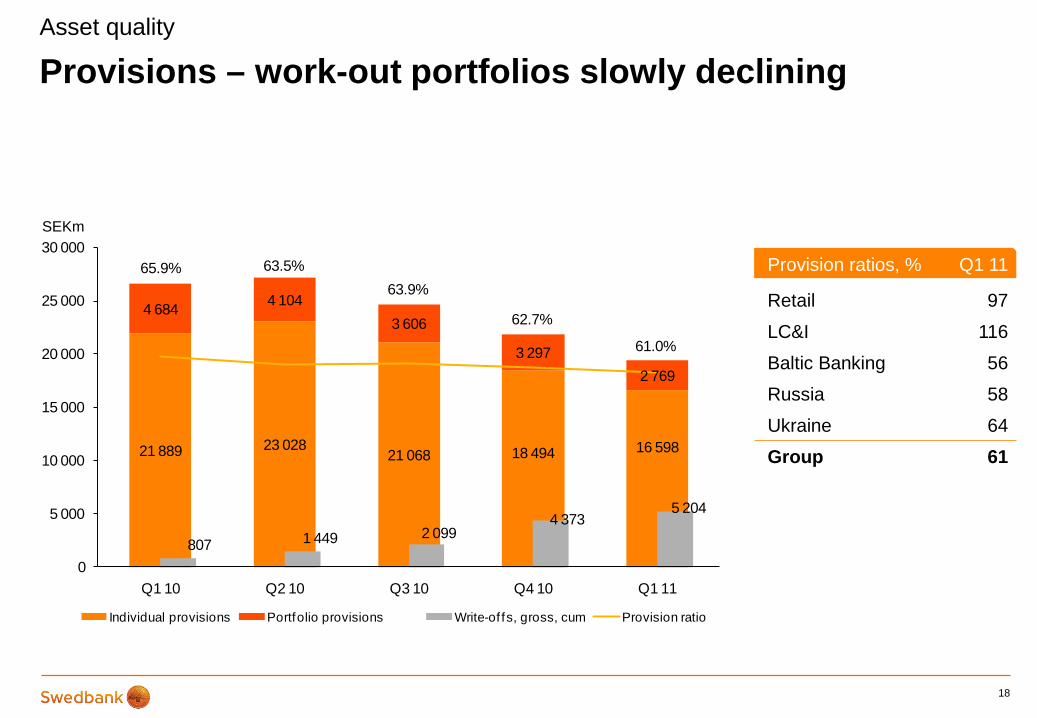
Provisions – work-out portfolios slowly declining
18
Provision ratios, % Q1 11
Retail 97
LC&I 116
Baltic Banking 56
Russia 58
Ukraine 64
Group 61
Asset quality
21 889 23 02821 068 18 494 16 598
4 684 4 1043 606
3 2972 769
807 1 449 2 0994 373
5 204
65.9% 63.5%63.9%
62.7%
61.0%
0
5 000
10 000
15 000
20 000
25 000
30 000
Q1 10 Q2 10 Q3 10 Q4 10 Q1 11
SEKm
Individual provisions Portfolio provisions Write-of fs, gross, cum Provision ratio

Repossessed assetsAsset quality
19
0
500
1 000
1 500
2 000
2 500
3 000
3 500
4 000
4 500
Q1 10 Q2 10 Q3 10 Q4 10 Q1 11
SEKm
Real Estate Residential Real Estate Commercial Passenger & Commercial Transport Shares Other

20
Real estate prices
Source: Swedbank, Estonian Land Board
Source: Swedbank, State Enterprise Centre of Registers
821
0200400600800
1 0001 2001 4001 6001 800
Jan-
05
May
-05
Sep
-05
Jan-
06
May
-06
Sep
-06
Jan-
07
May
-07
Sep
-07
Jan-
08
May
-08
Sep
-08
Jan-
09
May
-09
Sep
-09
Jan-
10
May
-10
Sep
-10
Jan-
11
Tallin
Nr.of deals EUR/m2Source: Swedbank
1 084
0200400600800
1 0001 2001 4001 6001 8002 000
Jan-
05
May
-05
Sep
-05
Jan-
06
May
-06
Sep
-06
Jan-
07
May
-07
Sep
-07
Jan-
08
May
-08
Sep
-08
Jan-
09
May
-09
Sep
-09
Jan-
10
May
-10
Sep
-10
Jan-
11
Vilnius
Nr.of deals EUR/m2
606
0200400600800
1 0001 2001 4001 6001 8002 000
Jan-
05M
ay-0
5S
ep-0
5Ja
n-06
May
-06
Sep
-06
Jan-
07M
ay-0
7S
ep-0
7Ja
n-08
May
-08
Sep
-08
Jan-
09M
ay-0
9S
ep-0
9Ja
n-10
May
-10
Sep
-10
Jan-
11
Riga
Nr.of deals EUR/m2

21
Long-term funding • Continued focus on covered bonds with Q1 issuance of SEK 85bn• SEK 4bn in senior unsecured issuance • 2 USD-denominated covered bond benchmark deals - of EUR 1bn each • 2 EUR-denominated covered bond benchmark deals of EUR 1bn and EUR 1.5bn • Total term funding maturities for the remainder of 2011 - of nominal SEK 121bn
21
Liquidity & funding
Long-term funding maturity profile, SEKbn
0
50
100
150
200
2011 2012 2013 2014 2015 2016
Senior unsecuredGuaranteed bonds
0
50
100
150
200
2011 2012 2013 2014 2015 2016
Covered bonds

22
Remaining government guaranteed debt • Exited the programme on 30 April 2010
• No issuance under the programme since summer 2009
• SEK 25bn of government guaranteed debt matured during Q1 2011
• Maturities of SEK 53bn for the remainder of 2011
22
Liquidity & funding
Maturity profile as per Q1 2011, SEKbn
0
20
40
60
2011 2012 2013 2014
USDSEKEURCHFHKDJPY
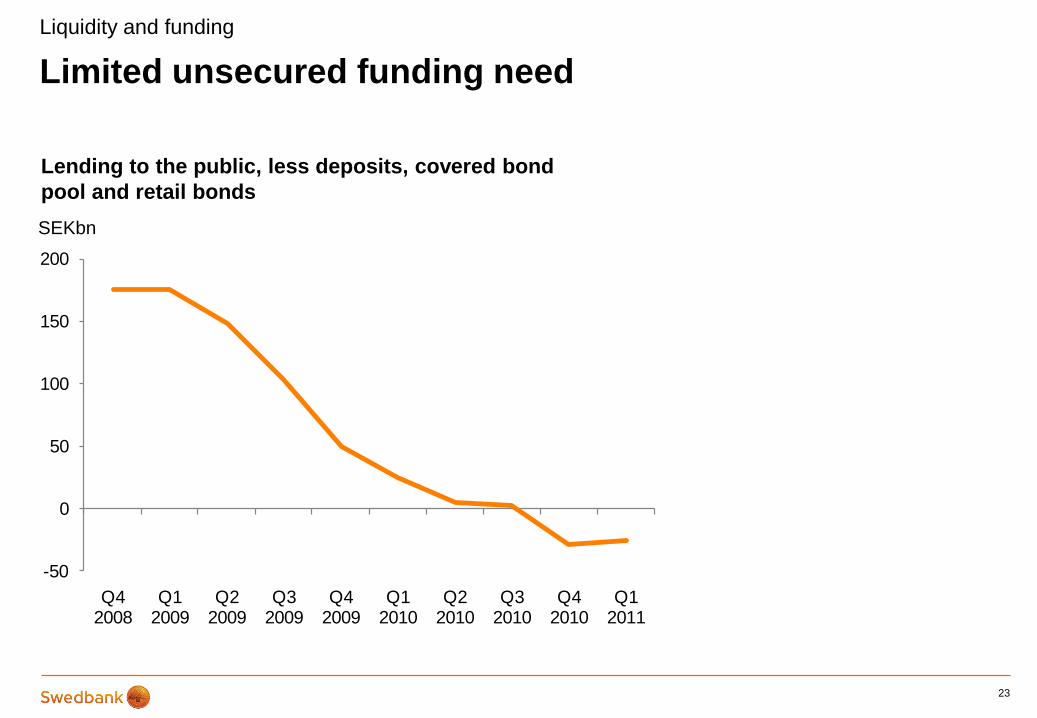
Limited unsecured funding need
23
Liquidity and funding
Lending to the public, less deposits, covered bond pool and retail bonds
-50
0
50
100
150
200
Q4 2008
Q1 2009
Q2 2009
Q3 2009
Q4 2009
Q1 2010
Q2 2010
Q3 2010
Q4 2010
Q1 2011
SEKbn

Liquidity reserve*
24
Cash and holdings in central banks and deposits in other banks available o/n 63 437Securities issued or guaranteed by sovereigns, central banks or multilateral development banks 29 214Securities issued or guaranteed by municipalities or PSEs 0Covered bonds 53 366 - Issued by other institutions 53 272 - Own issued 93Securities issued by non-financial corporates 0Securities issued by financial corporates (excl. covered bonds) 1 869Other 0Total 147 886* As defined by the Swedish FSA
Liquid assets outside Treasury organisation 103 737
Total 251 623
SEKm