SWAT Carbon Presentation
24
Integrating Nitrogen and Integrating Nitrogen and Phosphorus with Carbon Cycling in SWAT Cycling in SWAT Armen R. Kemanian, Texas AgriLife Research, Temple TX Stefan Julich, Justus-Liebig University, Giessen, Germany Jeffrey G. Arnold, USDA-ARS, Temple TX 2009 SWAT Conference July 8, 2009 Boulder, CO Improving Life through Science and Technology
Transcript of SWAT Carbon Presentation

Integrating Nitrogen andIntegrating Nitrogen and Phosphorus with Carbon Cycling in SWATCycling in SWAT
Armen R. Kemanian, Texas AgriLife Research, Temple TXgStefan Julich, Justus-Liebig University, Giessen, GermanyJeffrey G. Arnold, USDA-ARS, Temple TX
2009 SWAT ConferenceJuly 8, 2009 Boulder, CO
Improving Life through Science and Technology

Outline
• Carbon cycling modeling relevanceB i f hi t i l b k d• Brief historical background
• Challenges• Sub-module description• Sub-module description• Sample simulations• Concluding remarksg
Photo courtesy of Hyrum Johnson
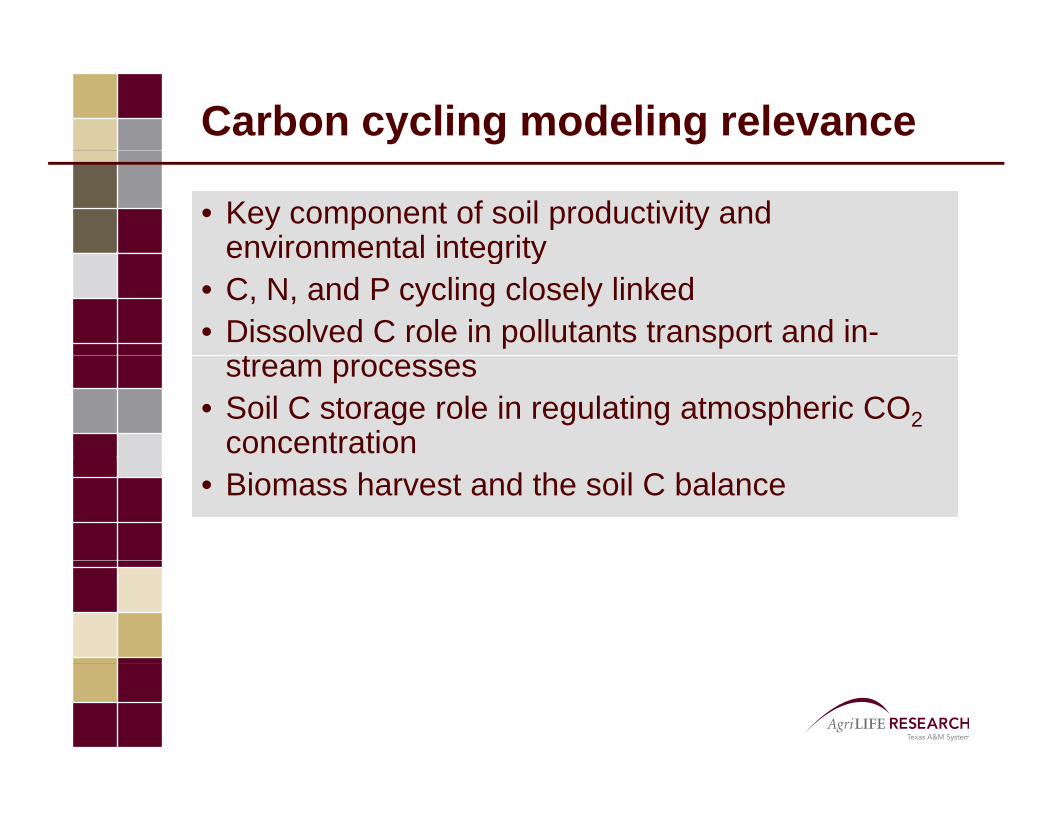
Carbon cycling modeling relevance
• Key component of soil productivity and environmental integrityenvironmental integrity
• C, N, and P cycling closely linked• Dissolved C role in pollutants transport and in-
tstream processes• Soil C storage role in regulating atmospheric CO2
concentration• Biomass harvest and the soil C balance

More than a century of research
• Hénin and Dupuis (1945): carbon balanceJ (1958) t i t• Jansson (1958): tracer experiments
• Swift (1979): the decomposition cascade• Jenkinson and Rayner (1977): multiple carbon• Jenkinson and Rayner (1977): multiple carbon
pools, Roth-C model• Paul & coworkers (1979 - present)• Phoenix model (McGill et al. 1981)• Century, NCSoil, Verberne et al. (1980-90)• Hassink & Withmore (1997): Saturation• SOC composition revisited (2000 ….)

What is soil organic matter?
A continuous of products from decaying organisms, and their exudates and excreta sometimes charredand their exudates and excreta, sometimes charred
Concept of SOM as polymeric macromolecular structures transitioned to non-covalent association ofstructures transitioned to non covalent association of low-molecular-mass, recognizable biomolecules in various stages of decomposition (Hedges et al., 2000; Burdon, 2001; Wrobel et al., 2003; Sutton and Piccolo, 2001; Smejkalova and Piccolo, 2008)
Most processes directly affecting SOM formation p y goccur at nanometer- and millimeter-scales, at specific locations in the soil matrix
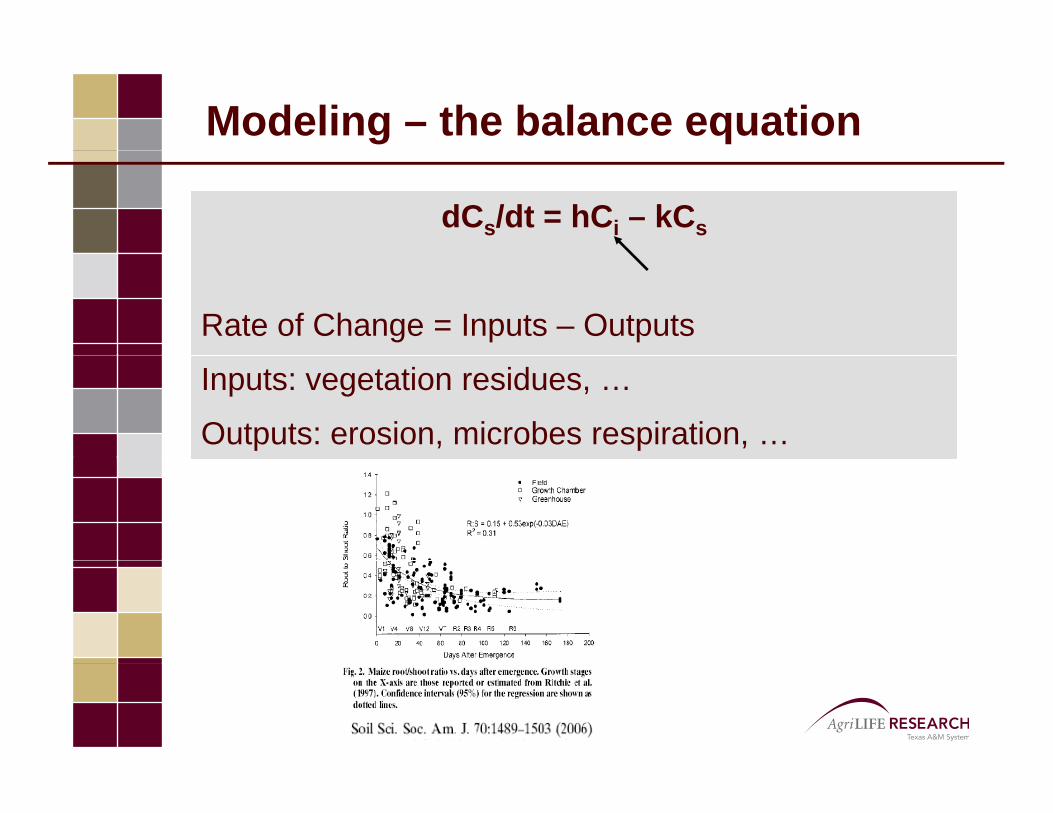
Modeling – the balance equation
dCs/dt = hCi – kCs
Rate of Change = Inputs – Outputs
Inputs: vegetation residues, …
Outputs: erosion, microbes respiration, …
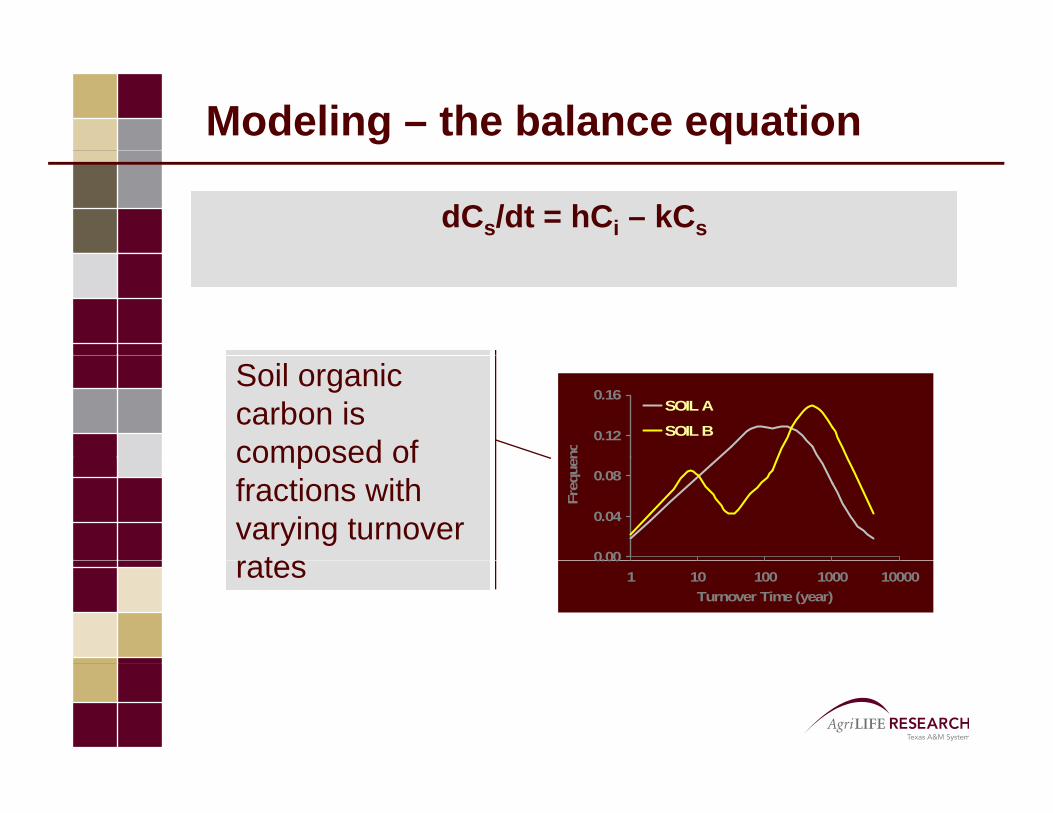
Modeling – the balance equation
dCs/dt = hCi – kCs
0.12
0.16
nc
SOIL A
SOIL B
Soil organic carbon is composed of
0.00
0.04
0.08
Freq
uencomposed of
fractions with varying turnover
t 0.001 10 100 1000 10000
Turnover Time (year)
rates

SWAT sub-model approach
• Soil organic matter composed of one pool with variable properties:pool, with variable properties:–variable C:N ratio
variable C:P ratio–variable C:P ratio–variable turnover rate
• Residues humification controlled by soil organic carbon content (saturation g (content)

SWAT carbon sub-model approach
Litter Litter
Ci
ManureRootsPOM*
NiNO3
ManureRootsPOM*
i
CO2
Cs
iNH4
Ns
humificationdecomposition
Microbial biomassHumus
Microbial biomassHumus
mineralization -immobilization
•Cs and texture control the humification
•Cs, tillage, texture,
•Residues C:N and mineral N control the C:N ratio of the newly formed SOMCs, tillage, texture,
temperature, moisture, control the decomposition
y

Core soil carbon balance equation
Change Carbon Storage = Inputs – Outputs
dCs/dt = hCi – kCs
h = hc[1 – (Cs/Cx)n]k = f ftk (C /C )mk feftkx(Cs/Cx)
hc depends on soil textureCx depends on soil texture (Hassink and Withmore, 1997)fe soil temperature and water content factorf f ti f till t l d b f ti (NRCS)ft function of tillage tool and number of operations (NRCS)

Controls: Tillage
1 0tThe effect of tillage and SOM
decomposition rate
0.4
0.6
0.8
1.0
enha
ncem
ent
On each layer, tillage accelerates decomposition; soil settling returns this variable to zero
0.0
0.2
0 1 2 3
Dec
omp
Cumulative mixing efficiencyCumulative mixing efficiency
The tillage enhancement effect12
15
men
t
Texture effect on tillage
The tillage enhancement effect depends on the layer texture
3
6
9
12
Max
enh
ance
m
0
3
0.0 0.2 0.4 0.6
M
Fractional clay content

Controls: residue C:N ratio
Residue C:N ratio and N The lower the C:N ratio of the residue, and the higher the mineral nitrogen concentration, th l th C N ti f th
13
15
:N ra
tio
mineral on C:N ratio of SOM 1 ppm N4 ppm N32 ppm N the lower the C:N ratio of the
newly formed SOM
7
9
11
SOM
C
32 ppm N
0 50 100 150 200Residue C:N ratio

Testing: Pendleton OR (1931)
Climate: semi-arid, winter precipitation
S il W ll W ll ilt lSoils: Walla Walla silt loam
Original vegetation: shrub / sagebrush –grassland
R t ti i t h t / f llRotation: winter wheat / summer fallow
Tillage: moldboard plow in fall + operations to control weeds during p gsummer
Source: Rasmussen and Smiley, 1996 and others

Testing: Pendleton OR
Treatment: 0 kg N ha-1
50
60
a
Sim top 30 cm Sim 30 to 60 cmObs top 30 cm Obs 30 to 60 cm
Obs Sim Diff
Yield, Mg ha-1 2.6 3.2 +0.6
Stover, Mg ha-1 4.5 4.5 +0.030
40
50
SOC
Mg/
ha
S o e , g a 5 5 0 020
1920 1940 1960 1980 2000Year
60
40
50
60
C M
g/ha
Treatment: 45 / 90 kg N ha-1
Obs Sim Diff
Yield, Mg ha-1 3.7 4.2 +0.5
20
30
1920 1940 1960 1980 2000SO
Yield, Mg ha 3.7 4.2 0.5
Stover, Mg ha-1 4.9 4.8 -0.1
Year

Testing: Pendleton OR
Manure 110 kg N ha-1 + 1.5 Mg C ha-1
50
60
a
Obs Sim Diff
Yield, Mg ha-1 4.2 4.4 +0.2 30
40
50
SOC
Mg/
ha
Stover, Mg ha-1 7.0 6.1 -0.9 201920 1940 1960 1980 2000
Year
40
50
60
C M
g/ha
Treatment: 45 / 90 kg N ha-1, starting on 1894
comment on top layercomment on sub-soilsame difficulties expected in N-based
20
30
1880 1900 1920 1940 1960 1980 2000SO
same difficulties expected in N based models
Year

Testing: Pendleton OR
Winter SummerSpring Winter SummerSpring WinterFallFall
6ac
tor
Wheat WheatMechanical Fallow
2
4
Tilla
ge F
a
0 - 10 cm10 - 20 cm
T = tillage event
0
2
1 101 201 301 401 501 601 701
T 10 20 cm20 - 30 cm
TT T T T
1 101 201 301 401 501 601 701
Day Count Progression

Testing: Pendleton OR

Testing: College Station, TX
Climate: subtropical, hot and humid summer: 940 mm / year, 20 C MATsummer: 940 mm / year, 20 C MAT
Soils: Weswood
Original vegetation: grassland, woodland
R t ti h t ltRotation: wheat monoculture
Tillage: three to four operations per yearSource: Dou et al 2007 Soil Science 172 124-131Source: Dou et al., 2007. Soil Science 172, 124 131

Testing: College Station, TX
12
14
16kg
-1so
il0 - 5 cm 5 15 cm
NT in 2002: 15.0 g kg-1
CT i 2002 11 1 k 1
8
10
bon,
g C
k 5 - 15 cm15 - 30 cm30 - 55 cm55 - 80 cm
CT in 2002: 11.1 g kg-1
NT = CT in 2002: 0.83 g kg-1
2
4
6
gani
c C
arb
80 - 105 cm
00 50 100 150 200
Org
Yearea

Testing: Central Texas Vertisols
Climate: subtropical, dry summer
P i it ti 750 900 /Precipitation 750 - 900 mm / year
Temperature 18 - 20 C MAT
Original vegetation: tallgrass prairieOriginal vegetation: tallgrass prairie
R t ti i l t d tiRotation simulated: continuous corn
Tillage: three to four operations per yearSource of SOC data: Potter et al 1999Source of SOC data: Potter et al., 1999

Testing: Central Texas Vertisols
0 0 0 5 1 0 1 5 2 0Organic Carbon, g C kg-1 soil
0.0
0.2
0.0 0.5 1.0 1.5 2.0
simulation year 1
0.4
0.6pth,
m
simulation year 25simulation year 50TempleBurleson
0.8
1.0
Dep Riesel
1.2

Concluding Remarks
AdvancesAdvances
• Integration of N, P, and C in SWAT
• The effect of tillage on several processes can be now simulated
Notes of caution
C• Carbon cycling below the plow layer is not clearly understood
• Uncertainties in all components of the C (or N) balance p ( )make accurate predictions of C accumulation rate difficult
• Forest soils and organic horizons not tested yetForest soils and organic horizons not tested yet

Acknowledgements
IndividualsNancy SammonsNancy SammonsShawn Quisenberry
InstitutionsTexas AgriLife ResearchUSDA-ARSJustus-Liebig University

Questions