SWARM - USGS: Volcano Hazards Program SeedLink Server ... SWARM, Seismic Wave Analysis and Real-time...
50
SWARM Seismic Wave Analysis and Real-time Monitor: User Manual and Reference Guide Version 2.8.3 January 2018
-
Upload
duongthuan -
Category
Documents
-
view
221 -
download
1
Transcript of SWARM - USGS: Volcano Hazards Program SeedLink Server ... SWARM, Seismic Wave Analysis and Real-time...

SWARM
Seismic Wave Analysis and Real-time Monitor: User Manual and Reference Guide
Version 2.8.3
January 2018

Table of Contents 1 Introduction .......................................................................................................................................... 5
1.1 About ............................................................................................................................................. 5
2 Getting Started ...................................................................................................................................... 5
2.1 System Requirements ................................................................................................................... 5
2.2 Installing SWARM .......................................................................................................................... 5
2.3 Running SWARM ........................................................................................................................... 6
3 Data Sources and Channels ................................................................................................................... 7
3.1 Introduction .................................................................................................................................. 7
3.2 General Usage ............................................................................................................................... 7
3.3 Data Source Types ......................................................................................................................... 8
3.3.1 Winston Wave Server ........................................................................................................... 8
3.3.2 Earthworm Wave Server ....................................................................................................... 9
3.3.3 FDSN Web Services ............................................................................................................. 10
3.3.4 SeedLink Server ................................................................................................................... 11
3.3.5 Files ..................................................................................................................................... 12
4 Helicorder Views ................................................................................................................................. 14
4.1 Introduction ................................................................................................................................ 14
4.2 Wave Inset Panel......................................................................................................................... 15
4.3 Status Bar .................................................................................................................................... 15
4.4 Helicorder Toolbar ...................................................................................................................... 15
4.4.1 Helicorder View Settings ..................................................................................................... 17
5 Wave Views ......................................................................................................................................... 18
5.1 Introduction ................................................................................................................................ 18
5.2 Wave View Settings Dialog ......................................................................................................... 18
5.2.1 View..................................................................................................................................... 19
5.2.2 Wave Options ...................................................................................................................... 21
5.2.3 Spectra Options ................................................................................................................... 22
5.2.4 Spectrogram Options .......................................................................................................... 22
5.2.5 Butterworth Filter ............................................................................................................... 22
6 Wave Clipboard ................................................................................................................................... 23
6.1 Clipboard Toolbar ....................................................................................................................... 24
6.2 Pick Mode.................................................................................................................................... 25
6.2.1 P and S ................................................................................................................................. 25
6.2.2 Coda .................................................................................................................................... 27
6.2.3 Pick Menu ............................................................................................................................ 28
6.2.4 Event Dialog ........................................................................................................................ 29
6.3 Status Bar .................................................................................................................................... 34
7 Real-time Monitor ............................................................................................................................... 35
8 Real-time Wave Viewer ...................................................................................................................... 36
9 RSAM ................................................................................................................................................... 36
9.1 RSAM Ratio ................................................................................................................................. 37
9.2 RSAM Settings ............................................................................................................................. 37
10 Map Interface .................................................................................................................................. 38
10.1 Introduction ................................................................................................................................ 38
10.2 Displaying Station on Map .......................................................................................................... 38
10.3 Map Toolbars .............................................................................................................................. 39
10.4 Map Settings ............................................................................................................................... 40
10.4.1 Displaying NEIC Events ........................................................................................................ 40
10.5 Ruler Tool .................................................................................................................................... 41
10.6 Understanding Map Scale ........................................................................................................... 41
10.7 Channel Interactions ................................................................................................................... 41
10.8 Wave Panel Time Spans .............................................................................................................. 41
10.9 Map Packs ................................................................................................................................... 41
11 Events .............................................................................................................................................. 42
11.1 Importing Events ......................................................................................................................... 42
11.2 Map Display................................................................................................................................. 42
11.3 Event View .................................................................................................................................. 43
12 Menus ............................................................................................................................................. 45
12.1 File ............................................................................................................................................... 45
12.1.1 Options ................................................................................................................................ 46
12.2 Layout .......................................................................................................................................... 47
12.3 Window ....................................................................................................................................... 47
12.3.1 Kiosk Mode .......................................................................................................................... 47
12.4 Help ............................................................................................................................................. 48
13 Configuration Files .......................................................................................................................... 48
13.1 Swarm.config .............................................................................................................................. 48
13.2 DataSources.config ..................................................................................................................... 48
13.3 WaveDefaults.config ................................................................................................................... 48
13.4 SwarmGroups.config ................................................................................................................... 48
13.5 SwarmMetadata.config............................................................................................................... 49
13.6 NTP.config ................................................................................................................................... 49
13.7 RsamDefaults.config ................................................................................................................... 50
13.8 PickSettings.config ...................................................................................................................... 50
14 Support............................................................................................................................................ 50

1 Introduction
1.1 About
SWARM, Seismic Wave Analysis and Real-time Monitor, is a Java application designed
to display and analyze seismic waveforms in real-time. SWARM is a functional replacement to the
traditional helicorder, but also has many other tools for visualizing wave forms, such as frequency
spectra plots and spectrograms. Other features include ability to obtain station metadata for plotting
on map, and support for IRIS DMC connections. Recent additions include ability to view NEIC events and
do basic picks.
SWARM was developed at the Alaska Volcano Observatory (AVO) in 2004 and is still used at
various volcano observatories around the world. The latest version of SWARM can be obtained from
https://volcanoes.usgs.gov/software/swarm/download.php.
2 Getting Started
2.1 System Requirements
SWARM is platform independent (will run on any operating system) but requires a graphical display and
a Java Virtual Machine 1.8 or greater. Due to the large volume of data and complex calculations
performed it is recommended to run on SWARM with modern specifications for memory and processing
speed. The less memory and processing speed the computer has, the more likely that SWARM’s
performance is affected when pulling and analyzing large data sets. Minimum screen display of 1024 x
768 is also recommended. Maximizing the application window to full screen size will provide the best
user experience.
2.2 Installing SWARM
To install SWARM, unzip the download swarn-x.y.z-bin.zip file downloaded from the USGS SWARM
website. In Windows, your unzipped swarm-x.y.z directory will look like this:

Figure 1 Swarm Directory Contents
2.3 Running SWARM
On Windows, double clicking on swarm_console.bat will open the SWARM user interface. If nothing
happens, you can run the application from a command (or DOS) prompt to see if there are any errors
that can be used for troubleshooting. On Linux or Mac operating systems, you will need to execute
swarm.sh from the terminal (command-line).

3 Data Sources and Channels
3.1 Introduction
After starting SWARM, a panel will be visible on the left side of the
main screen. This is the Data Source Chooser and Channel Selector.
It’s possible to adjust the size of the two panels by adjusting the split
line in the center, either by dragging with the mouse or clicking on
one of the small arrows.
The Data Source Chooser, the top half of the panel, is used
to select the source of the waveform or helicorder data. The box
contains the list of all available data sources, both ones that have
been used before and new ones that are created.
The Channel Selector, the bottom half of the panel, is used
to select a channel, either
the waveform or the helicorder. Once a data source is selected, the
Channel Selector will
be populated with the available channels. The contents of both
theWaves and Helicorders
lists depend on the data available from the selected data source.
Figure 2Data source chooser and the channel selector
3.2 General Usage
SWARM is preconfigured with AVO Winston Wave Server. To add another data source click on the ‘New
data source’ icon . Existing data sources can be modified by clicking on the ‘Edit data source’ icon .
The next icon will let you collapse the data source trees. To remove an existing data source, select
the data source to delete and click on ‘Remove data source’ icon . A data source can be refreshed by
clicking on it and selecting the ‘Refresh data source’ icon .

The icon in the upper right lets the user dismiss the whole data source chooser window if
more space is desired. To get it back, type CTRL-D or go to the Window menu and select Data Chooser.
The icons associated with the different data sources have the following meaning:
A data server that the user manually added with the ‘New data source’ option.
A data server that is in the DataSources.config file. The small padlock denotes that it is not
possible to edit or delete it from SWARM.
A data server that is broken; e.g. not responding.
Data channels available after opening a wave in a file (e.g. SEED, SAC format) from the File
menu.
Double clicking on a data source will cause a channel tree to appear, listing the available channels.
Double clicking on a channel will bring up a helicorder. Alternatively, it’s possible to select a channel (or
channels, with CTRL- or Shift-click on Windows) and press one of the five buttons at the bottom of the
data chooser:
Opens helicorder views
Puts waves on the clipboard
Puts waves on the real-time monitor
Opens waves in the real-time view window
Opens RSAM viewer
Shows channels on a map
3.3 Data Source Types
Clicking on the ‘New data source’ icon will open a New Data Source dialog window. Currently supported
data source types for SWARM are Winston Wave Server, Earthworm Wave Server, FDSN WS, and
SeekLink Server.
3.3.1 Winston Wave Server
Winston is a Java-based seismic wave server developed by USGS that provides data and plots to clients.
It can be obtained from https://volcanoes.usgs.gov/software/winston/. Connection to Earthworm
requires the IP address or host name of the server, port number, and communication time out in
seconds.

Figure 3 Adding new Winston data source
3.3.2 Earthworm Wave Server
Earthworm is an open-source software system used globally for regional local network seismology.
Earthworm Wave Server is essentially the wave_serverV module of the Earthworm system. Connection
to Earthworm requires the IP address or host name of the server, port number, and communication
time out in seconds. Earthworm data provides raw wave data only. The Gulp size setting determines
how much past data to retrieve at a time, and Gulp delay determines how much time between past data
retrieval.

Figure 4 Adding new Earthworm data source
3.3.3 FDSN Web Services
International Federation of Digital Seismograph Networks (FDSN) provides RESTful web service
interfaces for accessing wave data. See https://www.fdsn.org/webservices/ for more information on the
FDSN web services.
To add an FDSN web service data source, enter in the dataselect and station URL. A list of
available web services can be found at https://www.fdsn.org/webservices/datacenters/. Then click on
the Update button to get a list of Networks to choose from. You may choose to filter the data further
with station, channel, and location information.
The Gulp size setting determines how much past data to retrieve at a time, and Gulp delay
determines how much time between past data retrieval.

Figure 5 Adding new FDSN data source
3.3.4 SeedLink Server
SeedLink protocol transmits data packets in 512-byte Mini-SEED records. IRIS Data Management Center
(DMC) hosts a public accessible SeedLink server. More information on SeedLink and IRIS DMC’s server
can be found at http://ds.iris.edu/ds/nodes/dmc/services/seedlink/. To connect to a SeedLink server
enter in the IP address or host name, and the port.

Figure 6 Adding a new SeedLink data source
3.3.5 Files
Swarm can open waveform data stored in files through the File -> Open File… menu. Supported read
formats are SAC, SEED, miniSEED, SEISAN, Matlab-readable text file, and WIN.
3.3.5.1 Matlab-readable text file
Matlab-readable text files do not contain station information. While the station information is not
strictly necessary to display the data in helicorder and most other views, it may be required in some
cases, such as in the particle motion view. Swarm will attempt to obtain SCNL information using the
filename. Simply name the files with the SCNL information separated by space or underscore (_), e.g.
MLLR_EHE.txt, MEV SHN OP.txt, etc.
3.3.5.2 WIN
The Japanese WIN format does not contain station or time zone information. This information can be
provided through a configuration file that Swarm will prompt for when opening WIN files. By default,
the file open dialog will filter on .config extension but the configuration file can be called anything and
located anywhere. The first line of the file must contain the time zone, followed by the name for each
channel in the files. If specified time zone is not valid it will default to ‘GMT’. If configuration file is not
available or readable it will default to ‘UTC’. Abbreviations may work, but it is recommended to use the
full time zone name (e.g. Americas/New_York, Atlantic/Reykjavik). See
https://docs.oracle.com/cd/B13866_04/webconf.904/b10877/timezone.htm for a list of time zones that
can be used. Example WIN file configuration file content:
Asia/Tokyo
IJEN EHZ ID
RAUN EHZ ID
In the above example, Tokyo’s time zone will be used when determining the wave times. The
first channel will be mapped to IJEN EHZ ID (Station: IJEN, component: EHZ, and network: ID). The
second to RAUN EHZ ID. If channel names are not provided it will use channel numbers as names (e.g. 0,
1, 2, etc.).
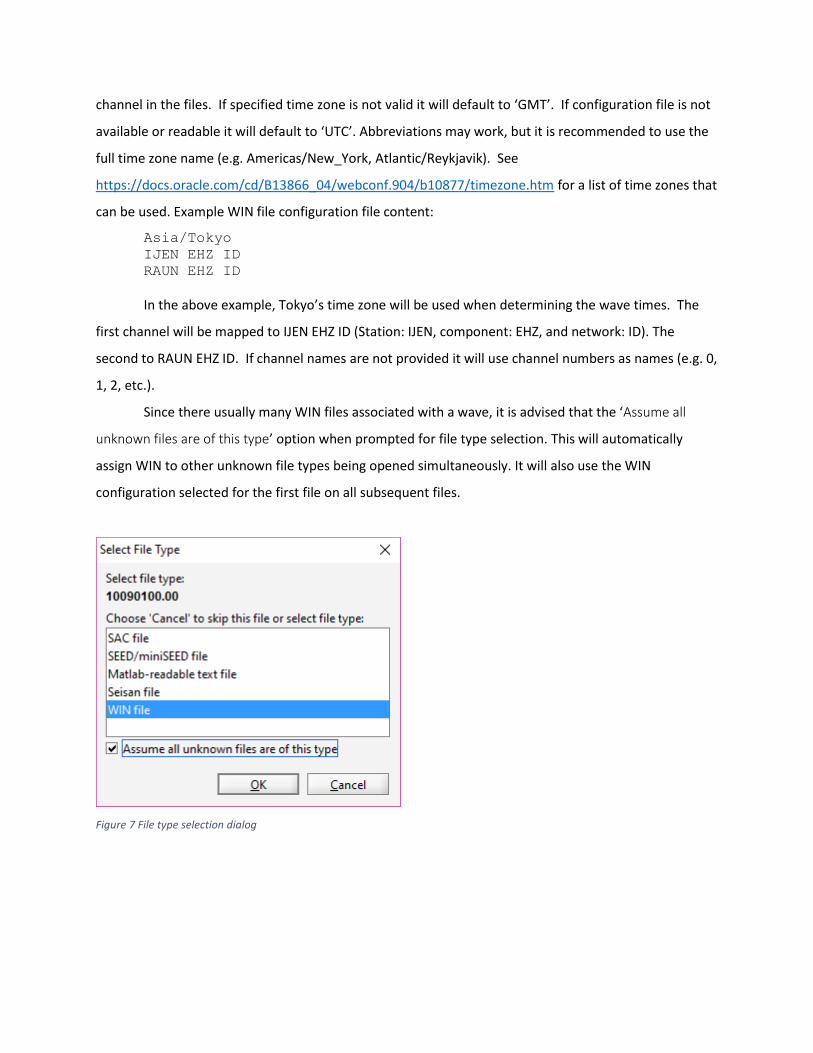
Since there usually many WIN files associated with a wave, it is advised that the ‘Assume all
unknown files are of this type’ option when prompted for file type selection. This will automatically
assign WIN to other unknown file types being opened simultaneously. It will also use the WIN
configuration selected for the first file on all subsequent files.
Figure 7 File type selection dialog
4 Helicorder Views
4.1 Introduction
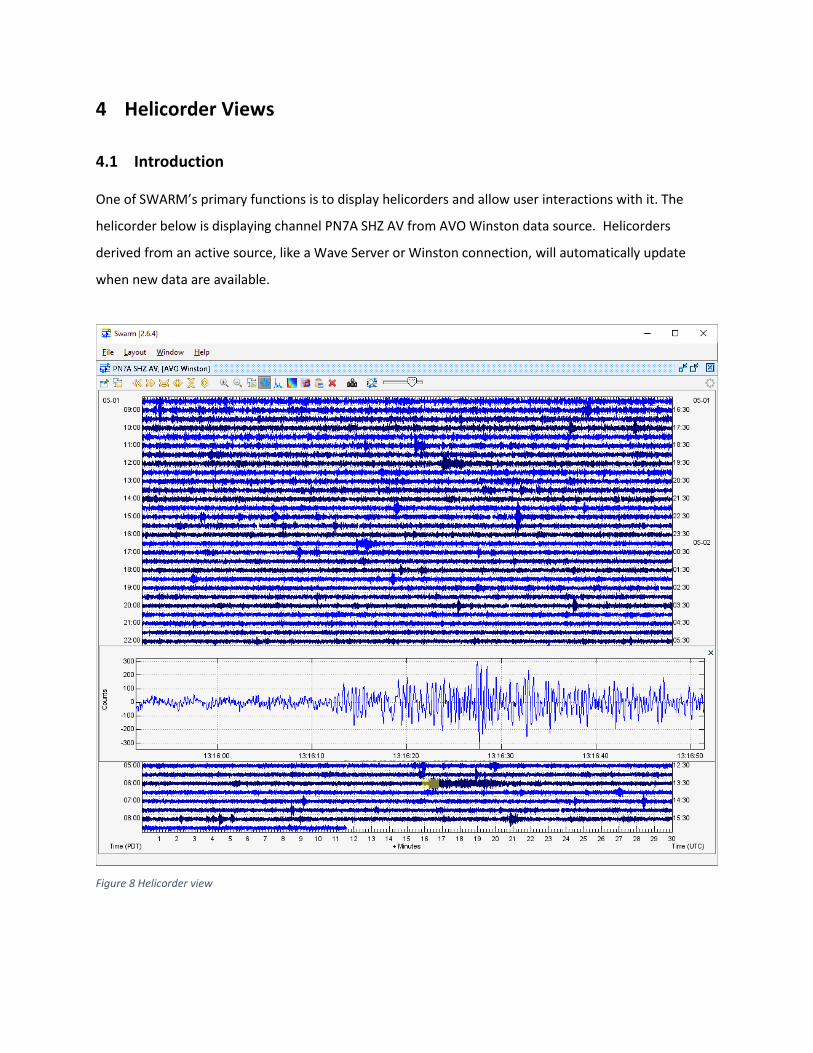
One of SWARM’s primary functions is to display helicorders and allow user interactions with it. The
helicorder below is displaying channel PN7A SHZ AV from AVO Winston data source. Helicorders
derived from an active source, like a Wave Server or Winston connection, will automatically update
when new data are available.
Figure 8 Helicorder view
4.2 Wave Inset Panel
Clicking on the helicorder opens a wave panel for a magnified view of the area highlighted in yellow. See
section on Wave Views for more information on wave view settings and types.
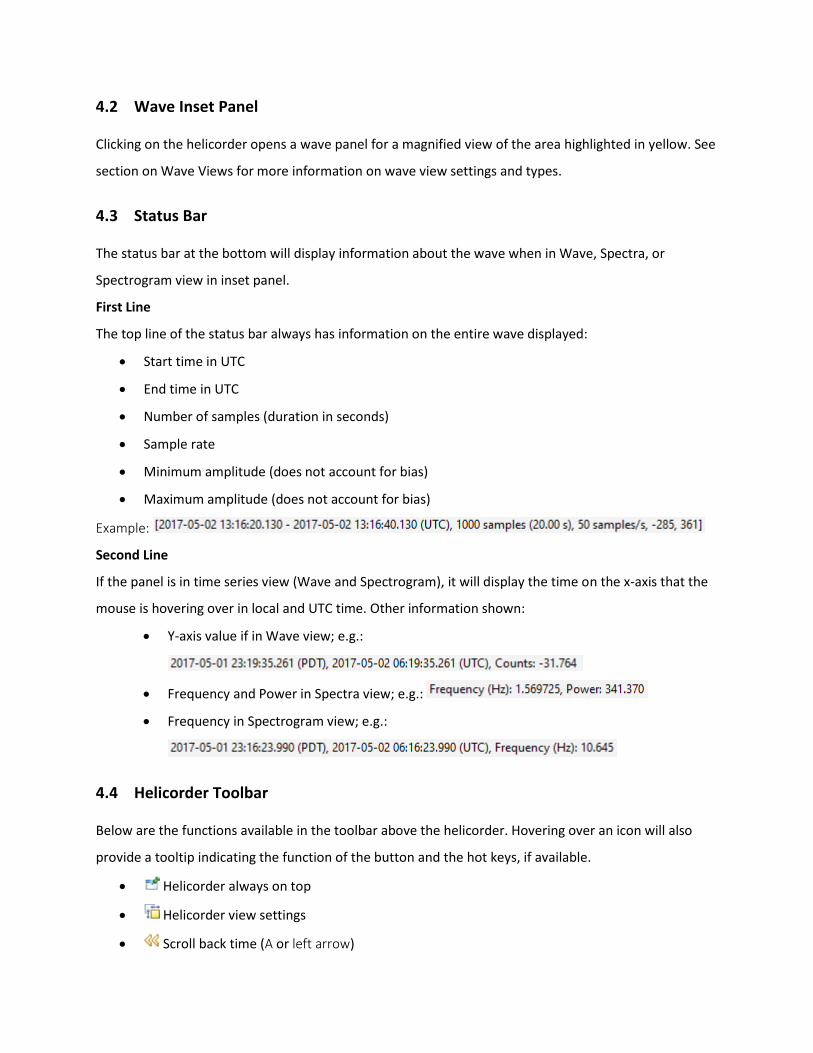
4.3 Status Bar
The status bar at the bottom will display information about the wave when in Wave, Spectra, or
Spectrogram view in inset panel.
First Line
The top line of the status bar always has information on the entire wave displayed:
Start time in UTC
End time in UTC
Number of samples (duration in seconds)
Sample rate
Minimum amplitude (does not account for bias)
Maximum amplitude (does not account for bias)
Example:
Second Line
If the panel is in time series view (Wave and Spectrogram), it will display the time on the x-axis that the
mouse is hovering over in local and UTC time. Other information shown:
Y-axis value if in Wave view; e.g.:
Frequency and Power in Spectra view; e.g.:
Frequency in Spectrogram view; e.g.:
4.4 Helicorder Toolbar
Below are the functions available in the toolbar above the helicorder. Hovering over an icon will also
provide a tooltip indicating the function of the button and the hot keys, if available.
Helicorder always on top
Helicorder view settings
Scroll back time (A or left arrow)

Scroll forward time (Z or right arrow)
Compress X-axis (Alt and left arrow)
Expand X-axis (Alt and right arrow)
Compress Y-axis (Alt and down arrow)
Expand Y-axis (Alt and up arrow)
Decrease zoom time window (+)
Increase zoom time window (-)
Wave view settings (?)
Wave view (W or ,)
Spectra view (S or .)
Spectrogram view (G or /)
Particle motion view (O or ‘)
Copy inset to clipboard (C or Ctrl-C)
Remove inset wave (Delete or Esc)
Save helicorder image (P)
Toggle between adjusting helicorder scale and clip

4.4.1 Helicorder View Settings
There are two main ways in which the user can interact with
the a helicorder view: manipulating the helicorder view itself
or zooming in and looking at the underlying waveform. All of
the settings for the helicorder view can be manipulated in
the helicorder view settings dialog which can be opened by
clicking on the button.
4.4.1.1 Axes
X is the number of minutes to display along the bottom
of the helicorder. Default is 15 minutes.
Y is the total time in hours to display on the helicorder.
Default is 12 hours.
View time setting allows user to set the time at the
bottom of the helicorder. Default is ‘Now’, or current time.
The format for specifying the bottom view time is
YYYYMMDD or, if more resolution is needed,
YYMMDDHHMMSS.
4.4.1.2 Zoom
Zoom determines the amount of time, in seconds, on
either side of the mouse cursor to zoom.
Also available is a button to display the Wave View
Settings Dialog.
4.4.1.3 Clipping
Show clip will display the data in red when clip threshold is exceeded.
Audible clipping enables audio alarm when clip threshold is exceeded.
Alert frequency sets the frequency of audio alarm in minutes.
4.4.1.4 Other
Refresh is the number of seconds between attempts to refresh the helicorder with the latest
data. The default value is 15.
Scroll size is the number of helicorder rows to scroll up or down on user scroll requests with
mouse-wheel or scroll bar buttons.
Figure 9 Helicorder View Settings

Force center forces each helicorder sample to be centered on its current line. This effectively
eliminates all drift and is useful for broadband stations with lots of low frequency energy. This
feature is to be used with caution though: it can make an obviously false signal look like an
earthquake.
Auto-scale toggles helicorder auto-scaling on and off. When auto-scaling is on an attempt is
made to produce a “pleasant” looking helicorder. If this fails, or if more control over the
appearance of the helicorder is wanted, set the One bar range.
One bar range is the number of counts on either side of zero that make up one bar. For
example, if there is a seismometer that reports counts between -3600 and 3600 and a bar range
of 1200 is selected, a full-range waveform will take 3 bars, overlapping one above and one
below. This is best understood through experimentation.
Clip threshold allow user to set a counts threshold after which the trace will be shown in red.
5 Wave Views
5.1 Introduction
Wave views are one of the fundamental data views in SWARM. There are four wave view types:
standard wave view, spectra, spectrogram, and particle motion. Any time a wave view is seen in SWARM
there are settings associated with that individual view. For example, a wave view pasted into the
clipboard from somewhere else has its own view settings.
5.2 Wave View Settings Dialog
The Wave View Settings allow users to change how to look at the plots. The settings can be edited by
clicking on the wave view settings icon or pressing the ? key.

Figure 10 Wave View Settings dialog window
5.2.1 View
The general display mode can be set under the View section. Options are Wave, Spectra, Spectrogram,
or Particle Motion.
5.2.1.1 Wave
W or , will also toggle Wave view mode. To apply filter, press the F key. To apply rescale, press the R
key.

Figure 11 Wave view
In certain windows (e.g. Helicorder View, Clipboard), users can zoom in on a wave by left clicking and
dragging over the portion of the wave you want to see. The selected section will highlight in yellow
prior to zooming in.
When in Helicorder View, if Duration Magnitude option is enabled (see Options under File menu)
users can left click on the wave panel to create two green markers. Once marked, the status bar at the
bottom will display the duration time and magnitude at the end of the first line. Example:
If the wave panel is subsequently copied to the Clipboard, the duration markers become Coda markers
for use in Pick Mode.
5.2.1.2 Spectra
S or . will also toggle Spectra view mode. To apply filter, press the F key.
Figure 12 Spectra view
5.2.1.3 Spectrogram
G or / will also toggle Spectrogram view mode. To apply filter, press the F key.
Figure 13 Spectrogram view

5.2.1.4 Particle Motion
O or ‘ will also toggle Particle Motion view mode. To apply filter, press the F key.
Figure 14 Particle Motion view
The particle motion view will plot the amplitude of one component against the amplitude of another
component from the same station. The plot begins as red at start time and gradually turns to blue at end
time. The gray number next to each plot indicates the limit of the x and y axis. Support for this view is
limited to the following:
Traditional (Z N E), triaxial (A B C), non-traditional orthogonal (1 2 3), and optional component
(U V W) orientation codes.
In helicorder view and clipboard
For channels that have metadata and associated SCNL information since retrieval of the wave
form for other components is automated. Some wave data, such as those imported from
Matlab-readable text files, may not have the required station and channel information to
perform this plot. See section 3.3.5.1 for more information on getting Swarm to recognize SCNL
information from Matlab-readable text files.
5.2.2 Wave Options
Remove bias will remove the mean value from the wave if on. It is enabled by default.
Use calibrations, if enabled, will use conversion factor information available from the data
source to convert the data to real velocity.
Min. Amplitude is the y-axis minimum limit.
Max. Amplitude is the y-axis maximum limit.
Auto scale will scale the y-axis automatically if selected. The y-axis will be set to contain the
minimum and maximum values attained by the wave in the shown time interval.
Manual scale, if selected, will set the y-axis to the user specified Min. Amplitude and Max.
Amplitude settings.
Persistant rescale, if unchecked, will rescale the x and y axis to use the whole screen based on
the current max amplitude being displayed.
5.2.3 Spectra Options
Log Power, if checked, will set the power axis to log mode.
Log frequency, if checked, will set the frequency axis to log mode.
5.2.4 Spectrogram Options
Auto scale to scale power automatically.
Manual scale to scale power manually.
Min. frequency specifies the x-axis minimum in Spectra view and the y-axis minimum limit in
Spectrogram view.
Max. frequency specifies the x-axis minimum in Spectra view and the y-axis maximum limit in
Spectrogram view. While SWARM will allow the maximum frequency to be set to any positive
value greater than the minimum frequency, this value will adjust automatically if it is greater
than the Nyquist frequency of the wave being manipulated.
Overlap (%) determines the amount of overlap in consecutive FFTs. Legal values are between 0
and 95. The higher this value is set the smoother the FFT will look. However, artifacts can occur
when excessive overlap is used.
Window size
FFT points is the number of samples to be used in each FFT. Adjusting this value affects the
dimensions of each pixel of the spectrogram. Increasing the number of samples increases the
vertical resolution while decreasing the horizontal resolution. Decreasing the number of samples
increases the horizontal resolution while decreasing the vertical resolution.
Power range
5.2.5 Butterworth Filter
Enabled checkbox will turn Butterworth filtering on and off.
Low pass filter removes signal above corner frequency (Max. frequency) setting.
High pass filter removes signals below corner frequency (Min. frequency) setting.
Band pass filter removes signals above Max. frequency or lower than Min. frequency.

Zero phase shift option runs the specified filter both forward and backward. This eliminates any
phase shift effects due to the filter at the expense of effectively doubling the filter order.
Min. frequency specifies the lower bound to filter on.
Max. frequency specifies the upper bound to filter on.
Order slider bar sets the order of the filter as even values between 2 and 8, inclusive. In general,
the higher the order the steeper the cutoff at the corner frequencies.
6 Wave Clipboard
The Wave Clipboard holds as many simultaneous wave views as desired. This allows users, for example,
to compare arrival times across many stations, look at the same waveform with three different filters, or
compare different events from one station.
The user interface consists of a clipboard toolbar at the top and then as many stacked
clipboard wave views as desired, each with its own toolbar. It’s also possible to zoom into any portion of
a wave by left clicking and dragging over the portion to zoom in on (the transparent yellow block is
showing the act of zooming). The status bar at the bottom displays information about the wave. The
panel shaded blue is the selected wave for the purposes of the clipboard toolbar.

Figure 15 Wave Clipboard
6.1 Clipboard Toolbar
Below are the functions available in the clipboard toolbar. Hovering over an icon will also provide a
tooltip indicating the function of the button and the hot keys, if available.
Open a saved wave
Save selected wave
Save all waves
Synchronize times with helicorder wave
Synchronize times with selected wave
Sort waves by nearest to selected wave
Set clipboard wave size
Remove all waves from clipboard
Save clipboard image (P)
Pick Mode

Scroll back time (A or left arrow)
Scroll forward time (Z or right arrow)
Go to time (Ctrl-G)
Shrink sample time 20% (Alt left arrow or +)
Expand sample time 20% (Alt right arrow or -)
Last time setting (Backspace)
Wave view settings (?)
Wave view (W or ,)
Spectra view (S or .)
Spectrogram view (G or /)
Particle motion view (O or ‘)
Place another copy of wave on clipboard (C or Ctrl-C)
Move wave(s) up in clipboard (Up arrow)
Move wave(s) down in clipboard (Down arrow)
Remove wave from clipboard (Delete or Esc)
6.2 Pick Mode
When the button is enabled, users are able to make picks for P and S times, and coda start and end
times in the wave and spectrogram view for each panel. To make a pick, right click over the desired pick
time in the appropriate channel, go down the Pick menu, and select the desired pick type.
Locating origin is not yet supported in Swarm.
6.2.1 P and S
When doing a P or S pick, users must traverse all the way down the menu tree to determine onset
(Emergent or Impulsive), polarity, and weight (0 to 4) of the pick. The weight selected will be applied as
the lower and upper uncertainty. The amount of time represented by each weight is dependent on each
user’s pick settings. See section 6.2.3.16.2.3 for more information on pick settings. Once a pick is made,
a vertical line will display over the pick time, along with a tag indicating the phase, onset, and polarity.
The uncertainty times will be highlighted.
If other channels from the same station exists in the clipboard, the P and S pick markers will be
displayed there as well. The pick tag on the channel where it was originally selected will have a colored
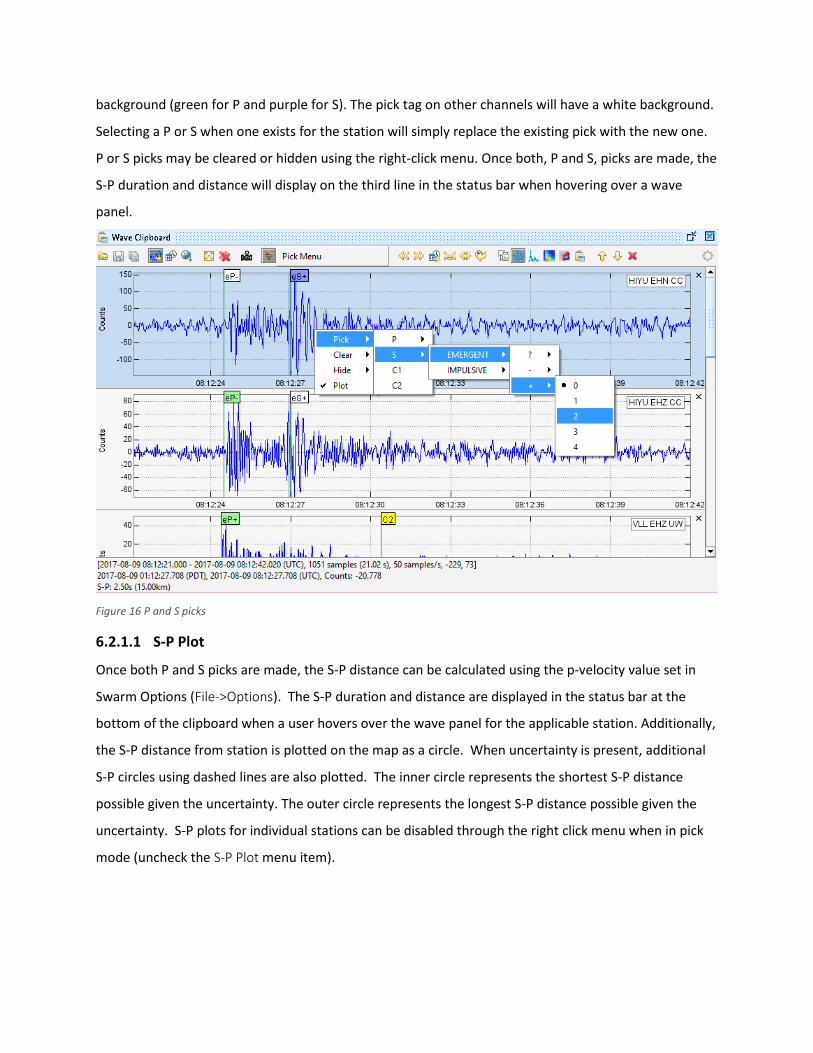
background (green for P and purple for S). The pick tag on other channels will have a white background.
Selecting a P or S when one exists for the station will simply replace the existing pick with the new one.
P or S picks may be cleared or hidden using the right-click menu. Once both, P and S, picks are made, the
S-P duration and distance will display on the third line in the status bar when hovering over a wave
panel.
Figure 16 P and S picks
6.2.1.1 S-P Plot
Once both P and S picks are made, the S-P distance can be calculated using the p-velocity value set in
Swarm Options (File->Options). The S-P duration and distance are displayed in the status bar at the
bottom of the clipboard when a user hovers over the wave panel for the applicable station. Additionally,
the S-P distance from station is plotted on the map as a circle. When uncertainty is present, additional
S-P circles using dashed lines are also plotted. The inner circle represents the shortest S-P distance
possible given the uncertainty. The outer circle represents the longest S-P distance possible given the
uncertainty. S-P plots for individual stations can be disabled through the right click menu when in pick
mode (uncheck the S-P Plot menu item).

Figure 17 S-P plot
6.2.2 Coda
Coda picks can be made with a P pick and either a Coda 1 (C1) or Coda 2 (C2) pick, where C1 or C2 pick
time is greater than the P pick time. Users can also pick C1 and C2 (order does not matter) to calculate
coda duration and magnitude. As with the P and S picks, right-click menu options exist to hide or clear
coda picks. The background color of the coda marker tags will be yellow. Once both coda picks are

made, or a P and one coda pick is made, the coda duration and magnitude for the channel are displayed
in the third row of the status bar when hovering over the applicable panel. Calculations use the same
Duration Magnitude parameters configured under File->Options (see section 12.1.1.2.) The average
coda duration and magnitude of all coda windows on the clipboard are also displayed.
Figure 18 Coda picks
When a wave is added to the clipboard from the helicorder view, if the wave had the green duration
markers on them in helicorder view, they are translated to coda markers in the clipboard and will be
visible in Pick Mode.
6.2.3 Pick Menu
When Pick Mode is enabled, a Pick Menu is displayed to the right of the pick button. Un-toggling the
pick button will hide the Pick Menu again.
Figure 19 Pick Menu
6.2.3.1 Settings
Selecting Settings in the pick menu, or pressing Ctrl-S, will open up the pick settings menu. Here users
can select the units and values that the uncertainty weights will map to. If # Samples is selected, users
should enter in the number of samples that the weight will map to. The actual uncertainty time will
then be based on the sample rate also. If # Milliseconds is selected, the uncertainty time each weight

will map to is the actual value entered in the settings dialog. Changes made to the settings will be
stored in PickSettings.config.
Figure 20 Pick Settings Menu
6.2.3.2 Clear All Picks
The Clear All Picks menu will remove all picks from all channels in the clipboard. This feature may be
useful if a user has completed processing of one event and would like to begin working on a new event
without clearing the clipboard contents. There is also an option to remove all picks from a single
channel through the right-click menu.
6.2.3.3 Open Event Dialog
Opens the Event Dialog. See section 6.2.4.
6.2.4 Event Dialog
The Event Dialog can be used to import existing events or export events generated in Swarm. The Event
Dialog can also be used to run the Hypo71 locating algorithm on picks made in the clipboard.

Figure 21 Event Dialog

6.2.4.1 Event Details
If an event is imported, the event summary details will be displayed here. When exporting an event, the
details specified here will be exported with the event.
6.2.4.2 Hypo71 Input
Users can provide input to Hypo71 locating algorithm in two ways, through clipboard picks or Hypo71
input file. The recommended way to do earthquake locating is through picks in Swarm. Make at least 1
pick in the clipboard to enable the Use Clipboard Picks option. In order to perform locating using picks,
note the following:
Make a P pick on three stations for fixed depth solution. Make a pick on at least 4 stations for
non-fixed depth solution.
Swarm Hypo71 uses F-P duration as input for magnitude. For each channel with a P pick, pick
the event (earthquake) end time using one of the coda pick options (C1 or C2). Swarm will take
whichever coda pick is later and use it to calculate F-P duration. If no coda picks are made
magnitude will not be calculated for that station.
Each station must reside in the same quadrant (i.e. NW, SW, NE, SE). This is a limitation of the
Hypo71 algorithm.
Trial hypocenter is the epicenter of the station with the earliest P-arrival (+0.1 degrees) and a
depth of 5km.
The default crustal model in Swarm is:
3.30 0.0 5.00 1.0 5.70 4.0 6.70 15.0 8.00 25.0
The first column is the P-velocity in km/sec for a given layer. The second column is the depth in km to
the top of the layer. You can change the Swarm crustal model default by creating a text file called
DefaultVelocityModel.txt under Swarm directory, copying above data, and editing as desired. You can
also load crustal model files by other names through the browse button .
Figure 22 Use Clipboard Picks

For Use Input File option, select the Hypo71 input file by clicking on the browse button . Refer
to Hypo71 manual for its input file format specifications.
Figure 23 Use Input File
Once you have made your input type selection, click the Run button to run Hypo71. If there are
insufficient phase picks, an error message will pop-up and the run is aborted. Otherwise, Hypo71 is
executed and results will display under Hypo71 Ouptut.
Regardless of which method is being used, the Hypo71 settings should be reviewed by clicking
on . This will open a dialog window to allow editing of the settings. There are two categories
of settings:
1. KSING: By default, Swarm uses the original SINGLE subroutine which only supports in-network
earthquake locating. To allow use of the modified SINGLE subroutine to locate earthquakes
outside of network, select the second option. This will extend the distance weighting so that
distance stations will still be used in the location procedure. Refer to the Hypo71 manual for
further details on this option.
2. Test values: According to the Hypo71 manual the “standard values (initiated by the program)
are appropriate for earthquakes recorded by the USGS California Network of stations. Careful
consideration should be given to their definitions and the values appropriate to a given set of
data before this program is used.” Refer to the Hypo71 manual for definitions of these test
variables.
In addition to the inputs above, ensure that the station location information is available in
Swarm either through the data source or metadata configuration. If available, also provide station delay
and FMAG correction for more accurate location calculations. See section 13.5 for more information on
metadata configuration.
6.2.4.3 Hypo71 Output
Once Hypo71 has run, you will see some key output in this section:

Figure 24 Hypo71 output
Underneath the output are the following buttons:
View – View full output text in a pop-up.
Plot – Plot event on map.
Save –Save output to text file.
Clear – Clear Hypo71 results.
The Hypo71 output text will contain information on station input, crustal model input, control card,
iterations, origin, station results, and travel time residuals. Refer to Hypo71 manual for more details on
output format.
6.2.4.4 QuakeML
Swarm supports event import and export using QuakeML format. For more information on QuakeML,
visit their website at https://quake.ethz.ch/quakeml.
P, S, C1, and C2 picks are imported and displayed if a loaded data source has the
wave data available for the pick channel and time. If the data source for a channel is configured but the
wave form data does not display, ensure that it is loaded by double clicking on it and reimport the file. If
there is still no wave form data, it is likely the data for the given time is not available. The event
description, comment, type, and type certainty are also imported from the file and displayed in Event
Dialog.

Clicking on the Export button will open a file chooser dialog. By default, the
save filename is of the format: Swarm<version>_QuakeML_<user>_<timestamp>.xml. Users
may optionally enter desired file name in the file chooser dialog. It is recommended to save
your picks prior to running Hypo71 in case there is an issue during execution or a future desire
to reprocess the picks. If Hypo71 was executed prior to export, the output file will also contain
origin, magnitude, and arrival data based on the run results.
6.3 Status Bar
The status bar at the bottom will display information about the wave when in Wave, Spectra, or
Spectrogram view.
First Line
The top line of the status bar always has information on the entire wave displayed:
Start time in UTC
End time in UTC
Number of samples (duration in seconds)
Sample rate
Minimum amplitude (does not account for bias)
Maximum amplitude (does not account for bias)
Example:
Second Line
If the panel is in time series view (Wave and Spectrogram), it will display the time on the x-axis that the
mouse is hovering over in local and UTC time. Other information shown:
Y-axis value if in Wave view; e.g.:
Frequency and Power in Spectra view; e.g.:
Frequency in Spectrogram view; e.g.:
Third Line
If the clipboard is in Pick Mode, the third line will display:
S-P duration and distance, if P and S phases are picked.
Coda duration and magnitude, if coda start and end are picked.

Example:
7 Real-time Monitor
Figure 25 Real-time Monitor
The real-time monitor is useful to see new data coming in. Multiple waves can be plotted in the same
window.
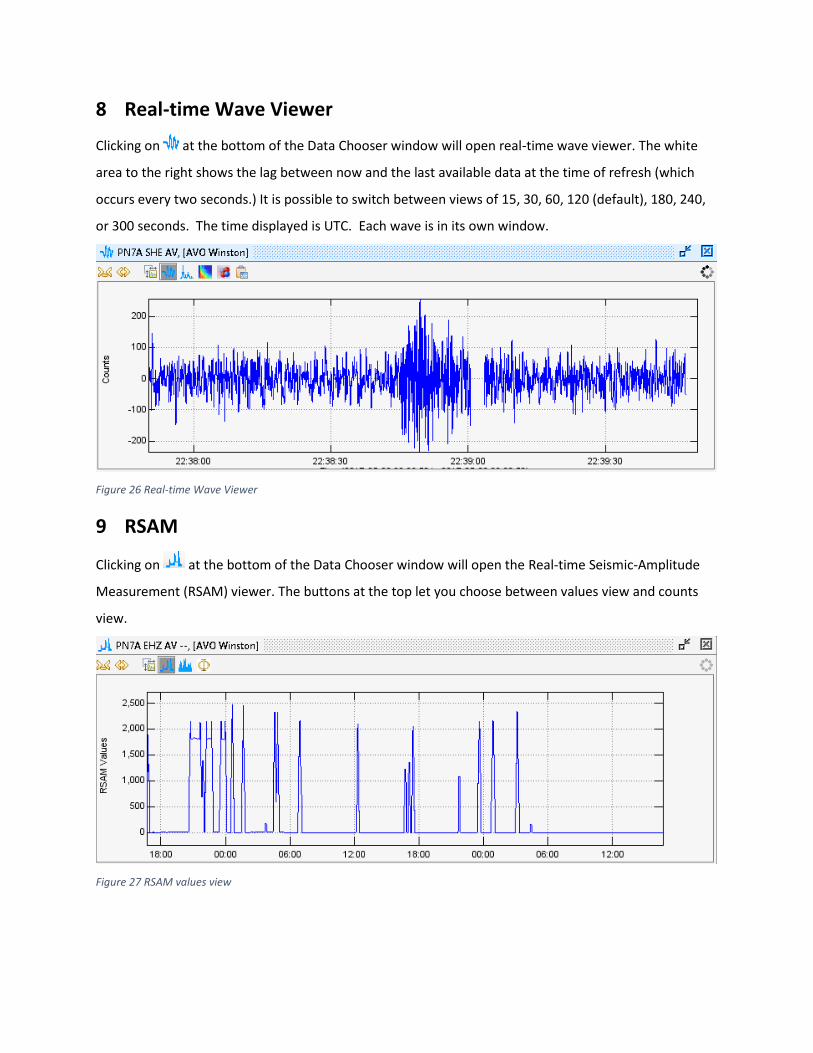
8 Real-time Wave Viewer
Clicking on at the bottom of the Data Chooser window will open real-time wave viewer. The white
area to the right shows the lag between now and the last available data at the time of refresh (which
occurs every two seconds.) It is possible to switch between views of 15, 30, 60, 120 (default), 180, 240,
or 300 seconds. The time displayed is UTC. Each wave is in its own window.
Figure 26 Real-time Wave Viewer
9 RSAM
Clicking on at the bottom of the Data Chooser window will open the Real-time Seismic-Amplitude
Measurement (RSAM) viewer. The buttons at the top let you choose between values view and counts
view.
Figure 27 RSAM values view
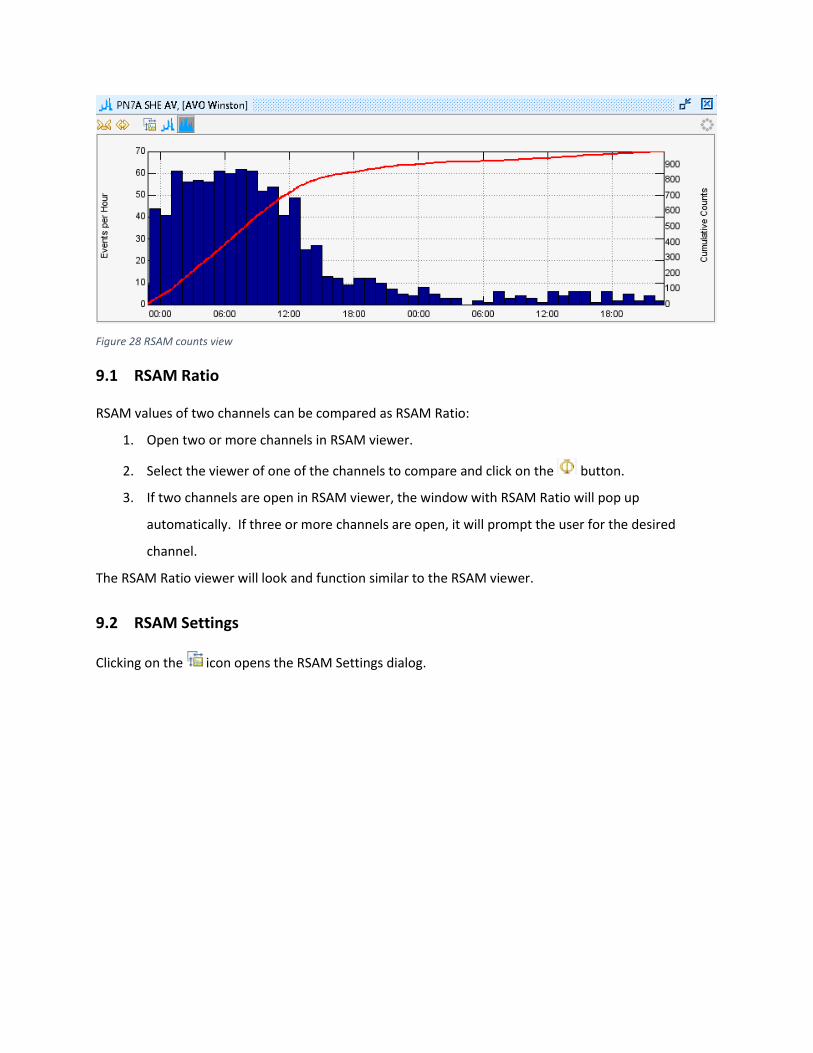
Figure 28 RSAM counts view
9.1 RSAM Ratio
RSAM values of two channels can be compared as RSAM Ratio:
1. Open two or more channels in RSAM viewer.
2. Select the viewer of one of the channels to compare and click on the button.
3. If two channels are open in RSAM viewer, the window with RSAM Ratio will pop up
automatically. If three or more channels are open, it will prompt the user for the desired
channel.
The RSAM Ratio viewer will look and function similar to the RSAM viewer.
9.2 RSAM Settings
Clicking on the icon opens the RSAM Settings dialog.

Figure 29 RSAM Settings
RSAM default settings can be configured using RsamDefaults.config file. Each SWARM execution will
read this file upon start up to determine initial RSAM view configurations.
10 Map Interface
10.1 Introduction
The map shows station locations on geographically projected background imagery. Imagery can be, for
example, shaded DEMS, satellite imagery, aerial photos, coastlines, etc. By default a basic world map
taken from NASA Blue Marble imagery is provided. Custom imagery can be added provided that
unprojected, geo-registered image files are available. See map packs for more information. The map
interface can be opened by checking on the Window -> Map menu item or pressing Ctrl-M.
10.2 Displaying Station on Map
The map can also be opened by clicking on the button at the bottom of the Data Chooser to
display the selected stations or network. For example, selecting the All group under AVO Winston data
source and then clicking on the map button will display the Aleutian arc along with transparent station
markers. To avoid clutter not all stations are displayed at this scale. The number of hidden channels is
displayed in the lower left of the map panel.
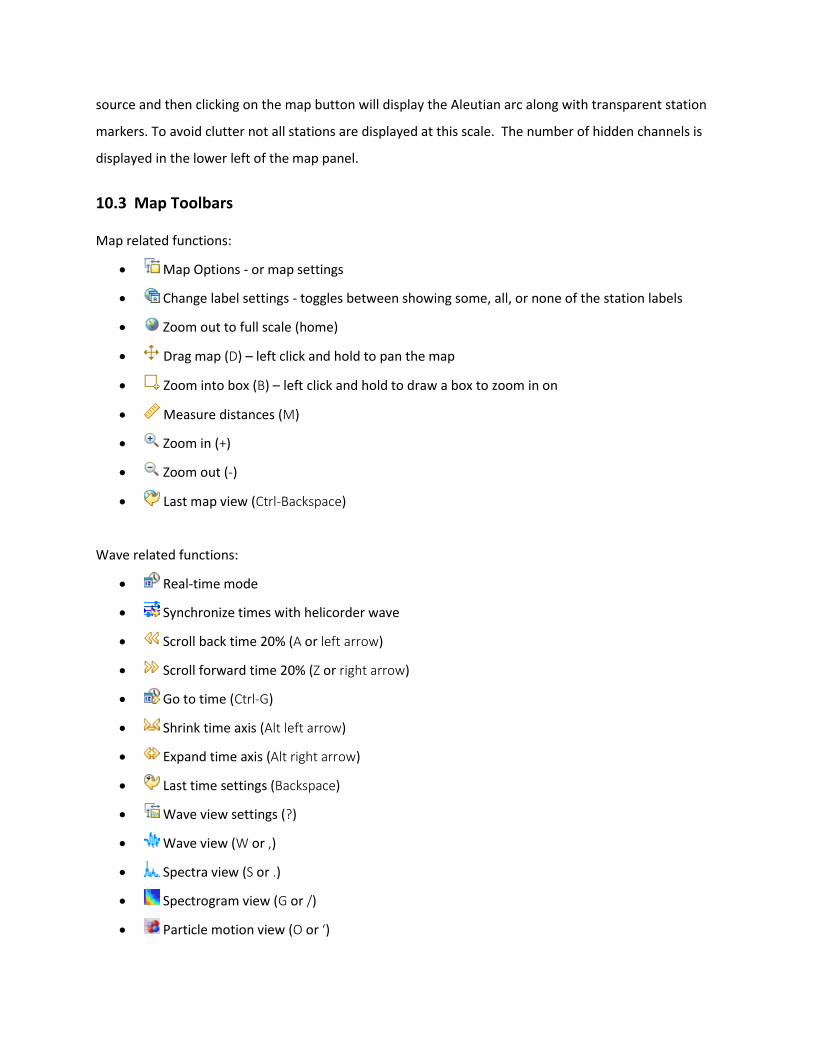
10.3 Map Toolbars
Map related functions:
Map Options - or map settings
Change label settings - toggles between showing some, all, or none of the station labels
Zoom out to full scale (home)
Drag map (D) – left click and hold to pan the map
Zoom into box (B) – left click and hold to draw a box to zoom in on
Measure distances (M)
Zoom in (+)
Zoom out (-)
Last map view (Ctrl-Backspace)
Wave related functions:
Real-time mode
Synchronize times with helicorder wave
Scroll back time 20% (A or left arrow)
Scroll forward time 20% (Z or right arrow)
Go to time (Ctrl-G)
Shrink time axis (Alt left arrow)
Expand time axis (Alt right arrow)
Last time settings (Backspace)
Wave view settings (?)
Wave view (W or ,)
Spectra view (S or .)
Spectrogram view (G or /)
Particle motion view (O or ‘)

Copy inset to clipboard (C or Ctrl-C)
Save map image (P)
10.4 Map Settings
Clicking on will open the Map Settings dialog.
Longitude – Longitude to center map on in decimal degrees
Latitude – Latitude to center map on in decimal degrees
Scale – Map scale in m/pixel
Line – Choose line color used on map
Refresh Seconds – Frequency of map refresh
Channel Labels – None to show no station labels, Some to show some station labels, All to show
all station labels
NEIC Event Summary – Criteria for displaying NEIC event
Figure 30 Map Options
10.4.1 Displaying NEIC Events
To display events from the National Earthquake Information Center (NEIC), choose an option from NEIC
Event Summary. See Events section for more information.

10.5 Ruler Tool
The ruler tool measures great circle distances and azimuths. Distances are measured by left-clicking on
the map at the desired start point and then moving the mouse, while still holding down the left button,
to the desired end point. The distance and azimuth will be displayed at the lower left of the map panel.
Note that because great circles are used, the distances and azimuths may seem counter-intuitive when
looking at large scale maps. Once finished with the ruler, it’s possible to click on the or icons to re-
enable drag box area selection or panning.
10.6 Understanding Map Scale
The map scale is shown in the upper left of the map panel. The scale is accurate at the center of the map
and diminishes in accuracy with distance from the center. Inaccuracy is high for small maps and low for
large maps.
10.7 Channel Interactions
Left-clicking a station marker will produce a wave view on the map. The wave view can be moved
around the map by dragging the title bar. A tie line will point back to the station location. An individual
wave view can be resized by holding the mouse over the panel and moving the mouse wheel. Moving
the mouse to spots not over a wave panel and moving the mouse wheel while holding the CTRL key will
resize all the wave view panels simultaneously.
A left double-click will open a helicorder. Right-clicking on a station marker will show multiple
channels (if present) and allow a selection from them.
10.8 Wave Panel Time Spans
All wave view panels on a map have the same time span. The vertical line on the wave panels always
points to the same time on every panel.
10.9 Map Packs
SWARM uses un-projected, geo-referenced JPEG or PNG images to produce map background. By
default, the imagery is in the mapdata directory of its installation. This can be changed in Swarm.config.
Sub-directories in mapdata are called Map Packs. The binary distribution of SWARM includes world and

NASA 2k Map Packs. The file MapPack.txt provides SWARM the information needed to render the
imagery. This is the first line from MapPack.txt in world subdirectory:
world.jpg, 2700, 1350, -180, 180, -90, 90, 0, 2000000, 0
The comma-separated fields are defined as follows:
1. The name of image being described.
2. Pixel width
3. Pixel height
4. West longitude extent (-180 to 180)
5. East longitude extent (-180 to 180)
6. South latitude extent (-90 to 90)
7. North latitude extent (-90 to 90)
8. Minimum scale (m/pixel) this image will be displayed at
9. Maximum scale (m/pixel) this image will be displayed at
10. Precendence - higher numbered images are rendered on top of lower rendered images.
Note that a longitude extent (west to east) from 175 to -175 spans 10 degrees of longitude and one
from -175 to 175 spans 350 degrees of longitude. That is, the 4th and 5th columns do not specify
minimum and maximum longitude but western and eastern boundaries.
11 Events
11.1 Importing Events
Events can be imported into Swarm by enabling NEIC Event Summary option in Map Settings (see
section 10.4.1.) Events in QuakeML file formats can also be imported from the File -> Import Event
menu. For more information on QuakeML, visit their website at https://quake.ethz.ch/quakeml.
11.2 Map Display
Events displayed on the map are represented by unlabeled circles as markers. The size and color of the
marker is based on how recent the event is, and its magnitude. The larger the magnitude, the larger the
marker. Below table shows the colors associated with the age of event.
Event Age Color
< 1 hour Red
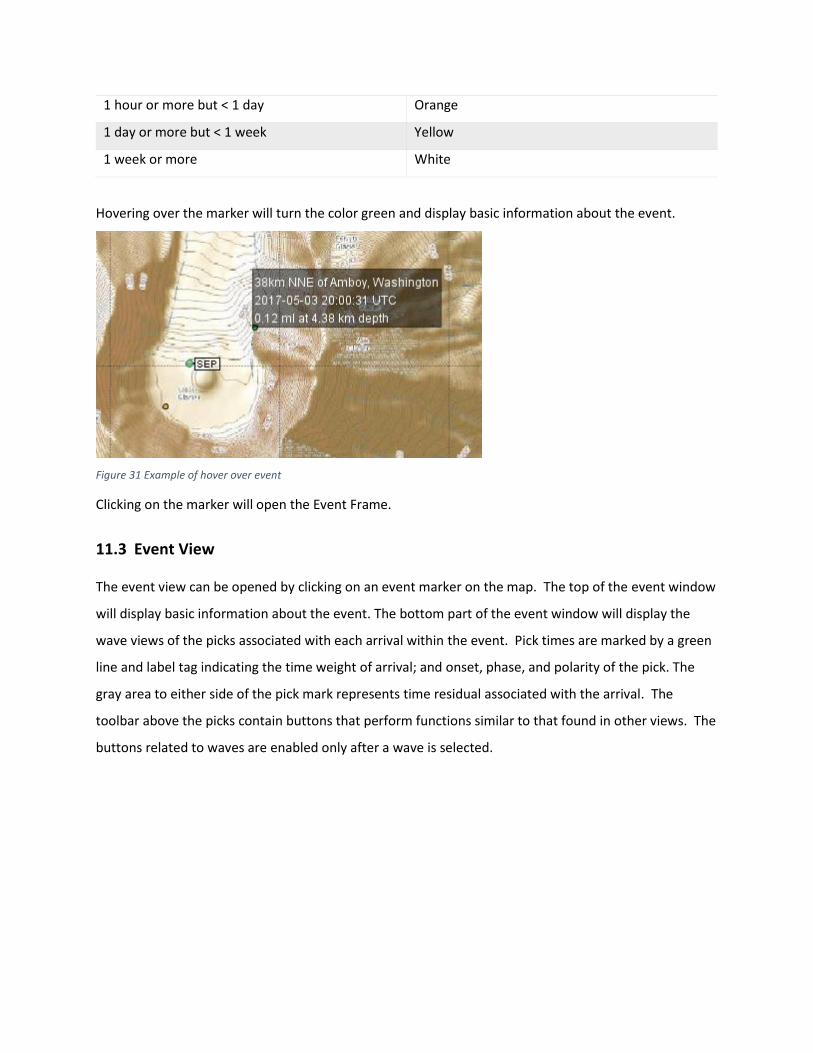
1 hour or more but < 1 day Orange
1 day or more but < 1 week Yellow
1 week or more White
Hovering over the marker will turn the color green and display basic information about the event.
Figure 31 Example of hover over event
Clicking on the marker will open the Event Frame.
11.3 Event View
The event view can be opened by clicking on an event marker on the map. The top of the event window
will display basic information about the event. The bottom part of the event window will display the
wave views of the picks associated with each arrival within the event. Pick times are marked by a green
line and label tag indicating the time weight of arrival; and onset, phase, and polarity of the pick. The
gray area to either side of the pick mark represents time residual associated with the arrival. The
toolbar above the picks contain buttons that perform functions similar to that found in other views. The
buttons related to waves are enabled only after a wave is selected.

Figure 32 Event Frame
Event source - Resource identifying the event.
Description – Event description.
Origin date – Focal time.
Type – Describes the type of event. Limited to a set of values supported in QuakeML.
Hypocenter – Geographical location of hypocenter. Latitude and longitude, with respect to WGS84
reference system; and depth, with respect to nominal sea level given by the WGS84 geoid.

Error (RMS) – Root Mean Square of the travel time residuals of the arrivals used for the origin
computation.
Azimuthal Gap – Largest azimuthal gap in station distribution as seen from epicenter.
Nearest station – Epicentral distance to station closest to the epicenter; in degrees and kilometers.
Phase Count – Number of phase observations used for computing the origin.
Magnitude – Event magnitude, and uncertainty in parenthesis if it exists.
Evaluation – Mode and status of evaluation of the origin.
Event id – Event identifier; typically, unique for a given event source.
12 Menus
12.1 File
Open File… (Ctrl-O) Allow user to open a wave as data source from a file. Supported formats are
SAC, SEED, miniSEED, SEISAN, WIN, and Matlab-readable text file.
Close File Closes all file based data sources.
Clear cache (Ctrl-F12) Empty cache.
Import Event… (Ctrl-I) Allow user to open a QuakeML event file for display on the map.
Options… Opens the Options dialog window.
Exit Closes the application.

12.1.1 Options
12.1.1.1 Time Zone
If a connection to a wave source has time
zone metadata (such as in the case of
connection to AVO Winston Server),
checking the ‘Use instrument time zone if
available’ box will do as the name
suggests. If the instrument time zone is
not available via the metadata, it is
possible to use the machine time zone or
select one manually.
12.1.1.2 Duration Magnitude
Users must opt in to be able to select
duration and perform magnitude
calculations in helicorder view. When
enabled, users can place markers on the
wave panel by left clicking on it. The
duration magnitude is then displayed at
the end of the first line in the status bar
at the bottom of the helicorder.
12.1.1.3 S-P Distance
The P-velocity configured here will be
used to calculate S-P distance when in
Figure 33 Options dialog

pick Mode and users have selected P and S times.
12.1.1.4 Maps
Users have the option of using local Map Packs (see section 10.9) or a Web Map Service (WMS). If using
WMS the map type can be selected from the drop down, which changes the server URL. Users may
optionally configure the server, layer, and styles options to another service if desired.
12.1.1.5 Other
Selecting the Large Helicorder Cursor checkbox will make the cursor over the helicorder bigger and red
for better visibility.
12.2 Layout
A layout is a saved SWARM configuration that can be quickly reopened, either from the SWARM menu
or via the command line.
Save Layout… (Ctrl-L) Saves current layout.
Overwrite Last Layout (Ctrl-Shift-L) Overwrite previously saved layout with current layout.
Remove Layout… Allows user to select a layout to remove.
Saved layouts are shown at the bottom of the Layout menu and can be selected. The Layout Augustine
is provided by default as an example.
12.3 Window
Data Chooser (Ctrl-D) Hide or unhide Data Chooser window.
Wave Clipboard (Ctrl-W) Hide or unhide Wave Clipboard window.
Map (Ctrl-M) Hide or unhide Map window.
Bring Map to Front (M) If map is hidden behind other windows, it brings it to the forefront.
Tile Helicorders Tiles all open helicoders.
Tile Waves Tiles all open waves.
Kiosk Mode (F11) Enter or exit Kiosk Mode.
Close All Closes all open helicorders and waves.
12.3.1 Kiosk Mode
In Kiosk Mode SWARM displays all of the open helicorders in full-screen mode for purposes of seismic
monitoring. Since there are no menus or toolbars when in Kiosk Mode, keyboard shortcuts will have to

be used to interact the inset wave view. Alternatively, users can switch to normal mode. The F11 key
toggles between Kiosk Mode and normal operation.
SWARM can start automatically in Kiosk Mode by running it with this option:
‘—kiosk=[parameters]’. It can also be started in Kiosk Mode through the configuration file. The value of
the ‘kiosk’ parameter is [server name]; [channel]. Example: swarm --kiosk="localhost;BGL SHZ AK".
The data source specified has to be one of the configured data sources.
12.4 Help
About Displays software URL, version number, memory usage, etc.
13 Configuration Files
13.1 Swarm.config
When exiting SWARM, the application will automatically store user selected configurations to
SWARM.config. Subsequent executions of SWARM from the same locations will read this file to
determine starting configuration.
13.2 DataSources.config
Data sources specified in this file cannot be edited or deleted in Data Chooser. This may be desirable in
cases when multiple people access SWARM from the same location. Example entry:
server=CVO Winston;wws:130.118.152.47:16022:15000:1 server=AVO Winston;wws:pubavo1.wr.usgs.gov:16022:10000:1
13.3 WaveDefaults.config
This file stores the latest Wave Settings configurations.
13.4 SwarmGroups.config
Channels can be grouped in the Channel Selector through SwarmGroups.config. File entries are a list of
[channel]=[group] pairs. See default SwarmGroups.config that came with the distribution for example.

13.5 SwarmMetadata.config
This file can be used to store metadata information about channels, when not provided through the
data source. Metadata available for configuration are:
Alias – Used in place of channel name in helicorder images.
Delay – Station delay. Used by Hypo71 locating algorithm to calculate origin.
FMAG Correction – Duration magnitude correction. Used by Hypo71 to calculate duration
magnitude.
Group – Add channel to specified group. For categorization in Data Chooser.
Height – Station elevation in meters.
Latitude – Station latitude in WGS84 decimal degrees.
Longitude – Station longitude in WGS84 decimal degrees.
Multiplier –
Offset –
TimeZone – Time zone of the channel data.
Units – Wave data unit.
XMAG Correction – Amplitude magnitude correction. (Not currently used in Swarm.)
Example entries:
ARLZ BHZ OP= Longitude: -77.38867; Latitude: 1.22200
LAVZ BHZ OP= Longitude: -77.24367; Latitude: 1.26400
LAGZ BHZ OP= Longitude: -77.72833; Latitude: 1.08733
VCNV XXX OP= Longitude: -77.95000; Latitude: 0.76667
13.6 NTP.config
Oftentimes SWARM needs the current time in order to make requests to data sources. In order to make
sure that SWARM asks for the correct time it attempts to synchronize with internet time servers (see
http://tf.nist.gov/tf-cgi/servers.cgi#). This does not change the system clock but just calculates an offset
from it. SWARM will attempt this sychronization by default approximately every 10 minutes.
The NTP.config file allows user to specify a list of NTP servers, a timeout value (ms), and a recalibration
interval (ms). Example entry:
servers=130.118.179.207,129.6.15.28,132.163.4.101,128.138.140.44,192.43.244.18,131.107.1.10
timeout=600000
recalibrationInterval=10000

13.7 RsamDefaults.config
This file stores the RSAM view default configurations. Changes made in the RSAM Settings dialog does
not alter this file. Example contents:
default.autoScale=true default.binSize=Hour default.countsPeriod=10 default.detrend=false default.eventMaxLength=300.0 default.eventRatio=1.3 default.eventThreshold=50.0 default.runningMean=false default.runningMeanPeriod=300.0 default.runningMedian=false default.runningMedianPeriod=300.0 default.scaleMax=100.0 default.scaleMin=0.0 default.valuesPeriod=600 default.viewType=VALUES
13.8 PickSettings.config
This file stores the pick setting configurations to be used in pick mode. Changes made in the Pick
Settings dialog will update this file. Example contents:
#Swarm Pick Settings Configuration #Wed Aug 09 15:35:20 PDT 2017 weight.0=1 weight_unit=MILLISECONDS weight.4=20 weight.3=10 weight.2=5 weight.1=2
14 Support
Tickets for issues or enhancement requests can be opened in https://github.com/usgs/swarm/issues.