Sviluppo urbano e rurale: parallelismi ed antagonismi del ... · Workshop ISTAT Scenari e tendenze...
20
Il presente intervento riprende quello Urban VS Rural development, presented at EXPO 2015 , 31 August 2015 , Conference organised by Alma Mater Studiorum - Università di Bologna (E. Carfagna, P. Tassinari). Measuring agricultural and rural planning with advanced methods: “New challenges and cross-cutting issues in agricultural and rural planning”, Second session: Rural land management and planning: crosscutting and interdisciplinary issues Workshop ISTAT Scenari e tendenze dell’agricoltura italiana tra tradizione ed innovazione Roma, 17 dicembre 2015 , Istat :Aula Magna,Via Cesare Balbo, 14 Sviluppo urbano e rurale: parallelismi ed antagonismi del periodo 1960-2010 di Roberto Fanfani e Lucilla Spinelli
Transcript of Sviluppo urbano e rurale: parallelismi ed antagonismi del ... · Workshop ISTAT Scenari e tendenze...
Il presente intervento riprende quello
Urban VS Rural development, presented at EXPO 2015 , 31 August 2015 , Conference organised by Alma Mater
Studiorum - Università di Bologna (E. Carfagna, P. Tassinari). Measuring agricultural and rural planning with advanced methods: “New challenges and cross-cutting issues in agricultural and rural planning”, Second session: Rural land management and planning: crosscutting and interdisciplinary issues
Workshop ISTAT Scenari e tendenze dell’agricoltura italiana tra tradizione ed innovazione Roma, 17 dicembre 2015 , Istat :Aula Magna,Via Cesare Balbo, 14
Sviluppo urbano e rurale: parallelismi ed antagonismi del periodo 1960-2010 di
Roberto Fanfani e Lucilla Spinelli
Workshop ISTAT Scenari e tendenze dell’agricoltura italiana tra tradizione ed innovazione Roma, 17 dicembre 2015 , Istat :Aula Magna,Via Cesare Balbo, 14
The urban and rural development processes are strictly related to:
continuous and non-linear changes among multi-dimensional aspects: demographic, socio-economic,
environment and resources endowment , Cultural heritage and landscape, Institutional and governance aspects.
• changing of the U/R relationships over time and space.
The complex and changing relationships amplify the difficulties to define:
• a taxonomy of rural and urban areas
• an appropriate policy mix for development

Workshop ISTAT Scenari e tendenze dell’agricoltura italiana tra tradizione ed innovazione Roma, 17 dicembre 2015 , Istat :Aula Magna,Via Cesare Balbo, 14
To better understand the relationships between U/R areas we could consider some aspects of demographic changes.
• Demographic changes over time and space
• Demographic changes in the structure of population in U/R
areas
• Some interesting examples from Italy
a country with a rapid process of development after WW2 :
- a fast passage from agriculture to industrialization
- a great movement of resident population: - inside the country (from country-side to cities, from South to Nord)
- a great migration toward european countries

Workshop ISTAT Scenari e tendenze dell’agricoltura italiana tra tradizione ed innovazione Roma, 17 dicembre 2015 , Istat :Aula Magna,Via Cesare Balbo, 14
Demographic changes of resident population in Italy
- over time (1951-1991)
- and space (municipalities)
The great change of resident population between 1951-1991 has interested:
- more than >30% of population
o - Increase by more than 50%
o - Decrease by more than 20%
1951-1991
- Increase >50% - Decrease >20%
Workshop ISTAT Scenari e tendenze dell’agricoltura italiana tra tradizione ed innovazione Roma, 17 dicembre 2015 , Istat :Aula Magna,Via Cesare Balbo, 14
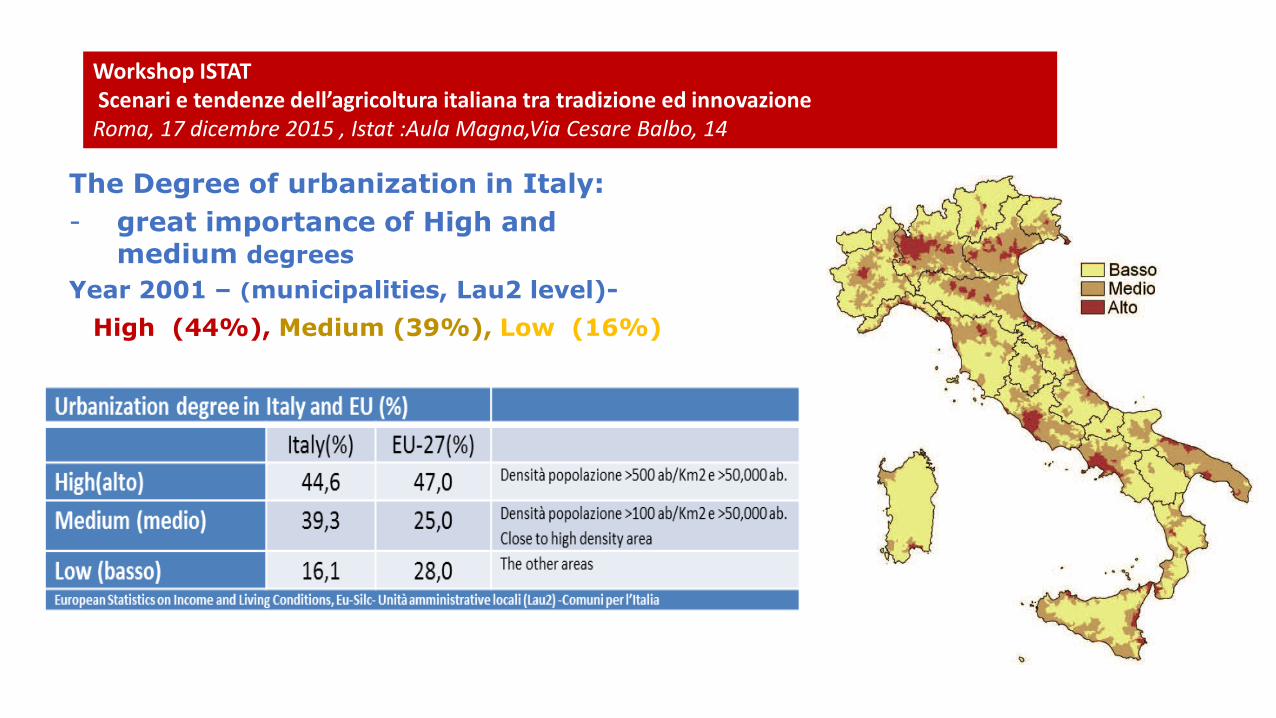
The Degree of urbanization in Italy:
- great importance of High and medium degrees
Year 2001 – (municipalities, Lau2 level)-
High (44%), Medium (39%), Low (16%)
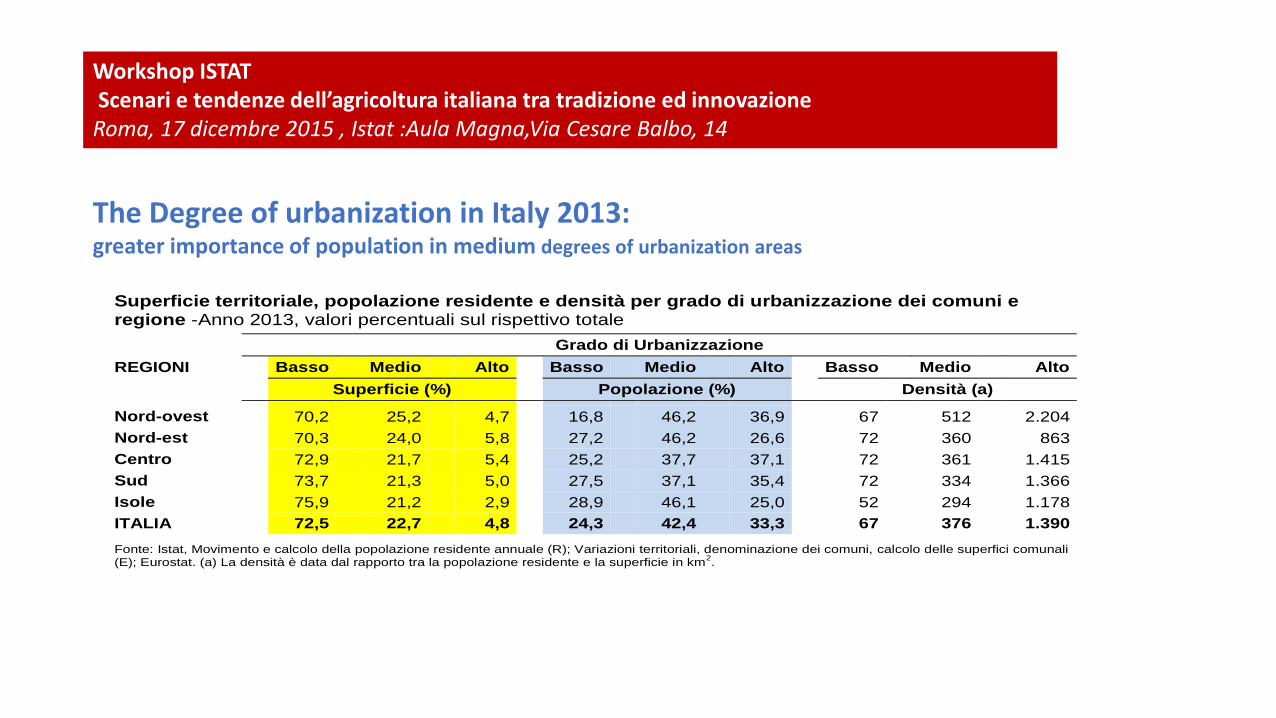
Superficie territoriale, popolazione residente e densità per grado di urbanizzazione dei comuni e regione -Anno 2013, valori percentuali sul rispettivo totale
REGIONI
Grado di Urbanizzazione
Basso Medio Alto
Basso Medio Alto
Basso Medio Alto
Superficie (%) Popolazione (%) Densità (a)
Nord-ovest
70,2
25,2
4,7
16,8
46,2
36,9
67
512
2.204
Nord-est
70,3
24,0
5,8
27,2
46,2
26,6
72
360
863
Centro
72,9
21,7
5,4
25,2
37,7
37,1
72
361
1.415
Sud
73,7
21,3
5,0
27,5
37,1
35,4
72
334
1.366
Isole
75,9
21,2
2,9
28,9
46,1
25,0
52
294
1.178
ITALIA
72,5
22,7
4,8
24,3
42,4
33,3
67
376
1.390
Fonte: Istat, Movimento e calcolo della popolazione residente annuale (R); Variazioni territoriali, denominazione dei comuni, calcolo delle superfici comunali (E); Eurostat. (a) La densità è data dal rapporto tra la popolazione residente e la superficie in km
2.
Workshop ISTAT Scenari e tendenze dell’agricoltura italiana tra tradizione ed innovazione Roma, 17 dicembre 2015 , Istat :Aula Magna,Via Cesare Balbo, 14
The Degree of urbanization in Italy 2013: greater importance of population in medium degrees of urbanization areas
Workshop ISTAT Scenari e tendenze dell’agricoltura italiana tra tradizione ed innovazione Roma, 17 dicembre 2015 , Istat :Aula Magna,Via Cesare Balbo, 14
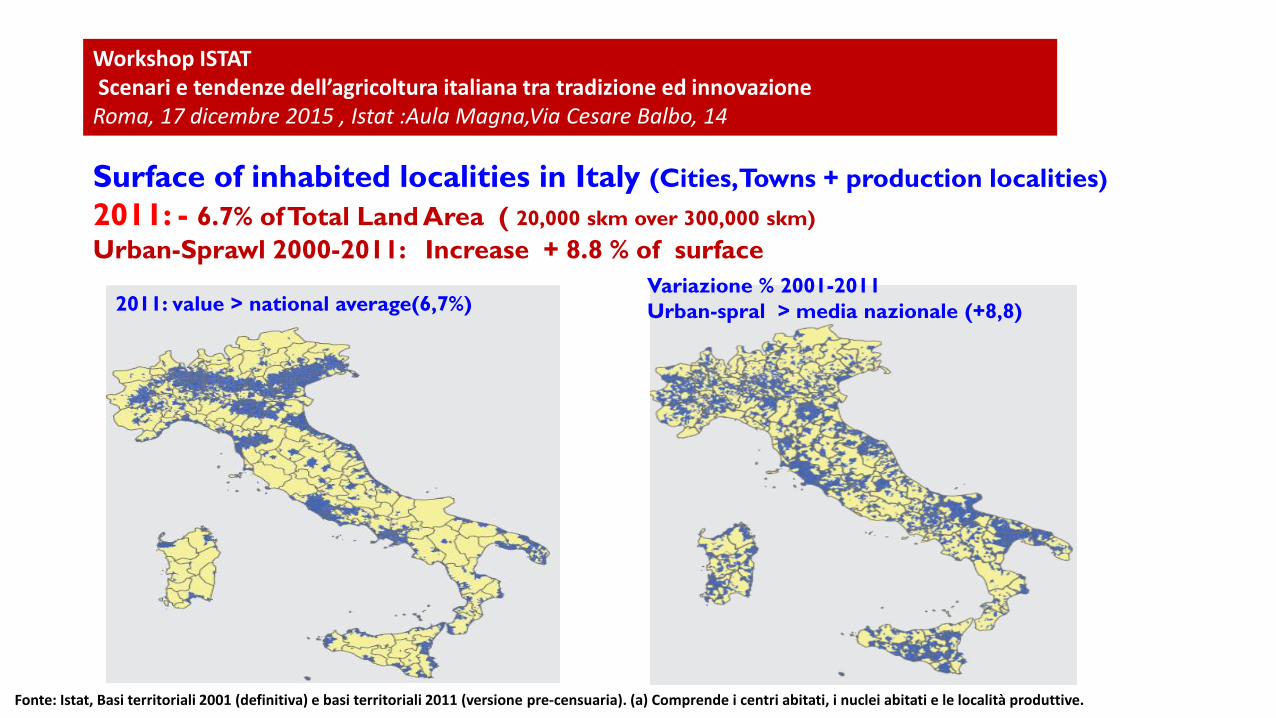
Surface of inhabited localities in Italy (Cities, Towns + production localities)
2011: - 6.7% of Total Land Area ( 20,000 skm over 300,000 skm)
Urban-Sprawl 2000-2011: Increase + 8.8 % of surface
2011: value > national average(6,7%) Variazione % 2001-2011
Urban-spral > media nazionale (+8,8)
Fonte: Istat, Basi territoriali 2001 (definitiva) e basi territoriali 2011 (versione pre-censuaria). (a) Comprende i centri abitati, i nuclei abitati e le località produttive.
Workshop ISTAT Scenari e tendenze dell’agricoltura italiana tra tradizione ed innovazione Roma, 17 dicembre 2015 , Istat :Aula Magna,Via Cesare Balbo, 14
The complexities to define a taxonomy of rural and urban areas depend on
the diversities existing within and between U/R areas.
Workshop ISTAT Scenari e tendenze dell’agricoltura italiana tra tradizione ed innovazione Roma, 17 dicembre 2015 , Istat :Aula Magna,Via Cesare Balbo, 14
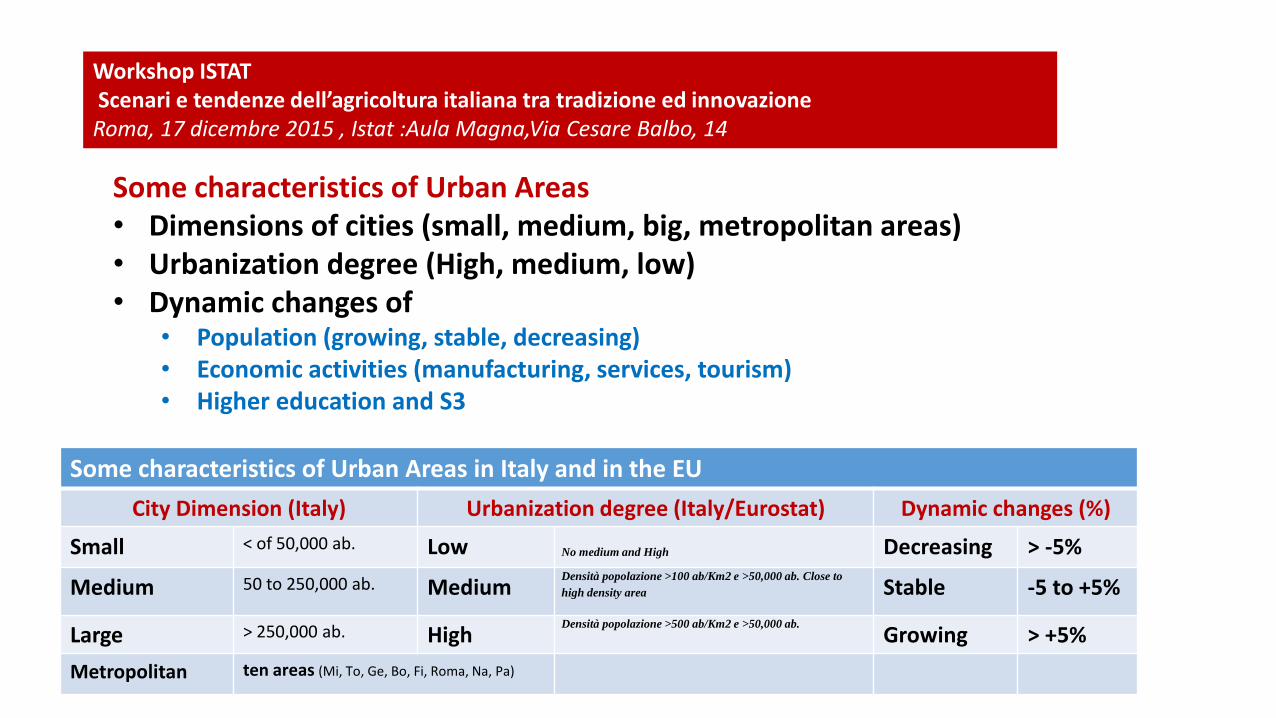
Some characteristics of Urban Areas • Dimensions of cities (small, medium, big, metropolitan areas) • Urbanization degree (High, medium, low) • Dynamic changes of
• Population (growing, stable, decreasing) • Economic activities (manufacturing, services, tourism) • Higher education and S3
Some characteristics of Urban Areas in Italy and in the EU
City Dimension (Italy) Urbanization degree (Italy/Eurostat) Dynamic changes (%)
Small < of 50,000 ab. Low
No medium and High Decreasing > -5%
Medium 50 to 250,000 ab. Medium Densità popolazione >100 ab/Km2 e >50,000 ab. Close to
high density area Stable -5 to +5%
Large > 250,000 ab. High Densità popolazione >500 ab/Km2 e >50,000 ab.
Growing > +5%
Metropolitan ten areas (Mi, To, Ge, Bo, Fi, Roma, Na, Pa)
Workshop ISTAT Scenari e tendenze dell’agricoltura italiana tra tradizione ed innovazione Roma, 17 dicembre 2015 , Istat :Aula Magna,Via Cesare Balbo, 14
Increasing complexity to define Rural areas: • Simple indicator (i.e. density of population-OECD) • Multiple-Threshold indicators • Multiple sets of indicators (demographic, socio-economic, resource
endowment, Human capital, Territorial capital, specific disadvantages) • Dynamic trends of variables or set of variables • More detailed analysis at disaggregated territorial level (NUTS2, Lau 2)
Workshop ISTAT Scenari e tendenze dell’agricoltura italiana tra tradizione ed innovazione Roma, 17 dicembre 2015 , Istat :Aula Magna,Via Cesare Balbo, 14
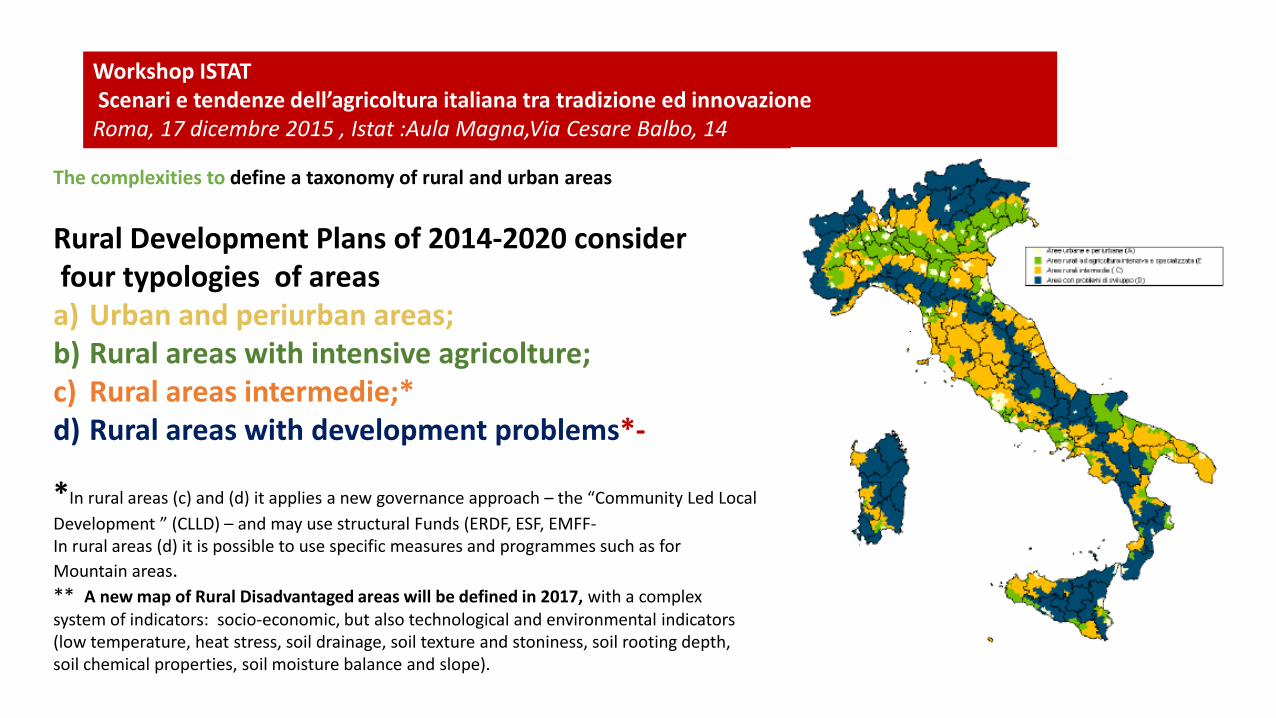
The complexities to define a taxonomy of rural and urban areas
Rural Development Plans of 2014-2020 consider four typologies of areas a) Urban and periurban areas; b) Rural areas with intensive agricolture; c) Rural areas intermedie;* d) Rural areas with development problems*-
*In rural areas (c) and (d) it applies a new governance approach – the “Community Led Local
Development ” (CLLD) – and may use structural Funds (ERDF, ESF, EMFF- In rural areas (d) it is possible to use specific measures and programmes such as for
Mountain areas. ** A new map of Rural Disadvantaged areas will be defined in 2017, with a complex system of indicators: socio-economic, but also technological and environmental indicators (low temperature, heat stress, soil drainage, soil texture and stoniness, soil rooting depth, soil chemical properties, soil moisture balance and slope).
Workshop ISTAT Scenari e tendenze dell’agricoltura italiana tra tradizione ed innovazione Roma, 17 dicembre 2015 , Istat :Aula Magna,Via Cesare Balbo, 14
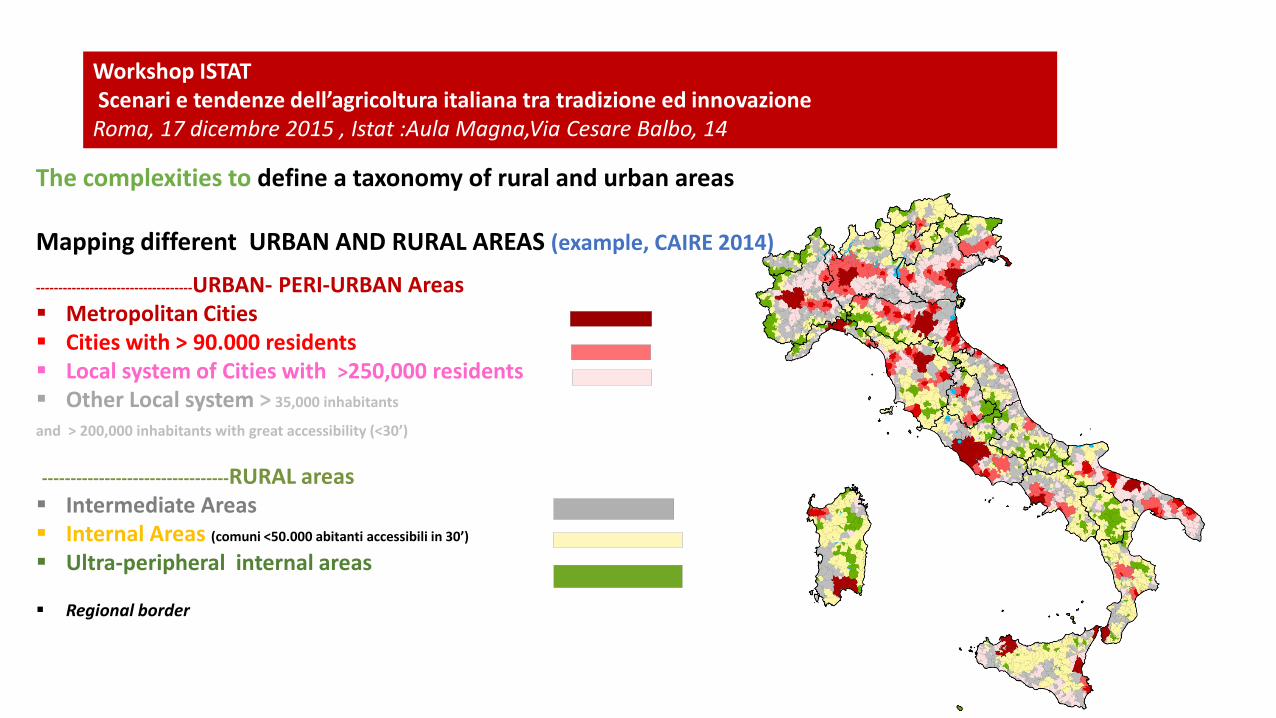
The complexities to define a taxonomy of rural and urban areas Mapping different URBAN AND RURAL AREAS (example, CAIRE 2014)
-----------------------------------URBAN- PERI-URBAN Areas
Metropolitan Cities
Cities with > 90.000 residents
Local system of Cities with >250,000 residents
Other Local system > 35,000 inhabitants
and > 200,000 inhabitants with great accessibility (<30’)
---------------------------------RURAL areas
Intermediate Areas Internal Areas (comuni <50.000 abitanti accessibili in 30’)
Ultra-peripheral internal areas
Regional border

Workshop ISTAT Scenari e tendenze dell’agricoltura italiana tra tradizione ed innovazione Roma, 17 dicembre 2015 , Istat :Aula Magna,Via Cesare Balbo, 14
Great structural changes in Agriculture and Land utilisation in Rural areas
over the last 50 years: 1961-2010
The profound change of the territorial distribution of population has been
accompanied and determined by:
• the decline in the number of Farms, • the shrinking of Agricultural areas, • the reduction in the number of days worked

Workshop ISTAT Scenari e tendenze dell’agricoltura italiana tra tradizione ed innovazione Roma, 17 dicembre 2015 , Istat :Aula Magna,Via Cesare Balbo, 14
Great structural changes of Farms and Land utilisation (last 50 years:1961-2010)
• Number of Farms - 62%
• Total Agricultural Areas (TAA) - 35%
• Utilised Agricultural Area (UAA) - 26%
Total territorial area of Italy (302.073 sqkm: 35% mountain, 42% hill ) • (1961 -TAA was 88 % of Total)
• 1982 - TAA was 75% of total *
• 2010 -TAA was 56% of Total *
Farms (TAA) (UAA)
Number
(000) Var %
HA
(000) Var %
Ha
(000) Var %
UNIVERSO ITALIA
1961 4.294 - 26.572 - - -
1970 3.607 -16,0 25.065 -5,7 17.491
1982 3.269 -9,4 23.631 -5,7 15.843 -9,4 UNIVERSO UE*
1982 3.133 - 22.398 - 15.973 -
1990 3.023 -3,5 22.702 1,4 15.046 -5,8
2000 2.396 -20,7 18.767 -17,3 13.182 -12,4
2010 1.621 -32,4 17.081 -9,0 12.856 -2,5
* Universo UE, comprende le aziende con più di un ettaro ed una produzione superiore a 2500€.
Workshop ISTAT Scenari e tendenze dell’agricoltura italiana tra tradizione ed innovazione Roma, 17 dicembre 2015 , Istat :Aula Magna,Via Cesare Balbo, 14
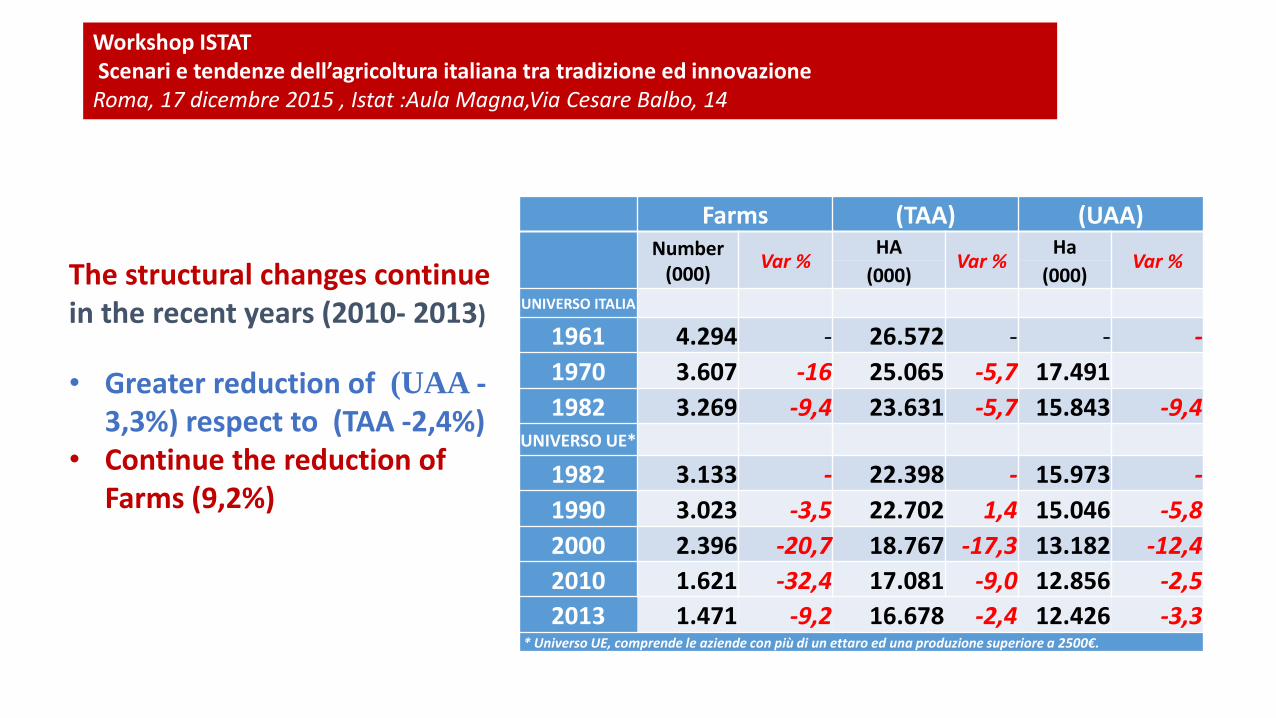
The structural changes continue in the recent years (2010- 2013)
• Greater reduction of (UAA -3,3%) respect to (TAA -2,4%)
• Continue the reduction of Farms (9,2%)
Farms (TAA) (UAA)
Number
(000) Var %
HA Var %
Ha Var %
(000) (000)
UNIVERSO ITALIA
1961 4.294 - 26.572 - - -
1970 3.607 -16 25.065 -5,7 17.491
1982 3.269 -9,4 23.631 -5,7 15.843 -9,4 UNIVERSO UE*
1982 3.133 - 22.398 - 15.973 -
1990 3.023 -3,5 22.702 1,4 15.046 -5,8
2000 2.396 -20,7 18.767 -17,3 13.182 -12,4
2010 1.621 -32,4 17.081 -9,0 12.856 -2,5
2013 1.471 -9,2 16.678 -2,4 12.426 -3,3 * Universo UE, comprende le aziende con più di un ettaro ed una produzione superiore a 2500€.
Workshop ISTAT Scenari e tendenze dell’agricoltura italiana tra tradizione ed innovazione Roma, 17 dicembre 2015 , Istat :Aula Magna,Via Cesare Balbo, 14
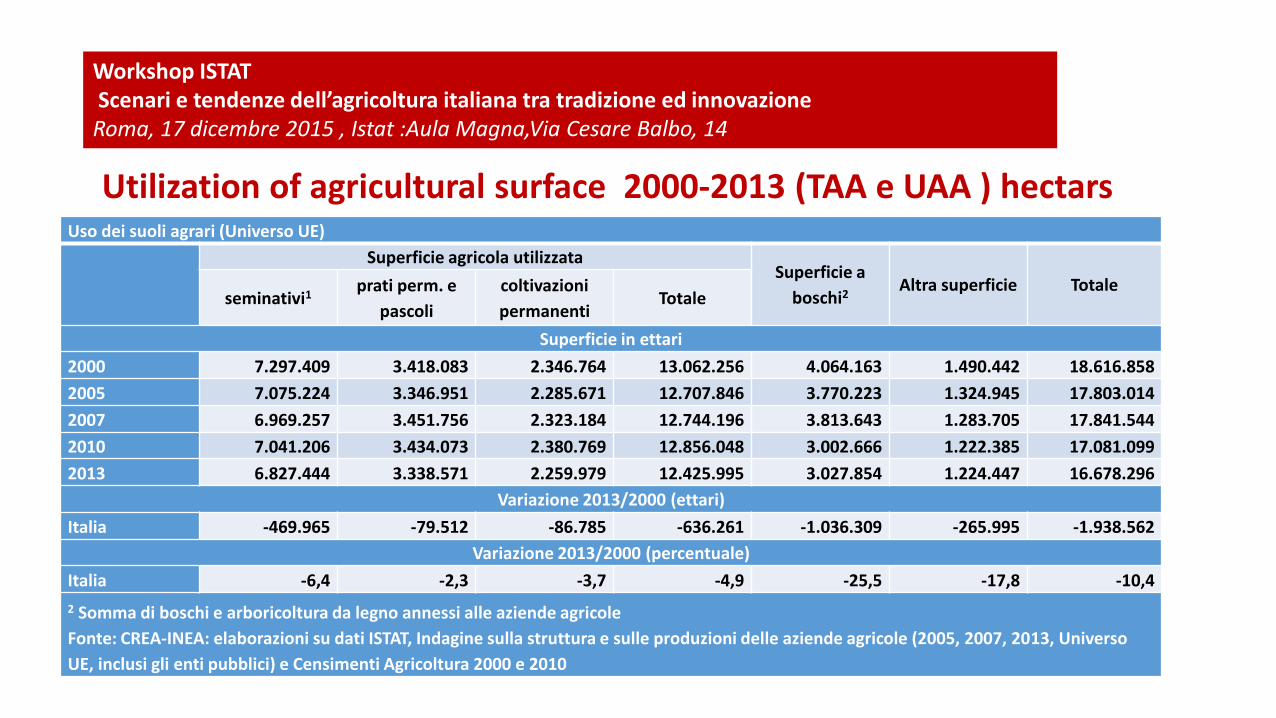
Utilization of agricultural surface 2000-2013 (TAA e UAA ) hectars
Uso dei suoli agrari (Universo UE)
Superficie agricola utilizzata Superficie a
boschi2 Altra superficie Totale
seminativi1 prati perm. e
pascoli
coltivazioni
permanenti Totale
Superficie in ettari
2000 7.297.409 3.418.083 2.346.764 13.062.256 4.064.163 1.490.442 18.616.858
2005 7.075.224 3.346.951 2.285.671 12.707.846 3.770.223 1.324.945 17.803.014
2007 6.969.257 3.451.756 2.323.184 12.744.196 3.813.643 1.283.705 17.841.544
2010 7.041.206 3.434.073 2.380.769 12.856.048 3.002.666 1.222.385 17.081.099
2013 6.827.444 3.338.571 2.259.979 12.425.995 3.027.854 1.224.447 16.678.296
Variazione 2013/2000 (ettari)
Italia -469.965 -79.512 -86.785 -636.261 -1.036.309 -265.995 -1.938.562
Variazione 2013/2000 (percentuale)
Italia -6,4 -2,3 -3,7 -4,9 -25,5 -17,8 -10,4
2 Somma di boschi e arboricoltura da legno annessi alle aziende agricole
Fonte: CREA-INEA: elaborazioni su dati ISTAT, Indagine sulla struttura e sulle produzioni delle aziende agricole (2005, 2007, 2013, Universo
UE, inclusi gli enti pubblici) e Censimenti Agricoltura 2000 e 2010
Workshop ISTAT Scenari e tendenze dell’agricoltura italiana tra tradizione ed innovazione Roma, 17 dicembre 2015 , Istat :Aula Magna,Via Cesare Balbo, 14
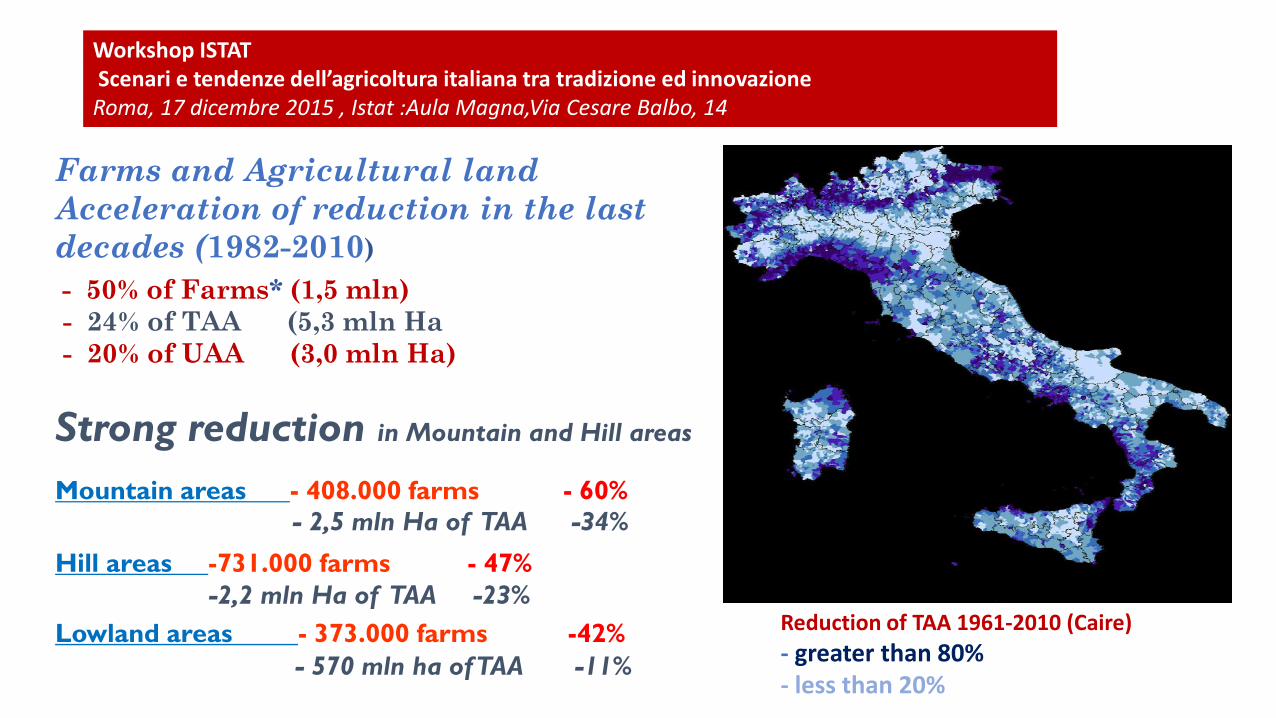
Farms and Agricultural land
Acceleration of reduction in the last
decades (1982-2010)
- 50% of Farms* (1,5 mln)
- 24% of TAA (5,3 mln Ha
- 20% of UAA (3,0 mln Ha)
Strong reduction in Mountain and Hill areas
Mountain areas - 408.000 farms - 60%
- 2,5 mln Ha of TAA -34%
Hill areas -731.000 farms - 47%
-2,2 mln Ha of TAA -23%
Lowland areas - 373.000 farms -42%
- 570 mln ha of TAA -11%
Reduction of TAA 1961-2010 (Caire)
- greater than 80% - less than 20%
Workshop ISTAT Scenari e tendenze dell’agricoltura italiana tra tradizione ed innovazione Roma, 17 dicembre 2015 , Istat :Aula Magna,Via Cesare Balbo, 14
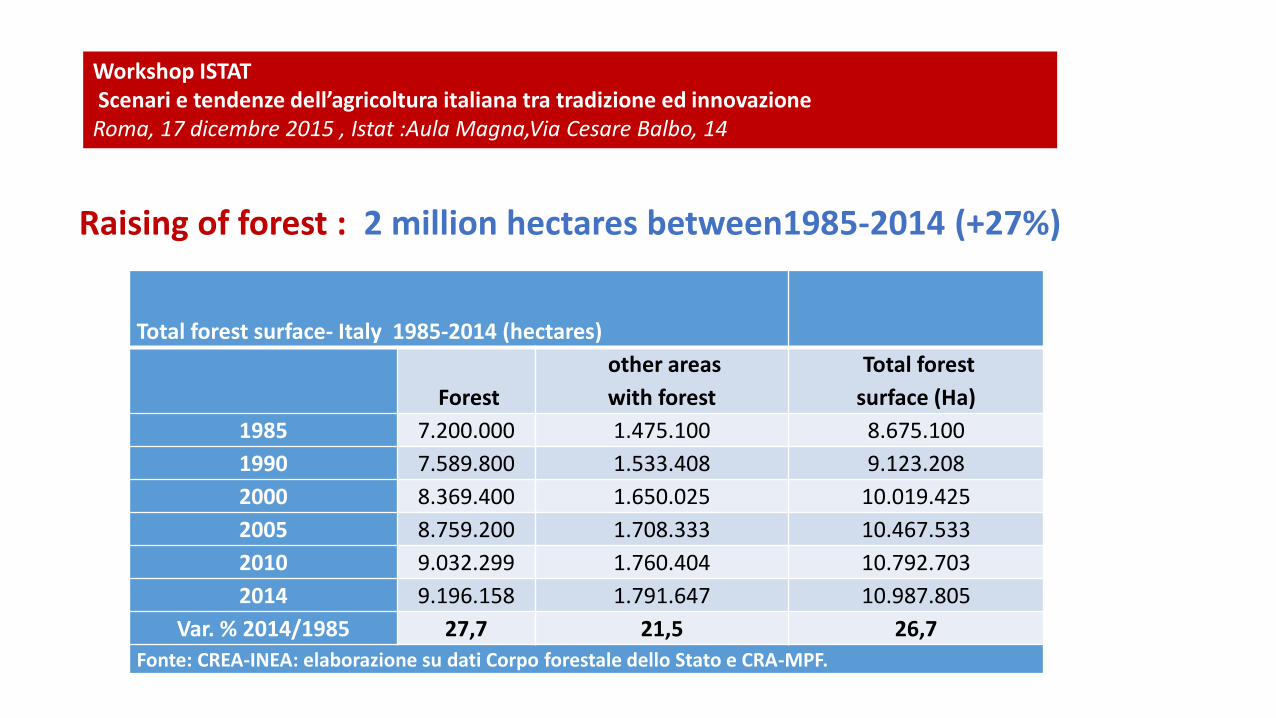
Raising of forest : 2 million hectares between1985-2014 (+27%)
Total forest surface- Italy 1985-2014 (hectares)
Forest
other areas
with forest
Total forest
surface (Ha)
1985 7.200.000 1.475.100 8.675.100
1990 7.589.800 1.533.408 9.123.208
2000 8.369.400 1.650.025 10.019.425
2005 8.759.200 1.708.333 10.467.533
2010 9.032.299 1.760.404 10.792.703
2014 9.196.158 1.791.647 10.987.805
Var. % 2014/1985 27,7 21,5 26,7
Fonte: CREA-INEA: elaborazione su dati Corpo forestale dello Stato e CRA-MPF.

Workshop ISTAT Scenari e tendenze dell’agricoltura italiana tra tradizione ed innovazione Roma, 17 dicembre 2015 , Istat :Aula Magna,Via Cesare Balbo, 14
How to reconcile Urban and Rural areas
A better classification of urban and rural areas and their structural and dynamic changes*
play a crucial role in defining the road map for a possible reconciliation (partnership) between the different typologies of urban and rural areas *in the previous part we presented some examples of possible taxonomy and structural changes, mainly
referring to rural areas. **(REURBAN “Partnership for sustainable rural-urban development: existing evidences, 2012 “) “rural-urban relationships as the basis for the partnership”
Workshop ISTAT Scenari e tendenze dell’agricoltura italiana tra tradizione ed innovazione Roma, 17 dicembre 2015 , Istat :Aula Magna,Via Cesare Balbo, 14
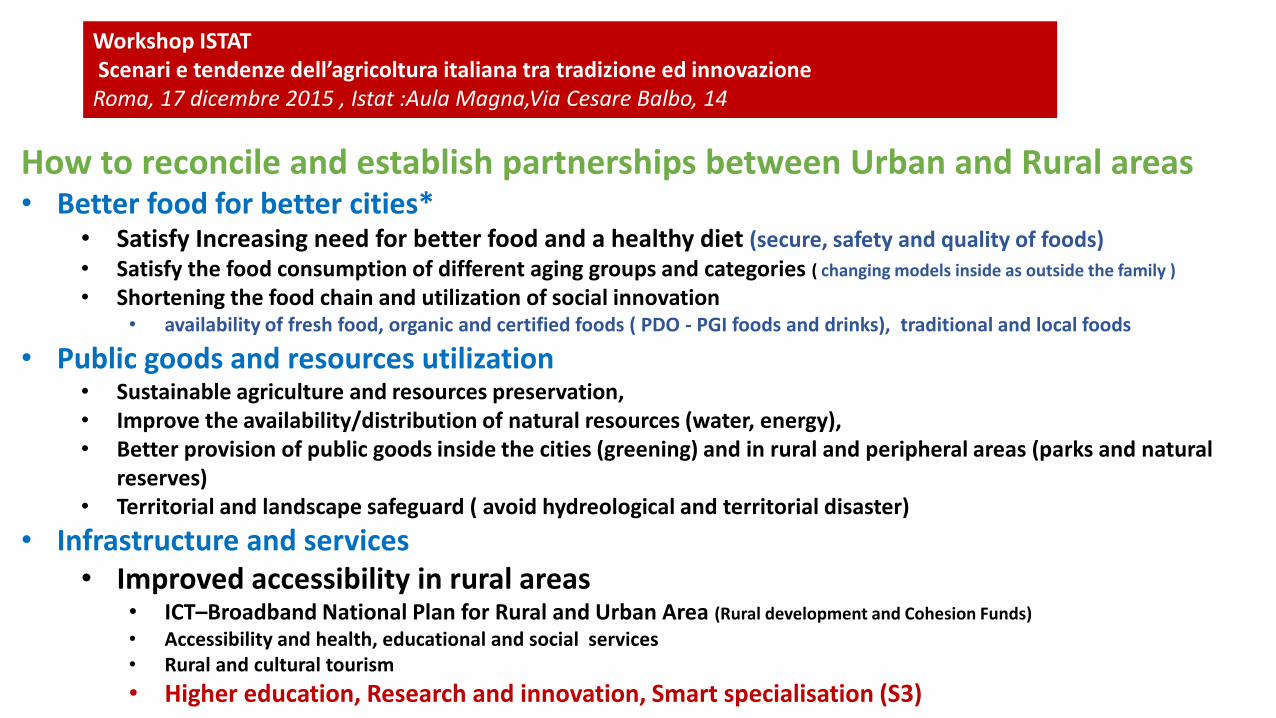
How to reconcile and establish partnerships between Urban and Rural areas • Better food for better cities*
• Satisfy Increasing need for better food and a healthy diet (secure, safety and quality of foods) • Satisfy the food consumption of different aging groups and categories ( changing models inside as outside the family )
• Shortening the food chain and utilization of social innovation • availability of fresh food, organic and certified foods ( PDO - PGI foods and drinks), traditional and local foods
• Public goods and resources utilization • Sustainable agriculture and resources preservation, • Improve the availability/distribution of natural resources (water, energy), • Better provision of public goods inside the cities (greening) and in rural and peripheral areas (parks and natural
reserves) • Territorial and landscape safeguard ( avoid hydreological and territorial disaster)
• Infrastructure and services • Improved accessibility in rural areas
• ICT–Broadband National Plan for Rural and Urban Area (Rural development and Cohesion Funds)
• Accessibility and health, educational and social services • Rural and cultural tourism
• Higher education, Research and innovation, Smart specialisation (S3)


![AMIF2014 – [Aerospazio] Stefania Cantoni, Tendenze nei nuovi materiali per l'aerospazio](https://static.fdocuments.us/doc/165x107/558cda4bd8b42acb118b459c/amif2014-aerospazio-stefania-cantoni-tendenze-nei-nuovi-materiali-per-laerospazio.jpg)