Sustainable Water Treatment Technologies in the 2020 ... Water Treatment Technologies in the 2020...
25
Sustainable Water Treatment Technologies in the 2020 Global Water Market Investor Briefing: Water- An attractive investor opportunity Tuesday, 15 May 2012 By Fredrick Royan Research Director, Global Environment (Water) Markets Email: [email protected]
Transcript of Sustainable Water Treatment Technologies in the 2020 ... Water Treatment Technologies in the 2020...

Sustainable Water Treatment Technologies in the 2020 Global Water Market
Investor Briefing: Water- An attractive investor opportunity
Tuesday, 15 May 2012
By
Fredrick Royan Research Director, Global Environment (Water) Markets
Email: [email protected]

Agenda
2
About Frost & Sullivan and the Global Water Market Practice
Headline date of the Global Water Market – Key Drivers and Segments
Global Water Design. Build and Operate (DBO) Market
Global Water and Wastewater Treatment Equipment Market
Prospects by Regions and Hot-Spot Verticals and Tech Segments
Smart Water Grid Market
Global Ballast Water Treatment Systems Market
Last Word – 3 Big Predictions for Global Water Markets in 2020

The Frost & Sullivan Story
Pioneered Emerging Market & Technology Research
• Global Footprint Begins • Country Economic Research • Market & Technical Research • Best Practice Career Training • MindXChange Events
Partnership Relationship with Clients
• Growth Partnership Services • GIL Global Events • GIL University • Growth Team Membership™ • Growth Consulting
Visionary Innovation
• Mega Trends Research • CEO 360 Visionary Perspective • GIL Think Tanks • GIL Global Community • Communities of Practice
3
Our Industry Coverage – Industrial Convergence
Automo&ve &
Transporta&on
Aerospace & Defense Measurement & Instrumentation
Information & Communication Technologies
Healthcare Environment & Building Technologies
Energy & Power Systems
Chemicals, Materials & Food
Electronics & Security
Industrial Automation & Process Control
Automotive Transportation & Logistics
Consumer Technologies
Minerals & Mining
4

F&S Coverage along the Value Chain of the Water Industry
Treatment Technology Supply
Environment(Water) & Building Technologies
Construction Materials Chem
Process Control & Automation
Operation & Maintenance
Industrial Automation & Process Control
Ci&es, Municipali&es, Water U&li&es & Services, Smart Water Grid/Metering and Indl. Water & Wastewater Management
Opera&on & Maintenance
Water & Wastewater Treatment Technologies
Design Engineering and Consul&ng Services
F&S Research Business Units and Domain Expertise
Frost & Sullivan Expertise and Coverage Along the Value Chain of the Water Industry and Market Segments
Chemicals used in Water and Wastewater Treatment – Municipal & Industrial Chemicals used in Sludge Treatment
Materials used in Water Infrastructure and Piping Materials used in Building and Construction Chemicals, Materials & Food Pumps, Motors, Drives, Valves, Controllers, SCADA, Machine Control
Distributed Control Systems, PLCs, Controls, Advanced Process Control, MES, MRP, etc
Cities, Water Utilities & Services
Industrial Water & Wastewater management
Information & Communication Technologies
Communica&ons Infrastructure Systems & SoLware
Communica&on Services, Contact Centers, Digital Media, Enterprise Communica&on, IT Services and Applica&ons, Mobile and Wireless Communica&ons, Network Security, Space and Communica&ons
Design Engineering & Consulting Services
Smart Water Grid
5

Global Water Market q Headline Data and Drivers
$ 425* Billion
Total Global Water Market Value
Key Global Water Growth Drivers
International
Agencies
Environment Protection Agencies
Business & Financial Agencies
Soc
ial &
Eco
nom
ical
Rapid Population Growth &
Urbanisation
Water Quality & Public Health
Water Supply & Sanitation Needs of Remote
Communities E
colo
gica
l
Carbon footprint
Storm/Flood water
Management
Water Stress/Droughts
Pol
itica
l & F
inan
cial
Construction Technical engineering & design
Operations & maintenance Chemicals supply
Technology/equipment supply R & D and piloting
Water management
Key
act
iviti
es
acro
ss th
e va
lue
chai
n
6
Note: At present this does not include Smart Water Grid Market revenue estimates
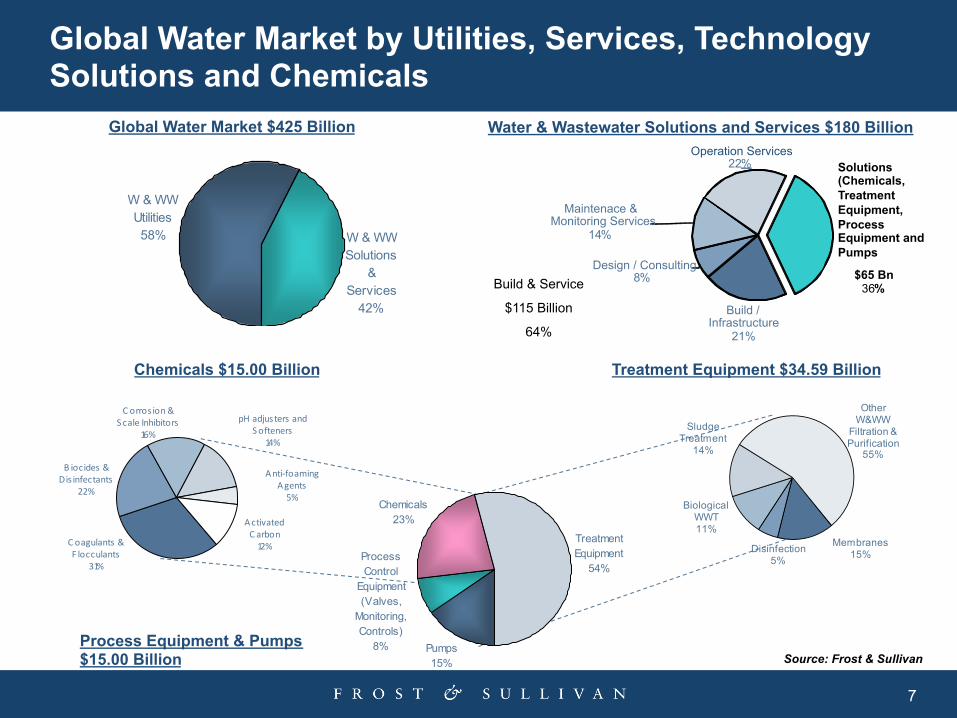
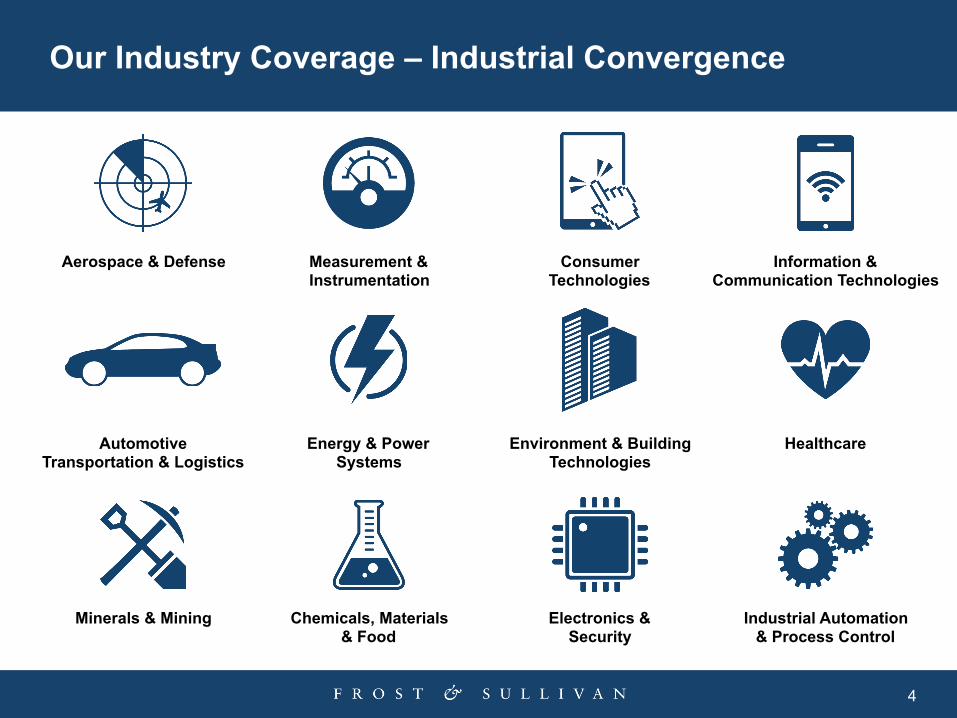
Global Water Market by Utilities, Services, Technology Solutions and Chemicals
Global Water Market $425 Billion
W & WW Utilities58% W & WW
Solutions &
Services42%
Source: Frost & Sullivan
Water & Wastewater Solutions and Services $180 Billion
Chemicals $15.00 Billion Treatment Equipment $34.59 Billion
Process Equipment & Pumps $15.00 Billion
Activated C arbon12%C oagulants &
F locculants31%
pH adjusters and Softeners
14%
B iocides & Dis infectants
22%
C orros ion & S cale Inhibitors
16%
Anti-‐foaming Agents5%
Membranes15%Disinfection
5%
Biological WWT11%
Sludge Treatment
14%
Other W&WW
Filtration & Purification
55%
Build / Infrastructure
21%
Design / Consulting 8 %
Maintenace & Monitoring Services
14 %
Operation Services 22 % Solutions
(Chemicals, Treatment Equipment, Process Equipment and Pumps
$65 Bn 36 % Build & Service
$115 Billion
64%
Pumps15%
Chemicals23%
Treatment Equipment
54%Process Control
Equipment (Valves,
Monitoring, Controls)
8%
7

Global Water Design, Build & Operate (DBO) Market
CAGR 2010-‐2020 8.6%
0.00
20.00
40.00
60.00
80.00
100.00
120.00
140.00
160.00
180.00
200.00
20072010
2020
$, Billions
Operate Build/Infrastructure Design/Consulting
Source: Frost & Sullivan
Top
DB
O C
ompa
nies
North America Latin America Middle East & Africa Europe Asia Pacific TETRA TECH INC. SUEZ ENVIRONMENT SUEZ ENVIRONMENT SUEZ ENVIRONMENT CH2M HILL
VEOLIA WATER VEOLIA WATER VEOLIA WATER VEOLIA WATER SUEZ ENVIRONMENT
SUEZ ENVIRONMENT CH2M HILL AECOM ATKINS VEOLIA WATER CH2M HILL BLACK & VEATCH MOTT MACDONALD AECOM AECOM
AECOM LOUIS BERGER ATKINS REMONDIS AQUA REMONDIS AQUA
CAGR 7.8%
CAGR 5.1%
CAGR 5.5%
CAGR 10.4%
CAGR 9.3%
8
CAGR 2010-‐2020 8.6%

Global Water & Wastewater Treatment Equipment Market, 2010 to 2015
Water & Wastewater Treatment Equipment Market: Growth Forecasts for Total Market, Municipal and
Industrial Segments (World) 2010-2015
61% Municipal
Industrial 7.1%
CAGR 2010-2015
7.5%
0%
Equipment Market 2010
39%
$19.63 Bn
$14.97 Bn
10%
7.8%
100% TOTAL $34.59 Bn
• Rapid increase in populations both in developing countries as well as major urban centres
• Lack of freshwater resources is less of a region specific issue and fast becoming global
• Ageing water & wastewater infrastructure of the developed regions coupled by increasing stringent
legislation
Water & Wastewater Treatment Equipment Market: Revenue Trend by Technology Segments by Regions (World), 2010
Note: All figures are rounded . Source: Frost & Sullivan Source: Frost & Sullivan
0. 00
2.00
4. 00
6.00
8. 00
10. 00
12.00
14.00
West Europe East Europe North America Latin America & Caribbean
ME & Africa APAC R
even
ues
($ B
illio
n)
Ind Sludge Mun Sludge Ind WW Mun WW Ind Water Mun Water
9

2020 Mega Trend: Sustainable Water Treatment Solutions q Technology Roadmap
1980 2000 1990
Evolution of Water Management Technologies and Solutions
2011 2020
Membrane Technology
Service Outsourcing
Thermal Desalination
Water & Wastewater Treatment
Water Management
Re-Use & Recycling
Advanced WW Treatment
(ex. Nutrient removal)
Inte
grat
ed W
ater
Man
agem
ent &
S
ervi
ces Turnkey
Solutions
Material, Resource & Energy Recovery
Bio Solids Management
Worldwide Sanitation
Treatment Systems for Small Communities
Retrofit, Replacement & Upgrading
The market message and response…sample of companies equipped with a sustainable solution and/or service
Water Needs of Developing Countries
Ballast Water Treatment
Sustainable/Low-Carbon Solutions & Services
Chemical free treatment
RO Desalination
Storm water Management
Water Re-Use & Recycling
Smart Water Solutions
10
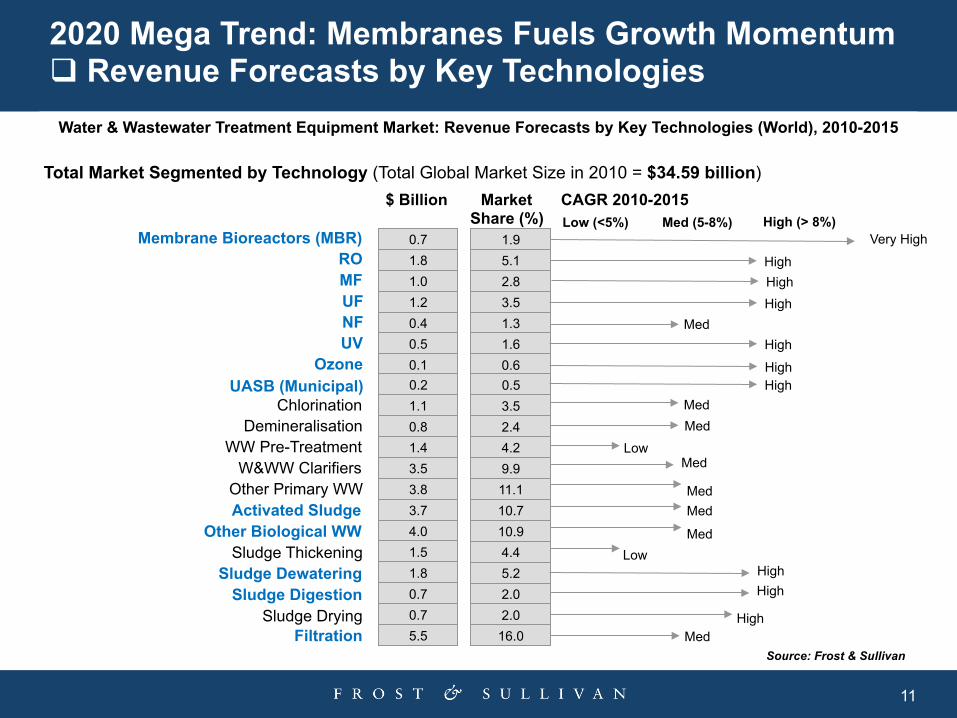
Total Market Segmented by Technology (Total Global Market Size in 2010 = $34.59 billion)
Membrane Bioreactors (MBR)
MF RO
1.9 5.1 2.8 3.5 1.3 1.6 0.6
3.5 2.4 4.2
UV Ozone
Chlorination Demineralisation
UF
WW Pre-Treatment 9.9 11.1 10.7 10.9 4.4
W&WW Clarifiers Other Primary WW Activated Sludge
Other Biological WW Sludge Thickening
5.2 2.0 2.0
Sludge Dewatering Sludge Digestion
Sludge Drying Filtration 16.0
NF
CAGR 2010-2015 Low (<5%) Med (5-8%) High (> 8%)
Med
High
Very High
Low Med
Med
Med
Med
Med
Med
Med
Low
High
High
0.7 1.8 1.0 1.2 0.4 0.5 0.1
1.1 0.8 1.4 3.5 3.8 3.7 4.0 1.5 1.8 0.7 0.7 5.5
$ Billion Market Share (%)
0.5 UASB (Municipal) 0.2
High
High High
High
High High
Water & Wastewater Treatment Equipment Market: Revenue Forecasts by Key Technologies (World), 2010-2015
Source: Frost & Sullivan
2020 Mega Trend: Membranes Fuels Growth Momentum q Revenue Forecasts by Key Technologies
11

2020 Mega Trend: Integration Opps. Along Value Chain q Opportunities of Integration in $6 bn Membrane Industry
Polymers & Ceramic! Membranes! Modules!
Water Solutions!
Water & Process Solutions!
• Arkema • BASF • Dow • DuPont • Lanxess • Solvay • Toyobo
Polymeric • Applied Membranes • Asahi Kasei • Dow / Film Tec • GE Osmonics • Nitto Denko/
Hydranautics • Lanxess * • Trisep • Toray Membrane • Memstar • Hyflux Ceramic • Metawater • JIUWU Hitech • Atech Innovations
Sample of Players along the Membrane Systems Value Chain
Polymeric • Norit X-Flow • Dow Water Solutions • 3M Cuno • GrahamTek • Inge • Koch Membranes • Millipore • Pall Corporation • Rochem Ceramic • Metawater • JIUWU Hitech • Atech Innovations
• GE Water (Ionics, Osmonics and Zenon)
• Siemens Water (USFilter)
• Veolia Water • Degremont • Dow Water Solutions • Xylem (PCI Membranes) • Pentair • Doosan Hydro • Biwater • Severn Trent Services
• Pall
• Koch Membrane
• Millipore
• Alfa Laval
Innovative Membranes & Solutions!
1. Stratkraft – Osmotic Power 2. Aquaworx – Ultrasound metallic filtration 3. Nano H20 4. Porifera
Process Solutions!
12

Biogas Generation from Wastewater Treatment (Anaerobic Digesters such as Up flow Anaerobic Sludge Blanket Systems)
Water Reuse & Recycling Systems Market (Membrane Bioreactor Systems) Nutrient Removal & Wastewater Treatment Solutions for Rapidly Growing Cities (Moving Bed Bioreactor Systems)
Smart Water Solutions to Improve Efficiencies and Decarbonise Water Services (Smart Water Grid and Smart Water Metering Market)
Chemical Free Water & Wastewater Treatment (UV & Ozone)
Energy Efficiency Improvements with Advanced Aeration Systems Diffused Aeration Systems
2020 Mega Trend: Sustainable Water Treatment Solutions q Few of the Technologies in Select Growth Markets
13

Approx. $ 400 Mn UV Market q Consolidating Position as Chemical Free Disinfectant
Water and Wastewater Disinfection Systems Market: Revenue Share by Chemical, UV and other Technologies
(World), 2006 and 2013
UV
Chlorine
Other Disinfection
Technologies
0%
10%
20%
30%
40%
50%
60%
70%
80%
90%
100%
2006 2007 2008 2009 2010 2011 2012 2013
Recent & Exciting Market Developments
Americas Europe Middle East & Africa Asia Pacific Global
2008 171 150 21 44 386
2015 244 220 57 105 626
0
100
200
300
400
500
600
700
Revenu
es ($
, Million) 2008 2015
UV Disinfection Systems Market: Revenue Forecasts by Region & Global (World), 2008 and 2015
14

Note: Above figures are top level estimates from secondary research and analysis
Diffused Aerators Market: Revenue Forecast (Global), 2010-2015
Americas Europe Middle East & Africa Asia Pacific Global
2010 725.0 900.0 200.0 400.0 2,225.0 2015 900.0 1,200.0 500.0 980.0 3,580.0 CAGR 4.4% 5.9% 20.1% 19.6% 10.0%
0.0%
5.0%
10.0%
15.0%
20.0%
25.0%
0.0
500.0
1,000.0
1,500.0
2,000.0
2,500.0
3,000.0
3,500.0
4,000.0
CA
GR
$ m
illio
n
2010 2015 CAGR
Unmet Needs.... • Reduction in the energy needs of aeration systems • Preventing fouling of membrane surface • Customising diffused aeration systems to specific wastewater effluents • Reducing life cycle and maintenance costs of diffused aeration to affordable levels
$2 Bn Diffused Aeration Systems Market – CAGR 10% q Unmet Needs Present Opp. To Membrane Companies
15

$ 700 Mn Global MBR Market – CAGR >15% q Urbanisation-Increasing Water Stress & Legislation Driven
Projected Concentration of Urban Population (Global), 2015
Increase of Water Stress (Global), 1995 and 2025
16

Opportunities in Water Intensive Industrial Sectors q Power Generation and Food & Beverage
Note: All figures are rounded; the base year is 2010. Source: Frost & Sullivan
1795.5 2080.0
3235.7
433.0
505.0
826.9
0.0
500.0
1000.0
1500.0
2000.0
2500.0
3000.0
3500.0
4000.0
4500.0
2007 2010 2017
Rev
enue
s ($
Mill
ion)
Year
Process Water Wastewater
Food and Beverage Water and Wastewater Market Revenue Forecast, Global, 2011 and 2020
CAGR (2011–2020): 5.5%
Mar
ket R
even
ue ($
Mill
ion)
0.0
500.0 1000.0 1500.0 2000.0 2500.0 3000.0 3500.0 4000.0 4500.0 5000.0
2011 2020
477.2 788.8 878.1
1450.7 365.0
596.1 1142.3
1812.2
Operation and Maintenance Services
Design and Engineering Services
Wastewater Treatment Equipment
Water Treatment Equipment
Power Generation Water and Wastewater Market Revenue Forecast, Global, 2007 and 2017
17

SMART Infrastructure
SMART Technology
Satellite Towns SMART Cars
SMART GRID & NETWORK
SMART Energy
SMART Buildings
Source: Google Images
Urban Regions are Leading Smart Urban Planning Initiatives q Emergence of Smart Water Grid and Related Solutions
18
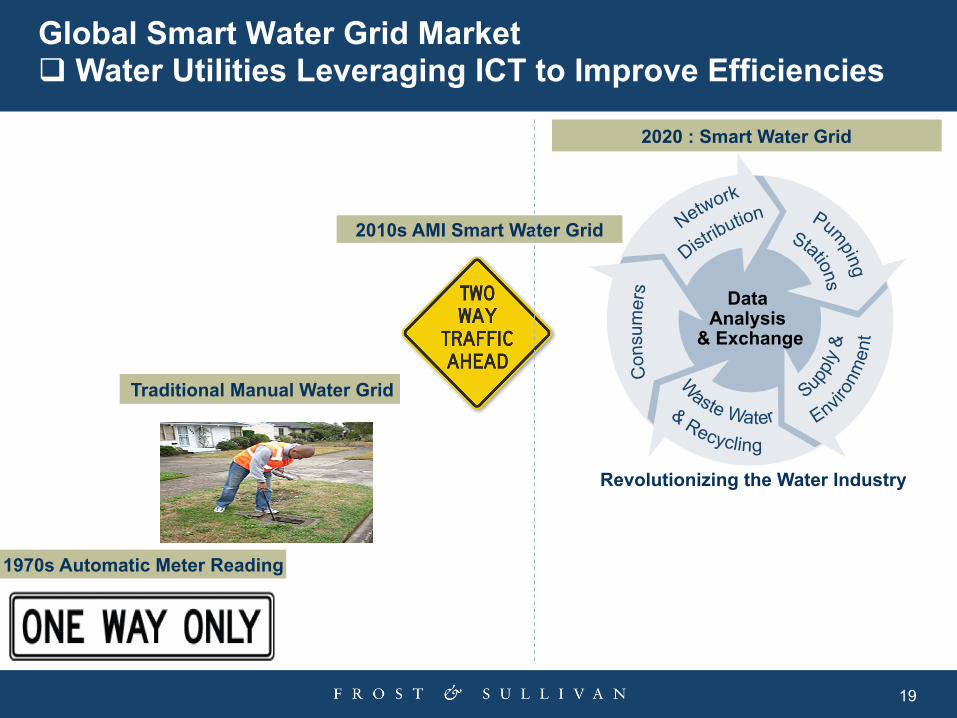
Traditional Manual Water Grid
1970s Automatic Meter Reading
2010s AMI Smart Water Grid
2020 : Smart Water Grid
Data Analysis
& Exchange
Revolutionizing the Water Industry
Global Smart Water Grid Market q Water Utilities Leveraging ICT to Improve Efficiencies
19

Cloud services, third party analytical services and water utility billing and operations
Smart Water Quality Monitors
Smart Valves and Pipes
Smart Water Meters
M M
M M
M
M
V
V
V
Q
Q Q
Q Q
Q
Q
P P
P
Smart Pumps
U
U U
Adapted from: UK Drinking Water Inspectorate
Global Smart Water Grid Market q Technology Applications Along the Water Cycle
20

0%
10%
20%
30%
40%
50%
60%
70%
80%
90%
100%
2010 2011 2012 2013 2014 2015 2016 2017 2018 2019 2020
Smart and Conventional Water Grid Penetration, Global, 2010-2020
Conventional Water Network Smart Water Network
0%
10%
20%
30%
40%
50%
60%
70%
80%
90%
100%
2010 2011 2012 2013 2014 2015 2016 2017 2018 2019 2020
Smart and Conventional Water Grid Penetration, Global, 2010-2020
$5.8B Total Market
Value
$22.2B Total Market
Value
$8.7B Total Market
Value 29%
14.4% CAGR 2010-2020
Global Smart Water Grid Market q Strong Growth, Especially from 2015 Onwards
21

European Smart Water Metering Market q Smart Water Meters in 50 % EU Households by 2020
0
40000
80000
120000
160000
200000
240000
2007 2008 2009 2010 2011 2012 2013 2014 2015 2016 2017 2018 2019 2020 2030
Hou
seho
lds
& W
ater
Met
ers
('000
)
Smart Water Meter Market Penetration, 2007 - 2020, 2030 (Europe) Households ('000) Water Meters ('000) Smart Water Meters ('000)
Market Revenue
$1.2B
Market Revenue
$2.6B
Market Revenue
$7.8B
22

Ballast Water Treatment Market q Shipping Traffic and Market Revenue Forecasts
Source: www.newscientist.com after the Royal Society/Gastner
The main shipping routes, 2007
Note: All figures are rounded; the base year is 2009. Source: Frost & Sullivan
2009-2012 2013-2016
2017-2020 4%
34%
62%
$1.35 billion
$11.6 billion
$21.1 billion
23

Ballast Water Treatment Market q Types of Ballast Water Treatment (BWT) Technologies
Total Ballast Water Treatment Systems Market: Overview of BWT Technologies and Competitive Environment
Ballast Water
Treatment (BWT)
Solutions
Solid-liquid separation
+ Chemical
disinfection and de-
chlorination
Physical disinfection
Micro-agitation
Advanced oxidation
Dis
infe
ctio
n
Ship owners and ship builders
Competitive Environment
Marine industry suppliers
Opportunity seekers
W&WW Industry Suppliers
Start-ups dedicated to BWT
Industrial groups
24

Global Water Market 2020 q 3 Big Predictions
2 Water Risk and Trading – Both Water Utilities and Water Intensive/Critical Industries to Invest, Insure and Trade Water
3 Smart Water Grid, Decarbonisation and Water Footprint To Establish as Key Differentiators.
1 Water FACTORY – Producing valuable commodity of water at REAL VALUE and recovering resources and producing renewable energy
“Vision for future water management in which the water sector is RESILIENT, water companies are more EFFICIENT and CUSTOMER FOCUSSED and in which water is VALUED
as the precious resource it is.” Water for Life, White paper for the UK Water Industry
25