SUSTAINABLE WATER MANAGEMENT: Securing Australia's future ...
166
SUSTAINABLE WATER MANAGEMENT SECURING AUSTRALIA’S FUTURE IN A GREEN ECONOMY A REPORT OF A STUDY BY THE AUSTRALIAN ACADEMY OF TECHNOLOGICAL SCIENCES AND ENGINEERING (ATSE)
Transcript of SUSTAINABLE WATER MANAGEMENT: Securing Australia's future ...
SUSTAINABLE WATER MANAGEMENT
SECURInG AUSTRALIA’S fUTURE In A GREEn ECOnOMy
SUSTAINABLE WATER MANAGEMENT:Securing Australia’s future in a green economy
© Australian Academy of Technological Sciences and Engineering
The Australian Academy of Technological Sciences and Engineering (ATSE)
A REPORT Of A STUDy By THE AUSTRALIAn ACADEMy Of TECHnOLOGICAL
SCIEnCES AnD EnGInEERInG (ATSE)

SUSTAINABLE WATER MANAGEMENT
Securing Australia’s future in a green economy
AUSTRALIAN ACADEMY OF TECHNOLOGICAL SCIENCES AND ENGINEERING (ATSE)
APRIL 2012
Australian Research Council
SUSTAINABLE WATER MANAGEMENT: Securing Australia’s future in a green economy
Report of a study by the Australian Academy of Technological Sciences and Engineering (ATSE)
© Australian Academy of Technological Sciences and Engineering (ATSE)
ISBN 978 1 921388 20 0
This work is copyright. Apart from any use permitted under the Copyright Act 1968, no part of it may be reproduced by any process without written permission from the publisher. Requests and inquiries concerning reproduction rights should be directed to the publisher.
Date of publication: April 2012
Publisher:
Australian Academy of Technological Sciences and Engineering
Level 1/1 Bowen Crescent
Melbourne Victoria 3004 Australia
GPO Box 4055
Melbourne Victoria 3001 Australia
Telephone +613/03 9864 0900
Facsimile +613/03 9864 0930
Principal Authors: Dr Brian Spies FTSE and Professor Graeme Dandy FTSE
This work is also available as a PDF document on the ATSE website at www.atse.org.au
This project was funded by the Australian Research Council’s Linkage Learned Academies Special Projects (LASP) scheme.
Design and production: Coretext, www.coretext.com.au
Printing: Geon Group Australia Pty Ltd
Cover: iStockphoto
Disclaimer
Use of the information contained in this report is at the user’s risk. While every effort has been made to ensure the accuracy of that information, the Australian Academy of Technological Sciences and Engineering does not make any warranty, express or implied, regarding it.
SUSTAINABLE WATER MANAGEMENTw
ww
.atse.org.au
iThe Australian Academy of Technological Sciences and Engineering (ATSE)
Executive SummaryThis report explores a framework for sustainable water management in Australia that is able to adapt to future challenges through fostering the principles of green growth – improving productivity and economic prosperity as well as improved environmental and social outcomes.
Water is vital for all aspects of life on Earth. It is a crucial resource underpinning Australia’s economy, society and environment. Many factors influence water security in Australia. These include population growth, environmental degradation, climate change and variability, rainfall, land use, pollution, institutional arrangements and demand for Australia’s exports, notably of natural resources and food. Sustainable water management will require technological innovation driving increased efficiency and productivity and enhanced environmental outcomes in order to balance economic, environmental and social issues.
Sustainable Water Management: Securing Australia’s future in a green economy explores the linkages and interdependencies between the many roles, uses and sources of water in Australia, examines the vital role of water in maintaining national prosperity under key challenges, develops a systems model for water supply security and highlights the importance of scientific development and technological innovation in moving to a cleaner, greener economy. Crucially, the report sets out how green growth principles can be fostered to develop sustainable water management strategies able to adapt to future challenges in recognition of the interdependencies between water, the economy, the environment and society.
The concept of green growth, as a core strategy for long-term sustainable development, emerged as a key priority at the United Nation’s first international Earth Summit in 1992, in Rio de Janeiro. Green growth implies growing productivity, prosperity and living standards while improving environmental and social outcomes and providing a framework for sustainable economic development that balances environmental, social and technological aspects. The core principle of green growth is that improvements in economic productivity should not come at the cost of natural resources, the environment or social wellbeing. A key challenge will be to achieve community-wide acceptance of green growth principles and shared responsibilities to achieve outcomes. The concept of green growth can be applied to water management strategies and government policy to achieve a balance between economic, social and environmental factors and to support the growth of new industries, bring technological innovations to market and position the country to capture green growth opportunities. Innovation, scientific development and new technologies will create jobs and export opportunities and address the decline in Australia’s productivity. Investment decisions will need to be based on a broader understanding of the externalities of water and energy use and the integration of social, environmental and economic factors.
Water and its interdependencies Water plays a critical role in the Australian economy. Water policy is governed by a mix of State and Commonwealth legislation, as well as regulatory, legal and institutional frameworks. Water makes a substantial contribution to the economy and related environmental goods and ecosystem services can further boost economic activity.
SUSTAINABLE WATER MANAGEMENT
ii
ww
w.a
tse.
org.
au
The Australian Academy of Technological Sciences and Engineering (ATSE)
Assessing the true value of this contribution is a challenge. Green growth outcomes could be measured through the provision of metrics from the integration of national water, economic and environmental accounts into a uniform accounting framework. Major water utilities are adopting sustainability strategies, based on triple-bottom-line analyses which will provide a useful starting point.
Water cannot be considered in isolation. A systems dynamic approach can be applied to encapsulate the complex feedback mechanisms associated with the interactions between water, energy, climate change, population and agriculture. There are strong interdependencies between water and energy, food and the carbon cycle. Water is required for a broad range of energy systems – recent droughts severely impacted electricity production across much of eastern Australia. Electricity security and reliability would be greatly enhanced by conversion of thermal power plants to dry or hybrid cooling.
Energy in turn plays a number of key roles in the water sector, as it is needed for construction and operation of water infrastructure, transport, treatment and distribution. Approximately 30 per cent of Australian household energy consumption is used to heat water and irrigation for agriculture consumes a substantial amount of energy. The development of alternative sources of water (such as desalination) often leads to significant increases in energy consumption. Biofuel production has led to competition for water resources, although next-generation biofuels offer opportunities for improvement. Population growth puts pressure on all resources, including land, water and energy. Technological improvements in energy and water efficiency, waste processing and recycling can help ameliorate potential ecological pressures from increasing population.
Water demand and supplyWater is crucial to human health and wellbeing, agriculture, industry, in the support of ecosystems and the environment, and in underpinning cultural and social values. It is consumed across all sectors of the Australian economy. Agriculture (predominantly irrigated agriculture) accounts for more than 50 per cent of Australia’s water consumption, with the remainder attributable to households, commercial and industrial uses (notably power generation) and the water supply industry.
The main driver of urban demand for water and electricity is population – and increasing energy demand drives increases in demand for water. Rural demand is dependent to a large extent on climatic conditions and water availability. The Murray–Darling Basin (MDB) contains one-quarter of Australia’s agricultural land and it accounts for approximately 50 per cent of irrigated land and irrigated water applied nationally. The MDB provides an example of complex and competing demands within the economic-social-environmental nexus and the importance of appropriate basin management plans for equitable allocation of water resources and long-term sustainability.
There are three broad categories of water sources – natural, recycled and manufactured. Most water sources are dependent on rainfall, which is highly variable over much of Australia. This variability is likely to become more extreme under climate change, further challenging supply planning and infrastructure. Seawater desalination is rainfall-independent and is being used as a reliable source of water. Australia’s variable rainfall is a key factor that often challenges the equitable allocation of water. Water supply is often insufficient to meet demand, particularly in times of low rainfall, in rural and urban areas. Water sharing plans should incorporate adaptive strategies that reflect the vagaries of climate and competing demands for water resources. During drought periods, demand reduction has been addressed by restrictions on how water is used. Utilities are diversifying sources of supply to include options of desalination and non-potable recycling (for example, recycled stormwater and wastewater). The use of recycled water to augment drinking water supply can be facilitated through a multi-barrier approach based on risk management principles, underpinned by technological advances.
SUSTAINABLE WATER MANAGEMENTw
ww
.atse.org.au
iiiThe Australian Academy of Technological Sciences and Engineering (ATSE)
Groundwater, used to supplement surface water supplies, is being extracted at unsustainable rates over much of Australia.
Portfolio optimisation for a large urban cityAs part of this study a water balance model for Adelaide was developed to simulate the operation of various sources of water and supply zones over the period 2010–50, under conditions of population growth and climate change. The model is based on the water balance of various storages and supply areas in metropolitan Adelaide and can be used to investigate the impacts of drawing water from the various sources to estimate the cost, energy requirements and associated greenhouse emissions and security of supply from different source combinations.
The study demonstrates a number of issues for the water supply of major coastal cities in Australia, including the need to have diversity of water sources and the importance of policy reforms to eliminate barriers to water trading and potable use of reclaimed treated water. This study indicates that large, expensive infrastructure programs such as desalination, although improving water security, may lock in costs that are difficult to justify on a long-term basis. A portfolio of water supply sources, which can be varied in response to changes in climate and other external impacts, offers the best chance of adaptation with the greatest net economic, social and environmental benefits.
Sustainable water managementInnovation and the emergence of new technologies play a crucial role in driving green growth in the water sector to achieve sustainable and effective water management that can adapt quickly and effectively to climate variability and changes in demand caused by economic and demographic transitions. The technological opportunities in the water sector can be assessed against selected green growth indicators covering economic, environmental and social impacts. The long lifetime and capital-intensive nature of water infrastructure necessitates a careful and robust process for evaluating investment decisions. The implementation of green growth policies requires a sound appreciation of the true value of water by the community, businesses, regulators and policy makers. Integration of economic-environmental accounts will go some way to improving the quantitative evaluation of water, but other non-market goods and services also need to be valued.
The productivity of the water sector has declined over the past decade, along with other sectors of the economy. Improvements to productivity in the water sector will be underpinned by better resource management, more efficient use of labour and advances in technology as well as integration with other services such as electricity and waste disposal. Adaptive planning, using real options for investment decisions. minimises the risk of unnecessary, high-cost investments. Efficient water markets ensure that water is most effectively allocated between competing uses to where it has highest value. Water pricing should reflect the value of water, but there is a need to improve the technical and economic evaluation of water externalities so that they can be incorporated into policy decisions.
Demand-side measures such as water efficiency programs are often the cheapest cost to implement, but when they extend to water restrictions, the external social and economic costs are born by the broader community. Policy barriers to rural-urban trading and potable reuse of recycled water should be removed. A holistic approach taking broad economic, environmental and social issues into account is essential for sustainable water management.
SUSTAINABLE WATER MANAGEMENT
iv
ww
w.a
tse.
org.
au
The Australian Academy of Technological Sciences and Engineering (ATSE)
The Green Growth in Australia ProjectThis report forms the first stage of Green Growth in Australia: examining the linkages within – and potential of – sustainable resources management to enable environmentally responsible economic growth. This is a three-year, three-stage ATSE program funded by the Australian Research Council as a Linkage Learned Academies Special Project (ARC-LASP). Through the three projects, the Academy aims to examine the interconnectivity of major resources, their role in securing Australia’s future prosperity, new technologies and strategies to optimise their sustainable use and the drivers and barriers to achieving a sustainable economy. The second stage of the research will explore how green growth principles can be used as framework for secure low-carbon energy systems and the third stage will explore, more broadly, the political and technological barriers to a clean, green, sustainable economy and potential governance mechanisms to address them.
In 2010 and 2011, ATSE and the National Academy of Engineering of Korea (NAEK) convened high-level workshops to share experiences and identify opportunities for collaboration in green growth areas such as low carbon energy, smart grids and carbon capture and sequestration (ATSE, 2011a, c). A third workshop will be held in 2012, focusing on the impact of climate change on future urban societies, considering water and energy security. The ATSE Green Growth in Australia project builds on these collaborative workshops.
SUSTAINABLE WATER MANAGEMENTw
ww
.atse.org.au
vThe Australian Academy of Technological Sciences and Engineering (ATSE)
Key Issues and RecommendationsThe key issues and recommendations arising from this report to support the adoption of green growth principles for sustainable water management in Australia are numbered below.
ISSUE: Green growthGreen growth describes a process for sustainable economic development that recognises the inter-relationship and inter-dependence of elements of the economy, the environment and society as a whole. A green growth strategy harnesses the economic opportunities provided by new technologies, while reducing the environmental impact from such changes. Green-growth principles can provide a comprehensive framework for managing Australia’s water resources and prioritising investment decisions.
RECOMMENDATION
1 To facilitate the uptake of green growth principles in water policy development, The Council of Australian Governments (COAG) should: (i) develop a national protocol to align green growth objectives in water management to apply across all levels of government; and (ii) accelerate the integration of national economic and environmental accounts to enable consistent analysis of the contributions of economic sectors and natural capital (e.g. water, soil, biodiversity and ecosystems).
ISSUE: Investment decisionsThe long lifetime and capital-intensive nature of water infrastructure necessitates a careful and robust process for evaluating investment decisions. Triple-bottom-line approaches ensure that social, economic and environmental factors are taken into account.
RECOMMENDATIONS
2 Investment decisions by water authorities should be based on balanced social, economic and environmental analysis, informed by sound scientific advice and implemented through transparent and contestable processes.
3Governments should ensure that externalities such as greenhouse-gas emissions, land degradation and water use and pollution are priced into goods and services wherever possible, to provide market signals to improve environmental and social outcomes.
ISSUE: Investment in technologyTechnological and scientific innovation will underpin green growth in the water sector.
RECOMMENDATIONS
4Governments should encourage investment and uptake of energy-efficient and flexible water supply options such as water grids and decentralised systems which increase efficiency and productivity and reduce environmental impact.
SUSTAINABLE WATER MANAGEMENT
vi
ww
w.a
tse.
org.
au
The Australian Academy of Technological Sciences and Engineering (ATSE)
5 Government support for innovation in water management should be carefully targeted to accelerate the development and uptake of technologies leading to greater efficiency in supply and use.
ISSUE: Water rolesWater roles. Water is a crucial resource interrelated with almost all sectors of the economy, including agriculture, mining, electricity production, manufacturing, recreation and tourism. Water supports the environment, underpinning ecosystem services and social and cultural values.
RECOMMENDATION
6Government policy development should take a holistic approach, recognising the multiple roles and interdependencies of water within the Australian economy, environment and society.
ISSUE: Portfolio approachA reliable, secure, cost-effective water supply, able to respond to changes in population and climate, can be provided by expanded access to a wider range of water sources. Greater integration of water sources (natural, recycled or manufactured) in urban water supply will require sophisticated risk management and water quality monitoring strategies to ensure the primacy of public health.
RECOMMENDATIONS
7A portfolio approach to investments in water sources and management strategies should be fostered by all governments to provide resilience to natural climate variability, anticipated changes in rain-fed supply arising from climate change, and growing demand. Government
planning should include managing for high risk, catastrophic events.
8Where additional drinking water supplies are required, desalination, as well as recycled wastewater and treated stormwater for potable use, should be considered based on their economic, environmental and social merits. A multi-barrier approach should be adopted to
maintain primacy for the protection of human health.
9 A long-term participatory public awareness program should be undertaken to overcome negative community perceptions of recycled wastewater and treated stormwater and to assist public acceptance of potable recycling.
ISSUE: Economic efficiencyEconomic efficiency is impaired by cross-subsidies between sectors and incentives that distort price signals for water consumers.
RECOMMENDATION
10Cross-subsidies within and between economic sectors should be minimised and price signals improved to reflect the true cost, and value, of water. Where subsidies are provided, their cost and rationale should be transparently communicated to stakeholders.

SUSTAINABLE WATER MANAGEMENTw
ww
.atse.org.au
viiThe Australian Academy of Technological Sciences and Engineering (ATSE)
ISSUE: Water-energy nexusThe water and energy sectors are inextricably linked. For example, the provision of water and sewerage services involves significant energy consumption and most forms of energy generation require water. Water and energy policies should recognise the interdependencies between these sectors.
RECOMMENDATION
11Water and energy policies should recognise the interdependencies between these and other industry sectors and subsidies that distort price signals on the true value of water should be eliminated.
ISSUE: National Water InitiativeReforms in water management, led by COAG through the National Water Initiative, have made major inroads since 2004 into developing a nationally agreed, coherent set of principles and reform actions to achieve optimal economic, environmental and social outcomes. However there is still much to be done, particularly in addressing the over-allocation of water, broadening sector coverage and eliminating policy barriers to efficient water markets.
RECOMMENDATIONS
12The next iteration of the National Water Initiative should extend water markets to include energy and land use changes including mining and extraction.
13The next iteration of the National Water Initiative should continue to address and eliminate policy barriers to efficient water markets – including rural-urban transfers and potable use of recycled water.
ISSUE: Social impactEfficient water markets require the clear transmission of price signals to all water users to reflect water availability. Increasing water prices may have disproportionately adverse impacts on socially disadvantaged groups.
RECOMMENDATION
14Water and energy pricing policy should not distort the transmission of price signals to all water users and any adverse social impacts should be addressed by social policy.
ISSUE: Support for R&D and commercialisationThe ‘public-good’ nature of water justifies government support for research and development (R&D), in the water sector, driving innovation, increased efficiency and productivity. Many of Australia’s existing R&D programs in the water sector are nearing the end of their terms, and there is a need for a coordinated national approach to the next generation of R&D programs.
RECOMMENDATIONS
15A national R&D strategy for water, recognising its multiple roles and importance across the Australian economy, should be developed and its components prioritised.
16Public funding should be provided for public-good research and support for commercialisation of emerging technologies to improve the efficiency of water use and improve environmental outcomes.
SUSTAINABLE WATER MANAGEMENT
viii
ww
w.a
tse.
org.
au
The Australian Academy of Technological Sciences and Engineering (ATSE)
Report StructureThe structure of this report is outlined below.
Chapter 1, Introduction, defines and describes green growth, outlining how the concept can be applied to water management strategies and government policy to achieve a balance between economic, social and environmental needs.
Chapter 2, The Role of Water in the Australian Economy, describes the importance of water in maintaining the social, environmental and economic fabric of the country, providing an overview of the role of water in the Australian economy and the legislative framework for access to water. It describes the national water accounts and monetary water accounts, the role of environmental goods and ecosystem services and moves to integrate the national economic and environmental accounts into a uniform accounting framework to support green growth for long-term sustainability. Examples of using triple-bottom-line analysis to inform investment decisions demonstrate advances being made by water utilities in embracing green growth principles are described.
Chapter 3, Interdependencies, outlines the major connections between water and other economic and societal sectors in Australia. It highlights the major drivers, influences and feedback mechanisms, using a systems model for water security to describe the causal linkages between sectors and the impact of influences such as climate change and variability, population growth and policies (focusing on water and energy policies).
Chapter 4, Water demand, provides an overview of the diverse users of water in Australia – including urban consumers, rural and agricultural users and major industries (including electricity generation and mining). It describes the crucial role of water in supporting ecosystems and environmental assets, further, in underpinning cultural and social values. Achieving green growth in the water sector requires strategic vision, political leadership and a strong science base to help to balance competing demands. The MDB provides an example of the many, sometimes competing, demands in the economic-social-environmental nexus and the importance of appropriate basin management plans for equitable allocation of water resources.
Chapter 5, Water supply, describes the various sources of water (natural, manufactured and recycled), exploring the increasing role of desalination, water recycling and reuse in urban areas, and the impact of climate change and variability on supply. Water utilities are rapidly diversifying their sources of supply to include options of desalination and non-potable recycling; groundwater is being extracted at an unsustainable rate in both rural and urban areas. Potable recycling could be fully integrated into the water supply system, bringing improvements to economic and environmental outcomes, due to developments in water treatment technology.
Chapter 6, Linkages, illustrates the strong interdependencies of water with energy, food and the carbon cycle, describing in detail the linkages between water and energy use in the urban and rural sectors, including the relative energy costs of seawater desalination, pumping water through pipelines and wastewater treatment and recycling. This chapter explores drivers of improvements in energy-efficient and water saving technologies, such as increasing electricity prices and water scarcity, as well as
SUSTAINABLE WATER MANAGEMENTw
ww
.atse.org.au
ixThe Australian Academy of Technological Sciences and Engineering (ATSE)
challenges and opportunities of biofuels and biosequestration and links with agricultural activities. The projected impact of climate change and population growth are discussed.
Chapter 7, Portfolio options for a large city: Adelaide case study, demonstrates how a flexible portfolio of water sources can ensure the security of supply to a large city, and the importance of open water markets to secure water at the lowest cost under the challenges of changing climate and growing demand. The case study maps out the choices available with a range of water supply options, under scenarios created by uncertainties such as unpredictable rainfall, climate change and population growth. The case study considers Adelaide because it has access to a range of water sources and has major stormwater harvesting and wastewater recycling programs in place.
Chapter 8, Sustainable water management, presents strategies for sustainable water management underpinned by the principles of green growth. The chapter illustrates that green growth principles drive economic efficiency, productivity improvements and prosperity. It describes how transparent, open markets and adaptive planning practices can lead to financial benefits, how monetising ecosystem externalities can benefit environmental outcomes and how technological developments can underpin improved productivity, resilience and efficiency.
Chapter 9, Conclusions and recommendations, concludes the report with recommendations for policy development and R&D priorities.

SUSTAINABLE WATER MANAGEMENT
x
ww
w.a
tse.
org.
au
The Australian Academy of Technological Sciences and Engineering (ATSE)
AcknowledgementsThe Academy is most grateful for the contributions made by the authors of the report, the Steering Committee established to oversee the conduct of the project and input received from the external reviewers and contributors.
The principal authors of this report were Dr Brian Spies FTSE and Professor Graeme Dandy FTSE.
Dr Spies’ career spans senior research and management roles in resource and environmental sectors in Australia and the US, including with CSIRO, ANSTO and Schlumberger-Doll Research. Most recently he was Principal Scientist, Sustainability and Climate Change, at the Sydney Catchment Authority. Dr Spies is a senior visiting fellow at the University of NSW and currently serves as Deputy Chair of the ATSE Water Forum.
Professor Dandy is a Professor in the School of Civil, Environmental and Mining Engineering at the University of Adelaide. Professor Dandy’s research interests include modelling, optimisation and artificial intelligence techniques applied to water resources planning and management. Professor Dandy is a member of the ATSE Water Forum Committee.
The project was overseen on behalf of the Academy by a Steering Committee:¢Mr Peter Laver AM FTSE (Chair) ¢Dr Vaughan Beck FTSE (ex officio)¢Dr Tom Connor AO FTSE¢Mr Chris Davis¢Dr Graeme Pearman AM FAA FTSE¢The Hon Karlene Maywald¢ Emeritus Professor Tom McMahon FTSE¢Dr John Radcliffe AM FTSE¢Mr Martin Thomas AM FTSE¢Mr Ross Young
The authors would like to express their sincere thanks the ATSE Steering Committee for their guidance and comments during various stages of the project.
The project was established, managed and edited by ATSE staff, principally by Dr Vaughan Beck FTSE (Executive Director, Technical, ATSE) and Harriet Harden-Davies (Senior Policy & Project Officer, ATSE). The production of this publication was overseen by Mr Bill Mackey (Deputy CEO, ATSE).
SUSTAINABLE WATER MANAGEMENTw
ww
.atse.org.au
xiThe Australian Academy of Technological Sciences and Engineering (ATSE)
The draft report was reviewed by:¢�Dr Jamie Pittock (Program Leader, Australia and US Climate, Energy and Water, US Studies Centre);
and¢ Professor Ana Deletic FTSE (Director, Centre for Water Sensitive Cities, Monash University).
The input and advice from ATSE Fellows to the project was invaluable. Several experts were also consulted during the course of the study, these are referenced in the report and/or noted below. The input of this expert knowledge is gratefully acknowledged. ¢Mr Andrew Cadogan-Cowper, Australian Bureau of Statistics, Canberra¢ Professor Declan Conway, ACCARNSI and University of East Anglia, UK¢Dr Richard Davis, National Water Commission, Canberra¢Dr Christopher Dey, University of Sydney¢Dr Bob Humphries, Water Corporation (WA)¢Mr Richard Hunwick, Hunwick Consultants, Sydney¢ Professor Gary Jones, eWater CRC, Canberra¢Mr Steven Kenway, University of Queensland¢Mr Brad Moggridge, CSIRO, Canberra¢Dr Barry Newell and Dr Katrina Proust, ANU, Canberra¢Mr Neil Palmer, National Centre of Excellence in Desalination, Murdoch University, WA¢Dr Jamie Pittock, Australian National University, Canberra¢Dr Nicola Nelson and Mr Greg Allen, Sydney Water¢Dr Susan Pond AM FTSE, United States Studies Centre, Sydney¢�Professor Bruce Thom AM FTSE and Claire Parkes, Wentworth Group of Concerned Scientists,
Sydney
ATSE gratefully acknowledges funding provided by the Australian Research Council (ARC) under the Linkage Learned Academies Special Projects program to conduct this project. The views expressed herein are those of ATSE and not necessarily those of the supporting organisations.

SUSTAINABLE WATER MANAGEMENT
xii
ww
w.a
tse.
org.
au
The Australian Academy of Technological Sciences and Engineering (ATSE)
SUSTAINABLE WATER MANAGEMENTw
ww
.atse.org.au
xiiiThe Australian Academy of Technological Sciences and Engineering (ATSE)
ContentsExecutive Summary ...................................................................................................................................................................................................................................................................................i
Key Issues and Recommendations.....................................................................................................................................................................................v
Acknowledgements ..............................................................................................................................................................................................................................................................................x
1. Introduction ..............................................................................................................................................................................................................................................................................................................1 1.1 Green growth ....................................................................................................................................................................................................................................................................................................................................1
1.2 Key water statistics ...................................................................................................................................................................................................................................................................................................................4
1.3 Technology opportunities for sustainable water management: a summary ....................................................................................................................5
2. The Role of Water in the Australian Economy ......................................................................................................9 2.1. Regulation and legislation ....................................................................................................................................................................................................................................................................................10
2.2 National water accounts ............................................................................................................................................................................................................................................................................................11
2.3 Monetary water accounts ........................................................................................................................................................................................................................................................................................13
2.4 Water use and contribution to GDP .......................................................................................................................................................................................................................................................13
2.5 Environmental goods and services .........................................................................................................................................................................................................................................................14
2.6 Integrated environmental-economic accounts ................................................................................................................................................................................................................16
2.7 Sustainability strategies in the water sector............................................................................................................................................................................................................................17
3. Interdependencies ..............................................................................................................................................................................................................................................................23 3.1 Influence diagram .................................................................................................................................................................................................................................................................................................................25
4. Water demand (users of water) ....................................................................................................................................................................................26 4.1 Climate and water consumption.................................................................................................................................................................................................................................................................28
4.2 Urban demand ............................................................................................................................................................................................................................................................................................................................29
4.3 Rural demand ................................................................................................................................................................................................................................................................................................................................31
4.3.1 Irrigation ............................................................................................................................................................................................................................................................................................................................32
4.3.2 The Murray–Darling Basin: A macrocosm of competing demands............................................................................................................................33
4.3.3 Rural ‘values’ ................................................................................................................................................................................................................................................................................................................37
4.4 Energy .........................................................................................................................................................................................................................................................................................................................................................38
4.4.1 Water use in electricity generation ......................................................................................................................................................................................................................................38
4.4.2 Demand projections for electricity .....................................................................................................................................................................................................................................40
4.4.3 Climate impacts on electricity production ............................................................................................................................................................................................................40
4.5 Mining and resources ......................................................................................................................................................................................................................................................................................................41
4.6 Environmental flows .........................................................................................................................................................................................................................................................................................................41
4.7 Cultural flows .................................................................................................................................................................................................................................................................................................................................42
5. Water supply (sources of water)................................................................................................................................................................................44 5.1 Rain-fed water ..............................................................................................................................................................................................................................................................................................................................44
5.1.1 Water–climate linkages............................................................................................................................................................................................................................................................................46
5.1.2 Climate impacts on water supply ..........................................................................................................................................................................................................................................47
5.1.3 Extreme events and climate change ................................................................................................................................................................................................................................51
5.2 Urban water supply ............................................................................................................................................................................................................................................................................................................52
5.3 Manufactured water ..........................................................................................................................................................................................................................................................................................................53
SUSTAINABLE WATER MANAGEMENT
xiv
ww
w.a
tse.
org.
au
The Australian Academy of Technological Sciences and Engineering (ATSE)
5.4 Recycled water ............................................................................................................................................................................................................................................................................................................................55
5.4.1 Recycling water for industry ...........................................................................................................................................................................................................................................................57
5.4.2 Recycling water for drinking ..........................................................................................................................................................................................................................................................57
5.5 Decentralised water systems .............................................................................................................................................................................................................................................................................60
6. Linkages ..............................................................................................................................................................................................................................................................................................................................62 6.1 Water-energy-carbon linkages .......................................................................................................................................................................................................................................................................62
6.1.1 Energy required for pumping water .................................................................................................................................................................................................................................64
6.1.2 Energy required for desalination ............................................................................................................................................................................................................................................65
6.1.3 Energy required for potable water reclamation ...........................................................................................................................................................................................65
6.1.4 Energy and urban water use...........................................................................................................................................................................................................................................................67
6.1.5 Energy and agricultural water use ........................................................................................................................................................................................................................................70
6.2 Water-food-energy linkages ................................................................................................................................................................................................................................................................................72
6.2.1 Biofuels .................................................................................................................................................................................................................................................................................................................................73
6.2.2 Biosequestration .................................................................................................................................................................................................................................................................................................74
6.3 Water-population linkages.....................................................................................................................................................................................................................................................................................74
7. Portfolio options for a large city: Adelaide case study .........................................78 7.1 Portfolio of sources ..............................................................................................................................................................................................................................................................................................................81
7.2 Effect of climate change and climate variability ..............................................................................................................................................................................................................83
7.3 Discussion ............................................................................................................................................................................................................................................................................................................................................84
8. Sustainable water management ...........................................................................................................................................................................86 8.1 Securing future water supplies ......................................................................................................................................................................................................................................................................87
8.1.1 Water grids .....................................................................................................................................................................................................................................................................................................................87
8.1.2 Integrated water management .................................................................................................................................................................................................................................................87
8.1.3 Water trading .............................................................................................................................................................................................................................................................................................................88
8.1.4 Rural-urban transfers ...................................................................................................................................................................................................................................................................................90
8.2 Costing and pricing water .......................................................................................................................................................................................................................................................................................91
8.2.1 Adaptive management, options and resilience ...........................................................................................................................................................................................93
8.2.2 Urban water pricing .......................................................................................................................................................................................................................................................................................94
8.2.3 Rural water pricing ...........................................................................................................................................................................................................................................................................................94
8.2.4 Subsidies............................................................................................................................................................................................................................................................................................................................95
8.3 Economic efficiency and green growth ..........................................................................................................................................................................................................................................95
8.3.. Productivity .....................................................................................................................................................................................................................................................................................................................95
8.3.2 Externalities ..................................................................................................................................................................................................................................................................................................................96
8.3.3 Towards green growth in the water sector .......................................................................................................................................................................................................103
9. Conclusions and Recommendations..................................................................................................................................................99
Acronynms ......................................................................................................................................................................................................................................................................................................................104
References .........................................................................................................................................................................................................................................................................................................................106
Appendix A. Modelling Adelaide’s water supply in a changing climate: Implications for cost, energy, greenhouse gas emissions and security of supply ......................................................................121
Appendix B. Details of the Adelaide water balance model .....................140
SUSTAINABLE WATER MANAGEMENTw
ww
.atse.org.au
1The Australian Academy of Technological Sciences and Engineering (ATSE)
1. Introduction
Water is of critical importance to the daily lives of all Australians. It is essential for domestic use, primary and secondary industries, and environmental water is needed to preserve rivers and wetlands. Water management and government policies are often subject to close scrutiny within the Australian community, particularly when competing demands arise in times of drought and water scarcity.
1.1 Green growth“We need to make growth greener, to make our economic and environmental policies more compatible and even mutually-reinforcing. This is not just a matter of new technologies or new sources of renewable, safe energy. It is about how we all behave every day of our lives, what we eat, what we drink, what we recycle, re-use, repair, how we produce and how we consume.”
– OECD Secretary-General Angel Gurría, 2011
The origins of green growth trace back to the United Nation’s first international Earth Summit held in Rio de Janeiro in 1992, which developed a global plan of action for sustainable development, including an agreement on the Convention on Biological Diversity, and the Climate Change Convention that led to the Kyoto Protocol. The Earth Summit agreements were successively reviewed and advanced over time. While progress has been made, long-term sustainable growth will require further action by governments to translate green growth principles into policy development and industry behavior to ensure more efficient use of natural resources and reduction of carbon emissions. The “Rio+20” summit is scheduled for June 2012 in Brazil with the goal of securing renewed political commitment for sustainable development. The
Chapter Summary This chapter defines and describes green growth, outlining how the concept can be applied to water management strategies and government policy to achieve a balance between economic, social and environmental needs.¢�Water is vital for all aspects of life. It supports Australia’s economy, lifestyle and the environment.¢�Australia’s variable rainfall, growing population and burgeoning export industries present the
greatest challenges to equitable allocation of water among competing uses.¢�Australia is particularly vulnerable to climate change and climate variability. Their effects are
being felt foremost in the water sector, increasing the urgency for more sophisticated adaptive management approaches.
¢�The principles of green growth provide a framework for sustainable water management that recognises the inter-relationships and interdependencies of water within the economy, the environment and society.
¢�Strategies for achieving green growth include enhancing productivity, reducing waste and consumption of non-renewable resources, and efficient markets to make resources available to the highest-value use.
¢�The transition to a green growth economy will create opportunities in low-energy and less resource-intensive industries. Improved understanding of climate and hydrology, technological advances in infrastructure for supply, distribution and treatment, and integration with other services such as electricity and waste disposal will create new jobs and export opportunities.
¢�Improvements in economic productivity should not be made at the expense of environmental values and social amenity. Investment decisions should be based on a broader understanding and, where possible, monetisation of externalities and integration of social, environmental and economic factors.
SUSTAINABLE WATER MANAGEMENT
2
ww
w.a
tse.
org.
au
The Australian Academy of Technological Sciences and Engineering (ATSE)
1 http://www.businessgreen.com/bg/news/2033808/china-confirms-green-growth-plan
conference will focus two themes: ¢ “a green economy in the context of sustainable development and poverty eradication”; and ¢ “the institutional framework for sustainable development” (UNEP, 2011a; UNCSD, 2012).
‘Green growth’ as a strategy for sustainable development has been promoted by the Organisation for Economic Co-operation and Development (OECD) as a response to environmental degradation brought about by rapid economic growth. Green growth recognises the interdependency between economic and environmental systems, and the risks posed by increased water scarcity, resource bottlenecks, air and water pollution, soil degradation, climate change and biodiversity loss. It aims to catalyse investment and innovation to underpin sustained growth and give rise to new economic opportunities, and decouple environmental pressures from economic growth. The OECD’s Green Growth Strategy brings together economic, environmental, social, technological and development aspects into one comprehensive framework (OECD, 2011a,c).
Green growth has been strongly supported in the Asia-Pacific region through the United Nations Economic and Social Commission for Asia and the Pacific (ESCAP), most notably in economies such as the Republic of Korea and China. In March 2011, Chinese Premier Wen Jiabao spoke of the need to shift its measure of economic success from GDP-focus towards a broader set of sustainability metrics to save energy and reduce reliance on fossil fuels.
“Without radically changing the mindset and criteria assessing the performance of our officials, it would be difficult to achieve the goals set by the five-year plan.”
– Chinese Premier Wen Jiabao1
Green growth is directed at the interface of economic and environmental policy. It provides a strong focus on innovation, investment and competition that can give rise to new sources of economic growth, consistent with resilient ecosystems and the preservation of natural capital.
The economy and the environment are inextricably linked. The environment provides the raw materials and energy for the production of goods and services that support lifestyles, it also sustains damage through activities, such as those of households, businesses and agriculture. The most common measure of the state of the economy is Gross Domestic Product (GDP), which is compiled by the Australian Bureau of Statistics (ABS) and widely reported in the media. GDP is the ‘market value’ of all goods and services and incorporates income, expenditure and production. However, the national economic accounts are sometimes criticised for including the value of goods and services produced and the income generated through the use of environmental assets, but not reflecting the economic cost of depleting those assets or the damage that arises from economic activity (ABS, 2003).
DefinitionsThe ABS is exploring how environmental-economic accounts (Section 2.6) can better inform policy development and monitor progress towards a green economy in Australia. However, as highlighted by ABS researchers Cadogan-Cowper and Johnson (2011), the notion of a green economy is relative, not absolute, with multiple dimensions interlinked with a diverse set of economic, environmental and societal metrics. Definitions are confused by widespread use of terms such as green economy, sustainability, green growth, green jobs, environment sector and other variations in the research literature and popular news media. The following definitions, drawn from the United Nations Green Economy Report and the OECD Green Growth Strategy offer a clear definition and have been adopted in this report:
SUSTAINABLE WATER MANAGEMENTw
ww
.atse.org.au
3The Australian Academy of Technological Sciences and Engineering (ATSE)
“A green economy can be defined as an economy that results in improved human well- being and reduced inequalities over the long term, while not exposing future generations to significant environmental risks and ecological scarcities. It is characterised by substantially increased investments in economic sectors that build on and enhance the earth’s natural capital or reduce ecological scarcities and environmental risks. These investments and policy reforms provide the mechanisms and the financing for the reconfiguration of businesses, infrastructure and institutions and the adoption of sustainable consumption and production processes. Such reconfiguration leads to a higher share of green sectors contributing to GDP, greener jobs, lower energy and resource intensive production, lower waste and pollution and significantly lower greenhouse gas emissions.”
– The UNEP 2011 Green Economy Report
“Green growth is about fostering economic growth and development while ensuring that the quality and quantity of natural assets can continue to provide the environmental services on which our well-being relies. It is also about fostering investment, competition and innovation which will underpin sustained growth and give rise to new economic opportunities.”
– OECD 2011 Draft Monitoring Progress Towards Green Growth
While there are some differences in emphasis, it would appear that these descriptions of green growth are essentially similar and can be used interchangeably. Green growth is forward-looking (strategic) and multifaceted, incorporating notions of sustainable economic growth, reduced environmental impact, inter-generational equity, improving quality of life and harnessing growth opportunities from new technologies and products (Cadogan-Cowper and Johnson, 2011).
Green growth and sustainable water managementStrategies for achieving green growth include enhancing productivity, reducing waste and the consumption of non-renewable energy and making resources available to highest value use. Cost savings can result from reduction in resource bottlenecks and avoidance of irreversible degradation of ecosystem functions. It is estimated that the global transition to a low-carbon, resource-efficient economy will drive a green products and services market growing at over 11 per cent per annum, worth $2.2 trillion/year by 2020 (HSBC Global Research, 2010).
Green growth does not require an ever-increasing population base, or unlimited consumption of resources. Exponential growth clearly cannot continue indefinitely. Limits must eventually be reached and new methods of maintaining or improving the quality of life, resilient to demographic and climatic shifts, must be developed. New macroeconomic models to sustain prosperity in developed countries that do not rely on relentless growth and expanding material throughout are being investigated ( Jackson, 2009). In the past quarter of a century the global economy has doubled, while an estimated 60 per cent of the world’s ecosystems have been degraded. Much of Australia’s agricultural activity results in a net loss of national wealth when soil loss and land and ecosystem degradation are accounted for.
Water management over the coming decades will require flexibility and innovation in order to adapt smoothly and efficiently to changes in climate, which impacts rain-fed supply and, to a lesser extent, changes in demand caused by population and demographic shifts as well as customised, fit-for-purpose water quality specifications matched to user requirements.
Improvements to productivity in water management will be underpinned by more efficient use of labour and advances in technology (especially infrastructure for supply, distribution and treatment) as well as integration with other services such as electricity supply and distribution and waste disposal. However, improvements in economic productivity cannot be made at the expense of environmental values and social amenity, as perceived advantages will be fleeting and unsustainable. Investment decisions should
SUSTAINABLE WATER MANAGEMENT
4
ww
w.a
tse.
org.
au
The Australian Academy of Technological Sciences and Engineering (ATSE)
be based on a broader understanding and, where possible, monetisation of externalities and integration of social, environmental and economic factors (Chapter 8).
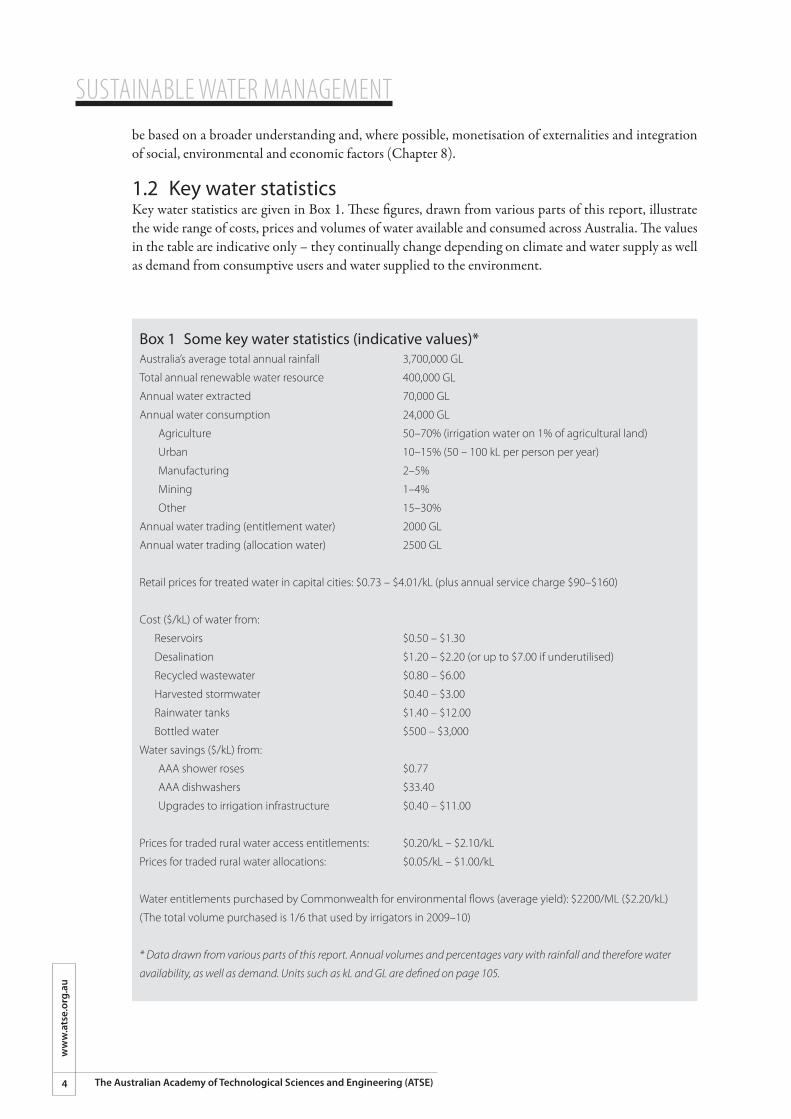
1.2 Key water statisticsKey water statistics are given in Box 1. These figures, drawn from various parts of this report, illustrate the wide range of costs, prices and volumes of water available and consumed across Australia. The values in the table are indicative only – they continually change depending on climate and water supply as well as demand from consumptive users and water supplied to the environment.
Box 1 Some key water statistics (indicative values)*Australia’s average total annual rainfall 3,700,000 GL
Total annual renewable water resource 400,000 GL
Annual water extracted 70,000 GL
Annual water consumption 24,000 GL
Agriculture 50–70% (irrigation water on 1% of agricultural land)
Urban 10–15% (50 – 100 kL per person per year)
Manufacturing 2–5%
Mining 1–4%
Other 15–30%
Annual water trading (entitlement water) 2000 GL
Annual water trading (allocation water) 2500 GL
Retail prices for treated water in capital cities: $0.73 – $4.01/kL (plus annual service charge $90–$160)
Cost ($/kL) of water from:
Reservoirs $0.50 – $1.30
Desalination $1.20 – $2.20 (or up to $7.00 if underutilised)
Recycled wastewater $0.80 – $6.00
Harvested stormwater $0.40 – $3.00
Rainwater tanks $1.40 – $12.00
Bottled water $500 – $3,000
Water savings ($/kL) from:
AAA shower roses $0.77
AAA dishwashers $33.40
Upgrades to irrigation infrastructure $0.40 – $11.00
Prices for traded rural water access entitlements: $0.20/kL – $2.10/kL
Prices for traded rural water allocations: $0.05/kL – $1.00/kL
Water entitlements purchased by Commonwealth for environmental flows (average yield): $2200/ML ($2.20/kL)
(The total volume purchased is 1/6 that used by irrigators in 2009–10)
* Data drawn from various parts of this report. Annual volumes and percentages vary with rainfall and therefore water
availability, as well as demand. Units such as kL and GL are defined on page 105.
SUSTAINABLE WATER MANAGEMENTw
ww
.atse.org.au
5The Australian Academy of Technological Sciences and Engineering (ATSE)
1.3 Technological opportunities for sustainable water management: a summary
Scientific and technological innovation will drive increased efficiency, increased productivity and reduction in the environmental impact of the water sector – and will underpin sustainable water management into the future. Some of this technology will be developed locally through R&D and innovation programs (and this will offer export potential), while the remainder of the technology will be imported. Australia needs to be an efficient developer and fast adopter – this means a focus on early deployment of a mix of technologies for which we have good quality resources to facilitate domestic learning and skills development. This also requires excellent education and research systems to support the training of engineers and scientists with the understanding and know how to exploit these technologies.
Technological opportunities must be assessed across multiple green growth, sustainability indicators, such as lower energy and resource demand, reduced waste and pollutants, increased economic efficiency, and the conservation of natural assets. The impact of deploying an innovative or advanced technology may have financial benefits (that is, reduced cost) but may not be beneficial when assessed across multiple sustainability indicators. For example, a new pesticide may improve on-farm agricultural output but harm the environment; advanced water treatment may purify water to very high levels but require excessive energy consumption; and increased automation may improve the profitability of a business enterprise but impact negatively on total employment.
The broader impacts of deployment of innovative and advanced technology are often highly complex, involve societal values and span communities, states and nations – tensions between various interest groups can arise. Therefore, strategic policies that drive long-term sustainability, beyond an election cycle, are of key importance. These issues are explored further in Chapter 8.
New technologies have a crucial role in improving sustainability and driving green growth in the water sector. A list of technological opportunities drawn from various parts of this report is given in the following four tables. Selected green growth indicators covering economic, environmental and social impacts are also included. Ideally, a rigorous, quantitative approach to sustainability assessment, such as described in Section 2.7 and Chapter 8, should be utilised for a more complete evaluation.
SUSTAINABLE WATER MANAGEMENT
6
ww
w.a
tse.
org.
au
The Australian Academy of Technological Sciences and Engineering (ATSE)
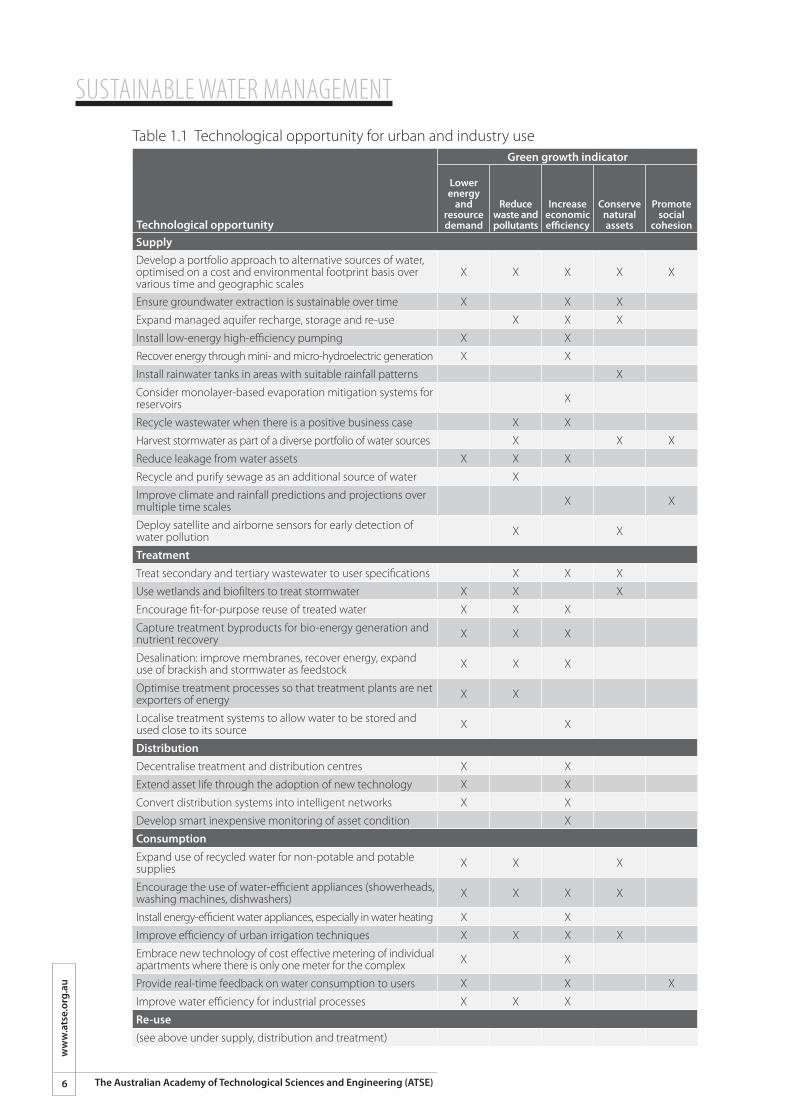
Table 1.1 Technological opportunity for urban and industry use
Technological opportunity
Green growth indicator
Lower energy
and resource demand
Reduce waste and pollutants
Increase economic efficiency
Conserve natural assets
Promote social
cohesion
SupplyDevelop a portfolio approach to alternative sources of water, optimised on a cost and environmental footprint basis over various time and geographic scales
X X X X X
Ensure groundwater extraction is sustainable over time X X X
Expand managed aquifer recharge, storage and re-use X X X
Install low-energy high-efficiency pumping X X
Recover energy through mini- and micro-hydroelectric generation X X
Install rainwater tanks in areas with suitable rainfall patterns X
Consider monolayer-based evaporation mitigation systems for reservoirs X
Recycle wastewater when there is a positive business case X X
Harvest stormwater as part of a diverse portfolio of water sources X X X
Reduce leakage from water assets X X X
Recycle and purify sewage as an additional source of water X
Improve climate and rainfall predictions and projections over multiple time scales X X
Deploy satellite and airborne sensors for early detection of water pollution X X
TreatmentTreat secondary and tertiary wastewater to user specifications X X X
Use wetlands and biofilters to treat stormwater X X X
Encourage fit-for-purpose reuse of treated water X X X
Capture treatment byproducts for bio-energy generation and nutrient recovery X X X
Desalination: improve membranes, recover energy, expand use of brackish and stormwater as feedstock X X X
Optimise treatment processes so that treatment plants are net exporters of energy X X
Localise treatment systems to allow water to be stored and used close to its source X X
DistributionDecentralise treatment and distribution centres X X
Extend asset life through the adoption of new technology X X
Convert distribution systems into intelligent networks X X
Develop smart inexpensive monitoring of asset condition X
ConsumptionExpand use of recycled water for non-potable and potable supplies X X X
Encourage the use of water-efficient appliances (showerheads, washing machines, dishwashers) X X X X
Install energy-efficient water appliances, especially in water heating X X
Improve efficiency of urban irrigation techniques X X X X
Embrace new technology of cost effective metering of individual apartments where there is only one meter for the complex X X
Provide real-time feedback on water consumption to users X X X
Improve water efficiency for industrial processes X X X
Re-use(see above under supply, distribution and treatment)
SUSTAINABLE WATER MANAGEMENTw
ww
.atse.org.au
7The Australian Academy of Technological Sciences and Engineering (ATSE)
Technological opportunity
Green growth indicator
Lower energy
and resource demand
Reduce waste and pollutants
Increase economic efficiency
Conserve natural assets
Promote social
cohesion
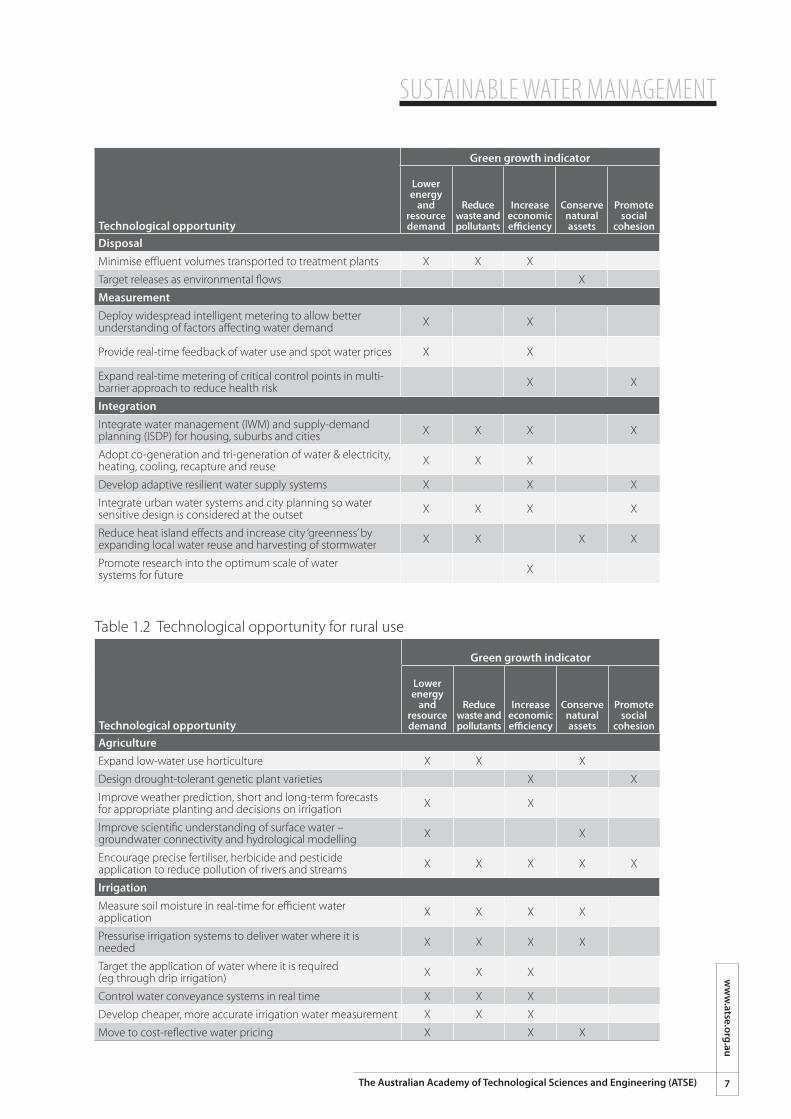
DisposalMinimise effluent volumes transported to treatment plants X X X
Target releases as environmental flows X
MeasurementDeploy widespread intelligent metering to allow better understanding of factors affecting water demand X X
Provide real-time feedback of water use and spot water prices X X
Expand real-time metering of critical control points in multi-barrier approach to reduce health risk X X
IntegrationIntegrate water management (IWM) and supply-demand planning (ISDP) for housing, suburbs and cities X X X X
Adopt co-generation and tri-generation of water & electricity, heating, cooling, recapture and reuse X X X
Develop adaptive resilient water supply systems X X X
Integrate urban water systems and city planning so water sensitive design is considered at the outset X X X X
Reduce heat island effects and increase city ‘greenness’ by expanding local water reuse and harvesting of stormwater X X X X
Promote research into the optimum scale of water systems for future X
Table 1.2 Technological opportunity for rural use
Technological opportunity
Green growth indicator
Lower energy
and resource demand
Reduce waste and pollutants
Increase economic efficiency
Conserve natural assets
Promote social
cohesion
AgricultureExpand low-water use horticulture X X X
Design drought-tolerant genetic plant varieties X X
Improve weather prediction, short and long-term forecasts for appropriate planting and decisions on irrigation X X
Improve scientific understanding of surface water – groundwater connectivity and hydrological modelling X X
Encourage precise fertiliser, herbicide and pesticide application to reduce pollution of rivers and streams X X X X X
IrrigationMeasure soil moisture in real-time for efficient water application X X X X
Pressurise irrigation systems to deliver water where it is needed X X X X
Target the application of water where it is required (eg through drip irrigation) X X X
Control water conveyance systems in real time X X X
Develop cheaper, more accurate irrigation water measurement X X X
Move to cost-reflective water pricing X X X
SUSTAINABLE WATER MANAGEMENT
8
ww
w.a
tse.
org.
au
The Australian Academy of Technological Sciences and Engineering (ATSE)
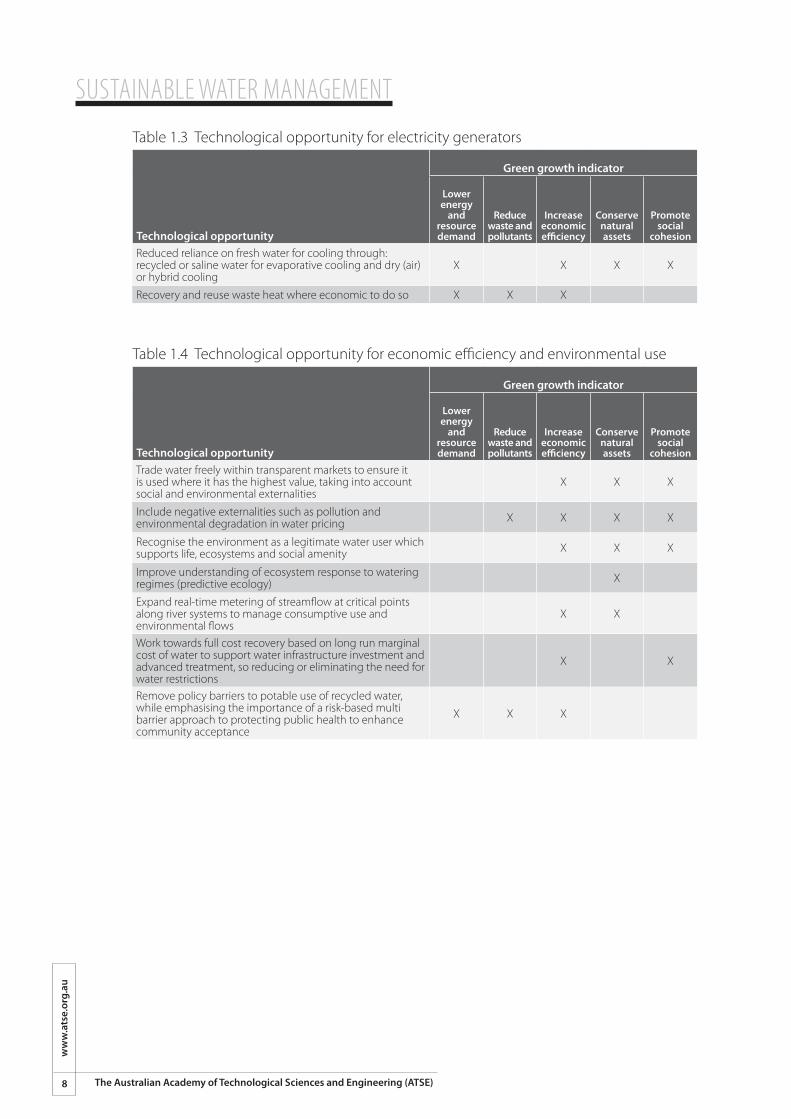
Table 1.3 Technological opportunity for electricity generators
Technological opportunity
Green growth indicator
Lower energy
and resource demand
Reduce waste and pollutants
Increase economic efficiency
Conserve natural assets
Promote social
cohesion
Reduced reliance on fresh water for cooling through: recycled or saline water for evaporative cooling and dry (air) or hybrid cooling
X X X X
Recovery and reuse waste heat where economic to do so X X X
Table 1.4 Technological opportunity for economic efficiency and environmental use
Technological opportunity
Green growth indicator
Lower energy
and resource demand
Reduce waste and pollutants
Increase economic efficiency
Conserve natural assets
Promote social
cohesion
Trade water freely within transparent markets to ensure it is used where it has the highest value, taking into account social and environmental externalities
X X X
Include negative externalities such as pollution and environmental degradation in water pricing X X X X
Recognise the environment as a legitimate water user which supports life, ecosystems and social amenity X X X
Improve understanding of ecosystem response to watering regimes (predictive ecology) X
Expand real-time metering of streamflow at critical points along river systems to manage consumptive use and environmental flows
X X
Work towards full cost recovery based on long run marginal cost of water to support water infrastructure investment and advanced treatment, so reducing or eliminating the need for water restrictions
X X
Remove policy barriers to potable use of recycled water, while emphasising the importance of a risk-based multi barrier approach to protecting public health to enhance community acceptance
X X X
SUSTAINABLE WATER MANAGEMENTw
ww
.atse.org.au
9The Australian Academy of Technological Sciences and Engineering (ATSE)
2. The Role of Water in the Australian Economy
Water underpins all aspects of the Australian society and its economy. Water is a basic necessity for life and human wellbeing – it is used to grow and cook food, maintain public health, transport wastes, support industries (including electricity generation), operate mines and other industries and nourish the natural environment.
Historically, large quantities of water could be freely sourced by a small population from rainfall, streams and groundwater as long as supplies lasted. Although fresh water is a renewable resource, it is constrained by rainfall and runoff for surface supplies, and by infiltration and recharge for groundwater. Over time, when demand for water of sufficient quantity and quality has exceeded available supply, a broad economic framework has developed in both rural and urban Australia that has restricted water allocations and placed a price on water which, in turn, has driven the development of alternative water sources and transport of water over large distances to augment rain-fed supply. This journey has not been smooth, with calls for social equity, priority access, attempts to balance demands for water for agriculture against the needs of the environment and urban growth in cities, and conflict between environmentalists and business interests.
This situation of course is not unique; similar issues face all countries (World Water Assessment Programme, 2009). The world’s water resources are under stress from rising demand due to population growth, climate change, urbanisation and industrialisation (Gleick and Palaniappan, 2010). Increasingly, groundwater resources that may have taken tens of thousands of years to accumulate are being rapidly
Chapter SummaryThis chapter describes the importance of water in maintaining the social, environmental and economic fabric of the country, and how these aspects can be integrated into a uniform accounting framework to support green growth for long-term sustainability.¢ �Water underpins every aspect of Australian society and its economy. ¢ �Water policy is governed by a mix of State and Commonwealth legislation. National water
reform has delivered major benefits but further reform and alignment of policies is needed.¢ �Integration of national water, economic and environmental accounts will provide the metrics
needed for measuring green growth outcomes.¢ �There is a wide variation in the value added by water to industry and GDP. Water used in mining
and manufacturing provides substantially higher value per volume consumed than irrigated agriculture.
¢ �Environmental goods and services provide much value to the economy, through processes such as purification and replenishment of natural resources, reducing erosion and pollution, maintaining ecosystems and supporting tourism. Environmental values also contribute to natural and social amenity.
¢ �Major water utilities are adopting sustainability strategies that drive environmental outcomes as part of business performance. These sustainability strategies, which can be regarded as part of a social ‘licence to operate’, lower greenhouse-gas emissions and reduce waste streams through recycling and improved treatment processes.
SUSTAINABLE WATER MANAGEMENT
10
ww
w.a
tse.
org.
au
The Australian Academy of Technological Sciences and Engineering (ATSE)
depleted. According to the International Water Management Institute, global forces are placing existing water, land, and agricultural resources under significant pressure and 20th-century water management paradigms are no longer appropriate.
Key challenges for the planet are:a) the world’s population is expected to increase by two billion to nine billion by 2030;b) climate change, particularly in the tropics/subtropics where most of the poor live is likely to impact
both total rainfall and its seasonal distribution. Rainfall is generally expected to decrease on average but become more variable in in mid latitudes;
c) burgeoning urbanisation and concomitant demand for water means productive land will be lost to degradation and non-agricultural uses;
d) increasing land areas may be devoted to plants grown for food and biofuel production; ande) there will be increasing demands for environmental water for wetlands and environmental flows that
support valuable ecosystem services (IWMI, 2007).
Australia’s climate variability, including its devastating droughts and floods, combined with an increasing understanding that there are limits to unrestrained growth, provide a strong incentive for governments and communities to develop sound, robust and science-based policies to underpin water management. In 1999, ATSE and the Institution of Engineers conducted a study on future demands on Australia’s water resources (to 2020), highlighting the economic, technological, institutional and policy issues that would face water management and allocation. The 1999 report did not foresee the substantial drought-induced take-up of water recycling or seawater desalination but did advocate the need for progressive changes in water pricing including the removal of subsidies, improved water-use efficiency, the advantages of transferring water to its most profitable uses through water trading, and the need to protect groundwater from over-extraction. The 1999 study determined that water quantity would not be a constraint on economic growth in the medium term because of anticipated efficiency gains and reallocation. The report also considered the environmental constraints to economic growth, reflecting ATSE’s strategic focus on sustainable development, and recommended increased attention to environmental flows and the need for industry to bear the cost externalities such as pollution. A number of similar recommendations are contained within the National Water Initiative. The following section explores these recommendations.
2.1 Regulation and legislationThe right to water is embodied in Section 100 of the Australian Constitution, “The Commonwealth shall not, by any law or regulation of trade or commerce, abridge the right of a State or of the residents therein to the reasonable use of the waters of rivers for conservation or irrigation” (Commonwealth of Australia, 1900). Over time, water has been successively allocated to users through a series of legal entitlements by various governments in response to regional and local development, with little scientific understanding of the vagaries of Australia’s climate, the interconnection of surface water and groundwater and the water needs of the environment and ecosystems. In regional areas, in particular, issues such as over-allocation, complex governance and shared governance structures have hampered the development of effective and comprehensive water management and accelerated ecological decline (Pittock and Connell 2010). By international standards, however, Australia has performed well with many aspects of water policy. Water rights have always been a process of public policy development, as opposed to an evolution of common law practice as has occurred in the US, and there has been a general willingness, to ‘share the burden’ between various sectors of the irrigation industry in times of water scarcity (Connell, 2007).
In 1994 COAG agreed to commit to increasing the efficiency of Australia's water use to provide a greater certainty for investment and productivity for rural and urban communities and for the environment. This was a major advance. Reform was further encouraged through the Intergovernmental Agreement on a National Water Initiative (NWI) in 2004, with COAG’s agreement to work towards a nationally
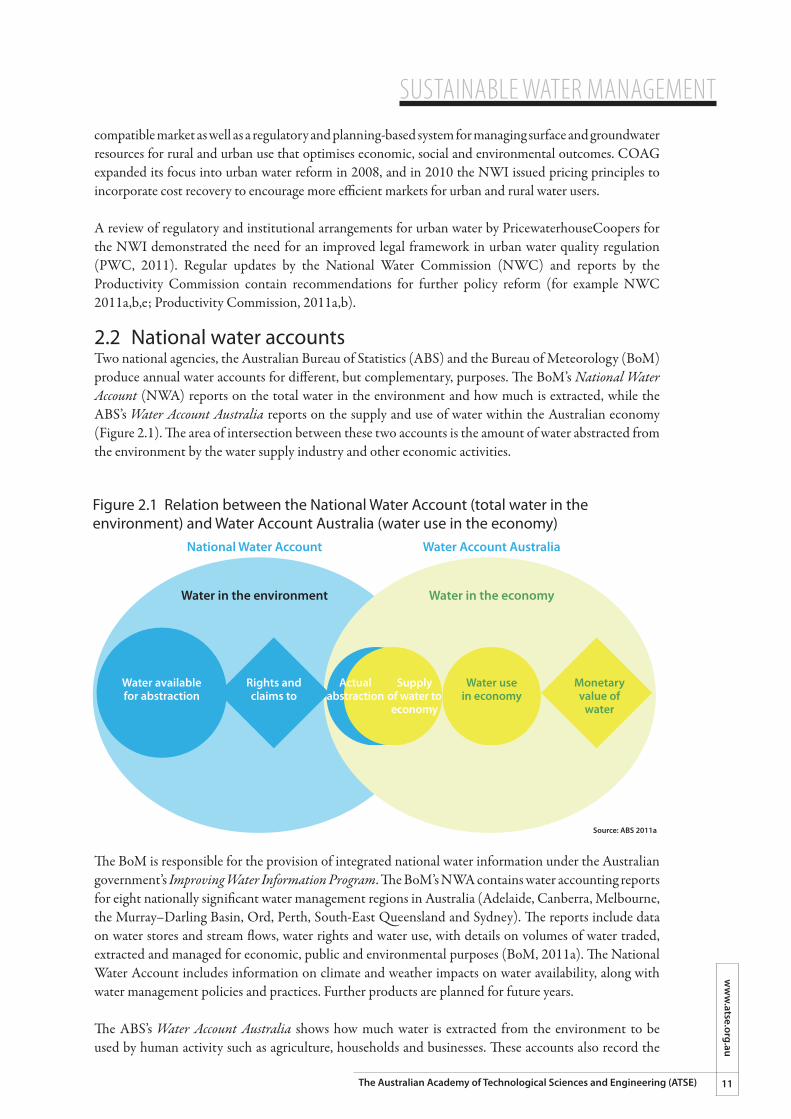
SUSTAINABLE WATER MANAGEMENTw
ww
.atse.org.au
11The Australian Academy of Technological Sciences and Engineering (ATSE)
compatible market as well as a regulatory and planning-based system for managing surface and groundwater resources for rural and urban use that optimises economic, social and environmental outcomes. COAG expanded its focus into urban water reform in 2008, and in 2010 the NWI issued pricing principles to incorporate cost recovery to encourage more efficient markets for urban and rural water users.
A review of regulatory and institutional arrangements for urban water by PricewaterhouseCoopers for the NWI demonstrated the need for an improved legal framework in urban water quality regulation (PWC, 2011). Regular updates by the National Water Commission (NWC) and reports by the Productivity Commission contain recommendations for further policy reform (for example NWC 2011a,b,e; Productivity Commission, 2011a,b).
2.2 National water accountsTwo national agencies, the Australian Bureau of Statistics (ABS) and the Bureau of Meteorology (BoM) produce annual water accounts for different, but complementary, purposes. The BoM’s National Water Account (NWA) reports on the total water in the environment and how much is extracted, while the ABS’s Water Account Australia reports on the supply and use of water within the Australian economy (Figure 2.1). The area of intersection between these two accounts is the amount of water abstracted from the environment by the water supply industry and other economic activities.
The BoM is responsible for the provision of integrated national water information under the Australian government’s Improving Water Information Program. The BoM’s NWA contains water accounting reports for eight nationally significant water management regions in Australia (Adelaide, Canberra, Melbourne, the Murray–Darling Basin, Ord, Perth, South-East Queensland and Sydney). The reports include data on water stores and stream flows, water rights and water use, with details on volumes of water traded, extracted and managed for economic, public and environmental purposes (BoM, 2011a). The National Water Account includes information on climate and weather impacts on water availability, along with water management policies and practices. Further products are planned for future years.
The ABS’s Water Account Australia shows how much water is extracted from the environment to be used by human activity such as agriculture, households and businesses. These accounts also record the
National Water Account
Water in the environment Water in the economy
Water usein economy
Monetaryvalue of
water
Supplyof water toeconomy
Actualabstraction
Rights andclaims to
Water availablefor abstraction
Water Account Australia
Figure 2.1 Relation between the National Water Account (total water in the environment) and Water Account Australia (water use in the economy)
Source: ABS 2011a
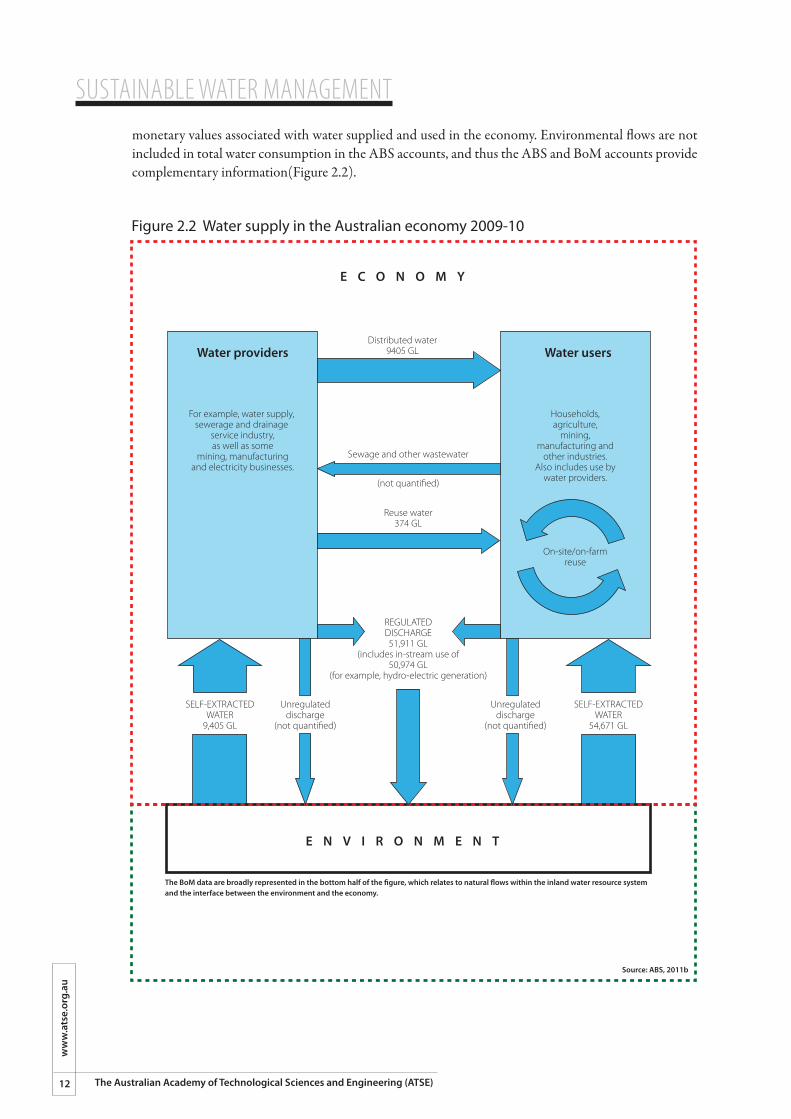
SUSTAINABLE WATER MANAGEMENT
12
ww
w.a
tse.
org.
au
The Australian Academy of Technological Sciences and Engineering (ATSE)
monetary values associated with water supplied and used in the economy. Environmental flows are not included in total water consumption in the ABS accounts, and thus the ABS and BoM accounts provide complementary information(Figure 2.2).
Figure 2.2 Water supply in the Australian economy 2009-10
E C O N O M Y
E N V I R O N M E N T
Distributed water9405 GL
Sewage and other wastewater
(not quanti�ed)
Reuse water374 GL
SELF-EXTRACTEDWATER
9,405 GL
Unregulateddischarge
(not quanti�ed)
Unregulateddischarge
(not quanti�ed)
REGULATEDDISCHARGE51,911 GL
(includes in-stream use of50,974 GL
(for example, hydro-electric generation)
Water usersWater providers
For example, water supply, sewerage and drainage
service industry,as well as some
mining, manufacturingand electricity businesses.
Households,agriculture,
mining,manufacturing and
other industries.Also includes use by
water providers.
On-site/on-farmreuse
SELF-EXTRACTEDWATER
54,671 GL
The BoM data are broadly represented in the bottom half of the �gure, which relates to natural �ows within the inland water resource system and the interface between the environment and the economy.
Source: ABS, 2011b
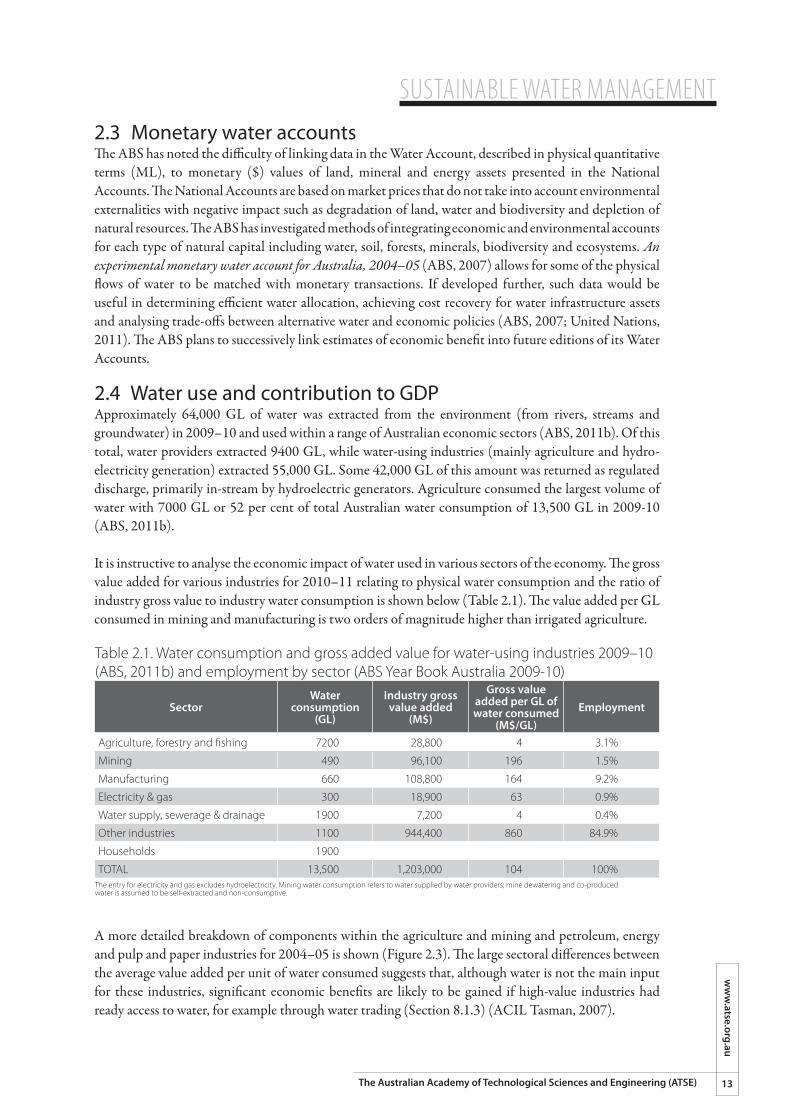
SUSTAINABLE WATER MANAGEMENTw
ww
.atse.org.au
13The Australian Academy of Technological Sciences and Engineering (ATSE)
2.3 Monetary water accountsThe ABS has noted the difficulty of linking data in the Water Account, described in physical quantitative terms (ML), to monetary ($) values of land, mineral and energy assets presented in the National Accounts. The National Accounts are based on market prices that do not take into account environmental externalities with negative impact such as degradation of land, water and biodiversity and depletion of natural resources. The ABS has investigated methods of integrating economic and environmental accounts for each type of natural capital including water, soil, forests, minerals, biodiversity and ecosystems. An experimental monetary water account for Australia, 2004–05 (ABS, 2007) allows for some of the physical flows of water to be matched with monetary transactions. If developed further, such data would be useful in determining efficient water allocation, achieving cost recovery for water infrastructure assets and analysing trade-offs between alternative water and economic policies (ABS, 2007; United Nations, 2011). The ABS plans to successively link estimates of economic benefit into future editions of its Water Accounts.
2.4 Water use and contribution to GDPApproximately 64,000 GL of water was extracted from the environment (from rivers, streams and groundwater) in 2009–10 and used within a range of Australian economic sectors (ABS, 2011b). Of this total, water providers extracted 9400 GL, while water-using industries (mainly agriculture and hydro-electricity generation) extracted 55,000 GL. Some 42,000 GL of this amount was returned as regulated discharge, primarily in-stream by hydroelectric generators. Agriculture consumed the largest volume of water with 7000 GL or 52 per cent of total Australian water consumption of 13,500 GL in 2009-10 (ABS, 2011b).
It is instructive to analyse the economic impact of water used in various sectors of the economy. The gross value added for various industries for 2010–11 relating to physical water consumption and the ratio of industry gross value to industry water consumption is shown below (Table 2.1). The value added per GL consumed in mining and manufacturing is two orders of magnitude higher than irrigated agriculture.
Table 2.1. Water consumption and gross added value for water-using industries 2009–10 (ABS, 2011b) and employment by sector (ABS Year Book Australia 2009-10)
SectorWater
consumption (GL)
Industry gross value added
(M$)
Gross value added per GL of water consumed
(M$/GL)Employment
Agriculture, forestry and fishing 7200 28,800 4 3.1%
Mining 490 96,100 196 1.5%
Manufacturing 660 108,800 164 9.2%
Electricity & gas 300 18,900 63 0.9%
Water supply, sewerage & drainage 1900 7,200 4 0.4%
Other industries 1100 944,400 860 84.9%
Households 1900
TOTAL 13,500 1,203,000 104 100%The entry for electricity and gas excludes hydroelectricity. Mining water consumption refers to water supplied by water providers; mine dewatering and co-produced water is assumed to be self-extracted and non-consumptive.
A more detailed breakdown of components within the agriculture and mining and petroleum, energy and pulp and paper industries for 2004–05 is shown (Figure 2.3). The large sectoral differences between the average value added per unit of water consumed suggests that, although water is not the main input for these industries, significant economic benefits are likely to be gained if high-value industries had ready access to water, for example through water trading (Section 8.1.3) (ACIL Tasman, 2007).
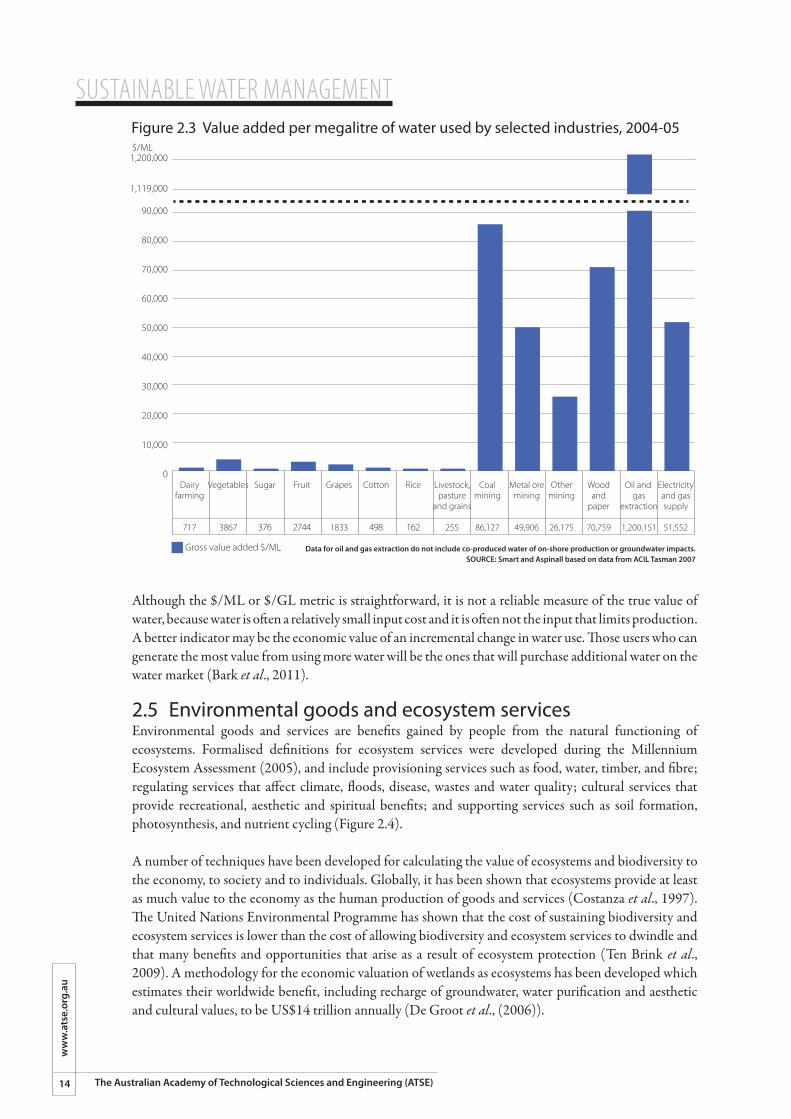
SUSTAINABLE WATER MANAGEMENT
14
ww
w.a
tse.
org.
au
The Australian Academy of Technological Sciences and Engineering (ATSE)
Although the $/ML or $/GL metric is straightforward, it is not a reliable measure of the true value of water, because water is often a relatively small input cost and it is often not the input that limits production. A better indicator may be the economic value of an incremental change in water use. Those users who can generate the most value from using more water will be the ones that will purchase additional water on the water market (Bark et al., 2011).
2.5 Environmental goods and ecosystem servicesEnvironmental goods and services are benefits gained by people from the natural functioning of ecosystems. Formalised definitions for ecosystem services were developed during the Millennium Ecosystem Assessment (2005), and include provisioning services such as food, water, timber, and fibre; regulating services that affect climate, floods, disease, wastes and water quality; cultural services that provide recreational, aesthetic and spiritual benefits; and supporting services such as soil formation, photosynthesis, and nutrient cycling (Figure 2.4).
A number of techniques have been developed for calculating the value of ecosystems and biodiversity to the economy, to society and to individuals. Globally, it has been shown that ecosystems provide at least as much value to the economy as the human production of goods and services (Costanza et al., 1997). The United Nations Environmental Programme has shown that the cost of sustaining biodiversity and ecosystem services is lower than the cost of allowing biodiversity and ecosystem services to dwindle and that many benefits and opportunities that arise as a result of ecosystem protection (Ten Brink et al., 2009). A methodology for the economic valuation of wetlands as ecosystems has been developed which estimates their worldwide benefit, including recharge of groundwater, water purification and aesthetic and cultural values, to be US$14 trillion annually (De Groot et al., (2006)).
Figure 2.3 Value added per megalitre of water used by selected industries, 2004-05
1,200,000
1,119,000
$/ML
Gross value added $/ML
90,000
80,000
70,000
60,000
50,000
40,000
30,000
20,000
10,000
0Dairy
farming
717
Vegetables
3867
Sugar
376
Fruit
2744
Grapes
1833
Cotton
498
Rice
162
Livestock,pasture
and grains
255
Coalmining
86,127
Metal oremining
49,906
Othermining
26,175
Woodand
paper
70,759
Oil and gas
extraction
1,200,151
Electricityand gassupply
51,552
Data for oil and gas extraction do not include co-produced water of on-shore production or groundwater impacts.SOURCE: Smart and Aspinall based on data from ACIL Tasman 2007
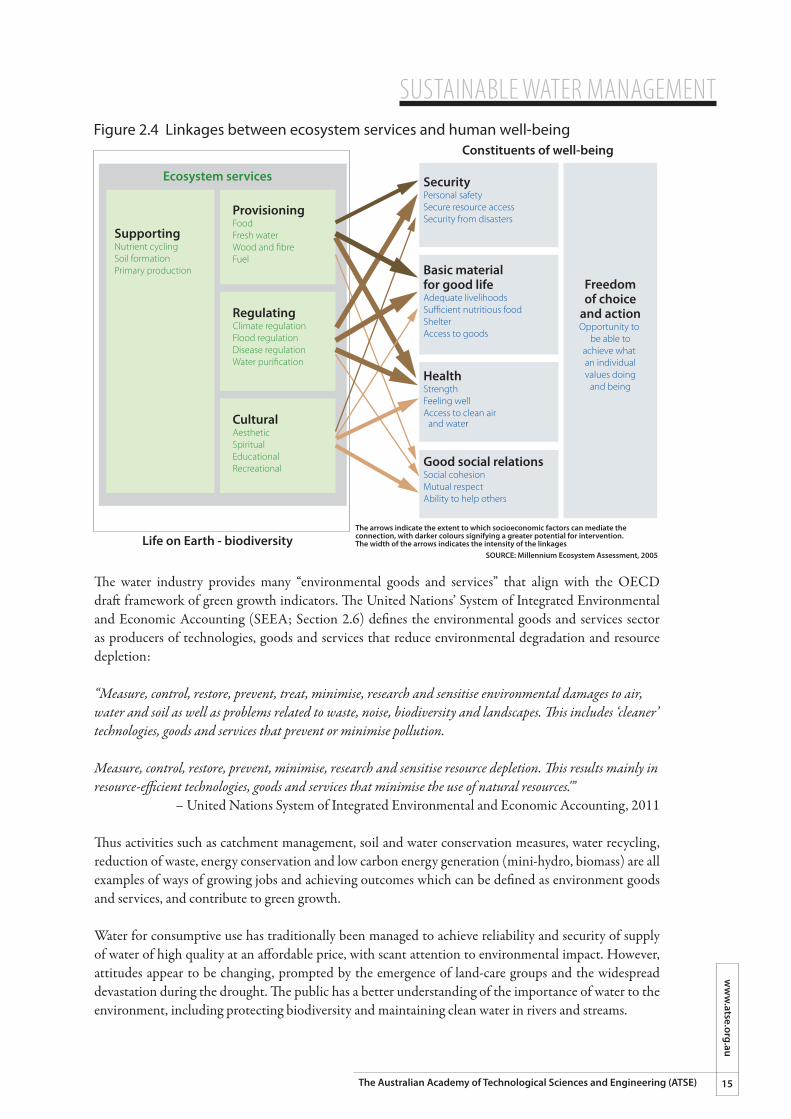
SUSTAINABLE WATER MANAGEMENTw
ww
.atse.org.au
15The Australian Academy of Technological Sciences and Engineering (ATSE)
The water industry provides many “environmental goods and services” that align with the OECD draft framework of green growth indicators. The United Nations’ System of Integrated Environmental and Economic Accounting (SEEA; Section 2.6) defines the environmental goods and services sector as producers of technologies, goods and services that reduce environmental degradation and resource depletion:
“Measure, control, restore, prevent, treat, minimise, research and sensitise environmental damages to air, water and soil as well as problems related to waste, noise, biodiversity and landscapes. This includes ‘cleaner’ technologies, goods and services that prevent or minimise pollution.
Measure, control, restore, prevent, minimise, research and sensitise resource depletion. This results mainly in resource-efficient technologies, goods and services that minimise the use of natural resources.'”
– United Nations System of Integrated Environmental and Economic Accounting, 2011
Thus activities such as catchment management, soil and water conservation measures, water recycling, reduction of waste, energy conservation and low carbon energy generation (mini-hydro, biomass) are all examples of ways of growing jobs and achieving outcomes which can be defined as environment goods and services, and contribute to green growth.
Water for consumptive use has traditionally been managed to achieve reliability and security of supply of water of high quality at an affordable price, with scant attention to environmental impact. However, attitudes appear to be changing, prompted by the emergence of land-care groups and the widespread devastation during the drought. The public has a better understanding of the importance of water to the environment, including protecting biodiversity and maintaining clean water in rivers and streams.
SOURCE: Millennium Ecosystem Assessment, 2005
Ecosystem services
Life on Earth - biodiversity
SupportingNutrient cyclingSoil formationPrimary production
ProvisioningFoodFresh waterWood and �breFuel
Freedomof choice
and actionOpportunity to
be able toachieve what an individualvalues doing
and being
SecurityPersonal safetySecure resource accessSecurity from disasters
Basic materialfor good lifeAdequate livelihoodsSu�cient nutritious foodShelterAccess to goods
HealthStrengthFeeling wellAccess to clean air and water
Good social relationsSocial cohesionMutual respectAbility to help others
RegulatingClimate regulationFlood regulationDisease regulationWater puri�cation
CulturalAestheticSpiritualEducationalRecreational
Constituents of well-beingFigure 2.4 Linkages between ecosystem services and human well-being
The arrows indicate the extent to which socioeconomic factors can mediate the connection, with darker colours signifying a greater potential for intervention. The width of the arrows indicates the intensity of the linkages
SUSTAINABLE WATER MANAGEMENT
16
ww
w.a
tse.
org.
au
The Australian Academy of Technological Sciences and Engineering (ATSE)
Monetising environmental benefits One method of calculating the environmental value of water attempts to express the environmental values in monetary terms so that their value can be compared directly with economic uses of water (Bark et al., 2011). This can be done through conventional markets, such as the value the water would have if put to economic use; cost-benefit analysis, implicit markets such as the value of an estuary based on the increase in nearby residential housing prices; and constructed markets, by eliciting the willingness to pay for improvements to an ecosystem (stakeholder preferences); or through pricing decisions or litigation. For example, the willingness to pay to restore the Coorong and Lower Lakes of the Murray River was estimated to be $5.8 billion (Hatton MacDonald et al., 2011).
Others argue that attempts to monetise environmental goods and services are fraught with danger, since economic, social and environmental values are all equally important and should be given equal weight. The Accounting for Nature model, for building a system of National Environmental Accounts, creates a common unit of account for all environmental assets and indicators of ecosystem health, irrespective of the unit of measurement, by using reference condition benchmarks (The Wentworth Group (2008)). The common currency for environmental accounts does not imply a monetary value. It is simply a scientific method for standardising the measurement of environmental assets so that the relative state of various environmental assets can be compared with one another and information at different scales and different assets can be aggregated and compared (Cosier and McDonald, 2010; Cosier, 2011).
2.6 Integrated environmental-economic accountsAustralia’s measures of gross domestic product (GDP) reported by the ABS form part of the System of National Accounts (SNA) developed by the United Nations as a means to measure economic activity. GDP measures the total production (output of goods and services) occurring within a country. However GDP does not capture vital aspects of national wealth and wellbeing such as human health, educational achievement, social connection, political engagement, volunteer work and changes in quality and quantity of natural resources.
Much of what maintains and enhances wellbeing occurs outside the market. For example within the SNA, environmental goods and services are considered to be non-market, implicitly superabundant, free inputs to production. As a result, they are used as inputs to production, but not charged as costs of production (ABS, 2010a). No deduction is made from income for the depletion or degradation of the natural environment. Thus, “... a country could exhaust its mineral resources, cut down its forests, erode its soil, pollute its aquifers, and hunt its wildlife to extinction, but measured income would not be affected as these assets disappeared” (Repetto et al., 1989).
The concept of sustainable development, involving the integration of environmental thinking into all aspects of social, political, and economic activity, is not new. It received international attention with the 1987 release of Our Common Future by the World Commission on Environment and Development, and further in 1992 by the UN Conference on Environment and Development held in Rio de Janeiro. The UN developed methodologies to link environmental accounts into the SNA and published the Handbook of Integrated Environment and Economic Accounting in 1993, with successive updates. The UN further developed the System of Integrated Environmental and Economic Accounting (SEEA) to provide a uniform framework to facilitate the integration of environmental and economic statistics, using a consistent approach to the SNA. Subsystems of the SEEA framework elaborate on specific sectors including energy and water (United Nations, 2011).
The ABS has been investigating environmental accounting for more than a decade (for example the 2003 Year Book Australia has a chapter on ‘Accounting for the environment in the national accounts’). Towards an integrated environmental-economic account for Australia (ABS, 2010b) uses the same
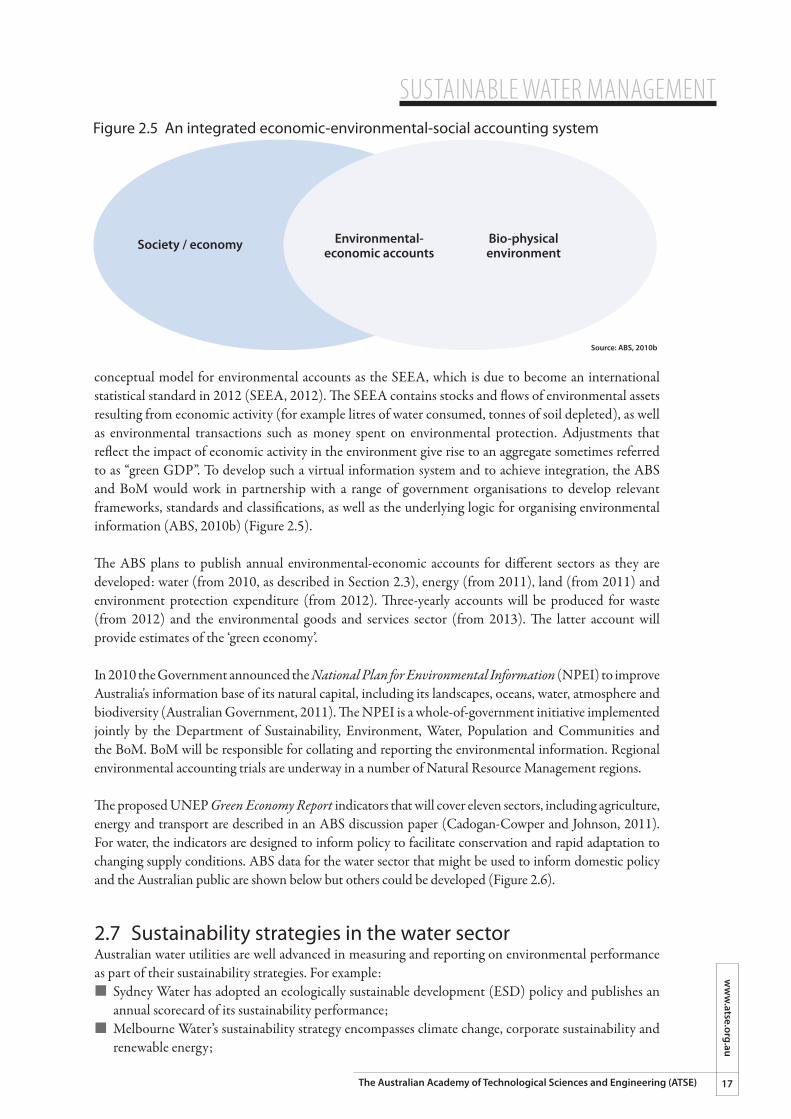
SUSTAINABLE WATER MANAGEMENTw
ww
.atse.org.au
17The Australian Academy of Technological Sciences and Engineering (ATSE)
conceptual model for environmental accounts as the SEEA, which is due to become an international statistical standard in 2012 (SEEA, 2012). The SEEA contains stocks and flows of environmental assets resulting from economic activity (for example litres of water consumed, tonnes of soil depleted), as well as environmental transactions such as money spent on environmental protection. Adjustments that reflect the impact of economic activity in the environment give rise to an aggregate sometimes referred to as “green GDP”. To develop such a virtual information system and to achieve integration, the ABS and BoM would work in partnership with a range of government organisations to develop relevant frameworks, standards and classifications, as well as the underlying logic for organising environmental information (ABS, 2010b) (Figure 2.5).
The ABS plans to publish annual environmental-economic accounts for different sectors as they are developed: water (from 2010, as described in Section 2.3), energy (from 2011), land (from 2011) and environment protection expenditure (from 2012). Three-yearly accounts will be produced for waste (from 2012) and the environmental goods and services sector (from 2013). The latter account will provide estimates of the ‘green economy’.
In 2010 the Government announced the National Plan for Environmental Information (NPEI) to improve Australia's information base of its natural capital, including its landscapes, oceans, water, atmosphere and biodiversity (Australian Government, 2011). The NPEI is a whole-of-government initiative implemented jointly by the Department of Sustainability, Environment, Water, Population and Communities and the BoM. BoM will be responsible for collating and reporting the environmental information. Regional environmental accounting trials are underway in a number of Natural Resource Management regions.
The proposed UNEP Green Economy Report indicators that will cover eleven sectors, including agriculture, energy and transport are described in an ABS discussion paper (Cadogan-Cowper and Johnson, 2011). For water, the indicators are designed to inform policy to facilitate conservation and rapid adaptation to changing supply conditions. ABS data for the water sector that might be used to inform domestic policy and the Australian public are shown below but others could be developed (Figure 2.6).
2.7 Sustainability strategies in the water sectorAustralian water utilities are well advanced in measuring and reporting on environmental performance as part of their sustainability strategies. For example:¢ �Sydney Water has adopted an ecologically sustainable development (ESD) policy and publishes an
annual scorecard of its sustainability performance;¢ �Melbourne Water’s sustainability strategy encompasses climate change, corporate sustainability and
renewable energy;
Source: ABS, 2010b
Figure 2.5 An integrated economic-environmental-social accounting system
Society / economy Environmental-economic accounts
Bio-physicalenvironment
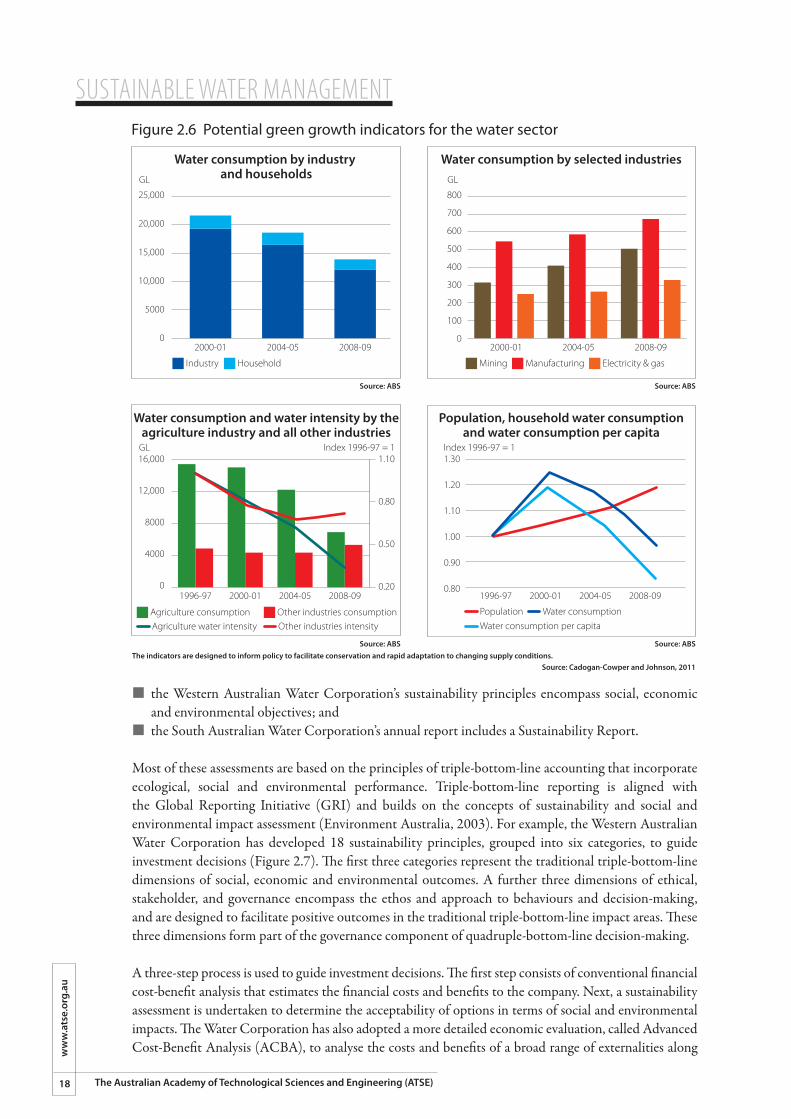
SUSTAINABLE WATER MANAGEMENT
18
ww
w.a
tse.
org.
au
The Australian Academy of Technological Sciences and Engineering (ATSE)
¢ �the Western Australian Water Corporation’s sustainability principles encompass social, economic and environmental objectives; and
¢ �the South Australian Water Corporation’s annual report includes a Sustainability Report.
Most of these assessments are based on the principles of triple-bottom-line accounting that incorporate ecological, social and environmental performance. Triple-bottom-line reporting is aligned with the Global Reporting Initiative (GRI) and builds on the concepts of sustainability and social and environmental impact assessment (Environment Australia, 2003). For example, the Western Australian Water Corporation has developed 18 sustainability principles, grouped into six categories, to guide investment decisions (Figure 2.7). The first three categories represent the traditional triple-bottom-line dimensions of social, economic and environmental outcomes. A further three dimensions of ethical, stakeholder, and governance encompass the ethos and approach to behaviours and decision-making, and are designed to facilitate positive outcomes in the traditional triple-bottom-line impact areas. These three dimensions form part of the governance component of quadruple-bottom-line decision-making.
A three-step process is used to guide investment decisions. The first step consists of conventional financial cost-benefit analysis that estimates the financial costs and benefits to the company. Next, a sustainability assessment is undertaken to determine the acceptability of options in terms of social and environmental impacts. The Water Corporation has also adopted a more detailed economic evaluation, called Advanced Cost-Benefit Analysis (ACBA), to analyse the costs and benefits of a broad range of externalities along
Figure 2.6 Potential green growth indicators for the water sector
Source: Cadogan-Cowper and Johnson, 2011
Source: ABS
Source: ABS
Source: ABS
Source: ABS
The indicators are designed to inform policy to facilitate conservation and rapid adaptation to changing supply conditions.
Water consumption by industry and households
Water consumption by selected industries
Water consumption and water intensity by theagriculture industry and all other industries
Population, household water consumptionand water consumption per capita
Industry
Agriculture consumptionAgriculture water intensity
Other industries consumption
Household Mining Manufacturing Electricity & gas
25,000
20,000
15,000
10,000
5000
0
GL
16,000
12,000
8000
4000
0
GL1.10
0.80
0.50
0.20
Index 1996-97 = 11.30
1.20
1.10
1.00
0.90
0.80
Index 1996-97 = 1
800
700
600
500
400
300
200
100
0
GL
2000-01
1996-97 2000-01 2004-05 2008-09 1996-97 2000-01 2004-05 2008-09
2004-05 2008-09 2000-01 2004-05 2008-09
Population Water consumptionWater consumption per capitaOther industries intensity
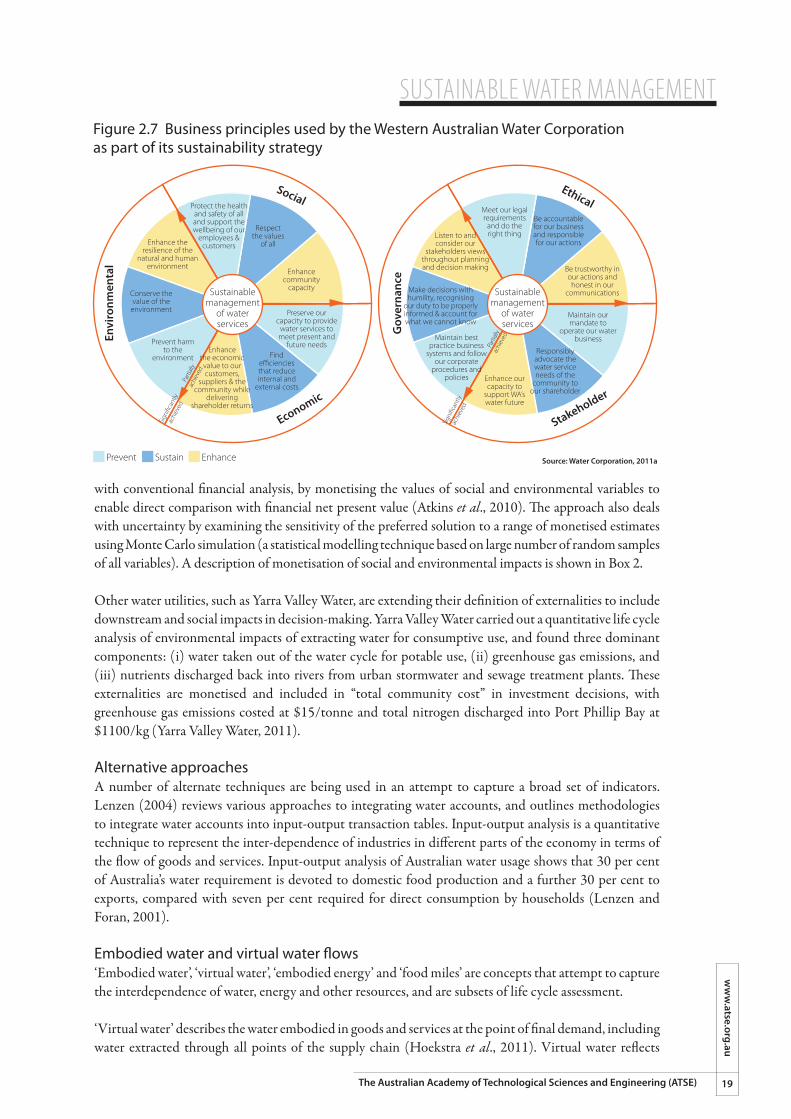
SUSTAINABLE WATER MANAGEMENTw
ww
.atse.org.au
19The Australian Academy of Technological Sciences and Engineering (ATSE)
with conventional financial analysis, by monetising the values of social and environmental variables to enable direct comparison with financial net present value (Atkins et al., 2010). The approach also deals with uncertainty by examining the sensitivity of the preferred solution to a range of monetised estimates using Monte Carlo simulation (a statistical modelling technique based on large number of random samples of all variables). A description of monetisation of social and environmental impacts is shown in Box 2.
Other water utilities, such as Yarra Valley Water, are extending their definition of externalities to include downstream and social impacts in decision-making. Yarra Valley Water carried out a quantitative life cycle analysis of environmental impacts of extracting water for consumptive use, and found three dominant components: (i) water taken out of the water cycle for potable use, (ii) greenhouse gas emissions, and (iii) nutrients discharged back into rivers from urban stormwater and sewage treatment plants. These externalities are monetised and included in “total community cost” in investment decisions, with greenhouse gas emissions costed at $15/tonne and total nitrogen discharged into Port Phillip Bay at $1100/kg (Yarra Valley Water, 2011).
Alternative approaches A number of alternate techniques are being used in an attempt to capture a broad set of indicators. Lenzen (2004) reviews various approaches to integrating water accounts, and outlines methodologies to integrate water accounts into input-output transaction tables. Input-output analysis is a quantitative technique to represent the inter-dependence of industries in different parts of the economy in terms of the flow of goods and services. Input-output analysis of Australian water usage shows that 30 per cent of Australia’s water requirement is devoted to domestic food production and a further 30 per cent to exports, compared with seven per cent required for direct consumption by households (Lenzen and Foran, 2001).
Embodied water and virtual water flows‘Embodied water’, ‘virtual water’, ‘embodied energy’ and ‘food miles’ are concepts that attempt to capture the interdependence of water, energy and other resources, and are subsets of life cycle assessment.
‘Virtual water’ describes the water embodied in goods and services at the point of final demand, including water extracted through all points of the supply chain (Hoekstra et al., 2011). Virtual water reflects
Figure 2.7 Business principles used by the Western Australian Water Corporation as part of its sustainability strategy
Source: Water Corporation, 2011aPrevent
Envi
ronm
enta
l
Gov
erna
nce
Stakeholder
Economic
SocialEthicalProtect the health
and safety of alland support thewellbeing of our
employees &customers
Respectthe values
of all
Enhancecommunity
capacity
Listen to andconsider our
stakeholders viewsthroughout planningand decision making
Make decisions withhumility, recognising
our duty to be properlyinformed & account forwhat we cannot know
Preserve ourcapacity to provide
water services tomeet present and
future needsFind
e�cienciesthat reduceinternal and
external costs
Enhancethe economicvalue to ourcustomers,
suppliers & thecommunity while
deliveringshareholder returns
Prevent harmto the
environment
Maintain bestpractice business
systems and followour corporate
procedures andpolicies Enhance our
capacity tosupport WA’swater future
Responsiblyadvocate thewater serviceneeds of the
community toour shareholder
Conserve thevalue of the
environment
Enhance theresilience of the
natural and humanenvironment
Meet our legalrequirements
and do theright thing
Be accountablefor our businessand responsiblefor our actions
Be trustworthy inour actions and
honest in ourcommunications
Maintain ourmandate to
operate our waterbusiness
Sustain Enhance
Sustainablemanagement
of waterservices
Sustainablemanagement
of waterservices
Parti
ally
achi
eved
Signi
�can
tlyac
hiev
ed
Parti
ally
achi
eved
Signi
�can
tlyac
hiev
ed
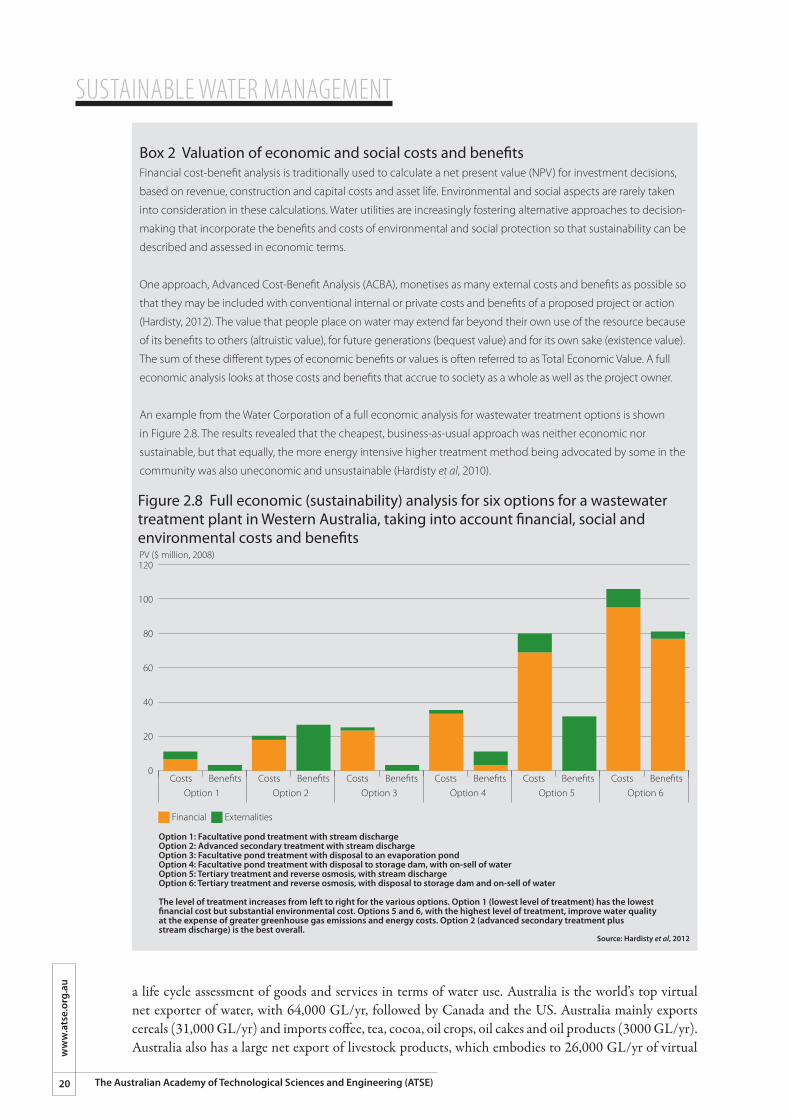
SUSTAINABLE WATER MANAGEMENT
20
ww
w.a
tse.
org.
au
The Australian Academy of Technological Sciences and Engineering (ATSE)
a life cycle assessment of goods and services in terms of water use. Australia is the world’s top virtual net exporter of water, with 64,000 GL/yr, followed by Canada and the US. Australia mainly exports cereals (31,000 GL/yr) and imports coffee, tea, cocoa, oil crops, oil cakes and oil products (3000 GL/yr). Australia also has a large net export of livestock products, which embodies to 26,000 GL/yr of virtual
Box 2 Valuation of economic and social costs and benefits Financial cost-benefit analysis is traditionally used to calculate a net present value (NPV) for investment decisions,
based on revenue, construction and capital costs and asset life. Environmental and social aspects are rarely taken
into consideration in these calculations. Water utilities are increasingly fostering alternative approaches to decision-
making that incorporate the benefits and costs of environmental and social protection so that sustainability can be
described and assessed in economic terms.
One approach, Advanced Cost-Benefit Analysis (ACBA), monetises as many external costs and benefits as possible so
that they may be included with conventional internal or private costs and benefits of a proposed project or action
(Hardisty, 2012). The value that people place on water may extend far beyond their own use of the resource because
of its benefits to others (altruistic value), for future generations (bequest value) and for its own sake (existence value).
The sum of these different types of economic benefits or values is often referred to as Total Economic Value. A full
economic analysis looks at those costs and benefits that accrue to society as a whole as well as the project owner.
An example from the Water Corporation of a full economic analysis for wastewater treatment options is shown
in Figure 2.8. The results revealed that the cheapest, business-as-usual approach was neither economic nor
sustainable, but that equally, the more energy intensive higher treatment method being advocated by some in the
community was also uneconomic and unsustainable (Hardisty et al, 2010).
Figure 2.8 Full economic (sustainability) analysis for six options for a wastewater treatment plant in Western Australia, taking into account �nancial, social and environmental costs and bene�ts
120
100
80
60
40
20
0
PV ($ million, 2008)
Financial
Costs Bene�ts Costs Bene�ts Costs Bene�ts Costs Bene�ts Costs Bene�ts Costs Bene�ts
Externalities
Option 1: Facultative pond treatment with stream discharge Option 2: Advanced secondary treatment with stream dischargeOption 3: Facultative pond treatment with disposal to an evaporation pondOption 4: Facultative pond treatment with disposal to storage dam, with on-sell of waterOption 5: Tertiary treatment and reverse osmosis, with stream dischargeOption 6: Tertiary treatment and reverse osmosis, with disposal to storage dam and on-sell of water
The level of treatment increases from left to right for the various options. Option 1 (lowest level of treatment) has the lowest �nancial cost but substantial environmental cost. Options 5 and 6, with the highest level of treatment, improve water quality at the expense of greater greenhouse gas emissions and energy costs. Option 2 (advanced secondary treatment plus stream discharge) is the best overall.
Source: Hardisty et al, 2012
Option 1 Option 4 Option 5 Option 6Option 2 Option 3
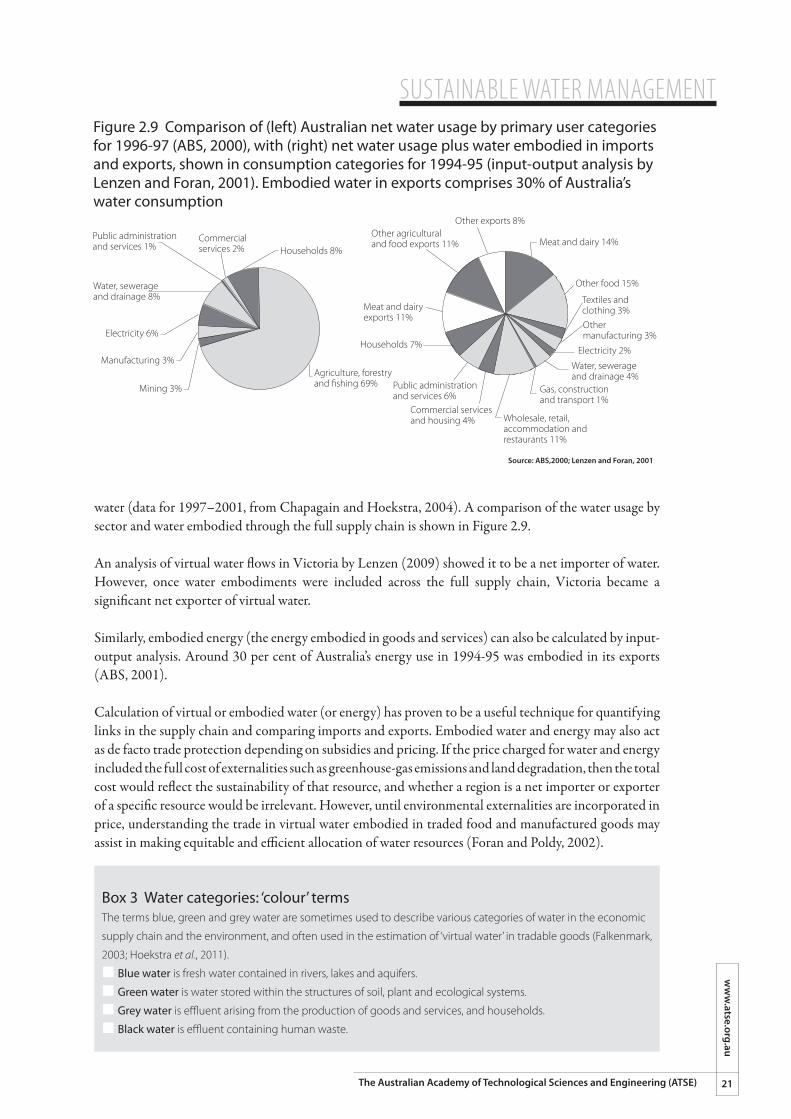
SUSTAINABLE WATER MANAGEMENTw
ww
.atse.org.au
21The Australian Academy of Technological Sciences and Engineering (ATSE)
water (data for 1997–2001, from Chapagain and Hoekstra, 2004). A comparison of the water usage by sector and water embodied through the full supply chain is shown in Figure 2.9.
An analysis of virtual water flows in Victoria by Lenzen (2009) showed it to be a net importer of water. However, once water embodiments were included across the full supply chain, Victoria became a significant net exporter of virtual water.
Similarly, embodied energy (the energy embodied in goods and services) can also be calculated by input-output analysis. Around 30 per cent of Australia’s energy use in 1994-95 was embodied in its exports (ABS, 2001).
Calculation of virtual or embodied water (or energy) has proven to be a useful technique for quantifying links in the supply chain and comparing imports and exports. Embodied water and energy may also act as de facto trade protection depending on subsidies and pricing. If the price charged for water and energy included the full cost of externalities such as greenhouse-gas emissions and land degradation, then the total cost would reflect the sustainability of that resource, and whether a region is a net importer or exporter of a specific resource would be irrelevant. However, until environmental externalities are incorporated in price, understanding the trade in virtual water embodied in traded food and manufactured goods may assist in making equitable and efficient allocation of water resources (Foran and Poldy, 2002).
Box 3 Water categories: ‘colour’ termsThe terms blue, green and grey water are sometimes used to describe various categories of water in the economic
supply chain and the environment, and often used in the estimation of ‘virtual water’ in tradable goods (Falkenmark,
2003; Hoekstra et al., 2011).
¢ Blue water is fresh water contained in rivers, lakes and aquifers.
¢ Green water is water stored within the structures of soil, plant and ecological systems.
¢ Grey water is effluent arising from the production of goods and services, and households.
¢ Black water is effluent containing human waste.
Figure 2.9 Comparison of (left) Australian net water usage by primary user categories for 1996-97 (ABS, 2000), with (right) net water usage plus water embodied in imports and exports, shown in consumption categories for 1994-95 (input-output analysis by Lenzen and Foran, 2001). Embodied water in exports comprises 30% of Australia’s water consumption
Public administrationand services 1%
Commercialservices 2% Households 8%
Agriculture, forestryand �shing 69% Mining 3%
Manufacturing 3%
Electricity 6%
Water, sewerageand drainage 8%
Other exports 8%Other agriculturaland food exports 11%
Meat and dairyexports 11%
Meat and dairy 14%
Public administrationand services 6%
Commercial servicesand housing 4%
Households 7%
Gas, constructionand transport 1%
Othermanufacturing 3%
Electricity 2%
Water, sewerageand drainage 4%
Other food 15%
Textiles andclothing 3%
Wholesale, retail,accommodation and restaurants 11%
Source: ABS,2000; Lenzen and Foran, 2001

SUSTAINABLE WATER MANAGEMENT
22
ww
w.a
tse.
org.
au
The Australian Academy of Technological Sciences and Engineering (ATSE)
SUSTAINABLE WATER MANAGEMENTw
ww
.atse.org.au
23The Australian Academy of Technological Sciences and Engineering (ATSE)
3. Interdependencies
Water is inextricably linked to all sectors of the Australian economy, in particular to agriculture, mining and electricity generation. Water management is confronted by challenges posed by influences such as population growth, urban expansion, environmental degradation, climate change and variability and social pressures; it is constrained by regulatory, legal and institutional frameworks.
At the broadest level, societal and natural resources can be grouped into five major interdependent sectors: water, agriculture, energy, human health and ecosystem function (Figure 3.1).
A wide range of external factors impact on these resource sectors and affect their availability. These system stressors include such diverse drivers as:¢ landscape: land management practices, landscape degradation and biofuel production;¢ hydrology: droughts and floods, irrigation and salinity;¢ climate: short- and medium-term climate variability and long-term climate change;¢ people: population demand and liveability of urban areas;¢ pollution: greenhouse gases and other pollutants discharged into air and water;¢ biota, animal, plant and insect dynamics; and¢ natural landscape change.
Because of the complex interactions, attempts have been made to employ a systems dynamics approach in order to capture the full range of non-linear feedback between various components of the system. For example, one study frames the threat to water availability and resilience to shocks in terms of the severity of these challenges, and suggests that the risk from natural and human-caused climate variability and longer-term climate change should be compared with other risks in order to develop an optimal mitigation or adaptation strategy (Hossain, 2011).
3.1 Influence diagramIn 2010, ATSE convened an international workshop to explore the complex connections of water in the Australian society, Water and its Interdependencies in the Australian Economy (ATSE, 2010). The issues highlighted are further expanded in this report. The connections between water, energy, climate change,
Chapter SummaryThis chapter describes the major connections between water and other sectors of the Australian economy and society, and highlights the major drivers, influences and feedback mechanisms.¢ �Water is inextricably linked to all sectors of the Australian economy, society and the environment.¢ �A wide range of external factors impact on water availability and use, including climate and
rainfall, land use, industry demand, population growth, pollution and institutional arrangements.¢ �Water and energy policy, in particular, should be consistent and recognise the interdependencies
between these sectors.¢ �Water policy should recognise the complex, dynamic interdependencies between economic
sectors, the environment and society. Policy should facilitate efficient and rapid adaptation to changes in external drivers such as climate and export demand.
¢ �Adoption of reforms implicit in the states’ and territories’ commitment to the NWI, and more recently urged by the Productivity Commission, would go a long way to improving Australia’s productivity and setting the path for a green growth economy in the water and related sectors.
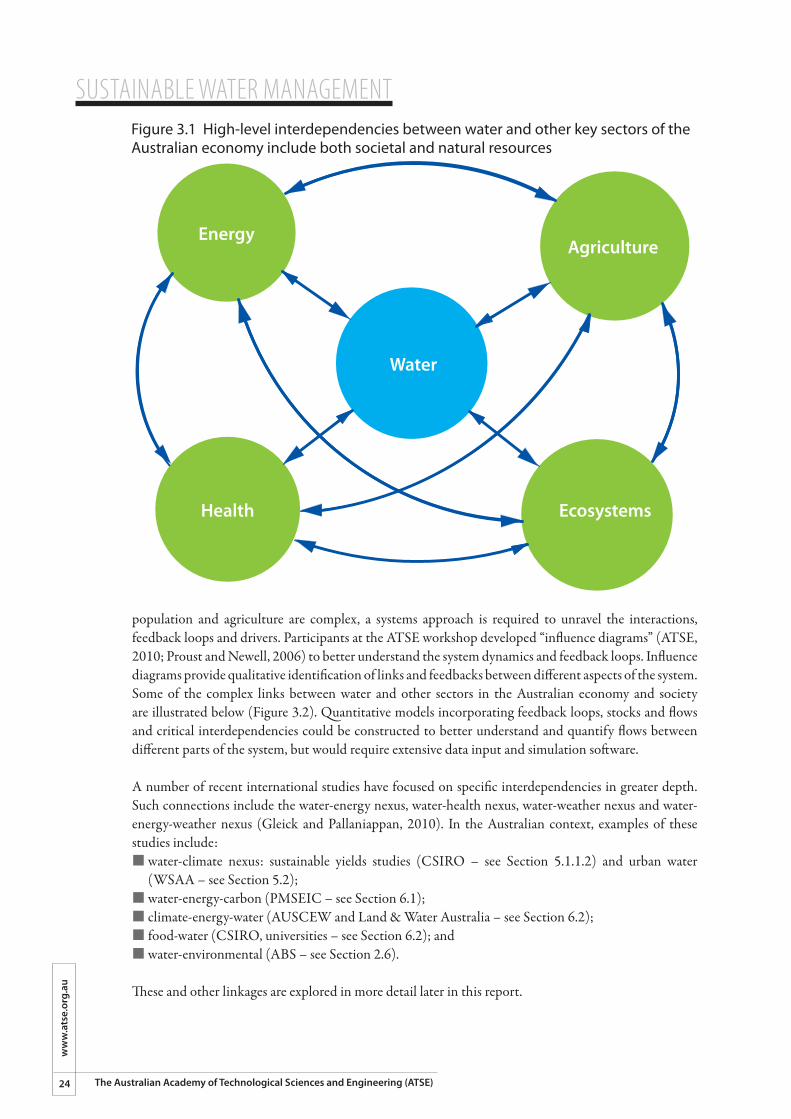
SUSTAINABLE WATER MANAGEMENT
24
ww
w.a
tse.
org.
au
The Australian Academy of Technological Sciences and Engineering (ATSE)
population and agriculture are complex, a systems approach is required to unravel the interactions, feedback loops and drivers. Participants at the ATSE workshop developed “influence diagrams” (ATSE, 2010; Proust and Newell, 2006) to better understand the system dynamics and feedback loops. Influence diagrams provide qualitative identification of links and feedbacks between different aspects of the system.Some of the complex links between water and other sectors in the Australian economy and society are illustrated below (Figure 3.2). Quantitative models incorporating feedback loops, stocks and flows and critical interdependencies could be constructed to better understand and quantify flows between different parts of the system, but would require extensive data input and simulation software. A number of recent international studies have focused on specific interdependencies in greater depth. Such connections include the water-energy nexus, water-health nexus, water-weather nexus and water-energy-weather nexus (Gleick and Pallaniappan, 2010). In the Australian context, examples of these studies include:¢�water-climate nexus: sustainable yields studies (CSIRO – see Section 5.1.1.2) and urban water
(WSAA – see Section 5.2);¢ water-energy-carbon (PMSEIC – see Section 6.1);¢ climate-energy-water (AUSCEW and Land & Water Australia – see Section 6.2);¢ food-water (CSIRO, universities – see Section 6.2); and¢ water-environmental (ABS – see Section 2.6).
These and other linkages are explored in more detail later in this report.
Figure 3.1 High-level interdependencies between water and other key sectors of the Australian economy include both societal and natural resources
Water
EnergyAgriculture
Health Ecosystems
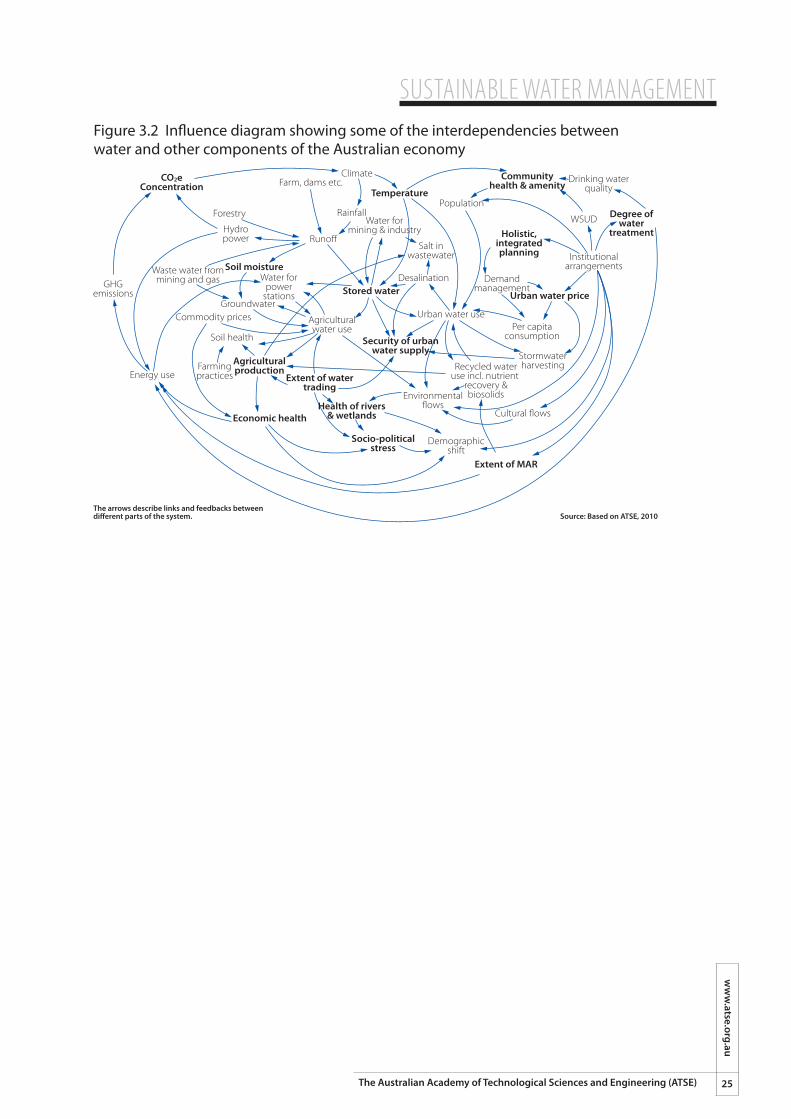
SUSTAINABLE WATER MANAGEMENTw
ww
.atse.org.au
25The Australian Academy of Technological Sciences and Engineering (ATSE)
Figure 3.2 In�uence diagram showing some of the interdependencies between water and other components of the Australian economy
Source: Based on ATSE, 2010The arrows describe links and feedbacks between di�erent parts of the system.
Stored water
Communityhealth & amenity
TemperaturePopulation
Urban water price
Holistic,integratedplanning
Degree ofwater
treatment
GHGemissions
Waste water frommining and gas
Forestry
Hydropower
Farm, dams etc.Climate
Rainfall
Runo�
Water forpower
stationsGroundwater
Commodity prices
FarmingpracticesEnergy use
Environmental�ows
Agriculturalwater use
Salt inwastewater
Water formining & industry
Desalination Demandmanagement
WSUD
Institutionalarrangements
Drinking waterquality
Per capitaconsumption
Stormwaterharvesting
Cultural �ows
Demographicshift
Urban water use
Soil health
Health of rivers& wetlands
Socio-politicalstress
Extent of watertrading
Economic health
Extent of MAR
Recycled wateruse incl. nutrient
recovery &biosolids
Agriculturalproduction
CO2eConcentration
Soil moisture
Security of urbanwater supply
SUSTAINABLE WATER MANAGEMENT
26
ww
w.a
tse.
org.
au
The Australian Academy of Technological Sciences and Engineering (ATSE)
4. Water demand
Australia’s total water consumption for economic and domestic use over the past decade ranged between 14,000 and 24,000 GL per year, depending on rainfall (ABS, 2010a). The breakdown of water use by sector for 2008-09 is shown in Figure 4.1. Agriculture accounts for the largest share of Australia’s total water consumption, at just over 50 per cent, but is considerably higher when water is plentiful (for example, 67 per cent in 2000-01). In addition to the consumptive uses reported by the ABS, the environment should also be classified as a ‘user of water’, especially when water is purchased or sequestered for the express purpose of environmental flow releases (Section 4.6).
Chapter SummaryThis chapter describes the various users of water in Australia, including cities, agriculture, industry (including electricity generation and mining). Water is needed to sustain environmental assets and cultural and social values. Achieving green growth in the water sector requires strategic vision, political leadership and a strong science, technology and engineering base to help balance demands.¢ �Water is consumed across all sectors of the economy, in urban and rural areas, in households, for
agriculture, mining, industry and the environment.¢ �A well-managed environment is both a source and a user of water.¢ �Urban demand is mainly determined by population. Climate has relatively small impact on
demand, but a large impact on supply. During drought periods, utilities have controlled demand by the use of water restrictions, which puts stress on social amenity. Household spending on water is much lower than electricity and other housing costs.
¢ �Agriculture accounts for more than 50 per cent of Australia’s water consumption. Irrigated agriculture consumes 90 per cent of water used in agriculture. Irrigated agriculture contributes 30 per cent of the gross added value of agricultural commodities from about one per cent of agricultural land.
¢ �The Murray–Darling Basin (MDB) contains one-quarter of Australia’s agricultural land and produces 39 per cent of Australia’s agricultural production. Irrigated agriculture contributes 40 per cent of MDB’s agricultural production and seven per cent of the gross regional product. The MDB is a prime example of conflicts that arise between competing demands in the economic-social-environmental nexus. Successive basin management plans demonstrate the difficulty of formulating ‘green growth’ policies to retrieve over-allocated water resources to protect communities and the environment.
¢ �Electricity production is strongly reliant on access to reliable water supplies, which are provided at below market value. Recent droughts severely impacted electricity production across much of eastern Australia, a problem that could get worse with increasing demand and climate change. Electricity security and reliability would be greatly enhanced by conversion of thermal power plants to dry or hybrid cooling.
¢ �The expansion of coal seam gas extraction represents a major challenge to water policy, with threats to aquifers, agriculture and the environment. Urgent reform is required to align water, mining, petroleum and environmental policies.
¢ �A stronger science base is needed to understand hydrogeological connectivity of surface and groundwater.
¢ �Water allocated to the environment supports terrestrial and aquatic ecosystems and natural functions of the landscape, maintaining the viability of river systems and groundwater basins as well as downstream communities.
¢ �Indigenous water requirements should be recognised through the provision of ‘cultural flows’ to maintain and enhance indigenous spiritual and cultural values.
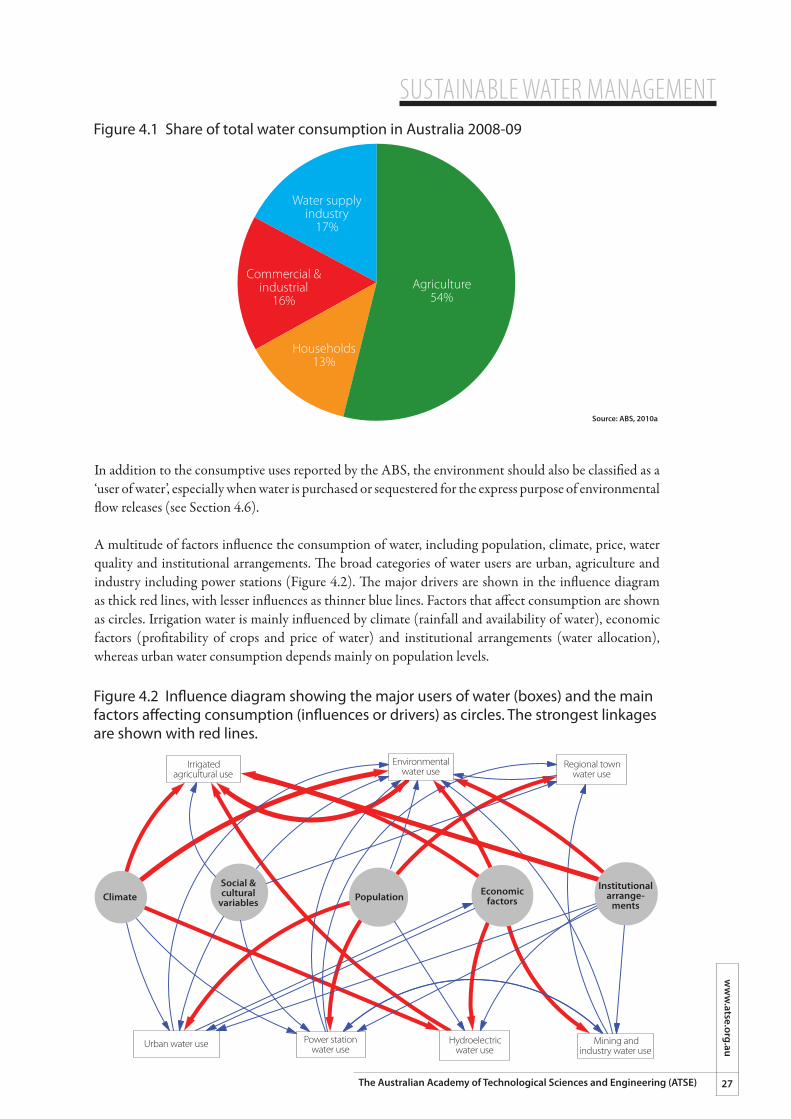
SUSTAINABLE WATER MANAGEMENTw
ww
.atse.org.au
27The Australian Academy of Technological Sciences and Engineering (ATSE)
In addition to the consumptive uses reported by the ABS, the environment should also be classified as a ‘user of water’, especially when water is purchased or sequestered for the express purpose of environmental flow releases (see Section 4.6).
A multitude of factors influence the consumption of water, including population, climate, price, water quality and institutional arrangements. The broad categories of water users are urban, agriculture and industry including power stations (Figure 4.2). The major drivers are shown in the influence diagram as thick red lines, with lesser influences as thinner blue lines. Factors that affect consumption are shown as circles. Irrigation water is mainly influenced by climate (rainfall and availability of water), economic factors (profitability of crops and price of water) and institutional arrangements (water allocation), whereas urban water consumption depends mainly on population levels.
Figure 4.1 Share of total water consumption in Australia 2008-09
Source: ABS, 2010a
Water supplyindustry
17%
Commercial &industrial
16%
Households13%
Agriculture54%
Figure 4.2 In�uence diagram showing the major users of water (boxes) and the main factors a�ecting consumption (in�uences or drivers) as circles. The strongest linkages are shown with red lines.
Irrigatedagricultural use
Regional townwater use
Urban water use Mining andindustry water use
Power stationwater use
Environmentalwater use
Social &cultural
variablesEconomic
factorsPopulation
Hydroelectricwater use
Institutionalarrange-
mentsClimate
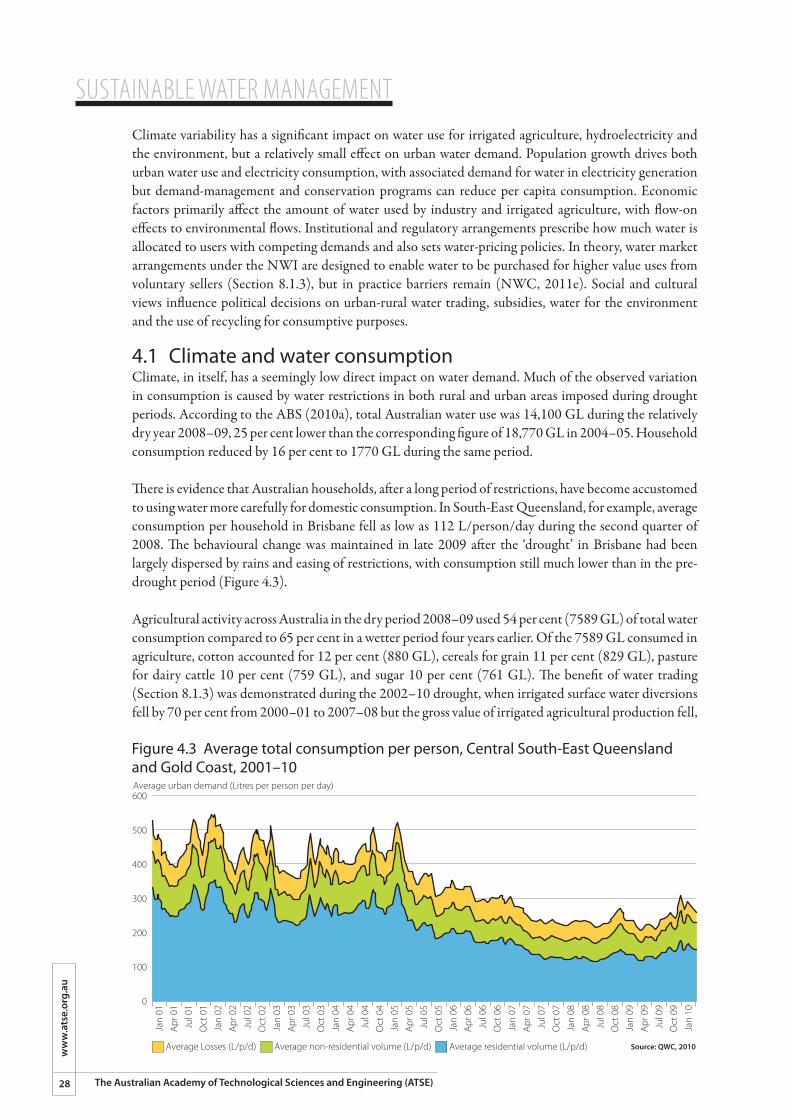
SUSTAINABLE WATER MANAGEMENT
28
ww
w.a
tse.
org.
au
The Australian Academy of Technological Sciences and Engineering (ATSE)
Climate variability has a significant impact on water use for irrigated agriculture, hydroelectricity and the environment, but a relatively small effect on urban water demand. Population growth drives both urban water use and electricity consumption, with associated demand for water in electricity generation but demand-management and conservation programs can reduce per capita consumption. Economic factors primarily affect the amount of water used by industry and irrigated agriculture, with flow-on effects to environmental flows. Institutional and regulatory arrangements prescribe how much water is allocated to users with competing demands and also sets water-pricing policies. In theory, water market arrangements under the NWI are designed to enable water to be purchased for higher value uses from voluntary sellers (Section 8.1.3), but in practice barriers remain (NWC, 2011e). Social and cultural views influence political decisions on urban-rural water trading, subsidies, water for the environment and the use of recycling for consumptive purposes.
4.1 Climate and water consumptionClimate, in itself, has a seemingly low direct impact on water demand. Much of the observed variation in consumption is caused by water restrictions in both rural and urban areas imposed during drought periods. According to the ABS (2010a), total Australian water use was 14,100 GL during the relatively dry year 2008–09, 25 per cent lower than the corresponding figure of 18,770 GL in 2004–05. Household consumption reduced by 16 per cent to 1770 GL during the same period.
There is evidence that Australian households, after a long period of restrictions, have become accustomed to using water more carefully for domestic consumption. In South-East Queensland, for example, average consumption per household in Brisbane fell as low as 112 L/person/day during the second quarter of 2008. The behavioural change was maintained in late 2009 after the ‘drought’ in Brisbane had been largely dispersed by rains and easing of restrictions, with consumption still much lower than in the pre-drought period (Figure 4.3).
Agricultural activity across Australia in the dry period 2008–09 used 54 per cent (7589 GL) of total water consumption compared to 65 per cent in a wetter period four years earlier. Of the 7589 GL consumed in agriculture, cotton accounted for 12 per cent (880 GL), cereals for grain 11 per cent (829 GL), pasture for dairy cattle 10 per cent (759 GL), and sugar 10 per cent (761 GL). The benefit of water trading (Section 8.1.3) was demonstrated during the 2002–10 drought, when irrigated surface water diversions fell by 70 per cent from 2000–01 to 2007–08 but the gross value of irrigated agricultural production fell,
Figure 4.3 Average total consumption per person, Central South-East Queensland and Gold Coast, 2001–10
600
500
400
300
200
100
0
Average urban demand (Litres per person per day)
Average Losses (L/p/d)
Jan
01A
pr 0
1Ju
l 01
Oct
01
Jan
02A
pr 0
2Ju
l 02
Oct
02
Jan
03A
pr 0
3Ju
l 03
Oct
03
Jan
04A
pr 0
4Ju
l 04
Oct
04
Jan
05A
pr 0
5Ju
l 05
Oct
05
Jan
06A
pr 0
6Ju
l 06
Oct
06
Jan
07A
pr 0
7Ju
l 07
Oct
07
Jan
08A
pr 0
8Ju
l 08
Oct
08
Jan
09A
pr 0
9Ju
l 09
Oct
09
Jan
10
Average non-residential volume (L/p/d) Average residential volume (L/p/d) Source: QWC, 2010
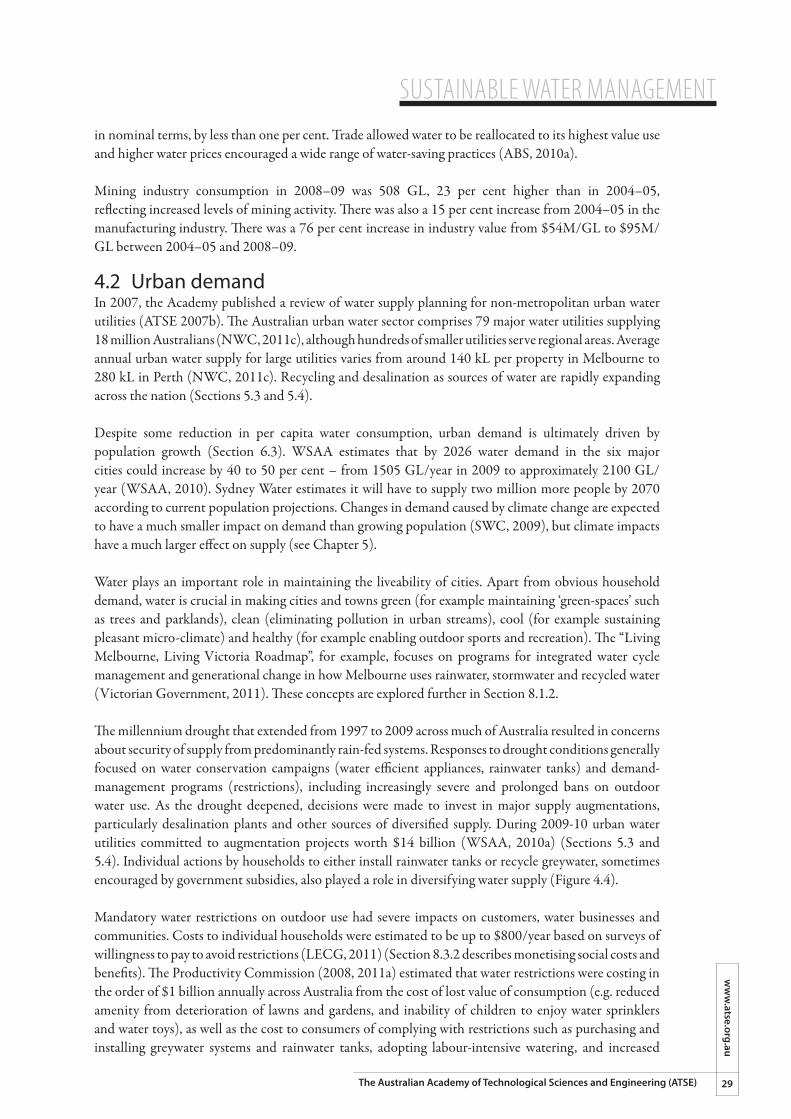
SUSTAINABLE WATER MANAGEMENTw
ww
.atse.org.au
29The Australian Academy of Technological Sciences and Engineering (ATSE)
in nominal terms, by less than one per cent. Trade allowed water to be reallocated to its highest value use and higher water prices encouraged a wide range of water-saving practices (ABS, 2010a).
Mining industry consumption in 2008–09 was 508 GL, 23 per cent higher than in 2004–05, reflecting increased levels of mining activity. There was also a 15 per cent increase from 2004–05 in the manufacturing industry. There was a 76 per cent increase in industry value from $54M/GL to $95M/GL between 2004–05 and 2008–09.
4.2 Urban demandIn 2007, the Academy published a review of water supply planning for non-metropolitan urban water utilities (ATSE 2007b). The Australian urban water sector comprises 79 major water utilities supplying 18 million Australians (NWC, 2011c), although hundreds of smaller utilities serve regional areas. Average annual urban water supply for large utilities varies from around 140 kL per property in Melbourne to 280 kL in Perth (NWC, 2011c). Recycling and desalination as sources of water are rapidly expanding across the nation (Sections 5.3 and 5.4).
Despite some reduction in per capita water consumption, urban demand is ultimately driven by population growth (Section 6.3). WSAA estimates that by 2026 water demand in the six major cities could increase by 40 to 50 per cent – from 1505 GL/year in 2009 to approximately 2100 GL/year (WSAA, 2010). Sydney Water estimates it will have to supply two million more people by 2070 according to current population projections. Changes in demand caused by climate change are expected to have a much smaller impact on demand than growing population (SWC, 2009), but climate impacts have a much larger effect on supply (see Chapter 5).
Water plays an important role in maintaining the liveability of cities. Apart from obvious household demand, water is crucial in making cities and towns green (for example maintaining ‘green-spaces’ such as trees and parklands), clean (eliminating pollution in urban streams), cool (for example sustaining pleasant micro-climate) and healthy (for example enabling outdoor sports and recreation). The “Living Melbourne, Living Victoria Roadmap”, for example, focuses on programs for integrated water cycle management and generational change in how Melbourne uses rainwater, stormwater and recycled water (Victorian Government, 2011). These concepts are explored further in Section 8.1.2.
The millennium drought that extended from 1997 to 2009 across much of Australia resulted in concerns about security of supply from predominantly rain-fed systems. Responses to drought conditions generally focused on water conservation campaigns (water efficient appliances, rainwater tanks) and demand-management programs (restrictions), including increasingly severe and prolonged bans on outdoor water use. As the drought deepened, decisions were made to invest in major supply augmentations, particularly desalination plants and other sources of diversified supply. During 2009-10 urban water utilities committed to augmentation projects worth $14 billion (WSAA, 2010a) (Sections 5.3 and 5.4). Individual actions by households to either install rainwater tanks or recycle greywater, sometimes encouraged by government subsidies, also played a role in diversifying water supply (Figure 4.4).
Mandatory water restrictions on outdoor use had severe impacts on customers, water businesses and communities. Costs to individual households were estimated to be up to $800/year based on surveys of willingness to pay to avoid restrictions (LECG, 2011) (Section 8.3.2 describes monetising social costs and benefits). The Productivity Commission (2008, 2011a) estimated that water restrictions were costing in the order of $1 billion annually across Australia from the cost of lost value of consumption (e.g. reduced amenity from deterioration of lawns and gardens, and inability of children to enjoy water sprinklers and water toys), as well as the cost to consumers of complying with restrictions such as purchasing and installing greywater systems and rainwater tanks, adopting labour-intensive watering, and increased
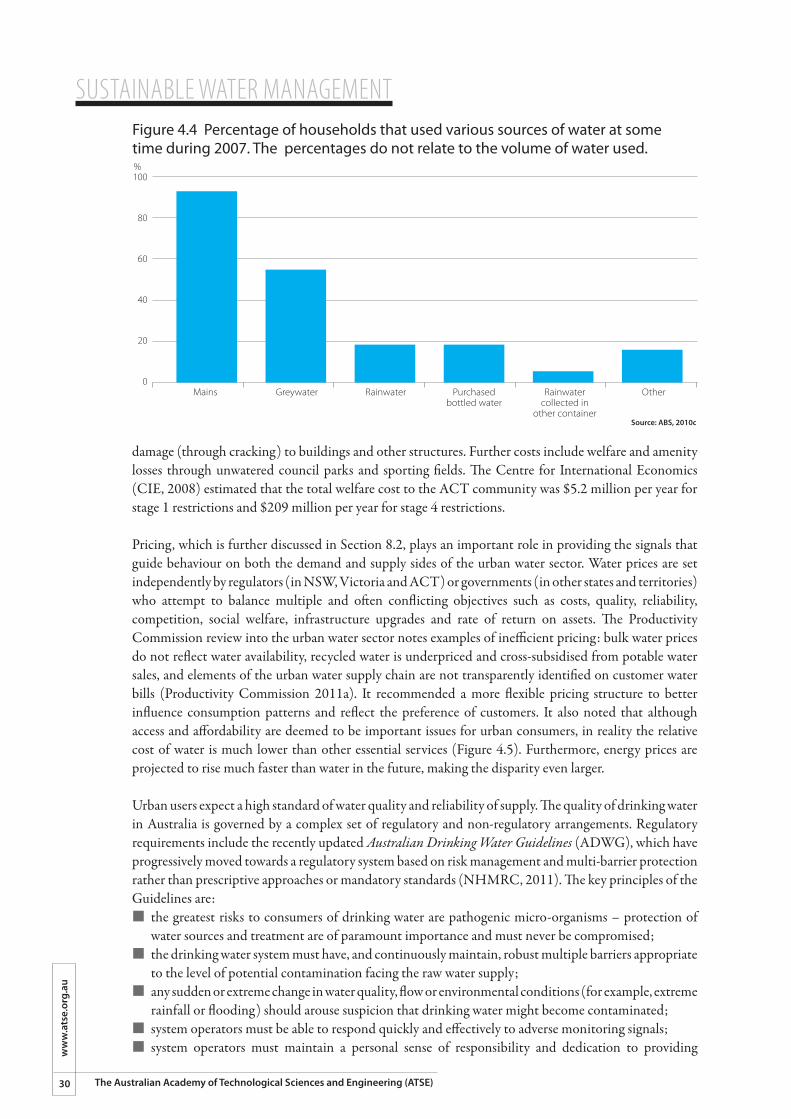
SUSTAINABLE WATER MANAGEMENT
30
ww
w.a
tse.
org.
au
The Australian Academy of Technological Sciences and Engineering (ATSE)
damage (through cracking) to buildings and other structures. Further costs include welfare and amenity losses through unwatered council parks and sporting fields. The Centre for International Economics (CIE, 2008) estimated that the total welfare cost to the ACT community was $5.2 million per year for stage 1 restrictions and $209 million per year for stage 4 restrictions.
Pricing, which is further discussed in Section 8.2, plays an important role in providing the signals that guide behaviour on both the demand and supply sides of the urban water sector. Water prices are set independently by regulators (in NSW, Victoria and ACT) or governments (in other states and territories) who attempt to balance multiple and often conflicting objectives such as costs, quality, reliability, competition, social welfare, infrastructure upgrades and rate of return on assets. The Productivity Commission review into the urban water sector notes examples of inefficient pricing: bulk water prices do not reflect water availability, recycled water is underpriced and cross-subsidised from potable water sales, and elements of the urban water supply chain are not transparently identified on customer water bills (Productivity Commission 2011a). It recommended a more flexible pricing structure to better influence consumption patterns and reflect the preference of customers. It also noted that although access and affordability are deemed to be important issues for urban consumers, in reality the relative cost of water is much lower than other essential services (Figure 4.5). Furthermore, energy prices are projected to rise much faster than water in the future, making the disparity even larger.
Urban users expect a high standard of water quality and reliability of supply. The quality of drinking water in Australia is governed by a complex set of regulatory and non-regulatory arrangements. Regulatory requirements include the recently updated Australian Drinking Water Guidelines (ADWG), which have progressively moved towards a regulatory system based on risk management and multi-barrier protection rather than prescriptive approaches or mandatory standards (NHMRC, 2011). The key principles of the Guidelines are:¢ �the greatest risks to consumers of drinking water are pathogenic micro-organisms – protection of
water sources and treatment are of paramount importance and must never be compromised;¢ �the drinking water system must have, and continuously maintain, robust multiple barriers appropriate
to the level of potential contamination facing the raw water supply;¢ �any sudden or extreme change in water quality, flow or environmental conditions (for example, extreme
rainfall or flooding) should arouse suspicion that drinking water might become contaminated;¢ �system operators must be able to respond quickly and effectively to adverse monitoring signals;¢ �system operators must maintain a personal sense of responsibility and dedication to providing
Figure 4.4 Percentage of households that used various sources of water at some time during 2007. The percentages do not relate to the volume of water used.
100
80
60
40
20
0
%
Mains Greywater Rainwater Purchasedbottled water
Rainwatercollected in
other container
Other
Source: ABS, 2010c
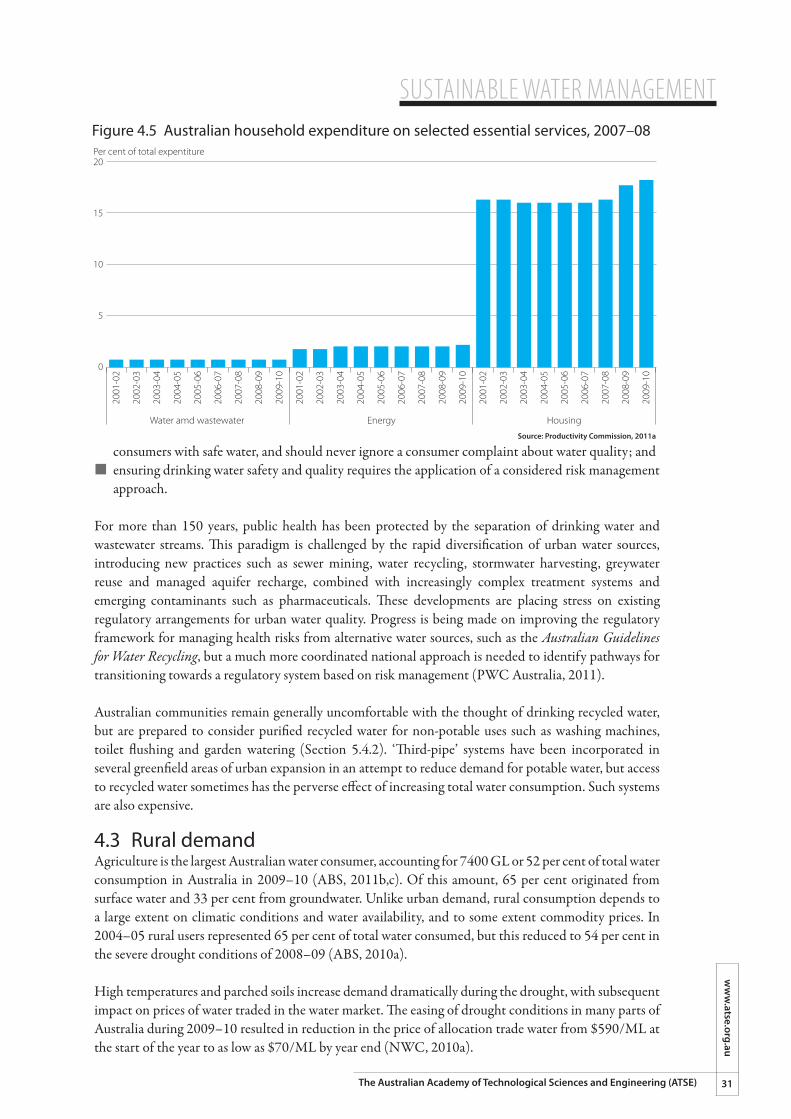
SUSTAINABLE WATER MANAGEMENTw
ww
.atse.org.au
31The Australian Academy of Technological Sciences and Engineering (ATSE)
Figure 4.5 Australian household expenditure on selected essential services, 2007–08
20
15
10
5
0
Per cent of total expentiture
2001
-02
2002
-03
2003
-04
2004
-05
Water amd wastewater Energy Housing
2005
-06
2006
-07
2007
-08
2008
-09
2009
-10
2001
-02
2002
-03
2003
-04
2004
-05
2005
-06
2006
-07
2007
-08
2008
-09
2009
-10
2001
-02
2002
-03
2003
-04
2004
-05
2005
-06
2006
-07
2007
-08
2008
-09
2009
-10
Source: Productivity Commission, 2011a
consumers with safe water, and should never ignore a consumer complaint about water quality; and¢ �ensuring drinking water safety and quality requires the application of a considered risk management
approach.
For more than 150 years, public health has been protected by the separation of drinking water and wastewater streams. This paradigm is challenged by the rapid diversification of urban water sources, introducing new practices such as sewer mining, water recycling, stormwater harvesting, greywater reuse and managed aquifer recharge, combined with increasingly complex treatment systems and emerging contaminants such as pharmaceuticals. These developments are placing stress on existing regulatory arrangements for urban water quality. Progress is being made on improving the regulatory framework for managing health risks from alternative water sources, such as the Australian Guidelines for Water Recycling, but a much more coordinated national approach is needed to identify pathways for transitioning towards a regulatory system based on risk management (PWC Australia, 2011).
Australian communities remain generally uncomfortable with the thought of drinking recycled water, but are prepared to consider purified recycled water for non-potable uses such as washing machines, toilet flushing and garden watering (Section 5.4.2). ‘Third-pipe’ systems have been incorporated in several greenfield areas of urban expansion in an attempt to reduce demand for potable water, but access to recycled water sometimes has the perverse effect of increasing total water consumption. Such systems are also expensive.
4.3 Rural demandAgriculture is the largest Australian water consumer, accounting for 7400 GL or 52 per cent of total water consumption in Australia in 2009–10 (ABS, 2011b,c). Of this amount, 65 per cent originated from surface water and 33 per cent from groundwater. Unlike urban demand, rural consumption depends to a large extent on climatic conditions and water availability, and to some extent commodity prices. In 2004–05 rural users represented 65 per cent of total water consumed, but this reduced to 54 per cent in the severe drought conditions of 2008–09 (ABS, 2010a).
High temperatures and parched soils increase demand dramatically during the drought, with subsequent impact on prices of water traded in the water market. The easing of drought conditions in many parts of Australia during 2009–10 resulted in reduction in the price of allocation trade water from $590/ML at the start of the year to as low as $70/ML by year end (NWC, 2010a).
SUSTAINABLE WATER MANAGEMENT
32
ww
w.a
tse.
org.
au
The Australian Academy of Technological Sciences and Engineering (ATSE)
Other rural consumers include domestic, mining and coal-fired power generation. These consumers usually achieve a higher security of supply when water is scarce Furthermore, some high-value mining projects (for example the Cadia Gold Mine in NSW) received preferential allocation to other users because of their contributions to the local (and state) economy (ABC 2007; Minerals Council Australia, 2008).
Competing demands for water between irrigation, town water supply and the environment are generally governed by a series of statutory water sharing plans relevant to each water source (NWC, 2011d). However these plans have been criticised for being incomplete in addressing over-allocation (NWC 2011), disproportionately favouring consumptive users over the environment (CSIRO, 2008; Wentworth Group of Concerned Scientists, 2010) and for their suspension by state governments (NWC, 2010) at times of water scarcity.
4.3.1 IrrigationAlthough less than one per cent of Australia’s 400 million hectares of agricultural land is irrigated, irrigation consumes 90 per cent (6600 GL in 2009–10) of water used in agriculture (ABS, 2011b,c). Irrigation takes water from rivers and groundwater and, while providing substantial economic benefit, competes with uses such as ecosystem services in rivers, lakes and estuaries.
Irrigated production contributed 29 per cent to the total gross value of agricultural commodities in 2008–09. Vegetables for human consumption contributed the highest value to total irrigated production of $2.6 billion, followed by fruit and nuts ($2.4 billion) and dairy production ($2.3 billion) (ABS, 2010a). The Murray–Darling Basin accounts for 53 per cent of all irrigated agricultural land and 54 per cent of irrigation water applied nationally (EBC, et al., 2011; ABS, 2011c) (Section 4.3.2).
The irrigation sector faces significant challenges during periods of prolonged drought, and has responded with substantial investments in on-farm irrigation technologies, particularly in converting flood irrigation to more efficient pressurised systems. The Commonwealth Government, through its Sustainable Rural Water Use and Infrastructure Program, has made major investments in infrastructure to drive water savings. For example, the $688 million Wimmera–Mallee Pipeline Project by Grampians Wimmera Mallee Water replaced 17,000 kilometres of open channel system with 8800 km of underground pressurised pipeline, which will save on average 103 GL of water a year and provide a continuous water supply to approximately 9000 farms and 34 townships across the Wimmera and Mallee regions in Victoria (NWC, 2011d). This water would otherwise have evaporated or seeped through the channel walls to replenish groundwater, it is sometimes referred to as ‘saved water’. The region currently consumes about 17 GL of water annually. Of the 103 GL saved, 20 GL is earmarked for future development. Amortised at six per cent, the capital cost is around $0.40 per kL. For water delivered to the region (17 GL + 20 GL) the amortised capital cost is substantially higher, at around $1.10 per kL. The total length of piped irrigation carrier networks as a proportion of the total carrier network in rural Australia more than doubled in three years, from 15 per cent in 2006–07 to 37 per cent in 2009–10 (NWC, 2011d).
The Productivity Commission considers that the government subsidies for irrigation upgrades and other water infrastructure distort the true value and price of water (Sections 4.2.2 and 7.4). Thus non-irrigated agriculture in Australia is being placed at an unfair economic disadvantage compared to irrigated agriculture. These price distortions will be partly addressed when barriers to water trading are fully removed, as envisaged under the NWI.
Mushtaq and Maraseni (2011), in a study of the cost-effectiveness of technological change in the irrigation industry, found that water savings from changing to sprinkler irrigation and drip irrigation ranged from 14 per cent to 29 per cent. They found that the economic benefits from adopting efficient irrigation technology (water and labour savings and improved production rates) would more than offset
SUSTAINABLE WATER MANAGEMENTw
ww
.atse.org.au
33The Australian Academy of Technological Sciences and Engineering (ATSE)
increased energy costs with a moderate price on greenhouse-gas emissions. The study also found that for 50/50 water sharing plans, farmers would be economically better off using water savings technologies on their land rather than trading permanent water, given the potential for yield increases, and labour and input savings.
Technological advances that would improve efficiency and lower costs in irrigated agriculture include the following conversions:¢ �older, inefficient and energy-intensive sprinkler irrigation systems (hand shift and roll-line) to drip
and efficient sprinkler irrigation;¢ �surface irrigation systems to drip irrigation; and¢ �where flood irrigation is still carried out, laser levelling of soil.
High demand and shortages of irrigation water in the MDB has renewed interest in developing new irrigation areas in northern Australia. A review of the potential of the region by CSIRO concluded that rainfall patterns alternate between flooding rains in the summer and soil-water deficits for 10 months of the year. The study found other factors limiting the irrigation potential of northern Australia were the suitability of land and crops and access to infrastructure, workforce, and markets (Cresswell et al., 2009).
4.3.2 The Murray–Darling Basin: a macrocosm of competing demandsThe MDB drains one-seventh of the Australian continent. It covers one million square kilometres in five states and territories and almost a quarter (24 per cent) of Australian agricultural land. Over the past 100 years the MDB’s agricultural base has been progressively transformed from a low-intensity, dryland sector to a more intensive, mixed irrigation and dryland system of significant economic value.
Agriculture represents 94 per cent of land use across the MDB, 32 per cent of businesses and 11 per cent of jobs. The MDB generates 39 per cent of Australia’s agricultural production value, 40 per cent of which is from irrigated agriculture. However, irrigated agriculture only accounts for seven per cent of the gross regional product of the wider MDB economy (EBC et al., 2011). The contribution of agriculture to total employment is relatively higher in smaller regional communities.
Governance arrangements for the MDB have evolved over the past 130 years, starting with diversion of water for irrigation commencing in the 1880s, the creation of the River Murray Commission between the Commonwealth, NSW, Victoria and South Australia with the establishment of the River Murray Waters Agreement in 1915 (followed by successive amendments), the building of locks and other regulatory structures, the first (Lock 1) being completed in 1922, and the Murray–Darling Basin Agreement in 1987 with the establishment of the Murray–Darling Basin Commission (MDBC), to which Queensland and ACT also ultimately became signatories. Policy frameworks were further strengthened by the 1994 COAG water reform agenda and 2004 Intergovernmental Agreement on the National Water Initiative (Section 2.1). With the passage of the Water Act (2007), the MDBC was replaced by the Murray–Darling Basin Authority (MDBA) with members appointed by the Commonwealth in consultation with the Basin States/Territory.
For much of the past half century, water shortages have placed considerable stress on the MDB’s environmental assets as water was diverted from rivers and groundwater to irrigation and domestic use (Pittock et al, 2010). A “cap” limiting the taking of water from the River Murray to 1993–94 levels was set in place in 1995, but was followed by a 50 per cent increase in the use of Basin groundwater resources by 2007. Over-allocation of water and the recent decade-long drought further exacerbated water shortages, and projected climate change impacts of increased temperature and more severe droughts can be expected to increase water shortages in the future (CSIRO, 2008).
SUSTAINABLE WATER MANAGEMENT
34
ww
w.a
tse.
org.
au
The Australian Academy of Technological Sciences and Engineering (ATSE)
Water buy-backs and irrigation upgradesInitially, the MDBC Living Murray program focused on six iconic environmental sites. The Australian Government launched its Restoring the Balance in the Murray–Darling Basin program in 2007, designed to increase the availability of water for the environment. The Government allocated $8.9 billion to the task, with $3.1 billion allocated for buying existing water entitlements and $5.8 billion to upgrade infrastructure, over a 10-year period. As of 31 January 2012 the Government had purchased 1200 GL of entitlements worth about $1.8 billion expected to deliver 990 GL per annum for environmental purposes (Australian Government, 2012a), at an average cost of $1.80/kL. This volume represents seven per cent of the Basin-wide annual average inflows of 14,000 GL (CSIRO, 2008). About $4.4 billion has been committed to water savings infrastructure projects under the $5.8 billion Sustainable Rural Water Use and Infrastructure Program (Productivity Commission, 2010).
An example of infrastructure program is a $1.2 billion upgrade in the Goulburn Murray Irrigation District, Northern Victoria Irrigation Renewal Project (NVIRP) initiated by the Victorian Government but to be funded 80 per cent by the Commonwealth and 20 per cent by Victorian irrigators (funded by selling back ‘saved water’ to the Commonwealth) over a seven-year period (Premier of Victoria, 2011a). The upgrade will deliver 214 GL in water savings, of which Victoria will make available 102 GL for environmental use by the Commonwealth. The cost of the water savings is around $5600 per ML – three times the cost of water buybacks. A major attraction of the program is the support it gives to irrigation communities. Flow-on benefits to regional communities and reductions in salt loads in streams and rivers may have significant value in their own right (see for example Box 8, Section 6.1.5.1).
Some commentators have noted that the Commonwealth’s expenditure on new and renovated irrigation infrastructure is inconsistent with the 1994 COAG agreement on water resource policy, as well as the National Water Initiative 2004, that endorsed the ‘user-pays’ principle. Critics argue that the $8.9 billion allocated to upgrading infrastructure and water buybacks represents a transfer of national wealth to a relatively small number of irrigators (rather than to dryland farmers), estimated to be the equivalent of $500,000 per irrigator (Young, 2011).
The Productivity Commission (2010), investigating market-based approaches to restore environmental flows, found that government investment in irrigation water efficiency was less cost effective than water buy-backs, but noted the importance of also taking into consideration the value people place on environmental outcomes, the opportunity cost of foregone irrigation and the role of land management. Designing and delivering investment through markets is not simple (Whitten et al., 2009). Many ecosystem services and environmental goods (Section 2.5) are “public goods” whose use and benefits cannot be exclusively controlled. They are non-rival, in that one person’s enjoyment and consumption of the services does not impair other people’s benefits. As a result, there are no direct price mechanisms to signal the scarcity or degradation of these public goods. A recent study found that methodologies for evaluating ecosystem services in the Murray–Darling Basin were not sufficient to be used solely as a basis for water resource planning (Reid-Piko et al., 2010).
The Murray–Darling Basin PlanThe Water Act (2007) requires the MDBA to prepare and implement a binding Basin Plan for the integrated and sustainable management of water resources in the Basin. The Plan would require jurisdictions to refer certain powers to the Commonwealth, consistent with the constitutional rights of the states, to be administered by the MDBA.
The Basin Plan aims to set long-term sustainable diversion limits for each catchment within the Basin, and also for the Basin as a whole. A key aspect is a plan for delivering water for the environment with targets for water-dependent ecosystems, although the quantity required continues to be the subject of much
SUSTAINABLE WATER MANAGEMENTw
ww
.atse.org.au
35The Australian Academy of Technological Sciences and Engineering (ATSE)
controversy. The Authority released a A Guide to the Draft Basin Plan for public comment in October 2010. The Guide identified water needs of key environmental assets and key ecological function sites in the Basin, known as hydrological indicator sites, which were considered a reasonable approximation of the environmental water requirements of the broader Basin. The Guide reported that, based on estimates of end-of system flows, the amount of additional surface water needed for the environment was between 3000 GL/yr and 7600 GL/yr, long-term average. (This includes the 1470 GL already recovered through buy-backs and upgrades). A set of “Sustainable Diversion Limit (SDL) scenarios” was proposed with reductions in long-term average annual surface water use of 3000, 3500 and 4000 GL/yr, based on the judgement that less than 3000 GL would be unacceptable in terms of environmental outcomes, and a higher figure would result in unacceptably large economic impacts on irrigated agriculture.
The Wentworth Group (2010) analysed options for achieving a sustainable diversion limit within each of the 18 catchments of the Basin, based on the assumption that a minimum flow of two-thirds of the natural flow regime would be required to maintain key environmental attributes – the environment’s share of the existing cap on diversions would need to be increased by 4400 GL. It recommended that the remaining funds for buyback and infrastructure upgrades be combined and used more cost-effectively to return water to the environment and assist adjustment in regional communities. Existing programs were not optimal – water recovered from infrastructure upgrade programs was estimated to cost between $4600/ML and $11,400/ML, whereas water buybacks averaged only $2300/ML (since reduced to $1800/ML).
Release of the Guide for public consultation resulted in major controversy in regional areas due to a perceived lack of consideration of the social and economic impact of proposed reductions on local communities. Some groups disputed the legal interpretation of the Water Act (2007) that placed environmental needs first, before consideration of social and economic factors.
Several government enquiries followed. An Australian Government Senate Committee, chaired by Tony Windsor MP, investigated the legal interpretation of the Water Act (2007) and recommended that it be amended to ensure that environmental, social and economic factors could be given equal consideration in water allocation (Senate Committee, 2011). Concurrently, a House of Representatives Standing Committee on Regional Australia inquiry recommended a higher level of engagement with local communities to achieve water savings through environmental works and on-farm efficiency works, prior to any reduction in water entitlements. Other recommendations include governance reform, the cessation of non-strategic water purchases to reduce the occurrence of stranded irrigation assets, assessment of consequences for the community arising from water purchase, increased investment in water-saving projects and R&D in irrigation efficiency, improved climate projections to underpin assumptions on sustainable diversion limits, and placing the mining industry under the same obligations as other water users (Commonwealth of Australia, 2011a). Subsequently, the Government accepted most of the recommendations of the Windsor enquiry.
Other studies on community impacts include ABARES (2011a), which found that “while the overall effect on economic activity in the Basin is likely to be relatively modest, the effect could be significant for some towns that are highly dependent on irrigation expenditure. In particular, some towns surrounded by irrigated broadacre activities such as rice could be significantly affected by reductions in irrigation water availability”. EBC et al., (2011) found that the most vulnerable communities combined features of small population, high dependency on agriculture and high irrigation spend per capita, such as Warren and Collarenebri. However, even larger towns such as Griffith, Moree, Robinvale and Loxton were identified as being highly exposed to reductions in water availability. Even Shepparton may still be at risk as it provides significant services to irrigation-dependent communities. Towns such as Mudgee or Stanthorpe that combine high-value irrigation with tourism and other sectors, and larger diverse growing regional centres, such as Toowoomba or Dubbo, that have a breadth of activity and employment are less sensitive to a reduction in irrigation water availability.
SUSTAINABLE WATER MANAGEMENT
36
ww
w.a
tse.
org.
au
The Australian Academy of Technological Sciences and Engineering (ATSE)
A review of socioeconomic models of the Basin and impacts of the decade-long drought, found little evidence to support the recommendation that increases in environmental flows be limited to 4000 GL/yr because of high socioeconomic impacts of reduced water diversions. The review argued that a more effective approach to minimise the socioeconomic impacts of increased environmental flows would be to provide transitional assistance to irrigation-dependent communities to help them adjust to a future with lower water extractions. This would require a redirection of existing funding for water reform and/or the allocation of additional funds expressly for this purpose (Grafton, 2011).
In parallel, a number of studies have attempted to quantify the economic value of environmental water allocations. For example, Morrison and Hatton MacDonald (2010) found that improving the environmental condition of the Coorong in South Australia would boost its net present value by $4.3 billion, with major benefits from fishing, tourism and housing.
A full Draft Basin Plan was released on 28 November 2011 for 20 weeks of public consultation with the goal of gazettal in 2012 (MDBA, 2011). The draft Plan proposes that the existing baseline diversion limit for the Basin be reduced from the current 10,873 GL/yr by 2750 GL/yr over the seven-year period to 2019 when the Plan is fully implemented. This reduction is lower than the 3000 to 4000 GL proposed in the previous draft guide and substantially less than the 7600 GL of water considered by many ecologists to be necessary to fully restore environmental health and meet Australia’s Ramsar Convention obligations (Pittock and Finlayson, 2011). However, rather than focusing on average volumes it would be better to address the intended outcomes of delivering water for the environment, especially during prolonged droughts, the cost of doing so and the strength of the evidence base for making those assessments.
The targets in the Draft Plan will be reviewed in 2015 to monitor and review progress, including assessment of new knowledge, community impacts and environmental outcomes. The 1468 GL already recovered through infrastructure upgrades and buybacks is regarded as part of the target, so only half of the 2750 GL reduction is yet to be sourced.
The Draft Plan favours upgrades to irrigation infrastructure and environmental works and measures as preferable to water buy-backs as “recovering this volume through water purchases alone could have serious detrimental effects in communities that rely heavily on irrigated agriculture” (MDBA, 2011 media release). However, this approach may be sub-optimal for a number of reasons: (1) it relies on day-to-day management; (2) there is less room for error with less water – in periods of drought water for critical human needs,
essential community services and commerce and industry has priority over the environment; (3) it fragments the riverine environment with levees, channels, and weirs, blocking fish passages and
drying out wetlands; and (4) it risks exacerbating changes to soil and water quality, for instance, by increasing salinity levels in
isolated floodplain wetlands.
Preliminary research shows that for three Ramsar sites subject to previous environmental works and measures in The Living Murray program (MDBA, 2002), only 39 per cent of the 135,700 hectares of wetlands would be regularly inundated. These works may establish a path dependency whereby too little water is allocated to the environment to flood the remaining areas in breach of the Ramsar Convention (Kildea and Williams, 2011; Pittock and Finlayson, 2011; Pittock et al, 2012).
Groundwater. Under the Plan, groundwater extractions in most of the Basin are treated separately to surface water and, in contrast to recommendations of the NWC, groundwater is not considered to be necessarily connected to surface water. A Basin-wide limit of 4340 GL/yr long-term average is
SUSTAINABLE WATER MANAGEMENTw
ww
.atse.org.au
37The Australian Academy of Technological Sciences and Engineering (ATSE)
proposed for groundwater, which is almost twice the current total groundwater baseline diversion limit of 2353 GL/yr. Some have questioned whether the proposed increase is related to proposed expansion of coal-seam gas extraction (SMH, 29 Nov 2011). The scope of the CSIRO science review of sustainable diversion limits in the MDB draft plan (Young et al., 2011) excluded groundwater limits or surface-groundwater connectivity. Major knowledge gaps remain in this area.
Climate. The proposed Basin Plan fails to take into account the full range of climate projections from the CSIRO Murray–Darling Basin Sustainable Yields Project that were used in the earlier Guide to the Draft Plan. These ranged from a nine per cent increase to a 27 per cent decrease in water availability, with decreases of up to 41 per cent in Murray inflows. Instead, the climate ‘baseline’ used in the proposed Plan uses the historical inflow sequence (1895 to 2009) for analysing and defining the sustainable diversion limits, as this period contained a number of drought and flood sequences. This approach reflects a policy decision by MDBA for climate-change risk to be shared amongst users in current state water sharing plans. However, a CSIRO science review of the proposed Basin Plan found that most existing water sharing plans significantly protect entitlement holders from the impacts of future climate change, and shift the majority of the impact to non-entitlement water, especially during extended dry periods. Thus, the policy represents a significant risk to the environment during future extended dry periods, especially should these be more severe than in the past as a result of future climate change (Bond et al., 2011). The review recommended that more work was required to strengthen the scientific basis and reduce uncertainty (Young et al, 2011).
Summary. The Murray–Darling Basin represents a prime example of the competing demands of agriculture, the environment and local communities when faced with reduced water availability, and the difficulties of establishing a long-term policy for water reform suited to climate uncertainties, economic conditions and the expectations of regional communities.
The proposed Murray–Darling Basin Plan needs to be able to adaptively tailor water entitlements and subsequent annual allocations to variations in climate and inflows, and provide balanced risk sharing between consumptive users, key environmental assets and ecosystem functions during protracted drought periods, at both regional scale and basin scale. It is important that the science base is strengthened to inform future policy and implementation of the Plan, and that community consultation and engagement on water sharing continues, during the evolution of the Plan to 2019 and beyond. Targeted assistance to regional communities, rather than for irrigation purposes, may deliver better socio-economic outcomes and a more resilient regional economic base.
4.3.3 Rural ‘values‘Australia’s historical and political evolution has been shaped by balancing priorities between sparsely settled rural areas and densely populated cities on the coastal fringe. As the historian Judith Brett (Brett, 2011) describes these developments,
“Our federation was built on the idea of a big country and a fair share, no matter where one lived. We also looked to the bush for our legends and we still look to it for our food … But, as Murray-Darling water reform shows, the politics of dependence are complicated. The question remains: what will be the fate of the country in an era of user-pays, water cutbacks, climate change, droughts and flooding rains? What are the prospects for a new compact between country and city in Australia in the twenty-first century? Once the problems of the country were problems for the country as a whole. But then government stepped back …”.
– Judith Brett, 2011 (Brett, 2011)
City dwellers still closely relate to values of ‘the bush’ in their sense of national identity. When people are asked the question of what makes Australia distinctive, the country still supplies much of the answer
SUSTAINABLE WATER MANAGEMENT
38
ww
w.a
tse.
org.
au
The Australian Academy of Technological Sciences and Engineering (ATSE)
(Brett, 2011). The deeply embedded social value of regional Australia felt by the majority of Australians could be a contributing factor to the community support given to government programs for rural economic assistance, regional development and financial subsidies.
4.4 EnergyWater is required for a broad range of energy systems such as hydroelectric and thermal power plants, biofuel production, extraction of coal and coal-seam methane, shale gas and enhanced hydrocarbon recovery. As energy demand grows, so too does the demand for water. However, as mentioned in Section 8.1.2, water-sensitive urban design with street trees and parks can reduce the ‘heat island’ effect, resulting in cooler temperatures and lower demand for energy for air conditioning.
4.4.1 Water use in electricity generationWater is needed for most forms of thermal electricity generation. Coal and gas-fired power stations, solar-thermal plants and nuclear power stations use water to condense the exhaust from steam turbines. Such cooling water can be once through (from a river, an estuary or the sea) or recirculated through familiar hyperbolic shaped evaporative cooling towers. Air cooled condensing systems, albeit more costly and less efficient, are technologically suitable where water is limited.
Some renewables, particularly solar-thermal and geothermal, also need water, for condensing. Wind farms and photovoltaic arrays do not rely on water unless back-up hydroelectric pumped storage is used (Blakers et al., 2010). Hydroelectric plants withdraw water, extract its potential energy through hydraulic turbines and return it to the original river system. Such plants nearly always have an upstream storage dam in which water energy is stored, being delivered as needed to suit the needs of the power system. While some impacts are positive (the creation of lakes of natural beauty and massive water storages for human, agricultural and recreational uses), negative impacts include limitation of natural environmental flows (especially where water is withdrawn to another river system for irrigation as in the Snowy Hydro system), inundation and the risk of increased greenhouse gas emissions from methane arising from decaying vegetation in new dams. Lastly, evaporation and seepage can be significant (5 to 26 kL/MWh) (Gerbens-Leenes et al, 2009).
Access to adequate freshwater has been identified as a particularly prominent issue in scenario planning for future world energy development (World Economic Forum, 2011). Energy producers are amongst the largest industrial consumers of fresh water. The link between energy production and water will intensify as portfolio choices move increasingly towards more water-intensive technologies such as biofuels and enhanced hydrocarbon recovery. In the US, where power generation currently accounts for 40 per cent of all freshwater consumption, projected growth in energy production will require an increase of 165 per cent in freshwater withdrawal by 2025 (Shell International, 2011).
Excluding hydroelectricity, Australia’s electricity and gas sector consumed 2.3 per cent (328 GL) of Australia’s total water use in 2008–09 (ABS, 2010a), a marked increase from 1.4 per cent four years earlier. A much larger volume (45,000 GL) was used for hydroelectric generation but was fully returned to rivers as regulated discharge.
Given the water dependency of power generation, recent droughts affecting much of southern Australia impacted severely on security and reliability (Box 4) with both thermal and hydroelectric plants experiencing constraints. Power generation is therefore under growing economic pressure to use other options such as seawater, lower quality or treated waste water – or dry cooling (Smart and Aspinall, 2009).
Water value for electricity generation is high. Marginal value estimates range from $14 million/GL to $50 million/GL (ACIL Tasman, 2007; ABS 2010a) compared with average traded prices of $0.65 million/GL in 2007–08 and $0.35 million/GL in 2008–09 (NWC, 2010).
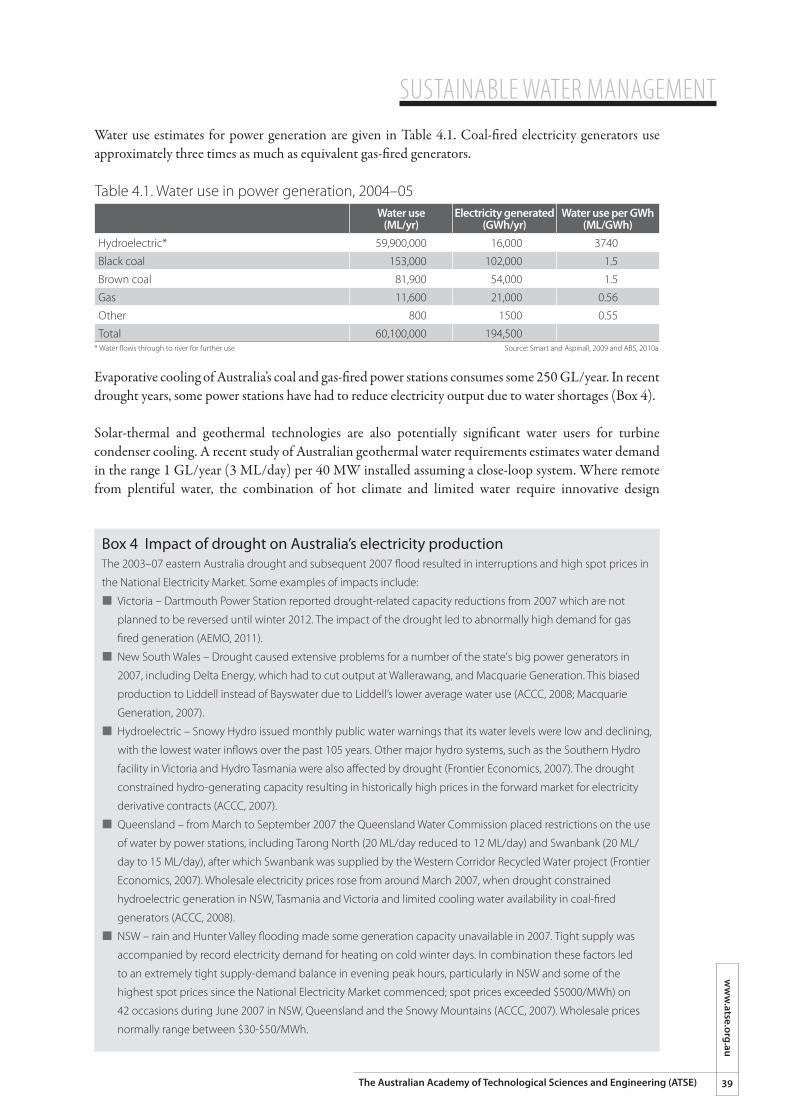
SUSTAINABLE WATER MANAGEMENTw
ww
.atse.org.au
39The Australian Academy of Technological Sciences and Engineering (ATSE)
Water use estimates for power generation are given in Table 4.1. Coal-fired electricity generators use approximately three times as much as equivalent gas-fired generators.
Table 4.1. Water use in power generation, 2004–05Water use
(ML/yr)Electricity generated
(GWh/yr)Water use per GWh
(ML/GWh)Hydroelectric* 59,900,000 16,000 3740
Black coal 153,000 102,000 1.5
Brown coal 81,900 54,000 1.5
Gas 11,600 21,000 0.56
Other 800 1500 0.55
Total 60,100,000 194,500* Water flows through to river for further use Source: Smart and Aspinall, 2009 and ABS, 2010a
Evaporative cooling of Australia’s coal and gas-fired power stations consumes some 250 GL/year. In recent drought years, some power stations have had to reduce electricity output due to water shortages (Box 4).
Solar-thermal and geothermal technologies are also potentially significant water users for turbine condenser cooling. A recent study of Australian geothermal water requirements estimates water demand in the range 1 GL/year (3 ML/day) per 40 MW installed assuming a close-loop system. Where remote from plentiful water, the combination of hot climate and limited water require innovative design
Box 4 Impact of drought on Australia’s electricity productionThe 2003–07 eastern Australia drought and subsequent 2007 flood resulted in interruptions and high spot prices in
the National Electricity Market. Some examples of impacts include:
¢ �Victoria – Dartmouth Power Station reported drought-related capacity reductions from 2007 which are not
planned to be reversed until winter 2012. The impact of the drought led to abnormally high demand for gas
fired generation (AEMO, 2011).
¢ �New South Wales – Drought caused extensive problems for a number of the state's big power generators in
2007, including Delta Energy, which had to cut output at Wallerawang, and Macquarie Generation. This biased
production to Liddell instead of Bayswater due to Liddell’s lower average water use (ACCC, 2008; Macquarie
Generation, 2007).
¢ �Hydroelectric – Snowy Hydro issued monthly public water warnings that its water levels were low and declining,
with the lowest water inflows over the past 105 years. Other major hydro systems, such as the Southern Hydro
facility in Victoria and Hydro Tasmania were also affected by drought (Frontier Economics, 2007). The drought
constrained hydro-generating capacity resulting in historically high prices in the forward market for electricity
derivative contracts (ACCC, 2007).
¢ �Queensland – from March to September 2007 the Queensland Water Commission placed restrictions on the use
of water by power stations, including Tarong North (20 ML/day reduced to 12 ML/day) and Swanbank (20 ML/
day to 15 ML/day), after which Swanbank was supplied by the Western Corridor Recycled Water project (Frontier
Economics, 2007). Wholesale electricity prices rose from around March 2007, when drought constrained
hydroelectric generation in NSW, Tasmania and Victoria and limited cooling water availability in coal-fired
generators (ACCC, 2008).
¢ �NSW – rain and Hunter Valley flooding made some generation capacity unavailable in 2007. Tight supply was
accompanied by record electricity demand for heating on cold winter days. In combination these factors led
to an extremely tight supply-demand balance in evening peak hours, particularly in NSW and some of the
highest spot prices since the National Electricity Market commenced; spot prices exceeded $5000/MWh) on
42 occasions during June 2007 in NSW, Queensland and the Snowy Mountains (ACCC, 2007). Wholesale prices
normally range between $30-$50/MWh.
SUSTAINABLE WATER MANAGEMENT
40
ww
w.a
tse.
org.
au
The Australian Academy of Technological Sciences and Engineering (ATSE)
solutions. (RPS Aquaterra and Hot Dry Rocks, 2012). The International Energy Agency (IEA, 2011b) compares water consumption for various energy technologies with a focus on renewables.
Dry or air-cooling significantly reduces water use to around 10 per cent or less of evaporative cooling but has an efficiency penalty of around two per cent and adds around three to five per cent to power station capital cost. Dry cooling of coal and gas generation thus adds slightly to greenhouse-gas emissions although the efficiency penalty can be almost eliminated if some evaporative cooling capacity is installed in parallel – the Heller system.
It follows that the addition of dry cooling capacity to existing power stations (both black and brown coal) in parallel with existing evaporative cooling systems could, given the economic case to do so, reduce evaporative water consumption very significantly, possibly up to 90 per cent. The dry-cooling capacity installed would provide for full load operation up to site ambient temperatures. Above this, existing evaporative capacity would be phased in to ensure that steam turbine exhaust pressures do not exceed safe limits (Hunwick, 2001; 2011).
An advantage of dry cooling is reduction in salt-rich wastewater, known as blowdown, from evaporative cooling systems. However there is little economic incentive now for power station dry-cooling as water is provided below market value and the saline wastewater impact incurs no internal cost. The proper economic valuation of water and inclusion of environmental externalities could create the economic incentive for dry-cooling to reduce water consumption and drought-proof generators.
4.4.2 Demand projections for electricityBy 2020 national demand for electricity is estimated to increase by 12 per cent, or 27 GWh, with water demand increasing accordingly (ACIL Tasman, 2008). New capacity investment will depend partly on carbon emission permit prices and partly on progress in meeting renewable energy targets and emerging load patterns.
4.4.3 Climate impacts on electricity productionThe electricity industry is affected by changes in climate, particularly drought (Box 4). In regions where water resources are constrained, existing power stations have come under pressure to reduce their water use or draw on other options such as treated recycled water, and have been affected by restrictions on trading and extraction of water resources (Smart and Aspinall, 2009). Even in under-allocated catchments, power stations must compete with urban and industrial users. Regions in Queensland, NSW and Victoria where future electricity demand will increase also correspond to constraints in water access, either through over-allocation, such as in the Murray–Darling Basin, increasing demands on catchments such as southeast Queensland, or because of low inflows.
The Australian Energy Market Operator (AEMO) is required to provide regular updates on the impact of current and forecast droughts on the generation capacity in the National Electricity Market (NEM). The first Energy Adequacy Assessment Projection report was published in 2010. Rainfall scenarios are considered for low rainfall, 10-year average and 50-year average historical conditions; climate change and potential increase in climate variability are not considered (AEMO, 2011).
Options for electricity production in a water-constrained future include increasing water efficiency, recycling wastewater, hybrid or dry cooling (Section 4.4.1), purifying recycled water, saline water cooling, desalination and accessing regional supplies now used for other purposes. For example, during the 2007 drought Delta Electricity optimised available water use by transferring production to seawater cooled power stations, securing additional mine water supplies and installing reverse osmosis desalination plants. The installation of reverse osmosis plants at Wallerawang and Mt Piper allows repeatedly recycled
SUSTAINABLE WATER MANAGEMENTw
ww
.atse.org.au
41The Australian Academy of Technological Sciences and Engineering (ATSE)
water to be treated in order to reduce its salinity, thus lowering demand on “external” sources. Delta Electricity is also investigating other potential water sources, including harvesting mine water (Delta Electricity, 2007). A systems analysis of the impact of climate and water on the resilience of the Australian National Electricity Market is given by Newell et al., (2011).
4.5 Mining and resourcesMining has become Australia’s largest export sector, contributing over 54 per cent of the country’s export revenues and 10 per cent of Australia’s GDP. This compares to 12 per cent export revenue for manufacturing and eight per cent for agriculture. However, mining consumes less than 10 per cent of the volume of water required for agriculture. Demand for water in the mining industry is expected to increase, fuelled by the resources boom. In Western Australia, for instance, demand from the minerals and energy sectors is likely to reach 420 GL/year by 2015 and up to 940 GL/year by 2020 (CSIRO, 2012). Mining in remote and arid areas draws increasingly heavily on groundwater to supply its needs.
Expansion of coal mining and coal-seam gas extraction presents a major challenge to water policy. Conflicts have arisen with owners of agriculture land in Queensland, WA and NSW. Fears that coal-seam gas exploration and extraction may compromise water supplies have resulted in government decisions to impose ‘no go’ areas and exploration moratoria.
The National Water Commission (NWC) (NWC, 2010b, 2011m) estimates that the Australian coal-seam gas industry could extract 7500 GL of co-produced groundwater over the next 25 years – around 300 GL per year. In contrast, the current total extraction from the Great Artesian Basin is around 540 GL per year. Co-produced water is currently excluded from allocation limitations under the NWI. The NWC (2001f ) has developed a mining risk framework and tools to assess the cumulative effects of mining on groundwater resources but this framework does not yet include coal-seam gas.
NSW coal-seam gas (CSG) explorers now require a water licence to extract over 3 ML/year from underground sources. Agricultural and environmental interest groups are increasing pressures to restrict CSG exploration in agricultural areas until the hydrological impacts are better understood. Similar issues are expected with the shale gas industry, potentially also a major water consumer. The US industry is reported to have greatly overestimated water availability; water shortages and contamination are the two biggest operational and financial threats in this market (MSCI, 2011).
Innovative approaches for large volumes of saline water disposal arising from CSG extraction include tree plantation irrigation and urban or industrial desalination. Special treatment may be required for desalination of hypersaline groundwater in remote areas (Pritchard and Palmer, 2011). There are also concerns on the impacts of large scale long-wall coal mining beneath drinking water catchments and prime agricultural land.
The NWC has reviewed the extent to which state and territory mining and environmental assessment processes are consistent with the NWI objectives and found that there are major uncertainties on the cumulative effects of mining on groundwater (Trensen, 2010).
4.6 Environmental flowsAustralians have long extracted water from rivers, lakes and aquifers to suit their consumptive needs. However, there have been increasing concerns of over-extraction of water and poor land management. The National Land and Water Resources Audit (2002) provided the first national snapshot of river health. The physical and biological condition of more than 14,000 river reaches was assessed; many were found to be seriously degraded. In an attempt to slow degradation and partially restore rivers to health, the 1994 COAG Water Reform Framework contained provisions for “environmental water requirements to maintain the health and viability of river systems and groundwater basins” (Australian
SUSTAINABLE WATER MANAGEMENT
42
ww
w.a
tse.
org.
au
The Australian Academy of Technological Sciences and Engineering (ATSE)
Government, 1994). The Inter Governmental Agreement on the National Water Intiative (NWI, 2004) required governments to identify surface and groundwater systems of high conservation value, manage these to protect and enhance those values, and return all over allocated and over used groundwater and surface water systems to environmentally sustainable levels of extraction.
Growing tensions between consumption and conservation, with governments striving to allocate more water for the environment, has spurred strong debate. The late Professor Peter Cullen, winner of the 2001 Prime Minister’s Prize for Environmentalist of the Year and a passionate advocate for the environment, famously remarked, “Water running to the sea is not wasted water, but drives important fisheries that depend on flood pulses. Floodwater that just ‘disappears’ on a floodplain drives the vegetation and agricultural productivity of the land” (Cullen, 2006).
The Water Act (2007) included provisions to manage and recover environmental water and protect and restore wetlands and biodiversity. The Act established the Commonwealth Environmental Water Holder to manage water entitlements acquired by the Commonwealth. This body seeks to protect or restore environmental assets where the Commonwealth holds water so as to give effect to relevant international agreements such as the Ramsar Convention and bilateral agreements relating to the conservation of migratory birds, such as those formed with the Government of Japan in 1974, and the People’s Republic of China in 1986. The Commonwealth Environmental Water Holder is required to develop a Basin Environmental watering plan, which will establish the principles under which State environmental watering plans must comply. Some States and territories already have environmental water management plans for sharing water between consumption and the environment.
Notwithstanding the commitment of governments to allocate an equitable share of water for the environment, experience during the millennial drought (1997 to 2009) showed that, in the face of vocal demand from cities and irrigators, environmental water allocations were often the first to be reduced as priority was given to critical human needs and industry (NWC, 2009).
The natural functions of freshwater water ecosystems maintain water quality, support biodiversity, regulate flow rates and recharge aquifers. These ecosystems are transformed through widespread land use urbanisation, industrialisation and engineering schemes like reservoirs, irrigation and inter-basin transfers that maximise human access to water. The benefits of water provision to economic productivity are often accompanied by impairment to ecosystems and biodiversity, with potentially serious and usually unquantified costs (Vörösmarty et al., 2010).
Interventions that reduce threats to freshwater systems, such as protecting drinking water catchments, revegetating riparian zones and limiting land clearing, are usually much more cost-effective than remediation attempts after damage has been done. Severe environmental impacts such as dry-land salinity and subsurface mining, that fractures rocks overlying aquifers, may be irreversible. The success of integrated water management strategies (Section 2.7 and Chapter 8) depends on balancing human resource use and ecosystem protection (UNESCO, 2009).
4.7 Cultural flowsThe concept of ‘cultural flows’ has emerged over the past decade or so; it recognises the spiritual and cultural values placed on water by Indigenous peoples who consider water to be sacred and essential for survival. Water is protected by lore, which provides a system of sustainable management to support cultural values of physical and spiritual health. Aboriginal peoples’ connection with country maintains the connection between land, water and other landscape features (Moggridge, 2010).
SUSTAINABLE WATER MANAGEMENTw
ww
.atse.org.au
43The Australian Academy of Technological Sciences and Engineering (ATSE)
Cultural flow is a modern construct. Indigenous owners have coined the term ‘cultural flows' to speak to policy-makers accustomed to the terminology of environmental flows (Weir, 2010). There are challenges inherent in seeking to reconcile a quantitatively-focused approach to natural resource management, which tends to separate components of the landscape into ‘silos’, with a view of water as an intangible, intricate part of the landscape that holds vast social, cultural and economic importance (eWater CRC, 2011a).
Various definitions have been proposed for cultural flows. One such definition is that a cultural flow is one where a sufficient quantity of water, in a suitable pattern, exists to ensure the maintenance of Aboriginal cultural practices and connections with the rivers (Behrendt and Thompson, 2003). The Murray Lower Darling Rivers Indigenous Nations define cultural flows as water entitlements that are legally and beneficially owned by the Indigenous Nations of a sufficient and adequate quantity and quality to improve the spiritual, cultural, environmental, social and economic conditions of those Nations (Atkinson 2009).
The NWI (NWI, 2004) for the first time explicitly recognised Indigenous rights and interests in national water policy in 2004. However, progress has been slow. The second NWI biennial assessment in 2009 found that it was rare for Indigenous water requirements to be explicitly included in water sharing plans and that it appeared to often be implicitly assumed that these objectives can be met by rules-based environmental water provisions (NWC, 2009). Decisions that are made based on narrow ecological or sustainability grounds will have different priorities, assumptions, goals, and knowledge systems; they do not account for ancestral beings, cultural living, or questions of whose country benefits from flows and who misses out (Duff, 2011).
There is a significant lack of data and evidence to demonstrate the economic, social and environmental benefits of a cultural flow. Further research is required to analyse the concept and compare it with the outcomes of environmental flows. This requires input by Aboriginal people on when and where water is to be delivered, compared to environmental water where minimal Aboriginal traditional knowledge has been considered. The National Water Commission has established an advisory body, First People’s Water Engagement Council, to better incorporate Indigenous views and interests in water planning at the national level.
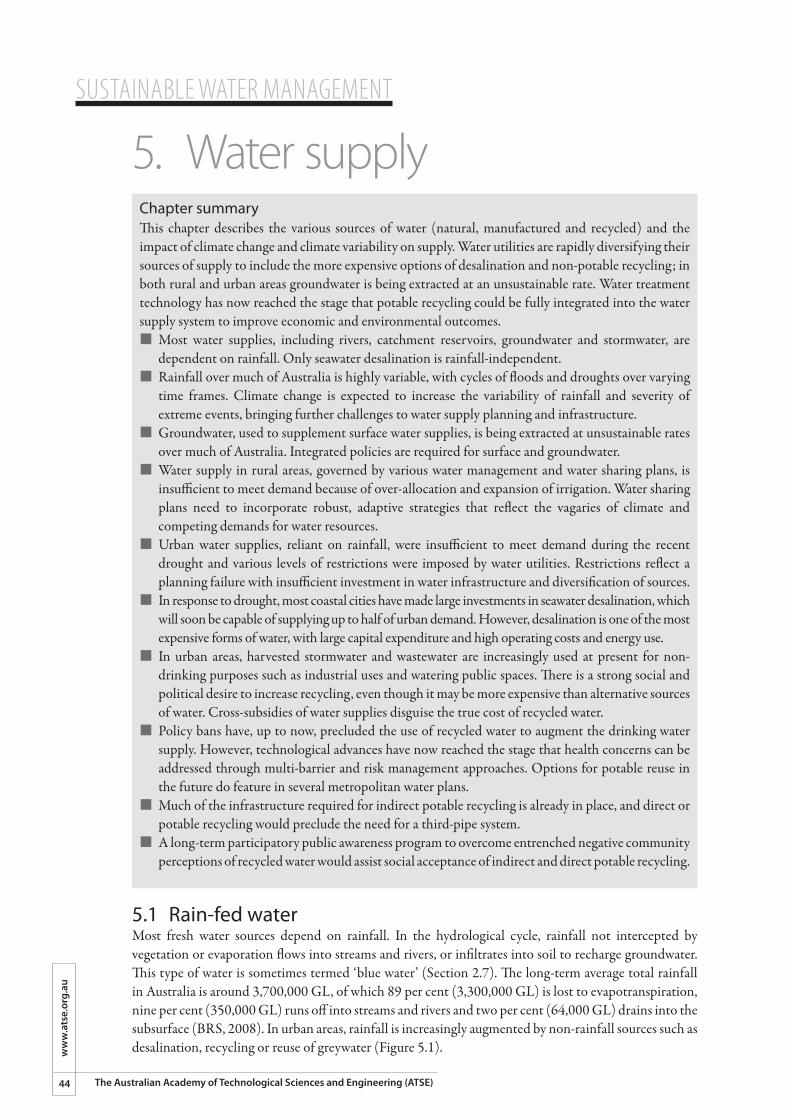
SUSTAINABLE WATER MANAGEMENT
44
ww
w.a
tse.
org.
au
The Australian Academy of Technological Sciences and Engineering (ATSE)
5. Water supply
5.1 Rain-fed waterMost fresh water sources depend on rainfall. In the hydrological cycle, rainfall not intercepted by vegetation or evaporation flows into streams and rivers, or infiltrates into soil to recharge groundwater. This type of water is sometimes termed ‘blue water’ (Section 2.7). The long-term average total rainfall in Australia is around 3,700,000 GL, of which 89 per cent (3,300,000 GL) is lost to evapotranspiration, nine per cent (350,000 GL) runs off into streams and rivers and two per cent (64,000 GL) drains into the subsurface (BRS, 2008). In urban areas, rainfall is increasingly augmented by non-rainfall sources such as desalination, recycling or reuse of greywater (Figure 5.1).
Chapter summaryThis chapter describes the various sources of water (natural, manufactured and recycled) and the impact of climate change and climate variability on supply. Water utilities are rapidly diversifying their sources of supply to include the more expensive options of desalination and non-potable recycling; in both rural and urban areas groundwater is being extracted at an unsustainable rate. Water treatment technology has now reached the stage that potable recycling could be fully integrated into the water supply system to improve economic and environmental outcomes.¢ �Most water supplies, including rivers, catchment reservoirs, groundwater and stormwater, are
dependent on rainfall. Only seawater desalination is rainfall-independent.¢ �Rainfall over much of Australia is highly variable, with cycles of floods and droughts over varying
time frames. Climate change is expected to increase the variability of rainfall and severity of extreme events, bringing further challenges to water supply planning and infrastructure.
¢ �Groundwater, used to supplement surface water supplies, is being extracted at unsustainable rates over much of Australia. Integrated policies are required for surface and groundwater.
¢ �Water supply in rural areas, governed by various water management and water sharing plans, is insufficient to meet demand because of over-allocation and expansion of irrigation. Water sharing plans need to incorporate robust, adaptive strategies that reflect the vagaries of climate and competing demands for water resources.
¢ �Urban water supplies, reliant on rainfall, were insufficient to meet demand during the recent drought and various levels of restrictions were imposed by water utilities. Restrictions reflect a planning failure with insufficient investment in water infrastructure and diversification of sources.
¢ �In response to drought, most coastal cities have made large investments in seawater desalination, which will soon be capable of supplying up to half of urban demand. However, desalination is one of the most expensive forms of water, with large capital expenditure and high operating costs and energy use.
¢ �In urban areas, harvested stormwater and wastewater are increasingly used at present for non-drinking purposes such as industrial uses and watering public spaces. There is a strong social and political desire to increase recycling, even though it may be more expensive than alternative sources of water. Cross-subsidies of water supplies disguise the true cost of recycled water.
¢ �Policy bans have, up to now, precluded the use of recycled water to augment the drinking water supply. However, technological advances have now reached the stage that health concerns can be addressed through multi-barrier and risk management approaches. Options for potable reuse in the future do feature in several metropolitan water plans.
¢ �Much of the infrastructure required for indirect potable recycling is already in place, and direct or potable recycling would preclude the need for a third-pipe system.
¢ �A long-term participatory public awareness program to overcome entrenched negative community perceptions of recycled water would assist social acceptance of indirect and direct potable recycling.
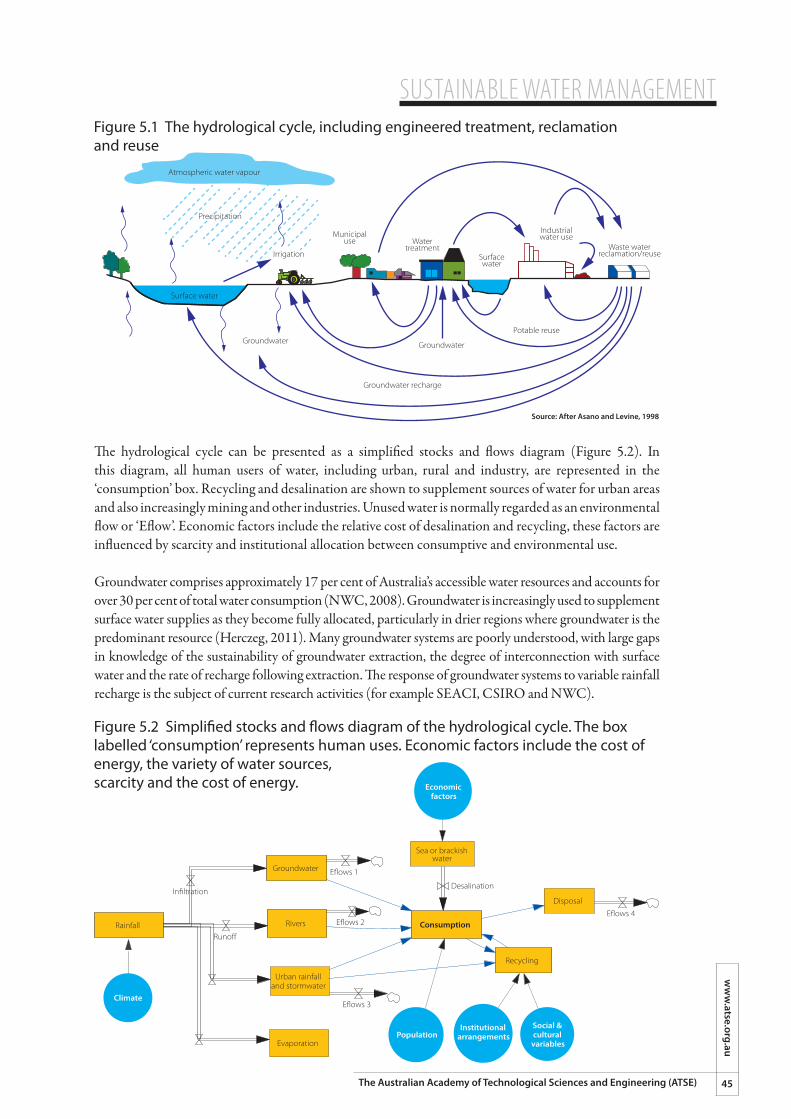
SUSTAINABLE WATER MANAGEMENTw
ww
.atse.org.au
45The Australian Academy of Technological Sciences and Engineering (ATSE)
The hydrological cycle can be presented as a simplified stocks and flows diagram (Figure 5.2). In this diagram, all human users of water, including urban, rural and industry, are represented in the ‘consumption’ box. Recycling and desalination are shown to supplement sources of water for urban areas and also increasingly mining and other industries. Unused water is normally regarded as an environmental flow or ‘Eflow’. Economic factors include the relative cost of desalination and recycling, these factors are influenced by scarcity and institutional allocation between consumptive and environmental use.
Groundwater comprises approximately 17 per cent of Australia’s accessible water resources and accounts for over 30 per cent of total water consumption (NWC, 2008). Groundwater is increasingly used to supplement surface water supplies as they become fully allocated, particularly in drier regions where groundwater is the predominant resource (Herczeg, 2011). Many groundwater systems are poorly understood, with large gaps in knowledge of the sustainability of groundwater extraction, the degree of interconnection with surface water and the rate of recharge following extraction. The response of groundwater systems to variable rainfall recharge is the subject of current research activities (for example SEACI, CSIRO and NWC).
Figure 5.1 The hydrological cycle, including engineered treatment, reclamation and reuse Economic
Atmospheric water vapour
Irrigation
Municipaluse Water
treatmentSurfacewater
Surface water
Industrialwater use
Waste waterreclamation/reuse
Potable reuse
GroundwaterGroundwater
Groundwater recharge
variables
Source: After Asano and Levine, 1998
Precipitation
Figure 5.2 Simpli�ed stocks and �ows diagram of the hydrological cycle. The box labelled ‘consumption’ represents human uses. Economic factors include the cost of energy, the variety of water sources, scarcity and the cost of energy.
Rainfall Rivers
Recycling
Consumption
Sea or brackishwater
Groundwater
Economicfactors
Urban rainfalland stormwater
Disposal
Runo�
In�ltration
Evaporation
E�ows 4
Desalination
E�ows 2
E�ows 3
E�ows 1
Social &cultural
variablesPopulation
Institutionalarrangements
Climate
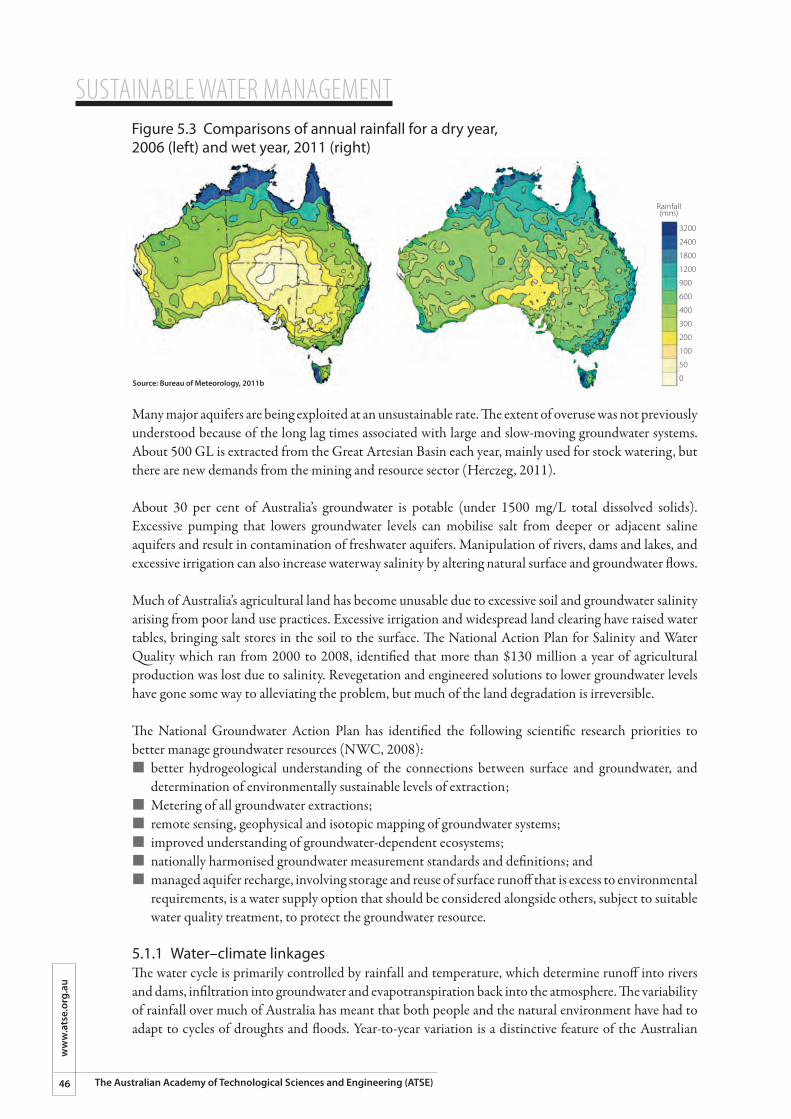
SUSTAINABLE WATER MANAGEMENT
46
ww
w.a
tse.
org.
au
The Australian Academy of Technological Sciences and Engineering (ATSE)
Many major aquifers are being exploited at an unsustainable rate. The extent of overuse was not previously understood because of the long lag times associated with large and slow-moving groundwater systems. About 500 GL is extracted from the Great Artesian Basin each year, mainly used for stock watering, but there are new demands from the mining and resource sector (Herczeg, 2011).
About 30 per cent of Australia’s groundwater is potable (under 1500 mg/L total dissolved solids). Excessive pumping that lowers groundwater levels can mobilise salt from deeper or adjacent saline aquifers and result in contamination of freshwater aquifers. Manipulation of rivers, dams and lakes, and excessive irrigation can also increase waterway salinity by altering natural surface and groundwater flows.
Much of Australia’s agricultural land has become unusable due to excessive soil and groundwater salinity arising from poor land use practices. Excessive irrigation and widespread land clearing have raised water tables, bringing salt stores in the soil to the surface. The National Action Plan for Salinity and Water Quality which ran from 2000 to 2008, identified that more than $130 million a year of agricultural production was lost due to salinity. Revegetation and engineered solutions to lower groundwater levels have gone some way to alleviating the problem, but much of the land degradation is irreversible.
The National Groundwater Action Plan has identified the following scientific research priorities to better manage groundwater resources (NWC, 2008):¢ �better hydrogeological understanding of the connections between surface and groundwater, and
determination of environmentally sustainable levels of extraction;¢ �Metering of all groundwater extractions;¢ �remote sensing, geophysical and isotopic mapping of groundwater systems;¢ �improved understanding of groundwater-dependent ecosystems;¢ �nationally harmonised groundwater measurement standards and definitions; and¢ �managed aquifer recharge, involving storage and reuse of surface runoff that is excess to environmental
requirements, is a water supply option that should be considered alongside others, subject to suitable water quality treatment, to protect the groundwater resource.
5.1.1 Water–climate linkagesThe water cycle is primarily controlled by rainfall and temperature, which determine runoff into rivers and dams, infiltration into groundwater and evapotranspiration back into the atmosphere. The variability of rainfall over much of Australia has meant that both people and the natural environment have had to adapt to cycles of droughts and floods. Year-to-year variation is a distinctive feature of the Australian
Figure 5.3 Comparisons of annual rainfall for a dry year, 2006 (left) and wet year, 2011 (right) Economic
factors
variables
Rainfall(mm)
3200
2400
1800
1200
900
600
400
300
200
100
50
0Source: Bureau of Meteorology, 2011b
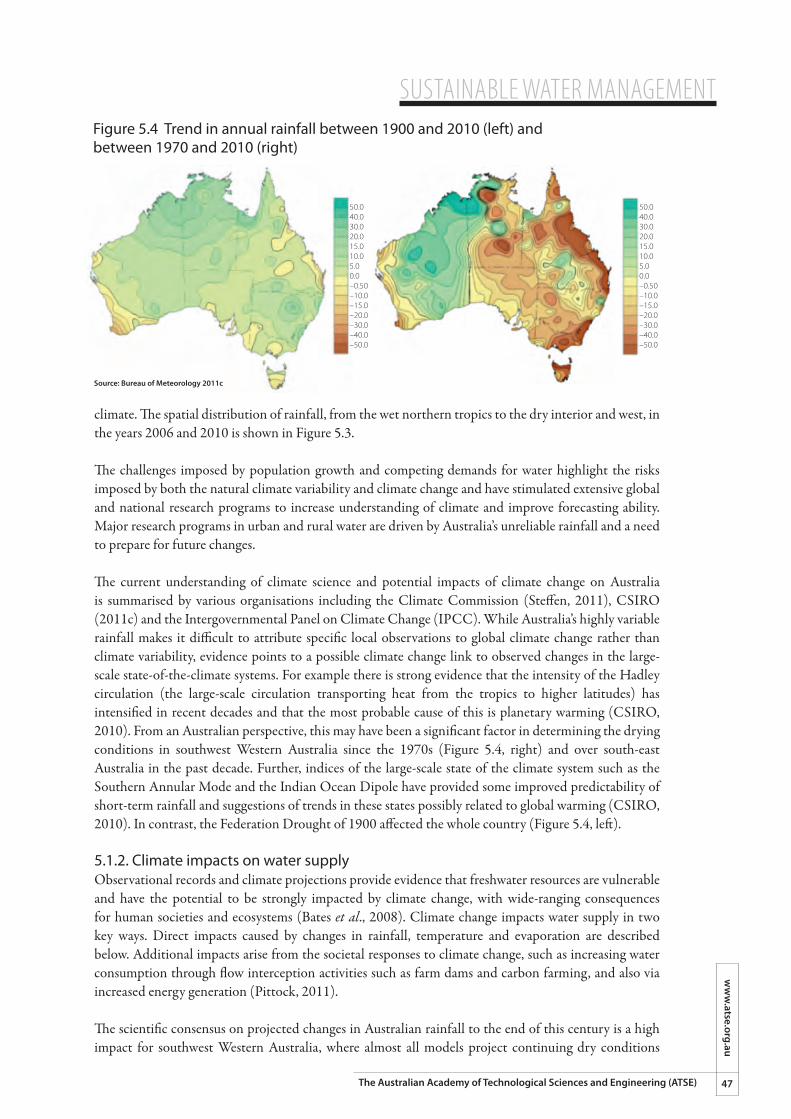
SUSTAINABLE WATER MANAGEMENTw
ww
.atse.org.au
47The Australian Academy of Technological Sciences and Engineering (ATSE)
climate. The spatial distribution of rainfall, from the wet northern tropics to the dry interior and west, in the years 2006 and 2010 is shown in Figure 5.3.
The challenges imposed by population growth and competing demands for water highlight the risks imposed by both the natural climate variability and climate change and have stimulated extensive global and national research programs to increase understanding of climate and improve forecasting ability. Major research programs in urban and rural water are driven by Australia’s unreliable rainfall and a need to prepare for future changes.
The current understanding of climate science and potential impacts of climate change on Australia is summarised by various organisations including the Climate Commission (Steffen, 2011), CSIRO (2011c) and the Intergovernmental Panel on Climate Change (IPCC). While Australia’s highly variable rainfall makes it difficult to attribute specific local observations to global climate change rather than climate variability, evidence points to a possible climate change link to observed changes in the large-scale state-of-the-climate systems. For example there is strong evidence that the intensity of the Hadley circulation (the large-scale circulation transporting heat from the tropics to higher latitudes) has intensified in recent decades and that the most probable cause of this is planetary warming (CSIRO, 2010). From an Australian perspective, this may have been a significant factor in determining the drying conditions in southwest Western Australia since the 1970s (Figure 5.4, right) and over south-east Australia in the past decade. Further, indices of the large-scale state of the climate system such as the Southern Annular Mode and the Indian Ocean Dipole have provided some improved predictability of short-term rainfall and suggestions of trends in these states possibly related to global warming (CSIRO, 2010). In contrast, the Federation Drought of 1900 affected the whole country (Figure 5.4, left).
5.1.2. Climate impacts on water supplyObservational records and climate projections provide evidence that freshwater resources are vulnerable and have the potential to be strongly impacted by climate change, with wide-ranging consequences for human societies and ecosystems (Bates et al., 2008). Climate change impacts water supply in two key ways. Direct impacts caused by changes in rainfall, temperature and evaporation are described below. Additional impacts arise from the societal responses to climate change, such as increasing water consumption through flow interception activities such as farm dams and carbon farming, and also via increased energy generation (Pittock, 2011).
The scientific consensus on projected changes in Australian rainfall to the end of this century is a high impact for southwest Western Australia, where almost all models project continuing dry conditions
Figure 5.4 Trend in annual rainfall between 1900 and 2010 (left) and between 1970 and 2010 (right) Economic
factors
variables
50.040.030.020.015.010.05.00.0–0.50–10.0–15.0–20.0–30.0–40.0–50.0
50.040.030.020.015.010.05.00.0–0.50–10.0–15.0–20.0–30.0–40.0–50.0
Source: Bureau of Meteorology 2011c
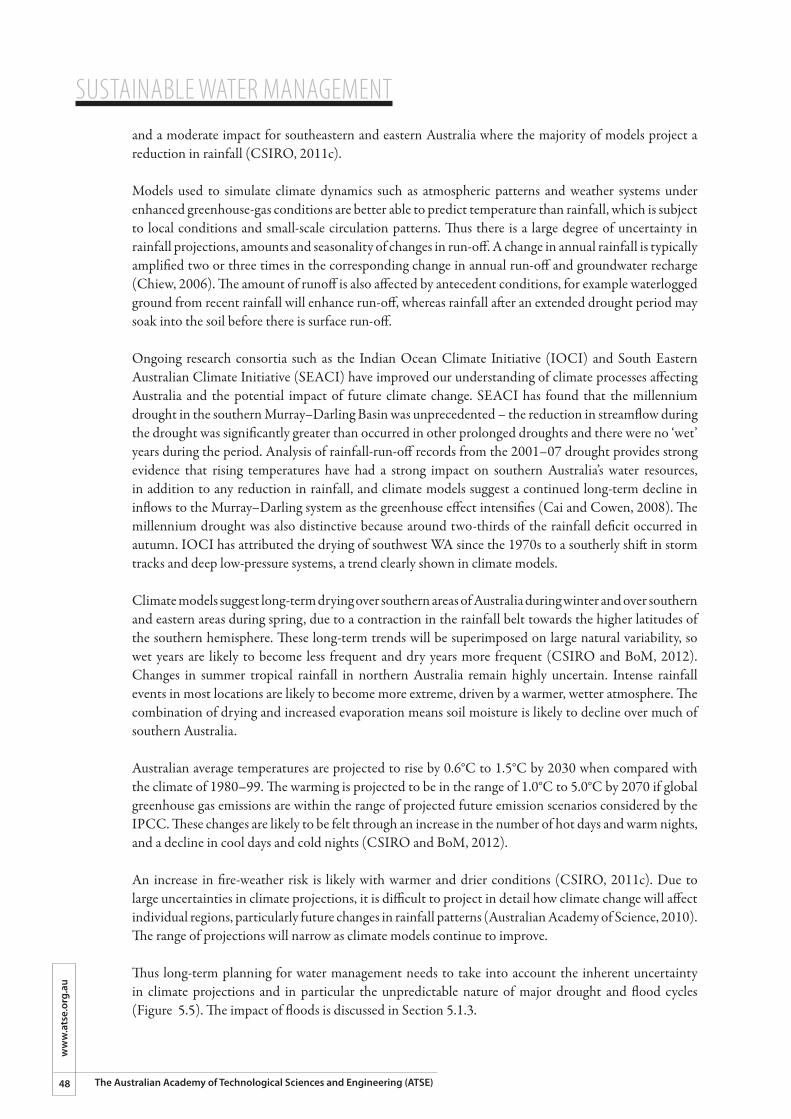
SUSTAINABLE WATER MANAGEMENT
48
ww
w.a
tse.
org.
au
The Australian Academy of Technological Sciences and Engineering (ATSE)
and a moderate impact for southeastern and eastern Australia where the majority of models project a reduction in rainfall (CSIRO, 2011c).
Models used to simulate climate dynamics such as atmospheric patterns and weather systems under enhanced greenhouse-gas conditions are better able to predict temperature than rainfall, which is subject to local conditions and small-scale circulation patterns. Thus there is a large degree of uncertainty in rainfall projections, amounts and seasonality of changes in run-off. A change in annual rainfall is typically amplified two or three times in the corresponding change in annual run-off and groundwater recharge (Chiew, 2006). The amount of runoff is also affected by antecedent conditions, for example waterlogged ground from recent rainfall will enhance run-off, whereas rainfall after an extended drought period may soak into the soil before there is surface run-off.
Ongoing research consortia such as the Indian Ocean Climate Initiative (IOCI) and South Eastern Australian Climate Initiative (SEACI) have improved our understanding of climate processes affecting Australia and the potential impact of future climate change. SEACI has found that the millennium drought in the southern Murray–Darling Basin was unprecedented – the reduction in streamflow during the drought was significantly greater than occurred in other prolonged droughts and there were no ‘wet’ years during the period. Analysis of rainfall-run-off records from the 2001–07 drought provides strong evidence that rising temperatures have had a strong impact on southern Australia’s water resources, in addition to any reduction in rainfall, and climate models suggest a continued long-term decline in inflows to the Murray–Darling system as the greenhouse effect intensifies (Cai and Cowen, 2008). The millennium drought was also distinctive because around two-thirds of the rainfall deficit occurred in autumn. IOCI has attributed the drying of southwest WA since the 1970s to a southerly shift in storm tracks and deep low-pressure systems, a trend clearly shown in climate models.
Climate models suggest long-term drying over southern areas of Australia during winter and over southern and eastern areas during spring, due to a contraction in the rainfall belt towards the higher latitudes of the southern hemisphere. These long-term trends will be superimposed on large natural variability, so wet years are likely to become less frequent and dry years more frequent (CSIRO and BoM, 2012). Changes in summer tropical rainfall in northern Australia remain highly uncertain. Intense rainfall events in most locations are likely to become more extreme, driven by a warmer, wetter atmosphere. The combination of drying and increased evaporation means soil moisture is likely to decline over much of southern Australia.
Australian average temperatures are projected to rise by 0.6°C to 1.5°C by 2030 when compared with the climate of 1980–99. The warming is projected to be in the range of 1.0°C to 5.0°C by 2070 if global greenhouse gas emissions are within the range of projected future emission scenarios considered by the IPCC. These changes are likely to be felt through an increase in the number of hot days and warm nights, and a decline in cool days and cold nights (CSIRO and BoM, 2012).
An increase in fire-weather risk is likely with warmer and drier conditions (CSIRO, 2011c). Due to large uncertainties in climate projections, it is difficult to project in detail how climate change will affect individual regions, particularly future changes in rainfall patterns (Australian Academy of Science, 2010). The range of projections will narrow as climate models continue to improve.
Thus long-term planning for water management needs to take into account the inherent uncertainty in climate projections and in particular the unpredictable nature of major drought and flood cycles (Figure 5.5). The impact of floods is discussed in Section 5.1.3.
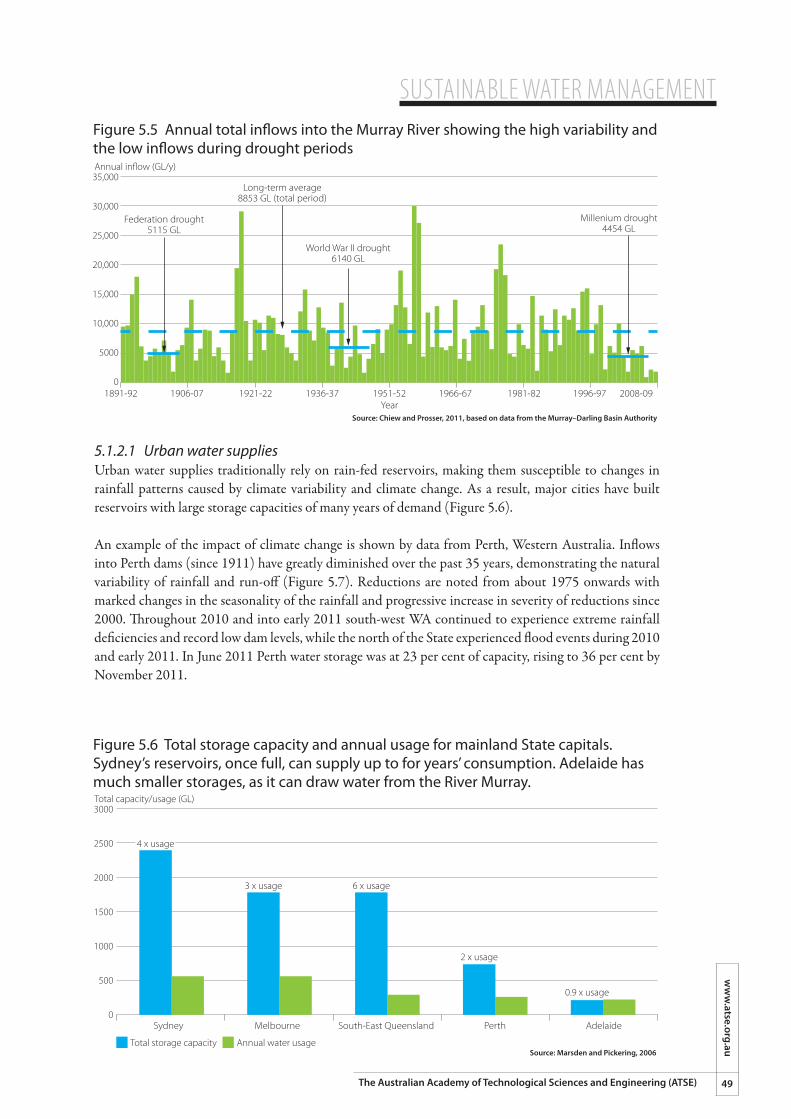
SUSTAINABLE WATER MANAGEMENTw
ww
.atse.org.au
49The Australian Academy of Technological Sciences and Engineering (ATSE)
5.1.2.1 Urban water suppliesUrban water supplies traditionally rely on rain-fed reservoirs, making them susceptible to changes in rainfall patterns caused by climate variability and climate change. As a result, major cities have built reservoirs with large storage capacities of many years of demand (Figure 5.6).
An example of the impact of climate change is shown by data from Perth, Western Australia. Inflows into Perth dams (since 1911) have greatly diminished over the past 35 years, demonstrating the natural variability of rainfall and run-off (Figure 5.7). Reductions are noted from about 1975 onwards with marked changes in the seasonality of the rainfall and progressive increase in severity of reductions since 2000. Throughout 2010 and into early 2011 south-west WA continued to experience extreme rainfall deficiencies and record low dam levels, while the north of the State experienced flood events during 2010 and early 2011. In June 2011 Perth water storage was at 23 per cent of capacity, rising to 36 per cent by November 2011.
Figure 5.5 Annual total in�ows into the Murray River showing the high variability and the low in�ows during drought periods
35,000
30,000
25,000
20,000
15,000
10,000
5000
0
Annual in�ow (GL/y)
1891-92 1906-07 1921-22 1936-37 1951-52Year
1966-67 1981-82 1996-97 2008-09
Source: Chiew and Prosser, 2011, based on data from the Murray–Darling Basin Authority
Federation drought5115 GL
Long-term average8853 GL (total period)
World War II drought6140 GL
Millenium drought4454 GL
Figure 5.6 Total storage capacity and annual usage for mainland State capitals. Sydney’s reservoirs, once full, can supply up to for years’ consumption. Adelaide has much smaller storages, as it can draw water from the River Murray.
3000
2500
2000
1500
1000
500
0
Total capacity/usage (GL)
Total storage capacity Annual water usage
Sydney Melbourne South-East Queensland Perth Adelaide
3 x usage 6 x usage
2 x usage
0.9 x usage
4 x usage
Source: Marsden and Pickering, 2006
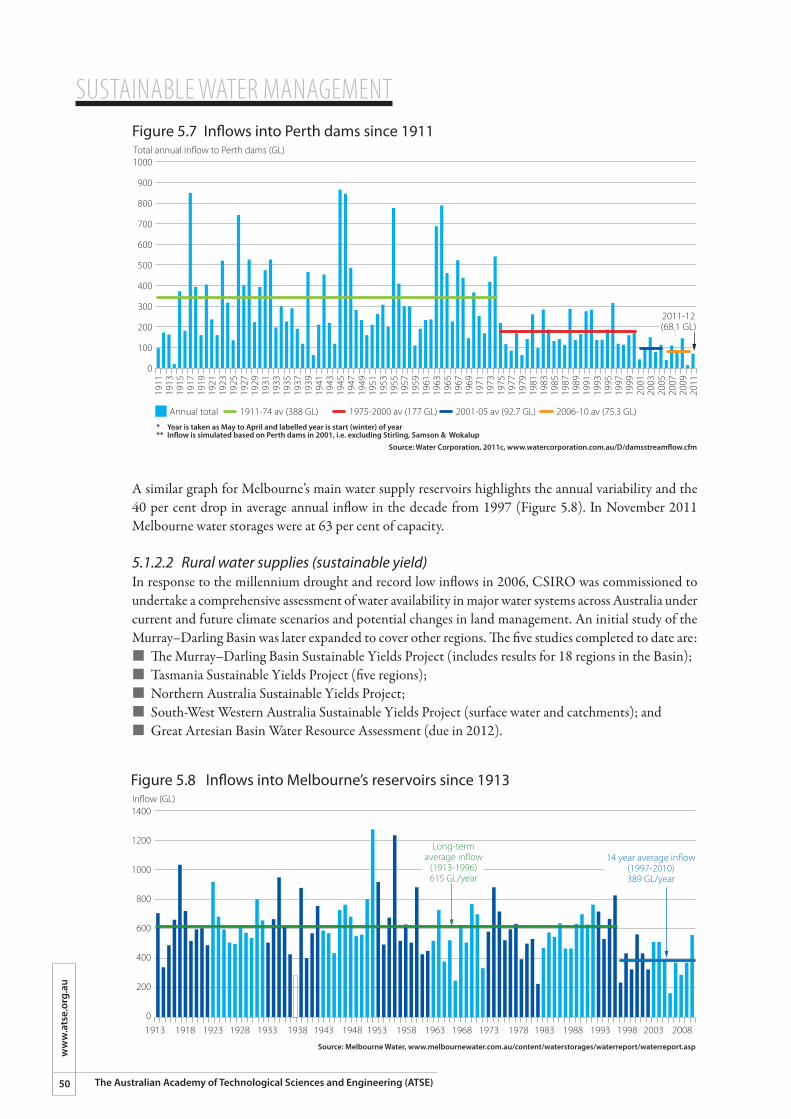
SUSTAINABLE WATER MANAGEMENT
50
ww
w.a
tse.
org.
au
The Australian Academy of Technological Sciences and Engineering (ATSE)
A similar graph for Melbourne’s main water supply reservoirs highlights the annual variability and the 40 per cent drop in average annual inflow in the decade from 1997 (Figure 5.8). In November 2011 Melbourne water storages were at 63 per cent of capacity.
5.1.2.2 Rural water supplies (sustainable yield)In response to the millennium drought and record low inflows in 2006, CSIRO was commissioned to undertake a comprehensive assessment of water availability in major water systems across Australia under current and future climate scenarios and potential changes in land management. An initial study of the Murray–Darling Basin was later expanded to cover other regions. The five studies completed to date are:¢ �The Murray–Darling Basin Sustainable Yields Project (includes results for 18 regions in the Basin);¢ �Tasmania Sustainable Yields Project (five regions);¢ �Northern Australia Sustainable Yields Project;¢ �South-West Western Australia Sustainable Yields Project (surface water and catchments); and¢ �Great Artesian Basin Water Resource Assessment (due in 2012).
Figure 5.7 In�ows into Perth dams since 1911
1000
900
800
700
600
500
400
300
200
100
0
Total annual in�ow to Perth dams (GL)
Annual total 1911-74 av (388 GL)
1911
1913
1915
1917
1919
1921
1923
1925
1927
1929
1931
1933
1935
1937
1939
1941
1943
1945
1947
1949
1951
1953
1955
1957
1959
1961
1963
1965
1967
1969
1971
1973
1975
1977
1979
1981
1983
1985
1987
1989
1991
1993
1995
1997
1999
2001
2003
2005
2007
2009
2011
2011-12(68.1 GL)
* Year is taken as May to April and labelled year is start (winter) of year** In�ow is simulated based on Perth dams in 2001, i.e. excluding Stirling, Samson & Wokalup
Source: Water Corporation, 2011c, www.watercorporation.com.au/D/damsstream�ow.cfm
1975-2000 av (177 GL) 2001-05 av (92.7 GL) 2006-10 av (75.3 GL)
Figure 5.8 In�ows into Melbourne’s reservoirs since 1913
1400
1200
1000
800
600
400
200
0
In�ow (GL)
1913 1918 1923 1928 1933 1938 1943 1948 1953 1958 1963 1968 1973 1978 1983 1988 1993 1998 2003 2008
Source: Melbourne Water, www.melbournewater.com.au/content/waterstorages/waterreport/waterreport.asp
Long-termaverage in�ow
(1913-1996)615 GL/year
14 year average in�ow(1997-2010)389 GL/year
SUSTAINABLE WATER MANAGEMENTw
ww
.atse.org.au
51The Australian Academy of Technological Sciences and Engineering (ATSE)
Four climate scenarios are used in the sustainable yield assessments:1. Historical climate (1930 to 2007) and current development;2. Recent climate (1996 to 2007) and current development;3. Future climate (~2030) and current development; and4. Future climate (~2030) and future development.
It is important to note that all climate projections have large uncertainties which, although generally well understood by climate scientists, are often overlooked by those communicating potential impacts of climate change to the community and policy makers. The projections serve a useful role in moving outside the ‘business as usual’ mindset and helping to build adaptation into long-term planning, though rainfall patterns in the ‘future climate’ scenarios are likely to lack accuracy in scale and distribution. Adaptation policies should be based on risk and need to be robust for a range of outcomes, not just the ‘most likely’. Government planning should include managing for high risk, catastrophic events.
5.1.3 Extreme events and climate changeAustralia’s climate is characterised by long periods of drought interspersed with extensive flooding. These erratic changes have played an important role in shaping the Australian landscape and society’s adaptation response. The widespread floods in the eastern states from December 2010 to January 2011 caused widespread damage and prompted a government enquiry into whether the floods could have been predicted and flooding mitigated by different operating procedures. An overview of the cause of floods and planning to improve preparedness was prepared for the Queensland Government (2011), in response to the devastating floods in Queensland, WA, Victoria and NSW in December 2010 and January 2011.
Dams play important roles in flood mitigation and regulating rivers for irrigation and drinking water storage. Some dams, such as Warragamba in Sydney, were built primarily for water supply, while others, such as the Wivenhoe in Brisbane, are managed to store water supplies and to retain spare capacity to absorb and mitigate the impact of floodwaters on downstream communities. These dams may well be successful in controlling small to medium floods, however they may engender a false sense of security in the community and result in expanded floodplain development increasing the likelihood of damage when a large flood occurs (ATSE, 2011b).
These two functions may appear in conflict but are mutually consistent if the level of water to be stored is determined well in advance with long-term weather forecasts, combined with fine-tuning based on short-term weather. Better seasonal forecasts of inflows offer the prospect of increasing the flood storage volume in dams when the forecasts predict a high probability of flooding (Chiew and Prosser, 2011).
The floods across eastern Australia in 2010 and early 2011 were the consequence of two successive strong La Niña events (BoM Annual Australian Climate Statement 2011). Even though individual flood events cannot be attributed to climate change, from a risk perspective it would be prudent to factor in a climate change-induced increase in intense rainfall events in urban and regional planning, the design of flood mitigation works, and emergency management procedures (Steffen, 2011).
Increasing global temperatures are likely to bring large changes in the frequency and intensity of extreme events (IPCC; Allan and Soden, 2008). A 1°C increase in temperature for Australia by 2030 could result in up to 20 per cent more months of drought, 25 per cent more days of very high or extreme fire danger and increases in storm surges and severe weather events over parts of the country (Bates et al., 2008). Since 1950 Australian has experienced a decrease in the number of low temperature extremes and an increase in the number of high temperature extremes (BoM). The global frequency of tropical cyclones is projected either to stay the same or decrease under projected climate change. However, a modest increase in intensity of the most intense tropical cyclone systems and associated heavy rainfall is projected as
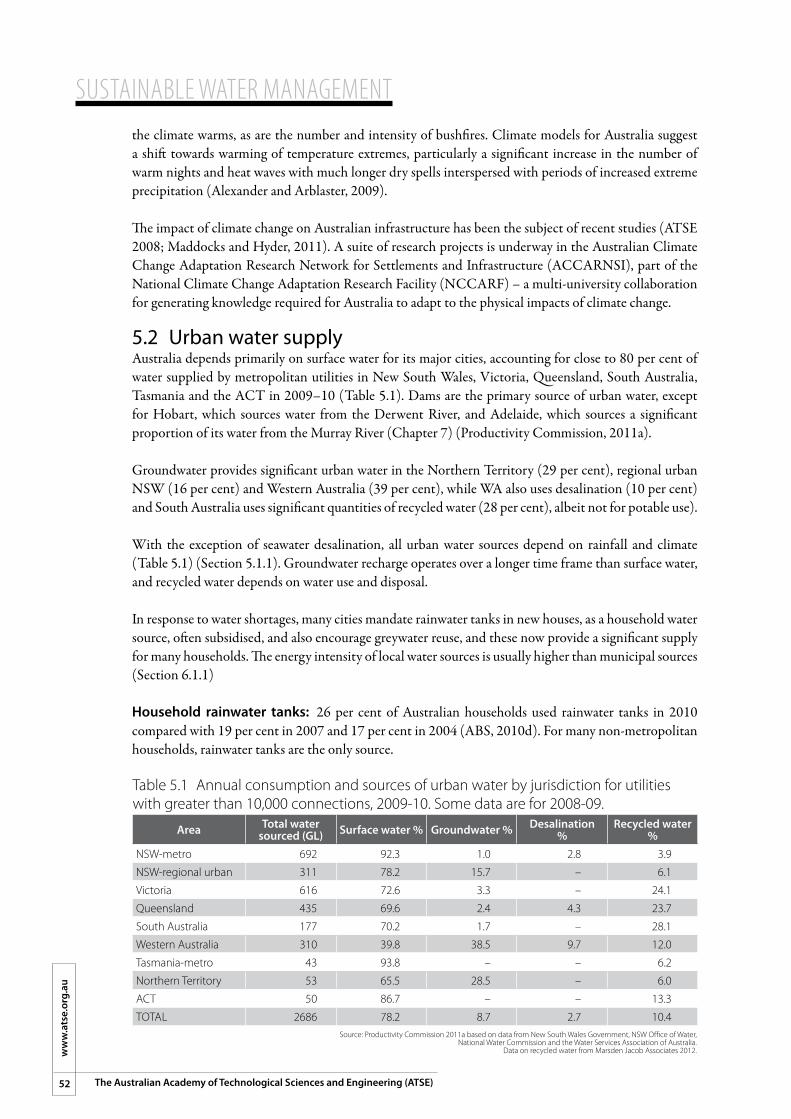
SUSTAINABLE WATER MANAGEMENT
52
ww
w.a
tse.
org.
au
The Australian Academy of Technological Sciences and Engineering (ATSE)
the climate warms, as are the number and intensity of bushfires. Climate models for Australia suggest a shift towards warming of temperature extremes, particularly a significant increase in the number of warm nights and heat waves with much longer dry spells interspersed with periods of increased extreme precipitation (Alexander and Arblaster, 2009).
The impact of climate change on Australian infrastructure has been the subject of recent studies (ATSE 2008; Maddocks and Hyder, 2011). A suite of research projects is underway in the Australian Climate Change Adaptation Research Network for Settlements and Infrastructure (ACCARNSI), part of the National Climate Change Adaptation Research Facility (NCCARF) – a multi-university collaboration for generating knowledge required for Australia to adapt to the physical impacts of climate change.
5.2 Urban water supplyAustralia depends primarily on surface water for its major cities, accounting for close to 80 per cent of water supplied by metropolitan utilities in New South Wales, Victoria, Queensland, South Australia, Tasmania and the ACT in 2009–10 (Table 5.1). Dams are the primary source of urban water, except for Hobart, which sources water from the Derwent River, and Adelaide, which sources a significant proportion of its water from the Murray River (Chapter 7) (Productivity Commission, 2011a). Groundwater provides significant urban water in the Northern Territory (29 per cent), regional urban NSW (16 per cent) and Western Australia (39 per cent), while WA also uses desalination (10 per cent) and South Australia uses significant quantities of recycled water (28 per cent), albeit not for potable use).
With the exception of seawater desalination, all urban water sources depend on rainfall and climate (Table 5.1) (Section 5.1.1). Groundwater recharge operates over a longer time frame than surface water, and recycled water depends on water use and disposal.
In response to water shortages, many cities mandate rainwater tanks in new houses, as a household water source, often subsidised, and also encourage greywater reuse, and these now provide a significant supply for many households. The energy intensity of local water sources is usually higher than municipal sources (Section 6.1.1)
Household rainwater tanks: 26 per cent of Australian households used rainwater tanks in 2010 compared with 19 per cent in 2007 and 17 per cent in 2004 (ABS, 2010d). For many non-metropolitan households, rainwater tanks are the only source.
Table 5.1 Annual consumption and sources of urban water by jurisdiction for utilities with greater than 10,000 connections, 2009-10. Some data are for 2008-09.
Area Total water sourced (GL) Surface water % Groundwater % Desalination
%Recycled water
%NSW-metro 692 92.3 1.0 2.8 3.9
NSW-regional urban 311 78.2 15.7 – 6.1
Victoria 616 72.6 3.3 – 24.1
Queensland 435 69.6 2.4 4.3 23.7
South Australia 177 70.2 1.7 – 28.1
Western Australia 310 39.8 38.5 9.7 12.0
Tasmania-metro 43 93.8 – – 6.2
Northern Territory 53 65.5 28.5 – 6.0
ACT 50 86.7 – – 13.3
ToTAl 2686 78.2 8.7 2.7 10.4Source: Productivity Commission 2011a based on data from New South Wales Government, NSW office of Water,
National Water Commission and the Water Services Association of Australia.Data on recycled water from Marsden Jacob Associates 2012.
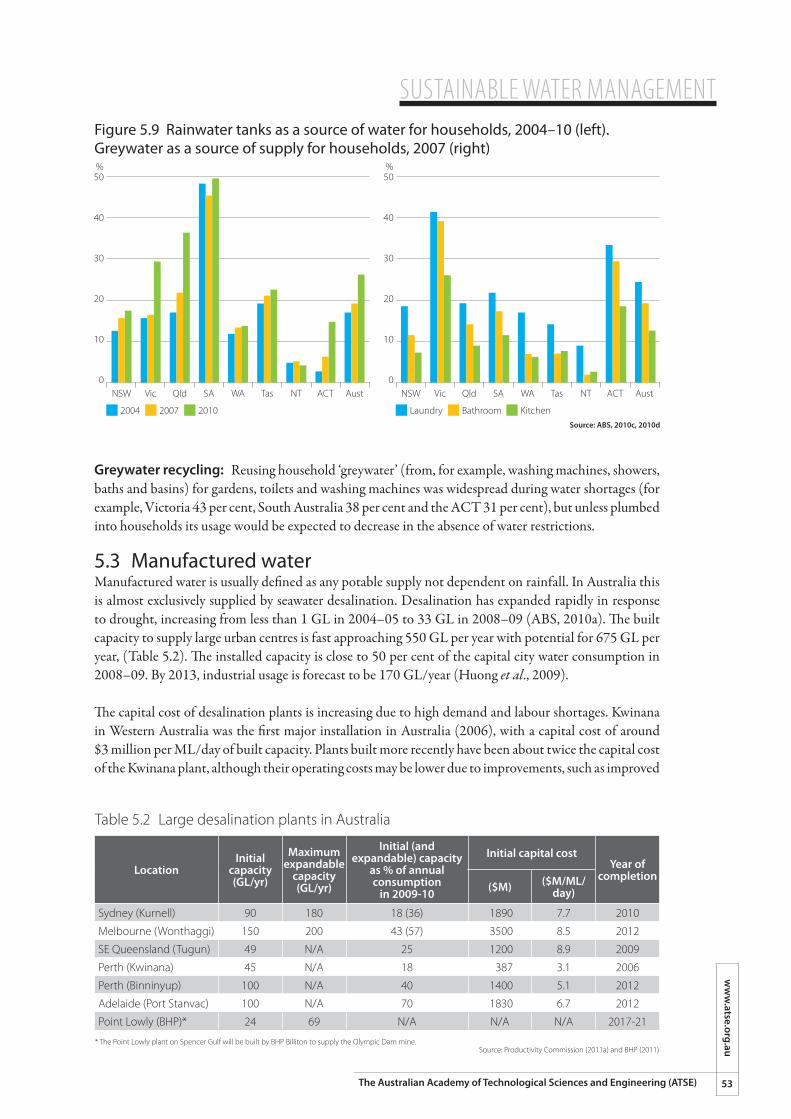
SUSTAINABLE WATER MANAGEMENTw
ww
.atse.org.au
53The Australian Academy of Technological Sciences and Engineering (ATSE)
Greywater recycling: Reusing household ‘greywater’ (from, for example, washing machines, showers, baths and basins) for gardens, toilets and washing machines was widespread during water shortages (for example, Victoria 43 per cent, South Australia 38 per cent and the ACT 31 per cent), but unless plumbed into households its usage would be expected to decrease in the absence of water restrictions.
5.3 Manufactured waterManufactured water is usually defined as any potable supply not dependent on rainfall. In Australia this is almost exclusively supplied by seawater desalination. Desalination has expanded rapidly in response to drought, increasing from less than 1 GL in 2004–05 to 33 GL in 2008–09 (ABS, 2010a). The built capacity to supply large urban centres is fast approaching 550 GL per year with potential for 675 GL per year, (Table 5.2). The installed capacity is close to 50 per cent of the capital city water consumption in 2008–09. By 2013, industrial usage is forecast to be 170 GL/year (Huong et al., 2009).
The capital cost of desalination plants is increasing due to high demand and labour shortages. Kwinana in Western Australia was the first major installation in Australia (2006), with a capital cost of around $3 million per ML/day of built capacity. Plants built more recently have been about twice the capital cost of the Kwinana plant, although their operating costs may be lower due to improvements, such as improved
Figure 5.9 Rainwater tanks as a source of water for households, 2004–10 (left). Greywater as a source of supply for households, 2007 (right)
50
40
30
20
10
0
%
2004 2007
NSW Vic Qld NTTasWASA AustACT
Source: ABS, 2010c, 2010d
2010
50
40
30
20
10
0
%
Laundry Bathroom
NSW Vic Qld NTTasWASA AustACT
Kitchen
Table 5.2 Large desalination plants in Australia
LocationInitial
capacity(GL/yr)
Maximum expandable
capacity(GL/yr)
Initial (and expandable) capacity
as % of annual consumption
in 2009-10
Initial capital costYear of
completion($M) ($M/ML/
day)
Sydney (Kurnell) 90 180 18 (36) 1890 7.7 2010
Melbourne (Wonthaggi) 150 200 43 (57) 3500 8.5 2012
SE Queensland (Tugun) 49 N/A 25 1200 8.9 2009
Perth (Kwinana) 45 N/A 18 387 3.1 2006
Perth (Binninyup) 100 N/A 40 1400 5.1 2012
Adelaide (Port Stanvac) 100 N/A 70 1830 6.7 2012
Point Lowly (BHP)* 24 69 N/A N/A N/A 2017-21
* The Point Lowly plant on Spencer Gulf will be built by BHP Billiton to supply the Olympic Dam mine. Source: Productivity Commission (2011a) and BHP (2011)
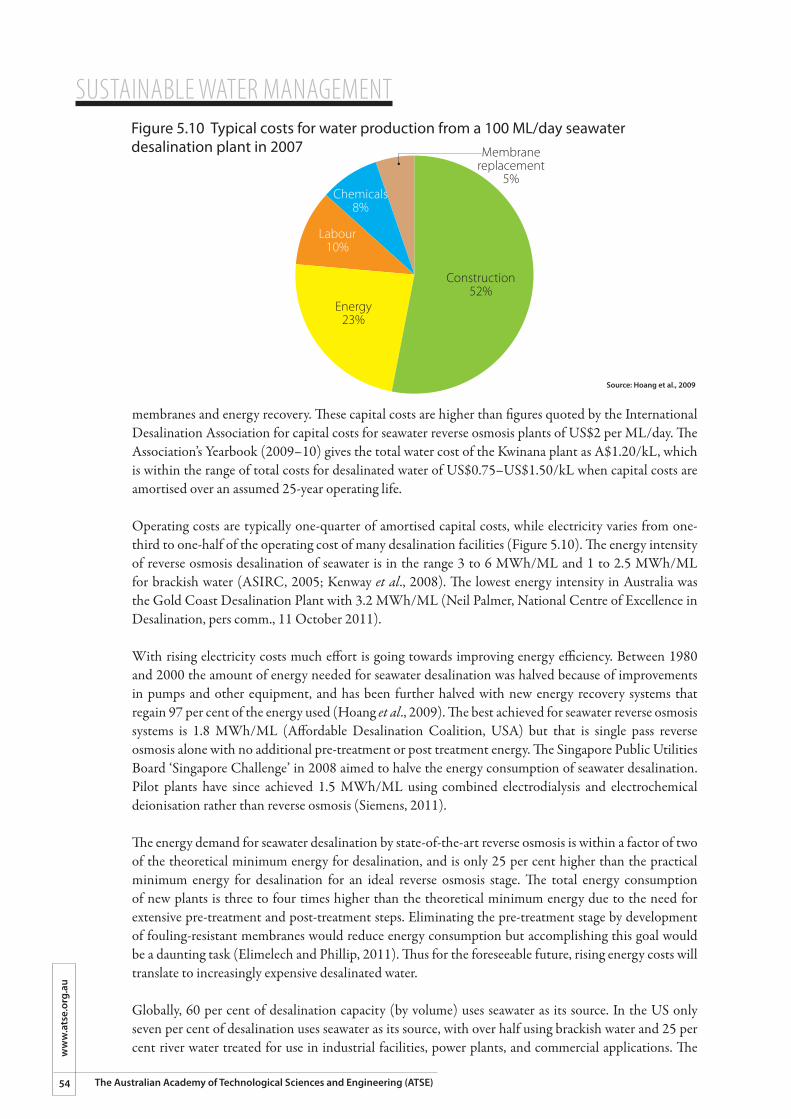
SUSTAINABLE WATER MANAGEMENT
54
ww
w.a
tse.
org.
au
The Australian Academy of Technological Sciences and Engineering (ATSE)
membranes and energy recovery. These capital costs are higher than figures quoted by the International Desalination Association for capital costs for seawater reverse osmosis plants of US$2 per ML/day. The Association’s Yearbook (2009–10) gives the total water cost of the Kwinana plant as A$1.20/kL, which is within the range of total costs for desalinated water of US$0.75–US$1.50/kL when capital costs are amortised over an assumed 25-year operating life.
Operating costs are typically one-quarter of amortised capital costs, while electricity varies from one-third to one-half of the operating cost of many desalination facilities (Figure 5.10). The energy intensity of reverse osmosis desalination of seawater is in the range 3 to 6 MWh/ML and 1 to 2.5 MWh/ML for brackish water (ASIRC, 2005; Kenway et al., 2008). The lowest energy intensity in Australia was the Gold Coast Desalination Plant with 3.2 MWh/ML (Neil Palmer, National Centre of Excellence in Desalination, pers comm., 11 October 2011).
With rising electricity costs much effort is going towards improving energy efficiency. Between 1980 and 2000 the amount of energy needed for seawater desalination was halved because of improvements in pumps and other equipment, and has been further halved with new energy recovery systems that regain 97 per cent of the energy used (Hoang et al., 2009). The best achieved for seawater reverse osmosis systems is 1.8 MWh/ML (Affordable Desalination Coalition, USA) but that is single pass reverse osmosis alone with no additional pre-treatment or post treatment energy. The Singapore Public Utilities Board ‘Singapore Challenge’ in 2008 aimed to halve the energy consumption of seawater desalination. Pilot plants have since achieved 1.5 MWh/ML using combined electrodialysis and electrochemical deionisation rather than reverse osmosis (Siemens, 2011).
The energy demand for seawater desalination by state-of-the-art reverse osmosis is within a factor of two of the theoretical minimum energy for desalination, and is only 25 per cent higher than the practical minimum energy for desalination for an ideal reverse osmosis stage. The total energy consumption of new plants is three to four times higher than the theoretical minimum energy due to the need for extensive pre-treatment and post-treatment steps. Eliminating the pre-treatment stage by development of fouling-resistant membranes would reduce energy consumption but accomplishing this goal would be a daunting task (Elimelech and Phillip, 2011). Thus for the foreseeable future, rising energy costs will translate to increasingly expensive desalinated water.
Globally, 60 per cent of desalination capacity (by volume) uses seawater as its source. In the US only seven per cent of desalination uses seawater as its source, with over half using brackish water and 25 per cent river water treated for use in industrial facilities, power plants, and commercial applications. The
Figure 5.10 Typical costs for water production from a 100 ML/day seawater desalination plant in 2007
Source: Hoang et al., 2009
Chemicals8%
Labour10%
Energy23%
Membranereplacement
5%
Construction52%
SUSTAINABLE WATER MANAGEMENTw
ww
.atse.org.au
55The Australian Academy of Technological Sciences and Engineering (ATSE)
levelised cost of US desalination is US$1.00 to $1.60/kL for seawater and US$0.35 to $0.70/kL for brackish water (Section 8.3) (Carter, 2011).
In some capital cities in Australia desalinated seawater will soon make up 40 per cent of distributed supply. Although offering supply security, economic analysis suggests that the cost to consumers is high. The Productivity Commission (2011a) concluded that much recent investment in supply augmentation could have been smaller scale from sources other than desalination (for example, upgrading dams, lowering dam storage triggers for augmentation, urban-rural trade and aquifers) while still maintaining security of supply. The Productivity Commission estimated that the increased cost to consumers of supplying water from desalination plants in Sydney and Melbourne compared to lower-cost alternatives could be between $1.8 billion and $2.5 billion over 10 years and $3.1 billion to $4.2 billion over 20 years.
In practice, the cost of desalinated water depends on plant utilisation. High construction costs provide a strong disincentive to operate at less than full capacity. Many plants will not be run at full capacity until the next drought. The figures in Table 5.2 assume that the plant runs for 345 days per year, allowing 20 days per year for maintenance
The operating rules for the Sydney desalination plant, set out in the Metropolitan Water Plan, are for it to run at full capacity when total reservoir storage is below 70 per cent and turn off when levels reach 80 per cent. The NSW Independent Pricing and Regulatory Tribunal has developed a financial model for privatisation of the plant that has sufficient flexibility to cope with a range of operating regimes, including shutdown periods of days, weeks and even years depending on rainfall and demand. Daily fixed charges include the return on capital, depreciation and fixed operating cost. Variable operating costs are included in the water usage charge (per ML of desalinated water supplied). In addition, for shutdowns longer than 11 days other fixed charges are payable each time the plant changes from one mode of operation to another to reflect the fixed costs of transitioning between the modes (IPART, 2011b). The price of desalinated water to consumers is estimated to be around $2.20/kL, considerably higher than Sydney dam water of $0.90/kL (Australian Financial Review, 2011). The IPART discussion paper requests tenderers to assess the cost implications of the plant being powered by renewable energy, which was part of the development approval (IPART, 2011a). Mandates to use green energy are effectively a cross-subsidy of the energy sector paid for by water consumers. Further discussion on the cost the Sydney desalination plant is given in Section 8.2, Box 10.
Some interconnected water grids such as the Brisbane Western Corridor Scheme and the Gippsland Water Factory (Section 8.1.1) are sometimes described as containing “manufactured water” since they recycle treated water for industrial or other non-potable reuse (Section 5.4).
5.4 Recycled waterThe use-once-and-dispose model for water is fast disappearing, with rapid advances in water recycling, reclamation and purification. A detailed review of recycling in Australia examined trends, technologies, policies and regulations (ATSE, 2004). At that time, more than 500 Australian sewage treatment plants recycled at least part of their treated effluent, supplying an aggregate of 150 GL to 200 GL per year for non-drinking purposes.
As a response to water shortages during the millennium drought, governments and communities have expanded recycling to secure water supplies and deliver broader environmental and urban amenity benefits (NWC, 2010c). Australia recycled 17 per cent of its wastewater effluent and stormwater in 2009–10, and is expected to reach 19 per cent to 20 per cent by 2015 (Marsden Jacob Associates, 2012), somewhat lower than earlier expectations of 25 per cent by 2015 (Marsden Jacob Associates, 2008). South Australia reuses the highest proportion of wastewater at 28 per cent followed by Victoria and
SUSTAINABLE WATER MANAGEMENT
56
ww
w.a
tse.
org.
au
The Australian Academy of Technological Sciences and Engineering (ATSE)
Queensland (both 24 per cent). Western Australia’s recycling to 2015 is dependent upon the potential for Australia’s first operating wastewater recycling project used for indirect potable reuse, described later in this Section. If approved, the Groundwater Replenishment project will supply between 25 and 35 GL/year to Perth’s potable supplies, using recharge to aquifers. This would increase recycled water use in WA from 12 per cent to 30 per cent, and the national proportion to 20.3 per cent, as well as potentially revolutionising recycled water use in Australia (Marsden Jacob Associates, 2012).
All major cities have ambitious targets, for example 35 per cent by 2015 in Adelaide, 12 per cent by 2015 for Sydney, and 20 per cent by 2010 and 60 per cent by 2060 for Perth (NWC, 2010c). Recycled water is mainly used for industry, watering green public spaces such as parks and sporting fields, and agriculture. Several new urban developments incorporate third pipe systems to supply recycled water for non-potable uses such as gardens and toilets (Radcliffe, 2010).
Recycling by utilitiesIn 2009–10, 245 GL of water was recycled by urban utilities with over 10,000 connections, up from 160 GL in 2005–06 (NWC, 2011 and WSAA, 2011). The use of recycled water in integrated water management is covered in Section 8.2. Major types of recycling projects, summarised from the Productivity Commission (2011a) and ABS (2010d), include:
Wastewater recycling, using advanced (tertiary) treatment to produce water of high quality. Large projects include the St Marys scheme in western Sydney for replacement environmental flows (27 GL/yr at a capital cost of $410 million), Kwinana and Alkimos schemes in Perth (13 GL/yr at cost of $365 million), Glenelg/Adelaide Parklands (5.5 GL/yr at cost of $76 million), and south-east Queensland Western Corridor and Murrumba Downs sewage treatment (47 GL/yr at a cost of $2800 million). Wastewater recycling is largely climate-independent.
Stormwater harvesting, normally through series of water-sensitive urban design (WSUD) systems such as wetlands or partial biological treatment and delivered to households via third-pipe systems, or used for irrigation and industry (Section 8.1.2). Adelaide leads Australia in stormwater harvesting with three projects completed or underway (Salisbury, Onkaparinga and Charles Sturt) supplying 12.6 GL/yr at a cost of $137 million). Orange NSW installed a 2.1 GL system for augmentation of potable supply in 2009 ($5 million cost), and Sydney is exploring use of the Botany aquifer to store and reuse stormwater runoff in the city. Stormwater recycling has a low to moderate climate dependency. Aquifer storage is increasingly used to store water after rain events.
Aquifer storage. Local aquifers are increasingly used for storage of stormwater or treated recycled water. The term “managed aquifer recharge” refers to any method of augmenting aquifers, while “aquifer storage and recovery” describes the specific process of injection and subsequent extraction of water from aquifers. A detailed description of types of aquifer storage schemes is given by EPHC (2009). The NWC expects the uptake of managed aquifer recharge schemes to increase in future years as their potential for supplementary storage to even out supply-demand cycles, replenish over-stressed aquifers and utilise treated wastewater is demonstrated (SKM and CSIRO, 2012).
Some localities, such as Alice Springs, use soil aquifer treatment that does not require injection. It is also possible to ensure a long residence time to promote biological treatment by injecting water and withdrawing it from a distant location, sometimes termed aquifer storage, transport and recovery.
Western Australia initiated a three-year groundwater replenishment trial injecting water from the Beenyup Wastewater Treatment Plant at the Advanced Water Recycling facility in Craigie in November 2010 to replenish a groundwater aquifer 120 to 200 metres below the surface. By October 2011,
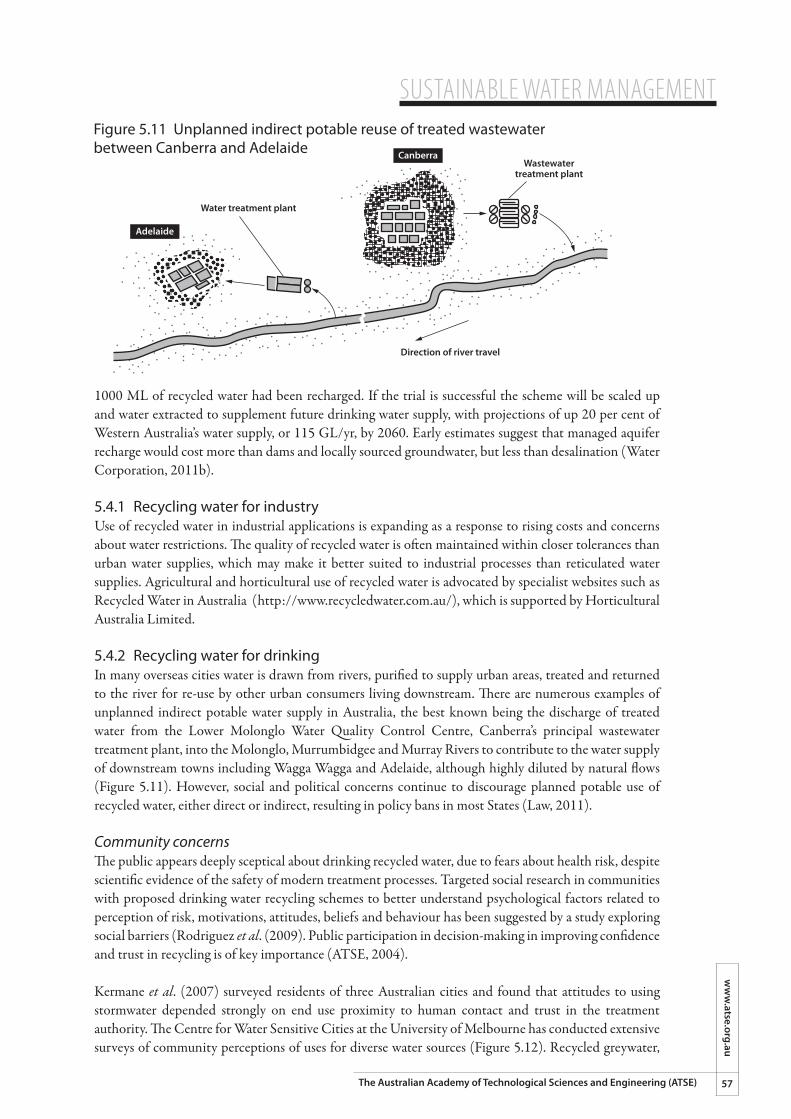
SUSTAINABLE WATER MANAGEMENTw
ww
.atse.org.au
57The Australian Academy of Technological Sciences and Engineering (ATSE)
1000 ML of recycled water had been recharged. If the trial is successful the scheme will be scaled up and water extracted to supplement future drinking water supply, with projections of up 20 per cent of Western Australia’s water supply, or 115 GL/yr, by 2060. Early estimates suggest that managed aquifer recharge would cost more than dams and locally sourced groundwater, but less than desalination (Water Corporation, 2011b).
5.4.1 Recycling water for industry Use of recycled water in industrial applications is expanding as a response to rising costs and concerns about water restrictions. The quality of recycled water is often maintained within closer tolerances than urban water supplies, which may make it better suited to industrial processes than reticulated water supplies. Agricultural and horticultural use of recycled water is advocated by specialist websites such as Recycled Water in Australia (http://www.recycledwater.com.au/), which is supported by Horticultural Australia Limited.
5.4.2 Recycling water for drinking In many overseas cities water is drawn from rivers, purified to supply urban areas, treated and returned to the river for re-use by other urban consumers living downstream. There are numerous examples of unplanned indirect potable water supply in Australia, the best known being the discharge of treated water from the Lower Molonglo Water Quality Control Centre, Canberra’s principal wastewater treatment plant, into the Molonglo, Murrumbidgee and Murray Rivers to contribute to the water supply of downstream towns including Wagga Wagga and Adelaide, although highly diluted by natural flows (Figure 5.11). However, social and political concerns continue to discourage planned potable use of recycled water, either direct or indirect, resulting in policy bans in most States (Law, 2011).
Community concernsThe public appears deeply sceptical about drinking recycled water, due to fears about health risk, despite scientific evidence of the safety of modern treatment processes. Targeted social research in communities with proposed drinking water recycling schemes to better understand psychological factors related to perception of risk, motivations, attitudes, beliefs and behaviour has been suggested by a study exploring social barriers (Rodriguez et al. (2009). Public participation in decision-making in improving confidence and trust in recycling is of key importance (ATSE, 2004).
Kermane et al. (2007) surveyed residents of three Australian cities and found that attitudes to using stormwater depended strongly on end use proximity to human contact and trust in the treatment authority. The Centre for Water Sensitive Cities at the University of Melbourne has conducted extensive surveys of community perceptions of uses for diverse water sources (Figure 5.12). Recycled greywater,
Figure 5.11 Unplanned indirect potable reuse of treated wastewater between Canberra and Adelaide
Water treatment plant
Wastewatertreatment plant
Direction of river travel
Adelaide
Canberra
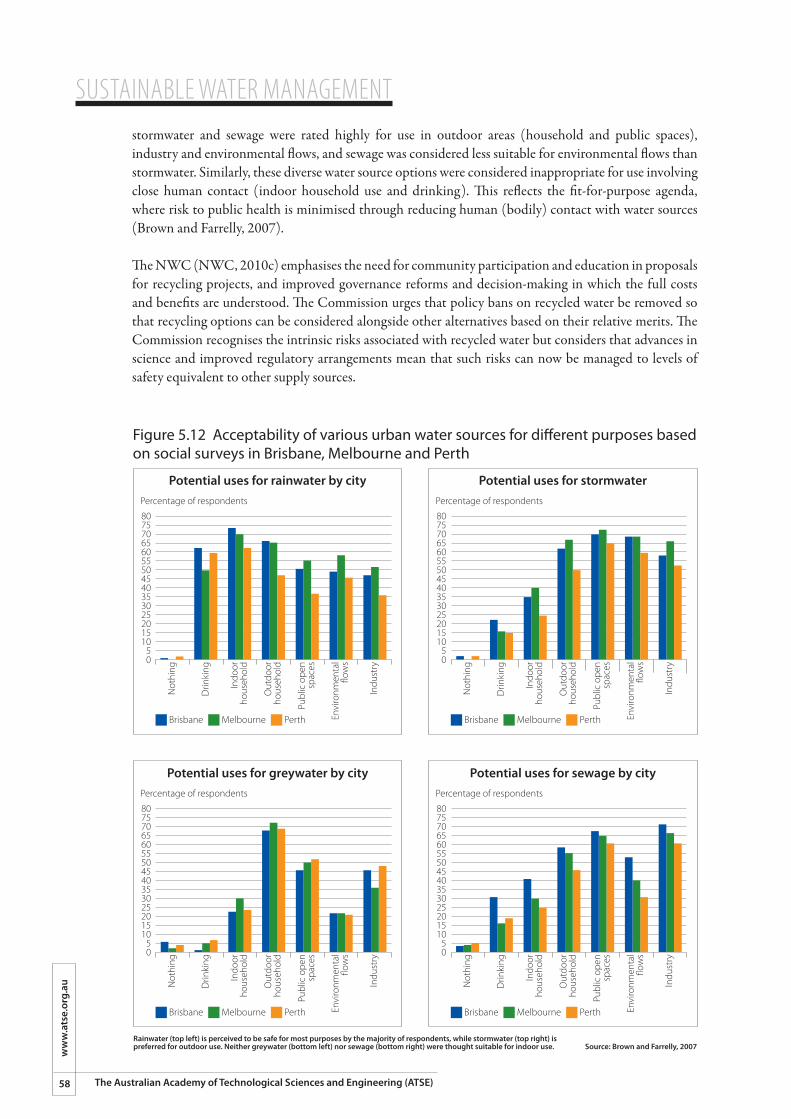
SUSTAINABLE WATER MANAGEMENT
58
ww
w.a
tse.
org.
au
The Australian Academy of Technological Sciences and Engineering (ATSE)
stormwater and sewage were rated highly for use in outdoor areas (household and public spaces), industry and environmental flows, and sewage was considered less suitable for environmental flows than stormwater. Similarly, these diverse water source options were considered inappropriate for use involving close human contact (indoor household use and drinking). This reflects the fit-for-purpose agenda, where risk to public health is minimised through reducing human (bodily) contact with water sources (Brown and Farrelly, 2007).
The NWC (NWC, 2010c) emphasises the need for community participation and education in proposals for recycling projects, and improved governance reforms and decision-making in which the full costs and benefits are understood. The Commission urges that policy bans on recycled water be removed so that recycling options can be considered alongside other alternatives based on their relative merits. The Commission recognises the intrinsic risks associated with recycled water but considers that advances in science and improved regulatory arrangements mean that such risks can now be managed to levels of safety equivalent to other supply sources.
Figure 5.12 Acceptability of various urban water sources for di�erent purposes based on social surveys in Brisbane, Melbourne and Perth
Source: Brown and Farrelly, 2007Rainwater (top left) is perceived to be safe for most purposes by the majority of respondents, while stormwater (top right) is preferred for outdoor use. Neither greywater (bottom left) nor sewage (bottom right) were thought suitable for indoor use.
Potential uses for rainwater by city
Brisbane Melbourne Perth
807570656055504540353025201510
50
Percentage of respondents
Not
hing
Drin
king
Indo
orho
useh
old
Out
door
hous
ehol
d
Publ
ic o
pen
spac
es
Envi
ronm
enta
l�o
ws
Indu
stry
Potential uses for stormwater
Brisbane Melbourne Perth
807570656055504540353025201510
50
Percentage of respondents
Not
hing
Drin
king
Indo
orho
useh
old
Out
door
hous
ehol
d
Publ
ic o
pen
spac
es
Envi
ronm
enta
l�o
ws
Indu
stry
Potential uses for greywater by city
Brisbane Melbourne Perth
807570656055504540353025201510
50
Percentage of respondents
Not
hing
Drin
king
Indo
orho
useh
old
Out
door
hous
ehol
d
Publ
ic o
pen
spac
es
Envi
ronm
enta
l�o
ws
Indu
stry
Potential uses for sewage by city
Brisbane Melbourne Perth
807570656055504540353025201510
50
Percentage of respondents
Not
hing
Drin
king
Indo
orho
useh
old
Out
door
hous
ehol
d
Publ
ic o
pen
spac
es
Envi
ronm
enta
l�o
ws
Indu
stry
SUSTAINABLE WATER MANAGEMENTw
ww
.atse.org.au
59The Australian Academy of Technological Sciences and Engineering (ATSE)
The process of deliberately introducing recycled water into the drinking water supply is usually classed as either ‘direct’ or ‘indirect’ potable reuse. Although neither is currently practised in Australia, there are compelling reasons for communities and politicians to eventually accept the need for recycled water as an integral part of their drinking water supply.
Indirect potable reuse, also known as indirect augmentation of drinking water, involves discharging highly treated recycled water into groundwater or surface water sources with the intent of augmenting drinking supplies. A detailed description of this approach is given in the Australian Guidelines for Water Recycling (AGWR, 2008). Receiving waters, also referred to as environmental buffers, act as control measures because of the significant retention time, ranging from weeks to years, combined with treatment through natural biological processes and dilution with other water sources. In cases where highly purified treated water is introduced to a river, lake or aquifer, the ‘environmental buffer’ may actually decrease water quality, but improves community acceptability (for example, the groundwater recharge and replenishment scheme in Orange County Water District, California, USA).
A number of attempts at indirect potable reuse schemes in Australia have been unsuccessful in overcoming community and political concerns. A referendum in 2006 in Toowoomba, Queensland rejected a proposal to introduce ultra-purified recycled water into a local dam to supplement supplies during a major drought (Nova, 2008). A similar proposal in Goulburn, NSW, was strongly resisted by some residents and local politicians, and a decision has since been made to construct an 83-kilometre, $54 million pipeline from Wingecarribee Reservoir, thus linking Goulburn to the Sydney water supply system.
Nevertheless, slow progress is being made on indirect potable reuse. As part of the Western Corridor Project of the South-East Queensland Water Strategy, infrastructure is now in place for transferring 230 ML/day of recycled water from three advanced water treatment plants to Brisbane’s principal water storage, Wivenhoe Dam through 400 km of pipelines. To allay public safety concerns, Queensland has decided that purified recycled water will only be used as an emergency supply if dam levels fall to 40 per cent (QWC 2010). The Commission “will continue to provide information to the community regarding purified recycled water … Over time, community confidence in purified recycled water schemes may permit the development of additional schemes and the further utilisation of the Western Corridor Recycled Water Scheme.” As mentioned above, Western Australia is planning to trial an indirect potable reuse scheme by recharging aquifers in its Groundwater Replenishment project with treated wastewater.
Direct Potable Reuse (DPR) refers to schemes where highly purified recycled water is fed directly into the drinking water system without an environmental buffer. Such schemes are technically feasible due to advanced control and testing systems, but are as yet rarely used either in Australia or overseas. Khan (2011a) has published evidence supporting direct potable reuse in Australia. He shows that were Brisbane to accept greater use of advanced purified water from its already extant Western Corridor Scheme, the Wivenhoe dam could be kept at a lower maximum level, providing more capacity for flood mitigation (Khan 2011b).
Cost. The cost of recycled water varies considerably, depending on source, location and transport distance, housing development density and treatment level required. Low-cost schemes supplying parks, gardens and agriculture have been developed in Toowoomba, Logan City and Redcliffe City in Queensland ($0.45/kL to $0.80/kL). Some schemes, though, supply water at considerably higher cost than conventional water supplies, for instance Rouse Hill residential in NSW ($3.00 to $4.00/kL) and the Western Sydney Recycled Water Initiative that uses highly treated water costing $5.80/kL to replace environmental flows, as well as for residences and agriculture (Marsden Jacob Associates, 2008). Sydney Water has since advised that it will not provide recycled water in any new housing developments due to economic considerations (Clennell 2011).
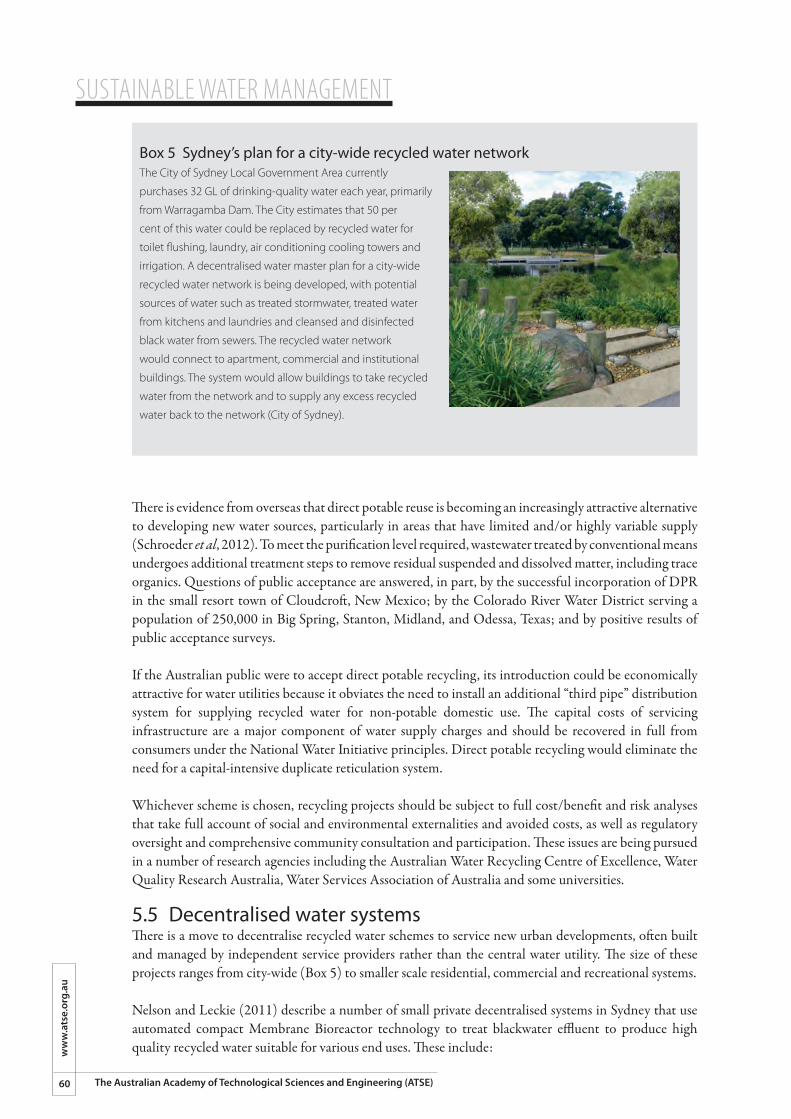
SUSTAINABLE WATER MANAGEMENT
60
ww
w.a
tse.
org.
au
The Australian Academy of Technological Sciences and Engineering (ATSE)
There is evidence from overseas that direct potable reuse is becoming an increasingly attractive alternative to developing new water sources, particularly in areas that have limited and/or highly variable supply (Schroeder et al, 2012). To meet the purification level required, wastewater treated by conventional means undergoes additional treatment steps to remove residual suspended and dissolved matter, including trace organics. Questions of public acceptance are answered, in part, by the successful incorporation of DPR in the small resort town of Cloudcroft, New Mexico; by the Colorado River Water District serving a population of 250,000 in Big Spring, Stanton, Midland, and Odessa, Texas; and by positive results of public acceptance surveys.
If the Australian public were to accept direct potable recycling, its introduction could be economically attractive for water utilities because it obviates the need to install an additional “third pipe” distribution system for supplying recycled water for non-potable domestic use. The capital costs of servicing infrastructure are a major component of water supply charges and should be recovered in full from consumers under the National Water Initiative principles. Direct potable recycling would eliminate the need for a capital-intensive duplicate reticulation system.
Whichever scheme is chosen, recycling projects should be subject to full cost/benefit and risk analyses that take full account of social and environmental externalities and avoided costs, as well as regulatory oversight and comprehensive community consultation and participation. These issues are being pursued in a number of research agencies including the Australian Water Recycling Centre of Excellence, Water Quality Research Australia, Water Services Association of Australia and some universities.
5.5 Decentralised water systemsThere is a move to decentralise recycled water schemes to service new urban developments, often built and managed by independent service providers rather than the central water utility. The size of these projects ranges from city-wide (Box 5) to smaller scale residential, commercial and recreational systems.
Nelson and Leckie (2011) describe a number of small private decentralised systems in Sydney that use automated compact Membrane Bioreactor technology to treat blackwater effluent to produce high quality recycled water suitable for various end uses. These include:
Box 5 Sydney’s plan for a city-wide recycled water networkThe City of Sydney Local Government Area currently
purchases 32 GL of drinking-quality water each year, primarily
from Warragamba Dam. The City estimates that 50 per
cent of this water could be replaced by recycled water for
toilet flushing, laundry, air conditioning cooling towers and
irrigation. A decentralised water master plan for a city-wide
recycled water network is being developed, with potential
sources of water such as treated stormwater, treated water
from kitchens and laundries and cleansed and disinfected
black water from sewers. The recycled water network
would connect to apartment, commercial and institutional
buildings. The system would allow buildings to take recycled
water from the network and to supply any excess recycled
water back to the network (City of Sydney).
SUSTAINABLE WATER MANAGEMENTw
ww
.atse.org.au
61The Australian Academy of Technological Sciences and Engineering (ATSE)
¢��a 200-dwelling retirement village at Menangle that recycles its black and grey water for irrigation and toilet flushing;
¢ �sewer mining at Pennant Hills Golf course to irrigate 23 hectares of turf;¢ �a 6-star, 6-storey commercial office building at Parramatta with solar heating for hot water and
cogeneration for power and cooling, with a 40 kL/day recycled water factory for toilet flushing and irrigation; and.
¢ �a 1200-dwelling, high-rise residential apartment block near Sydney Airport with a 300 kL/day integrated system. Recycled water will be used for toilet flushing, clothes washing, cooling, external wash-down and irrigation of four local parks through a partnership with the local Council.
Each of these schemes has demonstrated the need for careful planning, trained operators and close liaison with regulatory agencies and local authorities to refine local operating guidelines as new projects are developed.
The uptake and acceptance of greater recycling in Australia require a balance of social, economic and environmental factors, underpinned by sound science and advanced technology and the grasping of green growth opportunities.
ATSE considers that priorities in these areas are:¢ science and technology – strategic and targeted R&D in advanced treatment technologies, real-
time performance testing of multi-barrier controls, pathogen and chemical testing, risk assessment, technology transfer and sharing of best practice;
¢ economic – full cost/benefit analysis that takes account of social and environmental externalities and avoided costs; and
¢ socio-political – public education and awareness programs to improve public confidence in water supply options and technologies, sharing regulation and frameworks for validation of recycling schemes and accreditation of operators and certifiers.
SUSTAINABLE WATER MANAGEMENT
62
ww
w.a
tse.
org.
au
The Australian Academy of Technological Sciences and Engineering (ATSE)
6. Linkages
6.1 Water-energy-carbon linkagesThe interplay between energy, water and carbon in human activities has been the subject of a number of recent studies in Australia (PMSEIC, 2010; AUSCEW, 2010) and overseas (Cohen et al., 2004; ACEE, 2011; McMahon and Price, 2011). The 2010 PMSEIC report, Challenges at Energy-Water-Carbon Intersections noted that policy and regulatory challenges had become “more complex and more pressing by the need to mitigate climate change risk through reducing carbon emissions, while continuing to supply energy, water and nutritious and affordable food to a growing population. Our energy systems
Chapter SummaryThis chapter investigates the energy demands of the water sector, especially for desalination, pumping and wastewater treatment and recycling, and the impact of an increasing population. Rapidly increasing prices for electricity drive developments in energy-efficient technologies for both rural and urban water users. Likewise, water scarcity drives improvements on water-saving technologies, sometimes at the expense of increased energy use. This chapter examines these drivers, as well as challenges posed by biofuels production and biosequestration that displace agricultural activities.¢ �Water has particularly strong interdependencies with energy, food and the carbon cycle. ¢ �Energy in the water sector includes embodied energy (in construction of water infrastructure)
and in operation (transport, treatment and distribution). Large quantities of energy are required for pumping and desalination, with subsequent impacts on greenhouse-gas emissions.
¢ �The energy required to pump water over many hundreds of kilometres may be lower than the energy required for seawater desalination, making transporting water a cost-effective alternative in many cases.
¢ �Water utilities have programs to reduce their greenhouse-gas emissions. Purchasing green energy to offset desalination energy demand, is an expensive way to reduce emissions compared to market-based mechanisms, with the cost being passed on to the water consumer.
¢ �The energy used by households to heat water is much higher than energy used by water utilities for supply, distribution and treatment. About 30 per cent of Australian household energy consumption is used in water heating.
¢ �Irrigation for agriculture consumes substantial amounts of energy. Water-savings programs such as converting gravity-fed channel irrigation to pressurised pumped systems increase energy use. Incentives to save water by upgrading channels to pipes may perversely cross-subsidise water at the expense of increased electricity consumption. However, pressurised irrigation systems can improve crop yield and reduce the risk of salinisation as well as improving water use efficiency.
¢ �The rapid expansion of biofuel production as an alternative fuel has increased the demand for agricultural land, increased food prices and competition for scarce water resources. Next-generation biofuels derived from biomass sources that do not compete with food production could potentially reduce agricultural land requirements per unit of energy produced and improve life-cycle greenhouse-gas emissions.
¢ �Biosequestration of carbon through plantation forestry competes with food production and reduces water runoff into streams. A carbon price of more than $40 per tonne may be needed to make carbon forestry viable.
¢ �Population growth puts pressure on all resources, including land, water and energy, as well as the environment. Improvements in technology for energy and water efficiency, waste processing and recycling can help ameliorate potential ecological pressures from increasing population.
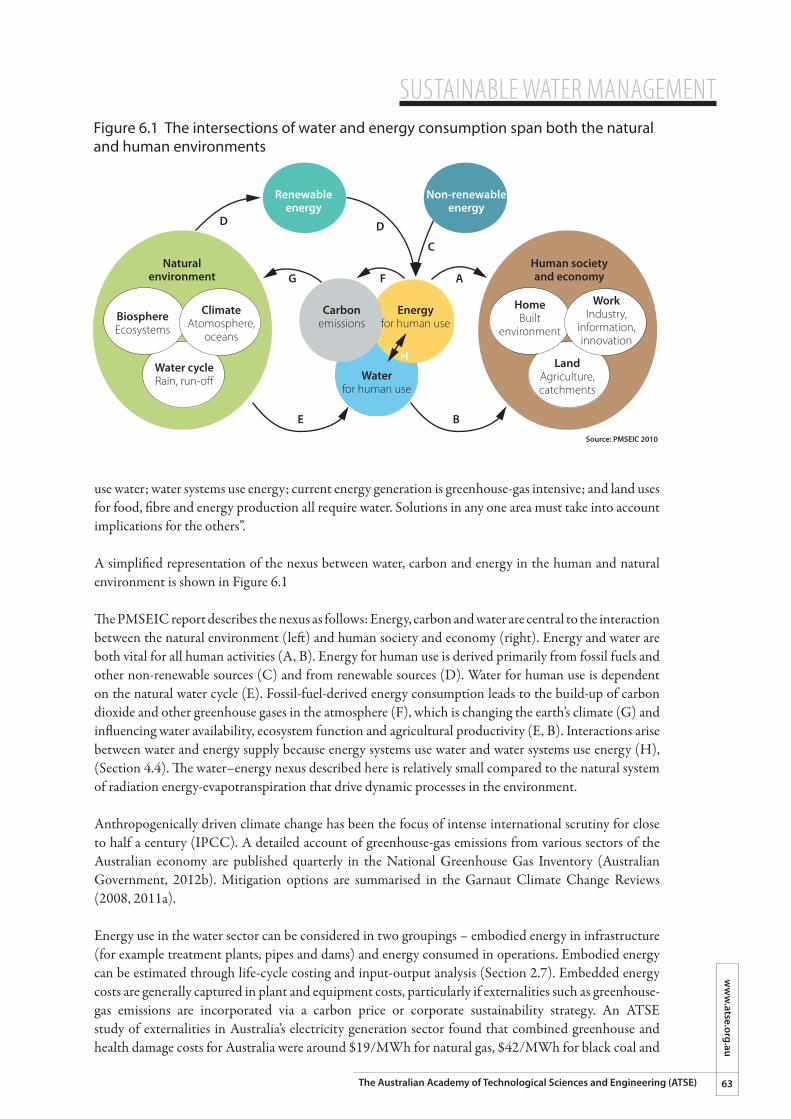
SUSTAINABLE WATER MANAGEMENTw
ww
.atse.org.au
63The Australian Academy of Technological Sciences and Engineering (ATSE)
use water; water systems use energy; current energy generation is greenhouse-gas intensive; and land uses for food, fibre and energy production all require water. Solutions in any one area must take into account implications for the others”.
A simplified representation of the nexus between water, carbon and energy in the human and natural environment is shown in Figure 6.1
The PMSEIC report describes the nexus as follows: Energy, carbon and water are central to the interaction between the natural environment (left) and human society and economy (right). Energy and water are both vital for all human activities (A, B). Energy for human use is derived primarily from fossil fuels and other non-renewable sources (C) and from renewable sources (D). Water for human use is dependent on the natural water cycle (E). Fossil-fuel-derived energy consumption leads to the build-up of carbon dioxide and other greenhouse gases in the atmosphere (F), which is changing the earth’s climate (G) and influencing water availability, ecosystem function and agricultural productivity (E, B). Interactions arise between water and energy supply because energy systems use water and water systems use energy (H), (Section 4.4). The water–energy nexus described here is relatively small compared to the natural system of radiation energy-evapotranspiration that drive dynamic processes in the environment.
Anthropogenically driven climate change has been the focus of intense international scrutiny for close to half a century (IPCC). A detailed account of greenhouse-gas emissions from various sectors of the Australian economy are published quarterly in the National Greenhouse Gas Inventory (Australian Government, 2012b). Mitigation options are summarised in the Garnaut Climate Change Reviews (2008, 2011a).
Energy use in the water sector can be considered in two groupings – embodied energy in infrastructure (for example treatment plants, pipes and dams) and energy consumed in operations. Embodied energy can be estimated through life-cycle costing and input-output analysis (Section 2.7). Embedded energy costs are generally captured in plant and equipment costs, particularly if externalities such as greenhouse-gas emissions are incorporated via a carbon price or corporate sustainability strategy. An ATSE study of externalities in Australia’s electricity generation sector found that combined greenhouse and health damage costs for Australia were around $19/MWh for natural gas, $42/MWh for black coal and
Figure 6.1 The intersections of water and energy consumption span both the natural and human environments
Source: PMSEIC 2010
D D
C
AFG
E B
H
Energyfor human use
Carbonemissions
Waterfor human use
Non-renewableenergy
Renewableenergy
LandAgriculture,catchments
Human societyand economy
HomeBuilt
environment
WorkIndustry,
information,innovation
Naturalenvironment
Water cycleRain, run-o�
BiosphereEcosystems
ClimateAtomosphere,
oceans
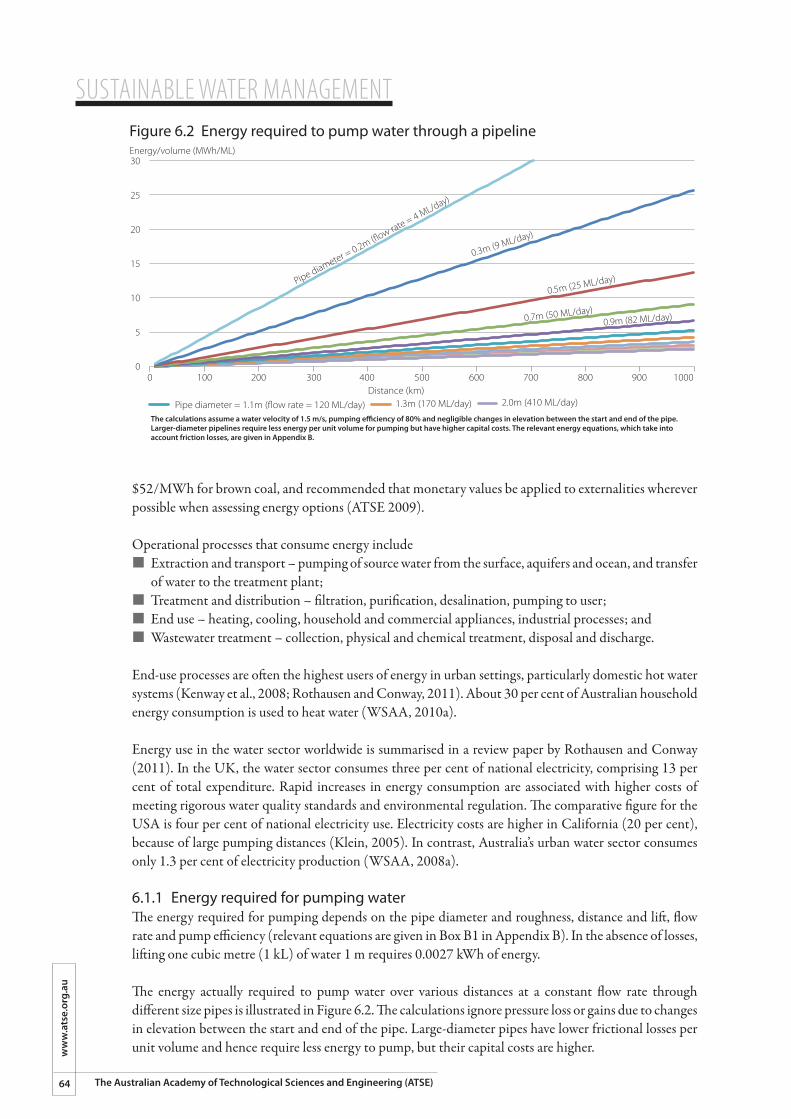
SUSTAINABLE WATER MANAGEMENT
64
ww
w.a
tse.
org.
au
The Australian Academy of Technological Sciences and Engineering (ATSE)
$52/MWh for brown coal, and recommended that monetary values be applied to externalities wherever possible when assessing energy options (ATSE 2009).
Operational processes that consume energy include¢ �Extraction and transport – pumping of source water from the surface, aquifers and ocean, and transfer
of water to the treatment plant;¢ �Treatment and distribution – filtration, purification, desalination, pumping to user;¢ �End use – heating, cooling, household and commercial appliances, industrial processes; and¢ �Wastewater treatment – collection, physical and chemical treatment, disposal and discharge.
End-use processes are often the highest users of energy in urban settings, particularly domestic hot water systems (Kenway et al., 2008; Rothausen and Conway, 2011). About 30 per cent of Australian household energy consumption is used to heat water (WSAA, 2010a).
Energy use in the water sector worldwide is summarised in a review paper by Rothausen and Conway (2011). In the UK, the water sector consumes three per cent of national electricity, comprising 13 per cent of total expenditure. Rapid increases in energy consumption are associated with higher costs of meeting rigorous water quality standards and environmental regulation. The comparative figure for the USA is four per cent of national electricity use. Electricity costs are higher in California (20 per cent), because of large pumping distances (Klein, 2005). In contrast, Australia’s urban water sector consumes only 1.3 per cent of electricity production (WSAA, 2008a).
6.1.1 Energy required for pumping waterThe energy required for pumping depends on the pipe diameter and roughness, distance and lift, flow rate and pump efficiency (relevant equations are given in Box B1 in Appendix B). In the absence of losses, lifting one cubic metre (1 kL) of water 1 m requires 0.0027 kWh of energy.
The energy actually required to pump water over various distances at a constant flow rate through different size pipes is illustrated in Figure 6.2. The calculations ignore pressure loss or gains due to changes in elevation between the start and end of the pipe. Large-diameter pipes have lower frictional losses per unit volume and hence require less energy to pump, but their capital costs are higher.
Figure 6.2 Energy required to pump water through a pipeline
The calculations assume a water velocity of 1.5 m/s, pumping e�ciency of 80% and negligible changes in elevation between the start and end of the pipe. Larger-diameter pipelines require less energy per unit volume for pumping but have higher capital costs. The relevant energy equations, which take into account friction losses, are given in Appendix B.
30
25
20
15
10
5
0
Energy/volume (MWh/ML)
Pipe diameter = 0.2m (�ow rate = 4 ML/day)
0.3m (9 ML/day)
0.5m (25 ML/day)
0.7m (50 ML/day)0.9m (82 ML/day)
0 100 200 300 400 500Distance (km)
600 700 800 900 1000
Pipe diameter = 1.1m (�ow rate = 120 ML/day) 1.3m (170 ML/day) 2.0m (410 ML/day)
SUSTAINABLE WATER MANAGEMENTw
ww
.atse.org.au
65The Australian Academy of Technological Sciences and Engineering (ATSE)
The economics of pumping water depend on three factors: (1) the capital cost of building the pipeline and associated infrastructure, (2) the cost of electricity used for pumping, and (3) the purchase price of the water to be pumped.
The capital cost of pipelines and associated pump infrastructure recently constructed in various parts of Australia ranges from $0.6 million/km to $1.0 million/km for small capacity pipelines, and $2 million/km to $10 million/km for large capacity pipelines. Specific projects are shown in Table 6.1.
Table 6.1 Capital cost of water pipelines recently constructed in Australia.
Project Length Diameter ML/day Cost Cost/kmCost
$/km/kL/day
Sugarloaf Interconnector, Victoria 70 km 1.75 m 300 $750M $10.7M/km 36
Goldfields Superpipe, Victoria 87 km 0.8 m 55 $180M $2.1M/km 38
Cloncurry Qld 38 km 0.45 m 2.5 $42M $1.1M/km 440
Goulburn NSW 84 km 0.375 m 7 $54M $0.6M/km 92
Barraba NSW 27 km 0.2 m 3 $20M $0.7M/km 250The Sugarloaf Interconnector (also known as the North-South pipeline) and the Goldfields Superpipe are large-capacity pipelines connecting parts of Victoria’s water grid. The Cloncurry pipeline connects SunWater’s North West Queensland Water Pipeline upstream of Ernest Henry Mine to the east and south of Cloncurry. The Barraba pipeline transfers water from Split Rock Dam to the community of Barraba in northern NSW. The Goulburn pipeline was built for emergency drought relief from the Wingecarribee Reservoir near Moss Vale in New South Wales.
The economics of pumping water also depends on the cost of the water to be pumped. The cost of traded water varies from around $30/ML in a normal year to about $500/ML in a drought year (Section 8.1.3). Assuming electricity can by purchased at $0.15/kWh (Appendix A), the cost of the purchased water would be the same as the cost of electricity at 0.2 MWh/ML in a normal year, or 3.3 MWh/ML in a drought year. (In the case of seawater desalination, the intake water is does not incur a charge).
6.1.2 Energy required for desalinationThe cost of electricity typically represents a major component (typically between one-third and one-half ) of the operating expense of desalination facilities. The energy intensity of modern reverse osmosis desalination of seawater is in the range 3 to 4 MWh/ML (Section 5.3).
Rapidly increasing electricity prices affect decisions on infrastructure investment, particularly when the infrastructure has an expected lifetime of many decades. It is instructive to compare energy costs of pumping water from a distant source with seawater desalination. The calculations (Box 6) show that, based on energy consumption, it may be preferable to pump fresh water over many hundreds of kilometres rather than desalinate seawater, depending on the cost of the water. This tradeoff is explored further in the modelled case study of Adelaide (Chapter 7).
6.1.3 Energy required for potable water reclamationA wide range of water treatment technologies can be used to convert wastewater to high-quality water suitable for drinking. Reverse-osmosis desalination of seawater, covered in the previous section, is the most energy-intensive option and is considered “safe to drink” by consumers. To utilise alternate resources such as stormwater, greywater and sewage for human consumption, multiple advanced treatment processes are required to reduce health and environmental risks to acceptable levels, as set out in the Australian Guidelines for Water Recycling (AGWR, 2008). Typical treatment processes for water reclamation may include some of the following: multimedia filtration, activated carbon absorption, chemical lime treatment, ozone treatment, microfiltration, ultrafiltration, nanofiltration, reverse osmosis, ultraviolet light disinfection and advanced oxidation. Figure 6.4 shows the relevant energy intensity of some of these processes. Environmental buffers such as surface storage reservoirs or aquifers also provide some level of biological treatment.
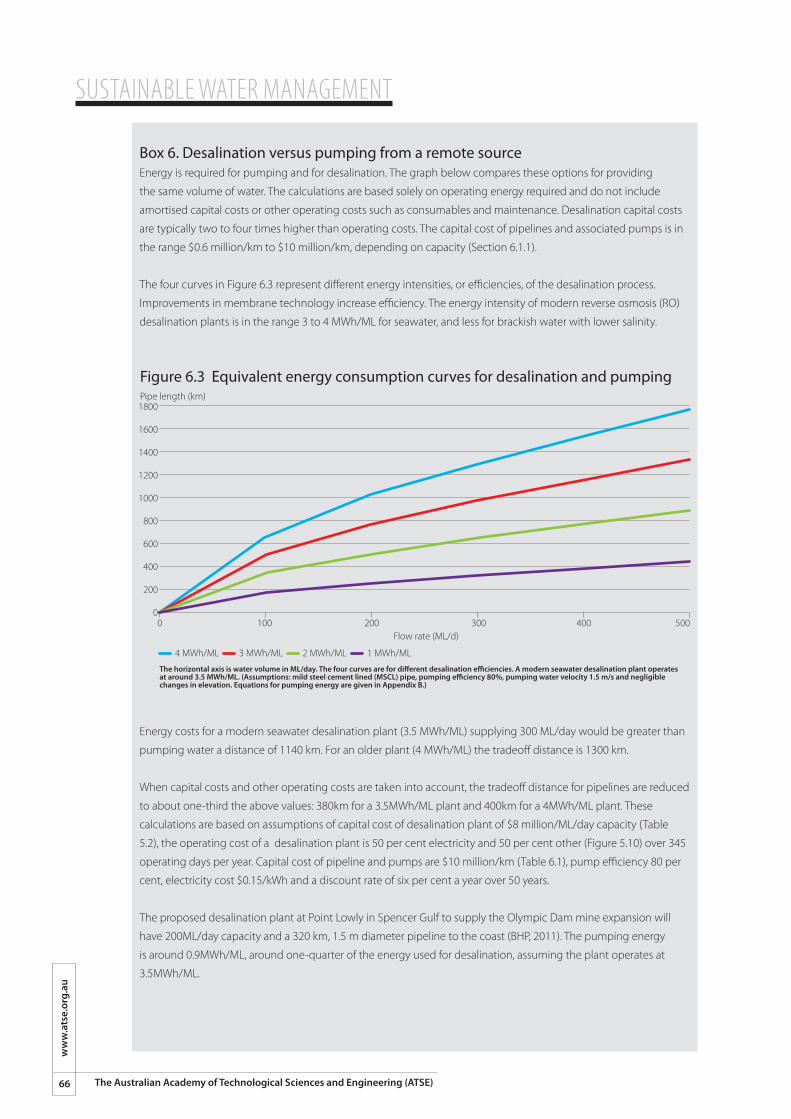
SUSTAINABLE WATER MANAGEMENT
66
ww
w.a
tse.
org.
au
The Australian Academy of Technological Sciences and Engineering (ATSE)
Box 6. Desalination versus pumping from a remote sourceEnergy is required for pumping and for desalination. The graph below compares these options for providing
the same volume of water. The calculations are based solely on operating energy required and do not include
amortised capital costs or other operating costs such as consumables and maintenance. Desalination capital costs
are typically two to four times higher than operating costs. The capital cost of pipelines and associated pumps is in
the range $0.6 million/km to $10 million/km, depending on capacity (Section 6.1.1).
The four curves in Figure 6.3 represent different energy intensities, or efficiencies, of the desalination process.
Improvements in membrane technology increase efficiency. The energy intensity of modern reverse osmosis (RO)
desalination plants is in the range 3 to 4 MWh/ML for seawater, and less for brackish water with lower salinity.
Energy costs for a modern seawater desalination plant (3.5 MWh/ML) supplying 300 ML/day would be greater than
pumping water a distance of 1140 km. For an older plant (4 MWh/ML) the tradeoff distance is 1300 km.
When capital costs and other operating costs are taken into account, the tradeoff distance for pipelines are reduced
to about one-third the above values: 380km for a 3.5MWh/ML plant and 400km for a 4MWh/ML plant. These
calculations are based on assumptions of capital cost of desalination plant of $8 million/ML/day capacity (Table
5.2), the operating cost of a desalination plant is 50 per cent electricity and 50 per cent other (Figure 5.10) over 345
operating days per year. Capital cost of pipeline and pumps are $10 million/km (Table 6.1), pump efficiency 80 per
cent, electricity cost $0.15/kWh and a discount rate of six per cent a year over 50 years.
The proposed desalination plant at Point Lowly in Spencer Gulf to supply the Olympic Dam mine expansion will
have 200ML/day capacity and a 320 km, 1.5 m diameter pipeline to the coast (BHP, 2011). The pumping energy
is around 0.9MWh/ML, around one-quarter of the energy used for desalination, assuming the plant operates at
3.5MWh/ML.
Figure 6.3 Equivalent energy consumption curves for desalination and pumping
The horizontal axis is water volume in ML/day. The four curves are for di�erent desalination e�ciencies. A modern seawater desalination plant operates at around 3.5 MWh/ML. (Assumptions: mild steel cement lined (MSCL) pipe, pumping e�ciency 80%, pumping water velocity 1.5 m/s and negligible changes in elevation. Equations for pumping energy are given in Appendix B.)
1800
1600
1400
1200
1000
800
600
400
200
0
Pipe length (km)
0 100 200 300 400 500Flow rate (ML/d)
4 MWh/ML 3 MWh/ML 2 MWh/ML 1 MWh/ML
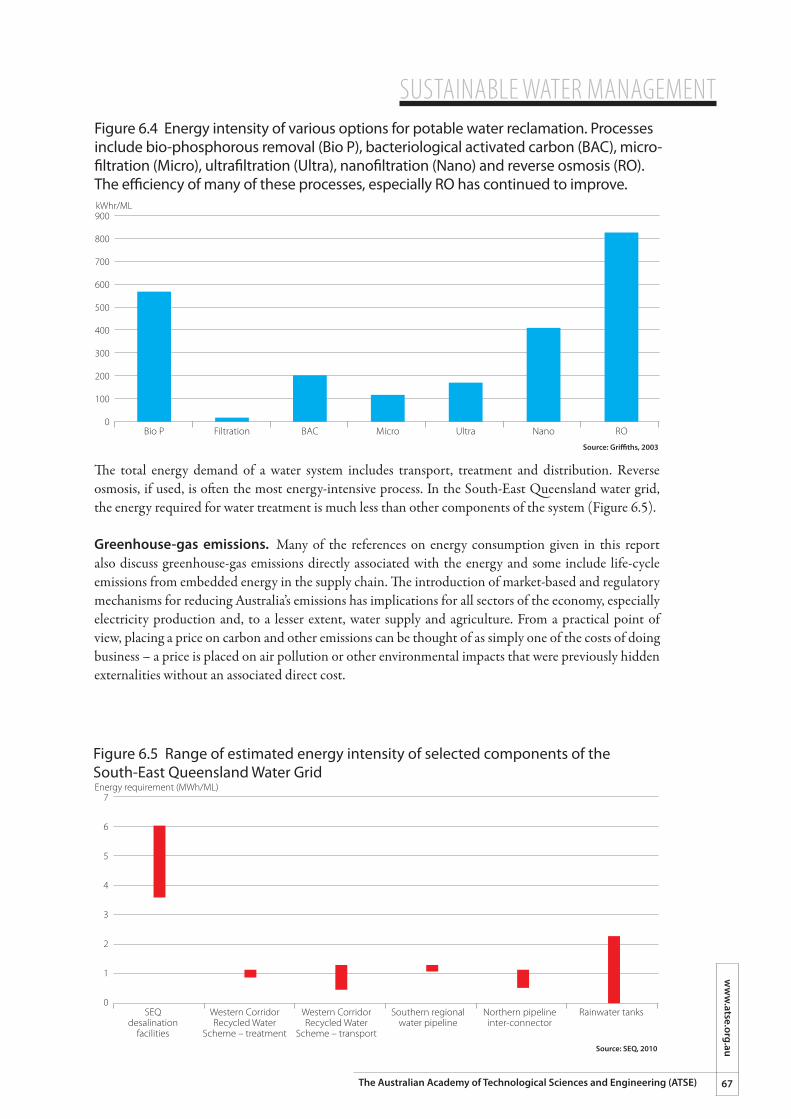
SUSTAINABLE WATER MANAGEMENTw
ww
.atse.org.au
67The Australian Academy of Technological Sciences and Engineering (ATSE)
The total energy demand of a water system includes transport, treatment and distribution. Reverse osmosis, if used, is often the most energy-intensive process. In the South-East Queensland water grid, the energy required for water treatment is much less than other components of the system (Figure 6.5).
Greenhouse-gas emissions. Many of the references on energy consumption given in this report also discuss greenhouse-gas emissions directly associated with the energy and some include life-cycle emissions from embedded energy in the supply chain. The introduction of market-based and regulatory mechanisms for reducing Australia’s emissions has implications for all sectors of the economy, especially electricity production and, to a lesser extent, water supply and agriculture. From a practical point of view, placing a price on carbon and other emissions can be thought of as simply one of the costs of doing business – a price is placed on air pollution or other environmental impacts that were previously hidden externalities without an associated direct cost.
Figure 6.4 Energy intensity of various options for potable water reclamation. Processes include bio-phosphorous removal (Bio P), bacteriological activated carbon (BAC), micro-�ltration (Micro), ultra�ltration (Ultra), nano�ltration (Nano) and reverse osmosis (RO). The e�ciency of many of these processes, especially RO has continued to improve.
900
800
700
600
500
400
300
200
100
0
kWhr/ML
Bio P Filtration BAC Micro Ultra Nano RO
Source: Gri�ths, 2003
Figure 6.5 Range of estimated energy intensity of selected components of the South-East Queensland Water Grid
7
6
5
4
3
2
1
0
Energy requirement (MWh/ML)
SEQdesalination
facilities
Western CorridorRecycled Water
Scheme – treatment
Western CorridorRecycled Water
Scheme – transport
Southern regionalwater pipeline
Northern pipelineinter-connector
Rainwater tanks
Source: SEQ, 2010
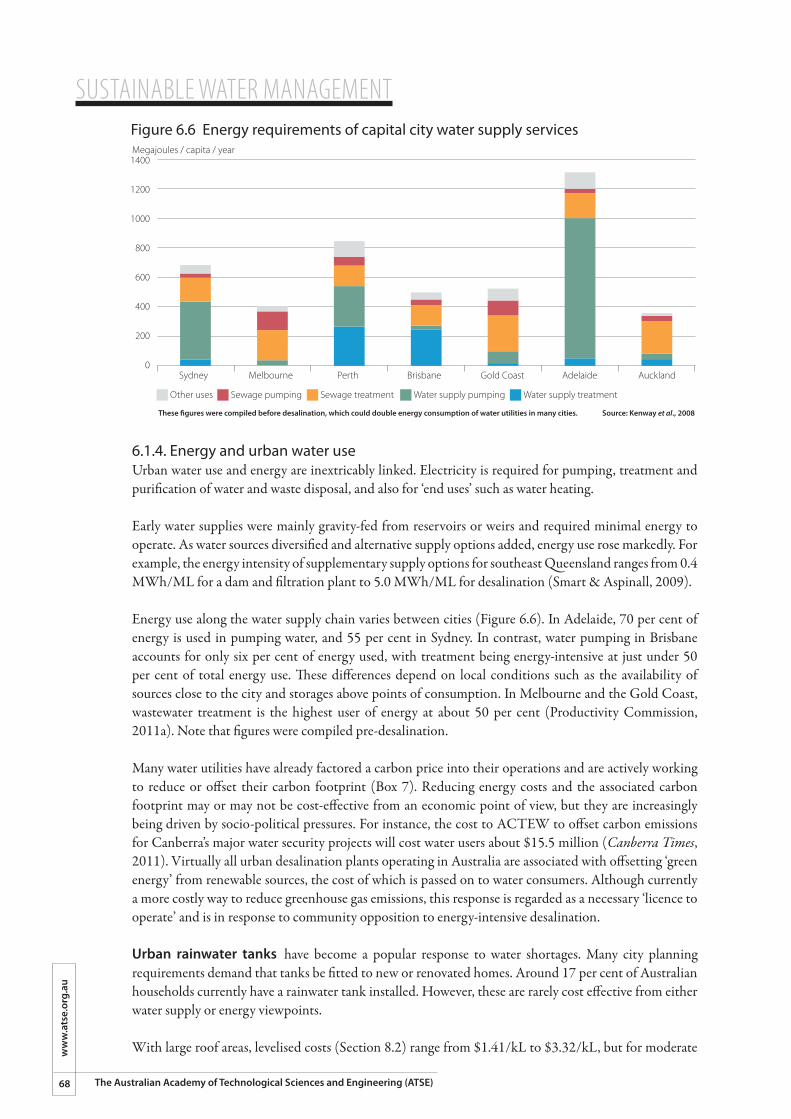
SUSTAINABLE WATER MANAGEMENT
68
ww
w.a
tse.
org.
au
The Australian Academy of Technological Sciences and Engineering (ATSE)
6.1.4. Energy and urban water useUrban water use and energy are inextricably linked. Electricity is required for pumping, treatment and purification of water and waste disposal, and also for ‘end uses’ such as water heating.
Early water supplies were mainly gravity-fed from reservoirs or weirs and required minimal energy to operate. As water sources diversified and alternative supply options added, energy use rose markedly. For example, the energy intensity of supplementary supply options for southeast Queensland ranges from 0.4 MWh/ML for a dam and filtration plant to 5.0 MWh/ML for desalination (Smart & Aspinall, 2009).
Energy use along the water supply chain varies between cities (Figure 6.6). In Adelaide, 70 per cent of energy is used in pumping water, and 55 per cent in Sydney. In contrast, water pumping in Brisbane accounts for only six per cent of energy used, with treatment being energy-intensive at just under 50 per cent of total energy use. These differences depend on local conditions such as the availability of sources close to the city and storages above points of consumption. In Melbourne and the Gold Coast, wastewater treatment is the highest user of energy at about 50 per cent (Productivity Commission, 2011a). Note that figures were compiled pre-desalination.
Many water utilities have already factored a carbon price into their operations and are actively working to reduce or offset their carbon footprint (Box 7). Reducing energy costs and the associated carbon footprint may or may not be cost-effective from an economic point of view, but they are increasingly being driven by socio-political pressures. For instance, the cost to ACTEW to offset carbon emissions for Canberra’s major water security projects will cost water users about $15.5 million (Canberra Times, 2011). Virtually all urban desalination plants operating in Australia are associated with offsetting ‘green energy’ from renewable sources, the cost of which is passed on to water consumers. Although currently a more costly way to reduce greenhouse gas emissions, this response is regarded as a necessary ‘licence to operate’ and is in response to community opposition to energy-intensive desalination.
Urban rainwater tanks have become a popular response to water shortages. Many city planning requirements demand that tanks be fitted to new or renovated homes. Around 17 per cent of Australian households currently have a rainwater tank installed. However, these are rarely cost effective from either water supply or energy viewpoints.
With large roof areas, levelised costs (Section 8.2) range from $1.41/kL to $3.32/kL, but for moderate
Figure 6.6 Energy requirements of capital city water supply services
1400
1200
1000
800
600
400
200
0
Megajoules / capita / year
Sydney Melbourne Perth Brisbane Gold Coast Adelaide Auckland
Source: Kenway et al., 2008These �gures were compiled before desalination, which could double energy consumption of water utilities in many cities.
Other uses Sewage pumping Sewage treatment Water supply pumping Water supply treatment
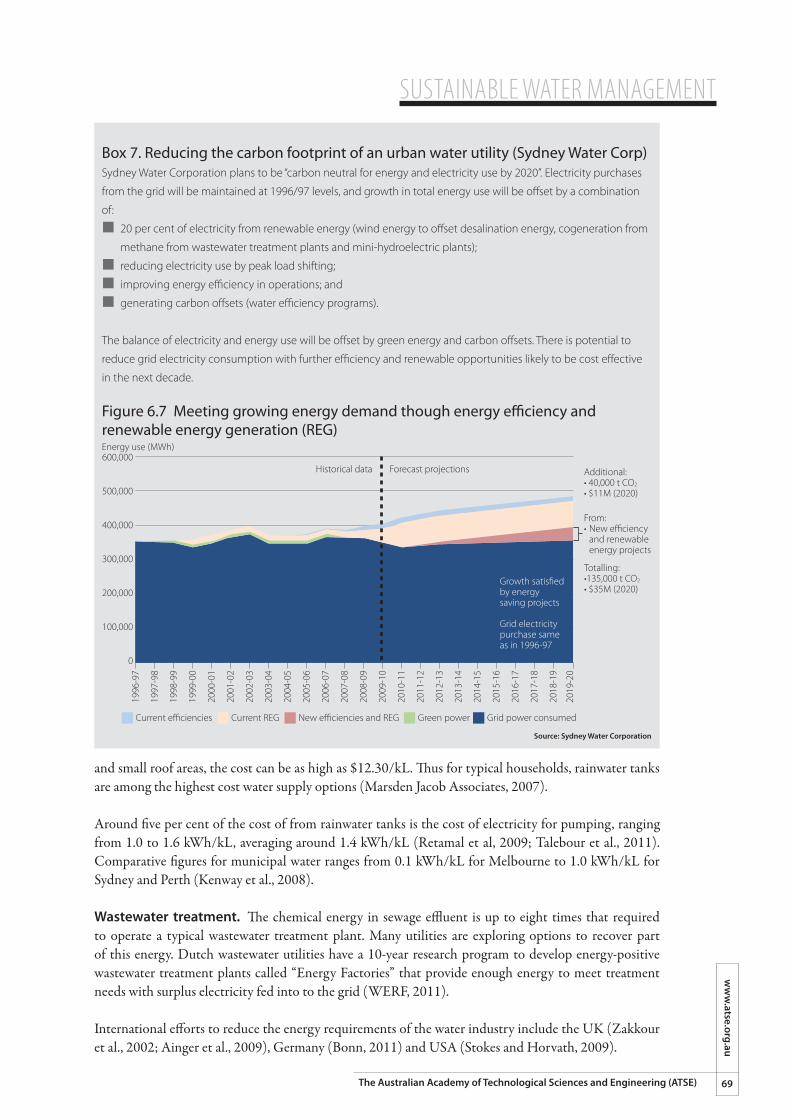
SUSTAINABLE WATER MANAGEMENTw
ww
.atse.org.au
69The Australian Academy of Technological Sciences and Engineering (ATSE)
and small roof areas, the cost can be as high as $12.30/kL. Thus for typical households, rainwater tanks are among the highest cost water supply options (Marsden Jacob Associates, 2007).
Around five per cent of the cost of from rainwater tanks is the cost of electricity for pumping, ranging from 1.0 to 1.6 kWh/kL, averaging around 1.4 kWh/kL (Retamal et al, 2009; Talebour et al., 2011). Comparative figures for municipal water ranges from 0.1 kWh/kL for Melbourne to 1.0 kWh/kL for Sydney and Perth (Kenway et al., 2008).
Wastewater treatment. The chemical energy in sewage effluent is up to eight times that required to operate a typical wastewater treatment plant. Many utilities are exploring options to recover part of this energy. Dutch wastewater utilities have a 10-year research program to develop energy-positive wastewater treatment plants called “Energy Factories” that provide enough energy to meet treatment needs with surplus electricity fed into to the grid (WERF, 2011).
International efforts to reduce the energy requirements of the water industry include the UK (Zakkour et al., 2002; Ainger et al., 2009), Germany (Bonn, 2011) and USA (Stokes and Horvath, 2009).
Box 7. Reducing the carbon footprint of an urban water utility (Sydney Water Corp)Sydney Water Corporation plans to be “carbon neutral for energy and electricity use by 2020”. Electricity purchases
from the grid will be maintained at 1996/97 levels, and growth in total energy use will be offset by a combination
of:
¢ �20 per cent of electricity from renewable energy (wind energy to offset desalination energy, cogeneration from
methane from wastewater treatment plants and mini-hydroelectric plants);
¢ �reducing electricity use by peak load shifting;
¢ �improving energy efficiency in operations; and
¢ �generating carbon offsets (water efficiency programs).
The balance of electricity and energy use will be offset by green energy and carbon offsets. There is potential to
reduce grid electricity consumption with further efficiency and renewable opportunities likely to be cost effective
in the next decade.
Figure 6.7 Meeting growing energy demand though energy e�ciency and renewable energy generation (REG)
600,000
500,000
400,000
300,000
200,000
100,000
0
Energy use (MWh)
Current e�ciencies
Source: Sydney Water Corporation
1996
-97
1997
-98
1998
-99
1999
-00
2000
-01
2001
-02
2002
-03
2003
-04
2004
-05
2005
-06
2006
-07
2007
-08
2008
-09
2009
-10
2010
-11
2011
-12
2012
-13
2013
-14
2014
-15
2015
-16
2016
-17
2017
-18
2018
-19
2019
-20
Current REG New e�ciencies and REG Green power Grid power consumed
Additional:• 40,000 t CO2
• $11M (2020)
Forecast projectionsHistorical data
From:• New efficiency and renewable energy projects
Totalling:•135,000 t CO2
• $35M (2020)Growth satis�edby energysaving projects
Grid electricitypurchase sameas in 1996-97
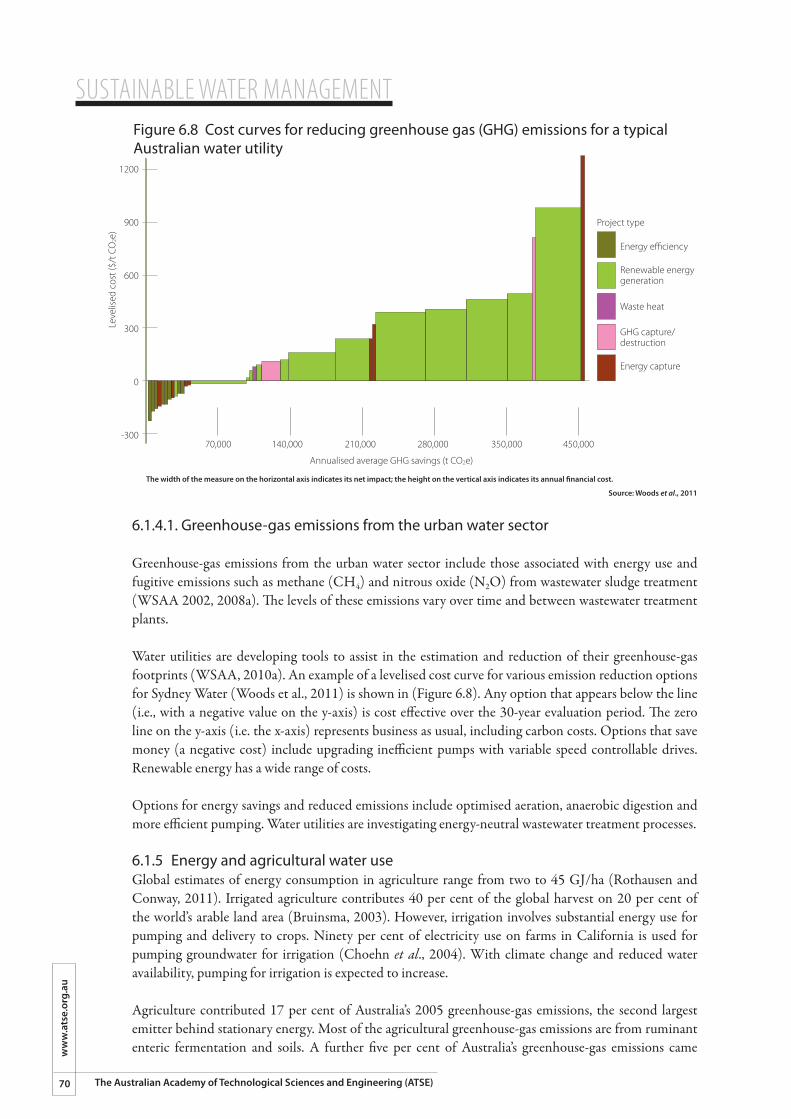
SUSTAINABLE WATER MANAGEMENT
70
ww
w.a
tse.
org.
au
The Australian Academy of Technological Sciences and Engineering (ATSE)
6.1.4.1. Greenhouse-gas emissions from the urban water sector
Greenhouse-gas emissions from the urban water sector include those associated with energy use and fugitive emissions such as methane (CH4) and nitrous oxide (N2O) from wastewater sludge treatment (WSAA 2002, 2008a). The levels of these emissions vary over time and between wastewater treatment plants.
Water utilities are developing tools to assist in the estimation and reduction of their greenhouse-gas footprints (WSAA, 2010a). An example of a levelised cost curve for various emission reduction options for Sydney Water (Woods et al., 2011) is shown in (Figure 6.8). Any option that appears below the line (i.e., with a negative value on the y-axis) is cost effective over the 30-year evaluation period. The zero line on the y-axis (i.e. the x-axis) represents business as usual, including carbon costs. Options that save money (a negative cost) include upgrading inefficient pumps with variable speed controllable drives. Renewable energy has a wide range of costs.
Options for energy savings and reduced emissions include optimised aeration, anaerobic digestion and more efficient pumping. Water utilities are investigating energy-neutral wastewater treatment processes.
6.1.5 Energy and agricultural water useGlobal estimates of energy consumption in agriculture range from two to 45 GJ/ha (Rothausen and Conway, 2011). Irrigated agriculture contributes 40 per cent of the global harvest on 20 per cent of the world’s arable land area (Bruinsma, 2003). However, irrigation involves substantial energy use for pumping and delivery to crops. Ninety per cent of electricity use on farms in California is used for pumping groundwater for irrigation (Choehn et al., 2004). With climate change and reduced water availability, pumping for irrigation is expected to increase.
Agriculture contributed 17 per cent of Australia’s 2005 greenhouse-gas emissions, the second largest emitter behind stationary energy. Most of the agricultural greenhouse-gas emissions are from ruminant enteric fermentation and soils. A further five per cent of Australia’s greenhouse-gas emissions came
Figure 6.8 Cost curves for reducing greenhouse gas (GHG) emissions for a typical Australian water utility
Leve
lised
cos
t ($/
t CO
2e)
Source: Woods et al., 2011
The width of the measure on the horizontal axis indicates its net impact; the height on the vertical axis indicates its annual �nancial cost.
Project type
Annualised average GHG savings (t CO2e)
Energy e�ciency
Energy capture
Waste heat
Renewable energygeneration
GHG capture/destruction
1200
900
600
300
0
-30070,000 140,000 210,000 280,000 350,000 450,000
SUSTAINABLE WATER MANAGEMENTw
ww
.atse.org.au
71The Australian Academy of Technological Sciences and Engineering (ATSE)
from energy and transport in the agricultural sector (Hatfield-Dodds et al., 2007). Transport fuels are significant, but irrigation pumping is a major user of electricity, as described in the next Section.
6.1.5.1 Pressurised irrigation systemsConverting from flood to pressurised irrigation systems saves water through reduced evaporation, leakage and targeted application, but increases energy consumption substantially. Studies in Coleambally (NSW) and south-eastern South Australia by Jackson et al. (2010) show that water savings between 10 per cent and 60 per cent are achieved by changing from gravity-fed channels to pressurised centre pivot or drip irrigation, but these savings are countered by increased electricity use of up to 163 per cent. By contrast, pressurising groundwater-fed irrigation significantly reduces the volume of water that needs to be pumped and reduces electricity consumption by between 12 per cent and 44 per cent.
The cost, water savings, energy consumption and GHG emissions from upgrading irrigation infrastructure was analysed by Mushtaq and Maraseni (2011). Water savings from changing to sprinkler irrigation and drip irrigation ranged from 14 per cent to 29 per cent, but with increased energy use and greenhouse-gas emissions. Drip irrigation systems required 28 per cent less energy and 25 per cent less emissions compared with centre-pivot and lateral-move systems. Under Australia’s currently proposed starting price for carbon of $23/ton CO2-e, the savings from irrigation upgrades more than offsets increased electricity costs. The upgrades are also cost-effective at carbon prices of $10/ton CO2-e.
Box 8. Cost and energy associated with replacing channels with pipesA study was carried out to examine the tradeoffs associated with replacing open channels with pipes to distribute
water for stock and domestic use in a 300,000 ha region in the Murrumbidgee Irrigation Area. The average annual
consumption (excluding losses) for the region is around 2.1 GL. The proposed scheme involves two pump stations
on the Murrumbidgee River, two booster pump stations, 380km of main pipelines and 70 metered outlets for the
off-farm system. On-farm works comprise the installation of 1650 km of pipelines and 750 tanks and troughs with
telemetry monitoring at stock watering points. The net present value of capital cost is $63 million (including $7.5
million for on-farm costs) and the present value of the annual operations and maintenance cost is $8.7 million,
giving a total cost of $71.7 million (in present value terms). These figures are based on a 7.5 per cent pa discount
rate and a 25-year project life.
The scheme is expected to save 9 GL of water in an average year and 12 GL in a dry year, through reduced seepage
and evaporation losses and increased on-farm efficiency. The equivalent annual cost of the project is $6.4 million
per year (present value of $71.7 million spread over the life of the project). Hence the cost per kL of water saved
is $0.71/kL, which compares favourably with the estimated cost of supplying desalinated water to Adelaide of
between $2.64/kL and $4.28/kL (Appendix A). Furthermore, the project generates other benefits, including reduced
urban salinity impacts in downstream communities, reduced water logging, improvements in on-farm production,
increased regional value added and flow-on benefits of construction costs. When these factors are taken into
account, the benefit-cost ratio for the public investment in the project is estimated to be 1.29.
The estimated embodied energy of the new pipes is 28,500MWh or 1140MWh a year of the scheme’s 25-year life.
Pumping will require an average of 495MWh a year. Therefore, the average energy expended per GL of water saved
is 1635/9000 or 0.18MWh/ML. This compares favourably with 1.6MWh/ML for pumping water from the River Murray
to Adelaide or 5.0MWh/ML for desalination (Table A.4 in Appendix A).
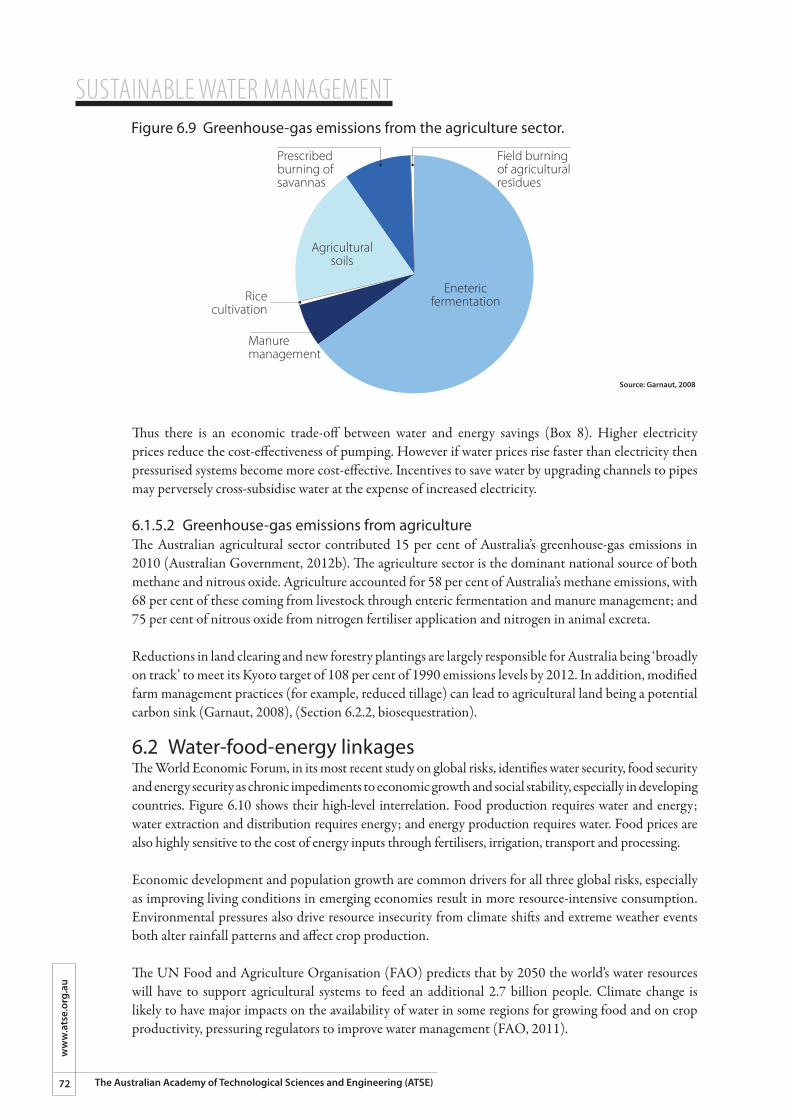
SUSTAINABLE WATER MANAGEMENT
72
ww
w.a
tse.
org.
au
The Australian Academy of Technological Sciences and Engineering (ATSE)
Thus there is an economic trade-off between water and energy savings (Box 8). Higher electricity prices reduce the cost-effectiveness of pumping. However if water prices rise faster than electricity then pressurised systems become more cost-effective. Incentives to save water by upgrading channels to pipes may perversely cross-subsidise water at the expense of increased electricity.
6.1.5.2 Greenhouse-gas emissions from agricultureThe Australian agricultural sector contributed 15 per cent of Australia’s greenhouse-gas emissions in 2010 (Australian Government, 2012b). The agriculture sector is the dominant national source of both methane and nitrous oxide. Agriculture accounted for 58 per cent of Australia’s methane emissions, with 68 per cent of these coming from livestock through enteric fermentation and manure management; and 75 per cent of nitrous oxide from nitrogen fertiliser application and nitrogen in animal excreta.
Reductions in land clearing and new forestry plantings are largely responsible for Australia being ‘broadly on track’ to meet its Kyoto target of 108 per cent of 1990 emissions levels by 2012. In addition, modified farm management practices (for example, reduced tillage) can lead to agricultural land being a potential carbon sink (Garnaut, 2008), (Section 6.2.2, biosequestration).
6.2 Water-food-energy linkagesThe World Economic Forum, in its most recent study on global risks, identifies water security, food security and energy security as chronic impediments to economic growth and social stability, especially in developing countries. Figure 6.10 shows their high-level interrelation. Food production requires water and energy; water extraction and distribution requires energy; and energy production requires water. Food prices are also highly sensitive to the cost of energy inputs through fertilisers, irrigation, transport and processing.
Economic development and population growth are common drivers for all three global risks, especially as improving living conditions in emerging economies result in more resource-intensive consumption. Environmental pressures also drive resource insecurity from climate shifts and extreme weather events both alter rainfall patterns and affect crop production.
The UN Food and Agriculture Organisation (FAO) predicts that by 2050 the world’s water resources will have to support agricultural systems to feed an additional 2.7 billion people. Climate change is likely to have major impacts on the availability of water in some regions for growing food and on crop productivity, pressuring regulators to improve water management (FAO, 2011).
Figure 6.9 Greenhouse-gas emissions from the agriculture sector.
Source: Garnaut, 2008
Agriculturalsoils
Manuremanagement
Prescribedburning ofsavannas
Ricecultivation
Field burningof agriculturalresidues
Enetericfermentation
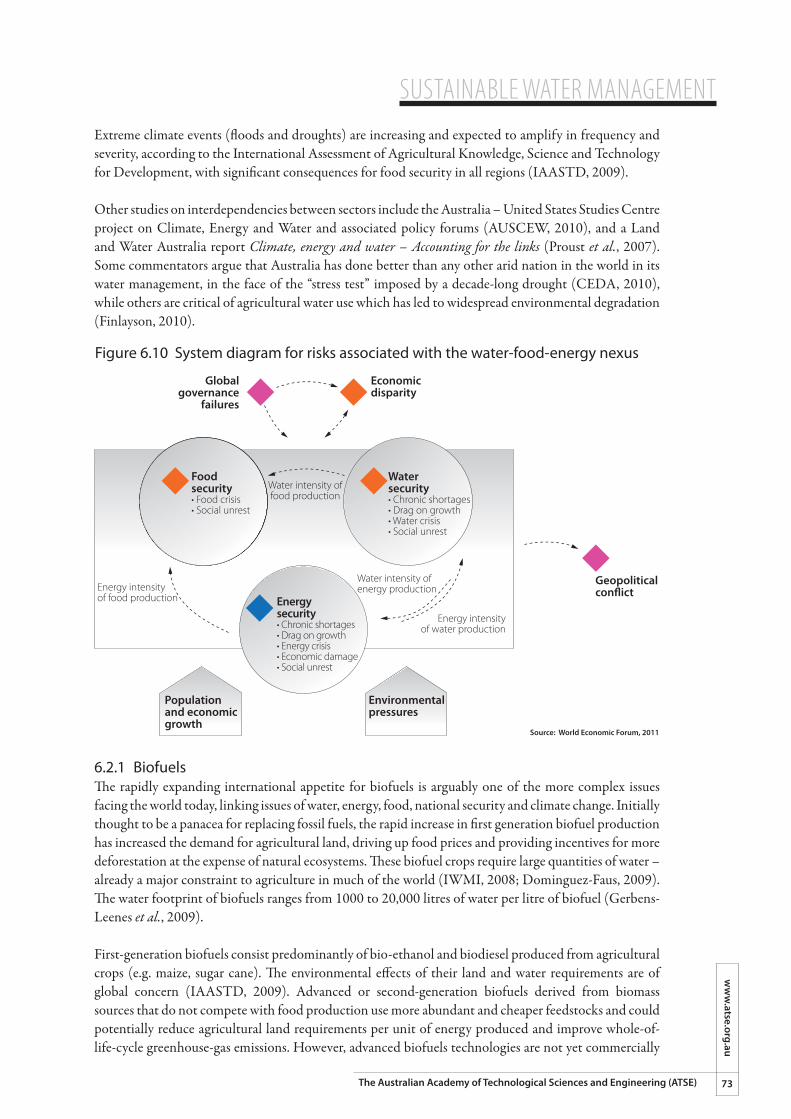
SUSTAINABLE WATER MANAGEMENTw
ww
.atse.org.au
73The Australian Academy of Technological Sciences and Engineering (ATSE)
Extreme climate events (floods and droughts) are increasing and expected to amplify in frequency and severity, according to the International Assessment of Agricultural Knowledge, Science and Technology for Development, with significant consequences for food security in all regions (IAASTD, 2009).
Other studies on interdependencies between sectors include the Australia – United States Studies Centre project on Climate, Energy and Water and associated policy forums (AUSCEW, 2010), and a Land and Water Australia report Climate, energy and water – Accounting for the links (Proust et al., 2007). Some commentators argue that Australia has done better than any other arid nation in the world in its water management, in the face of the “stress test” imposed by a decade-long drought (CEDA, 2010), while others are critical of agricultural water use which has led to widespread environmental degradation (Finlayson, 2010).
6.2.1 BiofuelsThe rapidly expanding international appetite for biofuels is arguably one of the more complex issues facing the world today, linking issues of water, energy, food, national security and climate change. Initially thought to be a panacea for replacing fossil fuels, the rapid increase in first generation biofuel production has increased the demand for agricultural land, driving up food prices and providing incentives for more deforestation at the expense of natural ecosystems. These biofuel crops require large quantities of water – already a major constraint to agriculture in much of the world (IWMI, 2008; Dominguez-Faus, 2009). The water footprint of biofuels ranges from 1000 to 20,000 litres of water per litre of biofuel (Gerbens-Leenes et al., 2009).
First-generation biofuels consist predominantly of bio-ethanol and biodiesel produced from agricultural crops (e.g. maize, sugar cane). The environmental effects of their land and water requirements are of global concern (IAASTD, 2009). Advanced or second-generation biofuels derived from biomass sources that do not compete with food production use more abundant and cheaper feedstocks and could potentially reduce agricultural land requirements per unit of energy produced and improve whole-of-life-cycle greenhouse-gas emissions. However, advanced biofuels technologies are not yet commercially
Figure 6.10 System diagram for risks associated with the water-food-energy nexus
Source: World Economic Forum, 2011
Foodsecurity• Food crisis• Social unrest
Watersecurity• Chronic shortages• Drag on growth• Water crisis• Social unrest
Energysecurity• Chronic shortages• Drag on growth• Energy crisis• Economic damage• Social unrest
Populationand economicgrowth
Environmentalpressures
Geopoliticalcon�ict
Water intensity offood production
Energy intensityof food production
Water intensity ofenergy production
Energy intensityof water production
Globalgovernance
failures
Economicdisparity
SUSTAINABLE WATER MANAGEMENT
74
ww
w.a
tse.
org.
au
The Australian Academy of Technological Sciences and Engineering (ATSE)
proven and environmental and social effects are still uncertain. Improvements are needed in efficiency, cost and overall sustainability and substantial further investment in research is required to make biofuels commercially viable (IEA, 2011a). Australia’s copious supply of brackish and saline water in regional areas could be used for the production of algae feedstocks. Much more focused, collaborative R&D is needed before algal biofuels can be competitive with fossil fuels and other biofuels (Thomas and Wright, 2008).
In many cases biofuel greenhouse-gas impacts are negative – more energy is used to clear, plant, harvest, refine and transport the resource than is captured in the biofuel itself (Dalla Marta et al., 2011). The Productivity Commission (2011c) estimated that the cost of greenhouse-gas abatement using biofuels is of the order of $300–$400/tonne of CO2-e.
At present, biofuels only appear to be financially viable with the help of government subsidies and incentives. Such policies may be justified on the basis of national fuel security or sector and regional interests.
6.2.2 BiosequestrationAustralia’s agricultural sector generates around 15 per cent of national GHG emissions and a further 13 per cent from deforestation and land clearing for agriculture (Eady et al., 2009; CSIRO, 2011b). The Commonwealth Government’s Carbon Farming Initiative (CFI) offers financial incentives to farmers to sequester carbon through forestry or reduced tillage. Carbon credits generated are sold through the carbon market to companies able to offset up to five per cent of their emissions during the first three years of fixed carbon price, July 2012 to July 2015.
However, trees planted for forestry use water and reduce runoff into streams. A CSIRO analysis of opportunities for carbon forestry warns that including carbon plantings in a legislated carbon market could lead to competition between trees and land for food production and water resources. The study found that a carbon price of over $40/ton of CO2-e would be needed to make carbon forestry viable. The analysis assumes that water for plantings would cost $500 to $2000 per ML (Polglase et al., 2011).
An investigation on the impact on water supplies from plantation forestry by the National Water Commission found that evapotranspiration from existing plantations is around 2000 GL per year greater than it would have been had the land been used for dryland agriculture or other non-forest activities. In addition, some plantations use groundwater in regions with shallow watertables, which may equate to several hundred GL per year of additional water use across existing plantation estates (SKM, CSIRO and Bureau of Rural Sciences, 2010).
Water entitlements may be required for new forestry plantations. Since 31 July 2007, the policy for implementing the Lower South East forest permit system in the South Australian South-East Natural Resource Management Board area manages the direct extraction of groundwater by plantation forests planted on shallow water tables (less than six metre depth to the water table). Under the system, the forest owner is required to apply for threshold water to offset the direct extraction impacts of proposed new forest developments. Where there is insufficient forest threshold expansion opportunity available in a particular Water Resource Management Area to support a proposal for a new or expanded plantation, approval can be granted subject to conditions being met. These may require the proponent to offset the full water resource impacts of the plantation by entering into a management agreement, under the NRM Act, and securing and quarantining offsetting water entitlements. Similar means of managing “inflow interception activities” were agreed by the states under the NWI, but with the exception of South Australia, have not been implemented (NWC, 2009, 2011).
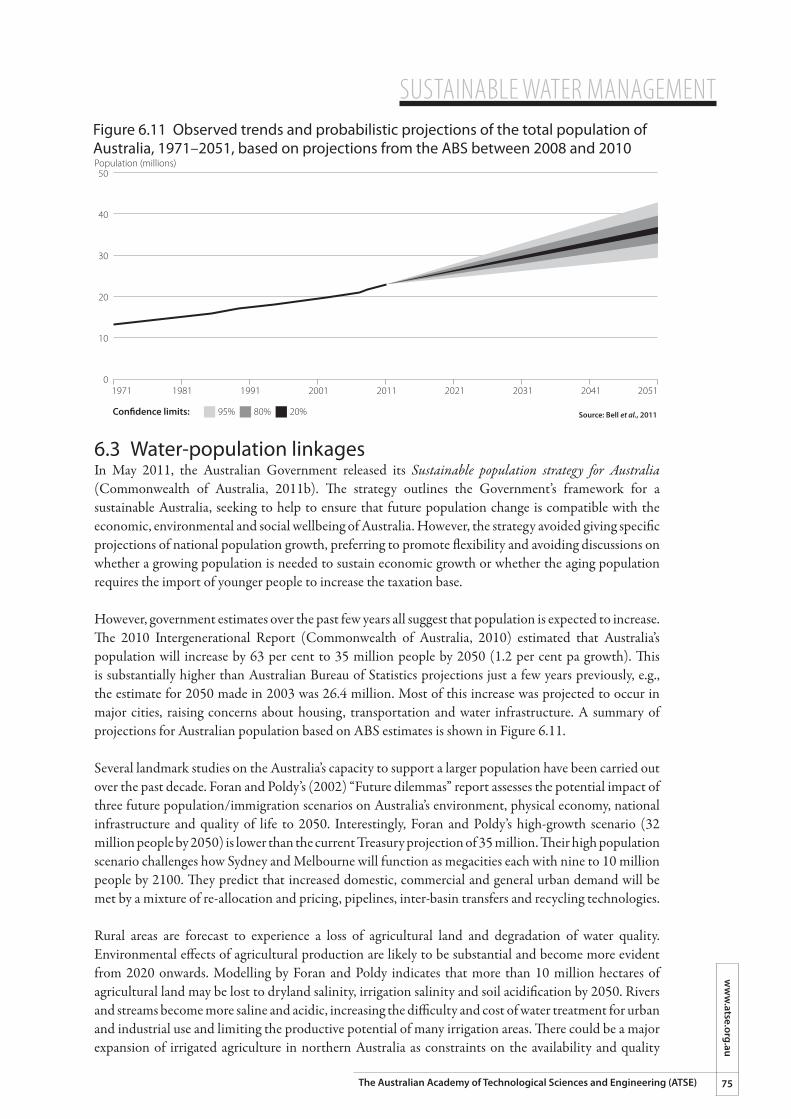
SUSTAINABLE WATER MANAGEMENTw
ww
.atse.org.au
75The Australian Academy of Technological Sciences and Engineering (ATSE)
6.3 Water-population linkagesIn May 2011, the Australian Government released its Sustainable population strategy for Australia (Commonwealth of Australia, 2011b). The strategy outlines the Government’s framework for a sustainable Australia, seeking to help to ensure that future population change is compatible with the economic, environmental and social wellbeing of Australia. However, the strategy avoided giving specific projections of national population growth, preferring to promote flexibility and avoiding discussions on whether a growing population is needed to sustain economic growth or whether the aging population requires the import of younger people to increase the taxation base.
However, government estimates over the past few years all suggest that population is expected to increase. The 2010 Intergenerational Report (Commonwealth of Australia, 2010) estimated that Australia’s population will increase by 63 per cent to 35 million people by 2050 (1.2 per cent pa growth). This is substantially higher than Australian Bureau of Statistics projections just a few years previously, e.g., the estimate for 2050 made in 2003 was 26.4 million. Most of this increase was projected to occur in major cities, raising concerns about housing, transportation and water infrastructure. A summary of projections for Australian population based on ABS estimates is shown in Figure 6.11.
Several landmark studies on the Australia’s capacity to support a larger population have been carried out over the past decade. Foran and Poldy’s (2002) “Future dilemmas” report assesses the potential impact of three future population/immigration scenarios on Australia’s environment, physical economy, national infrastructure and quality of life to 2050. Interestingly, Foran and Poldy’s high-growth scenario (32 million people by 2050) is lower than the current Treasury projection of 35 million. Their high population scenario challenges how Sydney and Melbourne will function as megacities each with nine to 10 million people by 2100. They predict that increased domestic, commercial and general urban demand will be met by a mixture of re-allocation and pricing, pipelines, inter-basin transfers and recycling technologies.
Rural areas are forecast to experience a loss of agricultural land and degradation of water quality. Environmental effects of agricultural production are likely to be substantial and become more evident from 2020 onwards. Modelling by Foran and Poldy indicates that more than 10 million hectares of agricultural land may be lost to dryland salinity, irrigation salinity and soil acidification by 2050. Rivers and streams become more saline and acidic, increasing the difficulty and cost of water treatment for urban and industrial use and limiting the productive potential of many irrigation areas. There could be a major expansion of irrigated agriculture in northern Australia as constraints on the availability and quality
Figure 6.11 Observed trends and probabilistic projections of the total population of Australia, 1971–2051, based on projections from the ABS between 2008 and 2010
50
40
30
20
10
0
Population (millions)
1971 1981 1991 2001 2011 2021 2031 2041 2051
Source: Bell et al., 201195%Con�dence limits: 80% 20%
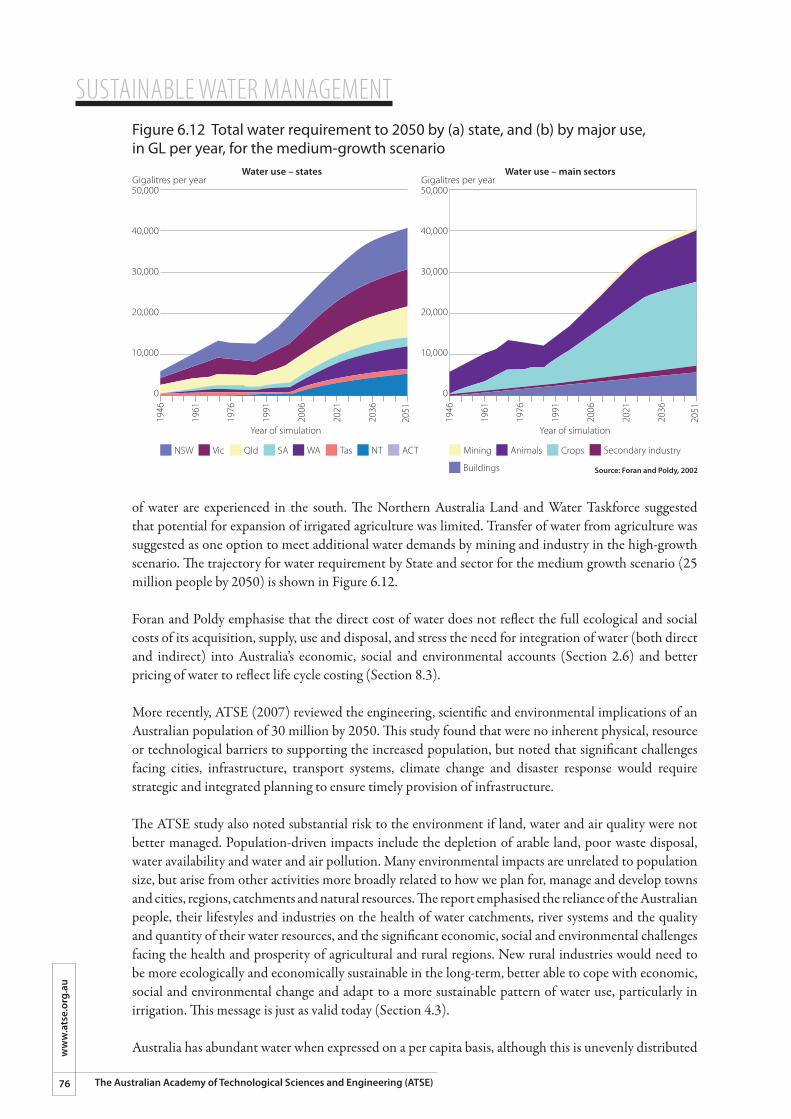
SUSTAINABLE WATER MANAGEMENT
76
ww
w.a
tse.
org.
au
The Australian Academy of Technological Sciences and Engineering (ATSE)
of water are experienced in the south. The Northern Australia Land and Water Taskforce suggested that potential for expansion of irrigated agriculture was limited. Transfer of water from agriculture was suggested as one option to meet additional water demands by mining and industry in the high-growth scenario. The trajectory for water requirement by State and sector for the medium growth scenario (25 million people by 2050) is shown in Figure 6.12.
Foran and Poldy emphasise that the direct cost of water does not reflect the full ecological and social costs of its acquisition, supply, use and disposal, and stress the need for integration of water (both direct and indirect) into Australia’s economic, social and environmental accounts (Section 2.6) and better pricing of water to reflect life cycle costing (Section 8.3).
More recently, ATSE (2007) reviewed the engineering, scientific and environmental implications of an Australian population of 30 million by 2050. This study found that were no inherent physical, resource or technological barriers to supporting the increased population, but noted that significant challenges facing cities, infrastructure, transport systems, climate change and disaster response would require strategic and integrated planning to ensure timely provision of infrastructure.
The ATSE study also noted substantial risk to the environment if land, water and air quality were not better managed. Population-driven impacts include the depletion of arable land, poor waste disposal, water availability and water and air pollution. Many environmental impacts are unrelated to population size, but arise from other activities more broadly related to how we plan for, manage and develop towns and cities, regions, catchments and natural resources. The report emphasised the reliance of the Australian people, their lifestyles and industries on the health of water catchments, river systems and the quality and quantity of their water resources, and the significant economic, social and environmental challenges facing the health and prosperity of agricultural and rural regions. New rural industries would need to be more ecologically and economically sustainable in the long-term, better able to cope with economic, social and environmental change and adapt to a more sustainable pattern of water use, particularly in irrigation. This message is just as valid today (Section 4.3).
Australia has abundant water when expressed on a per capita basis, although this is unevenly distributed
Figure 6.12 Total water requirement to 2050 by (a) state, and (b) by major use, in GL per year, for the medium-growth scenario
50,000
40,000
30,000
20,000
10,000
0
Gigalitres per yearWater use – states
NSW Vic
1946
1961
1976
2036
2021
2006
1991
2051
Source: Foran and Poldy, 2002
Qld SA WA Tas NT ACT Mining Secondary industry
Buildings
Animals Crops
Year of simulation
50,000
40,000
30,000
20,000
10,000
0
Gigalitres per yearWater use – main sectors
1946
1961
1976
2036
2021
2006
1991
2051
Year of simulation
SUSTAINABLE WATER MANAGEMENTw
ww
.atse.org.au
77The Australian Academy of Technological Sciences and Engineering (ATSE)
around the continent. A study by Rutherfurd and Finlayson (2011) on whether water could constrain Australia’s population concluded that the supply of water for cities and for food production would not be a major factor limiting the growth of Australia's population and that the size of the population is less important than how water resources are managed.
WSAA predicts that the volume of water required to meet population growth in Australia’s major cities over the next 50 years could be over 600 GL per annum by 2026 and between 960 and 1600 GL by 2056, depending on population projections (WSAA, 2010b). The technological advances identified by ATSE (2007) that would be most relevant to the urban water industry would be re-use and recycling and improved membrane technology for treatment of effluent, wastewater and seawater. Gill (2011), in a study of water provision for a growing Australia, concludes that water supply for larger urban populations could be met through pricing signals, technological innovation, alternative water sources and demand management. Technological opportunities include efficiency gains through water efficient appliances and housing design, reduction in water leakage in distribution systems (urban and rural), water reuse (recycling) and distributed storage (for example, rainwater tanks and managed aquifer recharge).
As noted by the Productivity Commission (2011e), improvements in technology such as in energy efficiency and in waste processing technologies can ameliorate potential ecological pressures from increasing population (while cautioning that future innovation should not be solely relied upon to solve environmental problems). Consumption and production behaviour are also important – a community that is more highly oriented towards the production of services and other skill-intensive activities is likely to generate less pollution than a community that relies heavily on some types of heavy manufacturing.
SUSTAINABLE WATER MANAGEMENT
78
ww
w.a
tse.
org.
au
The Australian Academy of Technological Sciences and Engineering (ATSE)
7. Portfolio options for a large city: Adelaide case study
Most metropolitan water utilities have plans to secure water supplies for the next 20 to 40 years, diversifying supply to include desalination, stormwater harvesting, wastewater recycling and groundwater access, with strategies to stabilise or reduce demand (Chapter 8). To illustrate such decisions and tradeoffs faced
Chapter Summary This chapter contains a case study of the choices available to a major Australian city with a range of water supply options, under uncertainties of unpredictable rainfall, climate change and growing population. Adelaide was chosen for this example as it has access to a range of water sources and has major stormwater harvesting and wastewater recycling programs in place. One key externality, greenhouse gas emissions from energy use, is included in the calculations. In practice, a much wider range of externalities, including community and environmental benefits and disbenefits (Sections 2.7 and 8.3) would be included in a complete analysis; however these would need to be underpinned by extensive research and community consultation.¢ �Most metropolitan water utilities have developed plans to secure water supplies for the next 20-
40 years, via a combination of diversification of supply sources and demand management, with assumptions on population and climate projections.
¢ �Most plans include increased use of desalination and recycling. Other supply options depend on local conditions – Sydney has large surface catchment reservoirs, Perth can access groundwater and Adelaide has the River Murray. Each plan is based on uncertain climate projections and assumptions on demand, energy prices and cost of greenhouse-gas emissions. Some plans provide a large degree of flexibility and are adaptable to change; others have large locked-in investments in long-term infrastructure.
¢ �To illustrate the decisions and tradeoffs faced by a large urban water utility, a detailed water balance model has been developed for the Adelaide metropolitan region.
¢ �The operating cost of water supplied from various sources ranges from $0.20/kL for rain-fed reservoirs in the Mt Lofty Ranges to $0.44/kL for water pumped from the River Murray and $1.00/kL for desalination.
¢ �The energy intensity is low (0.3 MWh/ML) for water from the Mt Lofty Ranges reservoirs, rising to 1.9 MWh/ML for water pumped from the River Murray and 5.0 MWh/ML for desalination.
¢ �Operating costs for stormwater harvesting and wastewater reuse for non-potable purposes are $0.55/kL and $0.70/kL, with energy intensities 0.8 MWh/ML and 1.3 MWh/ML respectively.
¢ �In practice, maximum flexibility is provided by a using portfolio of sources, which can be varied in response to changes in climate, demand and input costs.
¢ �It would be technically feasible to source all of Adelaide’s water from the River Murray, provided that water could be purchased on the open market. This would require the construction of a new pipeline from the River Murray but would have obviated the need for expensive desalination.
¢ �Stormwater harvesting and wastewater reuse for non-potable supply have greater community acceptability than desalination, but are more expensive than other sources. They have the disadvantage of requiring a third-pipe network with the associated risk of cross connections. Indirect potable use of stormwater or reclaimed wastewater, or potable reuse after suitable treatment, could become more attractive in the future.
SUSTAINABLE WATER MANAGEMENTw
ww
.atse.org.au
79The Australian Academy of Technological Sciences and Engineering (ATSE)
by a large urban water utility under the challenge of climate change and growing demand, a detailed water balance model was constructed for the Adelaide metropolitan region (defined by Government of South Australia, 2009). The model, described in detail in Appendices A and B, investigates the impacts of drawing water from various sources, and calculates the cost, energy requirements, associated greenhouse emissions and security of supply from different source combinations.
The model simulates operation of a large integrated system consisting of a number of alternative water sources supplying Metropolitan Adelaide with 170 to 220 GL/yr between 2010 and 2050.
The Adelaide water supply system currently draws water from reservoirs in the Mount Lofty Ranges, supplemented with water from the River Murray. A new desalination plant commenced operation in late 2011. In addition, there is some harvesting, treatment and use of stormwater as well as reuse of treated wastewater effluent, currently for non-potable purposes. Whilst the current water sources are adequate to provide a secure supply for the foreseeable future, the model is used to explore a number of “what if ” scenarios of source combinations and climate.
The capital cost of existing infrastructure such as the major reservoirs and pipelines from the River Murray is not considered in this study, since these assets were built decades ago and their cost is now considered a ‘sunk cost’. However, the study does include the marginal cost of bringing on-line new supplementary sources such as desalination, stormwater harvesting and wastewater reuse (See section 8.2 for definitions of marginal cost).
The estimated operating cost (primarily electricity and water treatment), energy consumption and associated greenhouse gas emissions for each source are given in Table 7.1. The estimated operating cost of desalination in this table is somewhat higher than the figures given in Figure 5.3 due, in part, to the fact that an electricity cost of $0.15 per kWh has been assumed to allow for anticipated increases in the real price of electricity over the next 40 years.
Table 7.1 Operating cost, energy consumption and greenhouse gas emissions for various water supply options for Adelaide (details in Appendix A).
Source Operating cost ($/kL)
Energy consumption
(MWh/ML)
Greenhouse-gas emissions
(tonnes CO2-e/ML)Mt Lofty Ranges 0.20 0.3 0.24
River Murray 0.44* 1.9* 1.54*
Desalination 1.00 5.0 4.10
Stormwater harvesting 0.55 0.8 0.65
Wastewater reuse 0.70 1.3 1.05* These are average values. More accurate values were determined using a detailed hydraulic analysis as described in Appendix B.
The actual greenhouse-gas emissions for each source will depend on the mix of energy sources used in electricity generation. In this study, a South Australian average of 0.81 tonnes of CO2-e/MWh is used (Department of Climate Change and Energy Efficiency, 2011). There are clearly other externalities associated with the various water supply sources, including environmental impacts on the urban environment, local catchments and rivers, the River Murray, Lower Lakes and Coorong as well as discharges to coastal waters adjacent to the City of Adelaide. Ideally, these externalities would be included in a more comprehensive analysis, as in the examples in Section 2.7.
The lowest-cost high quality water is from the Mt Lofty catchments and reservoirs, which have around 200 GL storage capacity, including 26 GL of ‘dead’ storage that is inaccessible with current infrastructure. The Mt Lofty option is dependent on the vagaries of climate and rainfall. In the modelling it is assumed
SUSTAINABLE WATER MANAGEMENT
80
ww
w.a
tse.
org.
au
The Australian Academy of Technological Sciences and Engineering (ATSE)
that the storage is not allowed to drop below 65 GL in summer and 55 GL in winter, based on operational requirements and the need to maintain at least 6 weeks consumption in storage to allow for unexpected breakdowns of pumps or other equipment. The Mt Lofty Ranges storages supply between 25 per cent and 62 per cent of Adelaide’s annual water needs during the simulated period 2010 to 2050. If the reservoir drawdown were allowed to be greater (for instance if additional water could be sourced from the Murray or seawater desalination), then Mt Lofty storages could supply more of Adelaide’s water requirements, but would still be insufficient to meet total demand.
The second option, water pumped from the River Murray, is less than half the cost of desalinated water, and could feasibly supply all of Adelaide’s water if transfer capacity was increased by constructing another pipeline. This is based on the assumption that water is available for purchase from other licence holders in the MDB system. Most of the operating cost is electricity required to pump the water 70km through three pipelines that release water to watercourses that flow into various water supply catchments or supply water directly to one of the water treatment plants. One of these pipelines also supplies water to the northern and western parts of the state. The estimated cost of $0.44/kL is based on the assumption that the city has a water entitlement of 130GL/year, and any additional water required can be purchased on the water market for an assumed price of $0.25/kL. If all the River Murray water used had to be purchased at this price, the operating cost of the River Murray option would rise from $0.44/kL to $0.69/kL. During times of drought, if the price of purchasing high reliability water from the Murray Darling Basin rose above $0.56/kL desalination would become the cheaper option, based on a comparison of operating cost alone. In reality, the decision of when to utilise the desalination plant will depend on the availability and costs of all possible water sources as well as the contractual arrangements for the provision of water from the desalination plant. The contract is likely to include a payment per kL of water delivered and a payment per year (or month) regardless of the volume delivered by the plant.
The existing pipelines have a total capacity to deliver around 320GL/year to Adelaide, but are not located in a suitable layout to meet all of the city’s demand. In order to achieve this, further investment in pipes and pumps would be required. Additional major infrastructure linking the northern and southern parts of the Adelaide reticulation system, initially to enable transport of desalinated water from the south to the north of the City, is currently under construction. This infrastructure will enable better integration of the city’s water supply from all sources.
The most expensive source, desalination, is also the most reliable, being independent of rainfall. Adelaide’s desalination plant (Section 5.3), when completed, will have a capacity of 100GL/yr, will cost $1.83 million and will be able to meet about half of Adelaide’s demand. Theoretically, the size of the desalination plant could be doubled to meet the entire demand of Adelaide, should this be publicly, politically and economically acceptable.
Harvesting stormwater and reuse of wastewater have higher operating costs than pumping water from the River Murray. This difference is offset by the environmental benefits of reducing the discharge of pollution to the coastal receiving waters and the lower greenhouse gas emissions associated with these sources. South Australian government policy currently restricts stormwater and reclaimed wastewater to non-potable industrial use, watering of public open spaces, domestic gardens and toilet flushing. While the use of stormwater and recycled wastewater for non-potable purposes is politically and socially desirable, it represents a relatively expensive source of water compared to catchment and river water.
In the model, it is assumed that the stormwater and reclaimed wastewater volume replaces mains water and is distributed through a third-pipe network, and that aquifer storage is available. Stormwater supplies up to 21 per cent of demand in the simulated results, and reclaimed wastewater up to eight per cent. The capital cost of the stormwater schemes is estimated to be $500 million, with the third pipe distribution network
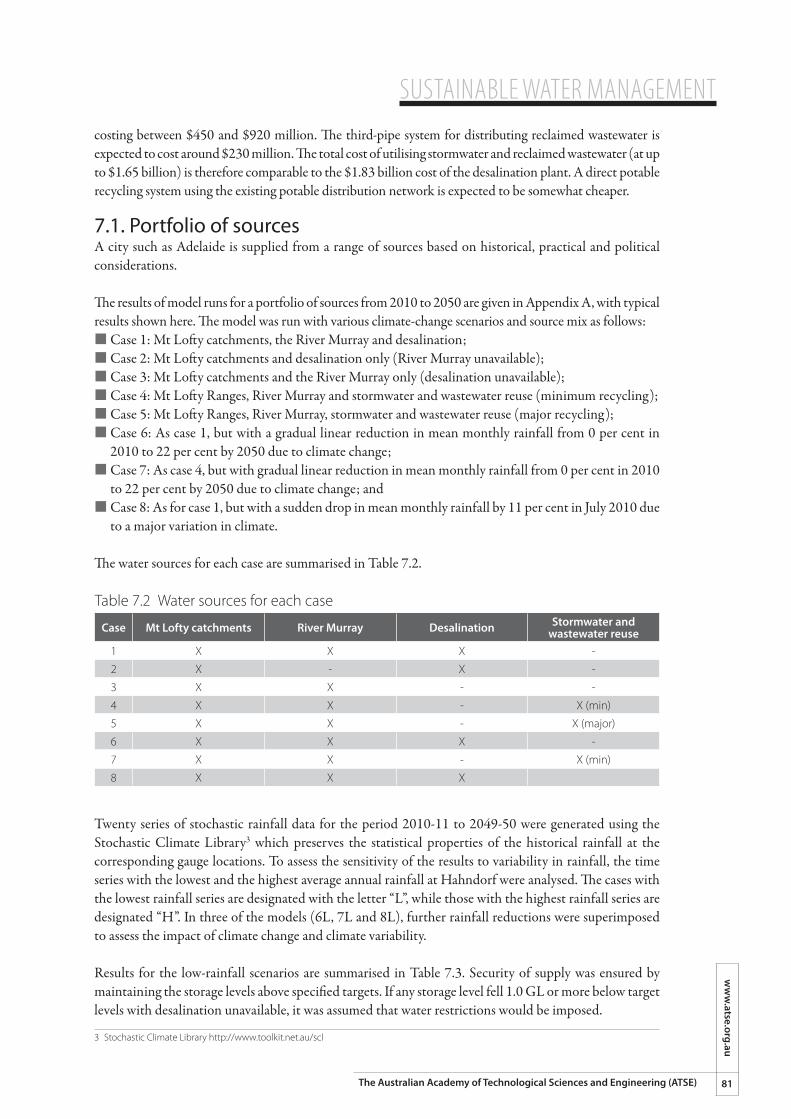
SUSTAINABLE WATER MANAGEMENTw
ww
.atse.org.au
81The Australian Academy of Technological Sciences and Engineering (ATSE)
costing between $450 and $920 million. The third-pipe system for distributing reclaimed wastewater is expected to cost around $230 million. The total cost of utilising stormwater and reclaimed wastewater (at up to $1.65 billion) is therefore comparable to the $1.83 billion cost of the desalination plant. A direct potable recycling system using the existing potable distribution network is expected to be somewhat cheaper.
7.1. Portfolio of sourcesA city such as Adelaide is supplied from a range of sources based on historical, practical and political considerations.
The results of model runs for a portfolio of sources from 2010 to 2050 are given in Appendix A, with typical results shown here. The model was run with various climate-change scenarios and source mix as follows:¢�Case 1: Mt Lofty catchments, the River Murray and desalination;¢�Case 2: Mt Lofty catchments and desalination only (River Murray unavailable);¢�Case 3: Mt Lofty catchments and the River Murray only (desalination unavailable);¢�Case 4: Mt Lofty Ranges, River Murray and stormwater and wastewater reuse (minimum recycling);¢�Case 5: Mt Lofty Ranges, River Murray, stormwater and wastewater reuse (major recycling);¢�Case 6: As case 1, but with a gradual linear reduction in mean monthly rainfall from 0 per cent in
2010 to 22 per cent by 2050 due to climate change;¢�Case 7: As case 4, but with gradual linear reduction in mean monthly rainfall from 0 per cent in 2010
to 22 per cent by 2050 due to climate change; and¢�Case 8: As for case 1, but with a sudden drop in mean monthly rainfall by 11 per cent in July 2010 due
to a major variation in climate.
The water sources for each case are summarised in Table 7.2.
Table 7.2 Water sources for each case
Case Mt Lofty catchments River Murray Desalination Stormwater and wastewater reuse
1 X X X -
2 X - X -
3 X X - -
4 X X - X (min)
5 X X - X (major)
6 X X X -
7 X X - X (min)
8 X X X
Twenty series of stochastic rainfall data for the period 2010-11 to 2049-50 were generated using the Stochastic Climate Library3 which preserves the statistical properties of the historical rainfall at the corresponding gauge locations. To assess the sensitivity of the results to variability in rainfall, the time series with the lowest and the highest average annual rainfall at Hahndorf were analysed. The cases with the lowest rainfall series are designated with the letter “L”, while those with the highest rainfall series are designated “H”. In three of the models (6L, 7L and 8L), further rainfall reductions were superimposed to assess the impact of climate change and climate variability.
Results for the low-rainfall scenarios are summarised in Table 7.3. Security of supply was ensured by maintaining the storage levels above specified targets. If any storage level fell 1.0 GL or more below target levels with desalination unavailable, it was assumed that water restrictions would be imposed.
3 Stochastic Climate Library http://www.toolkit.net.au/scl
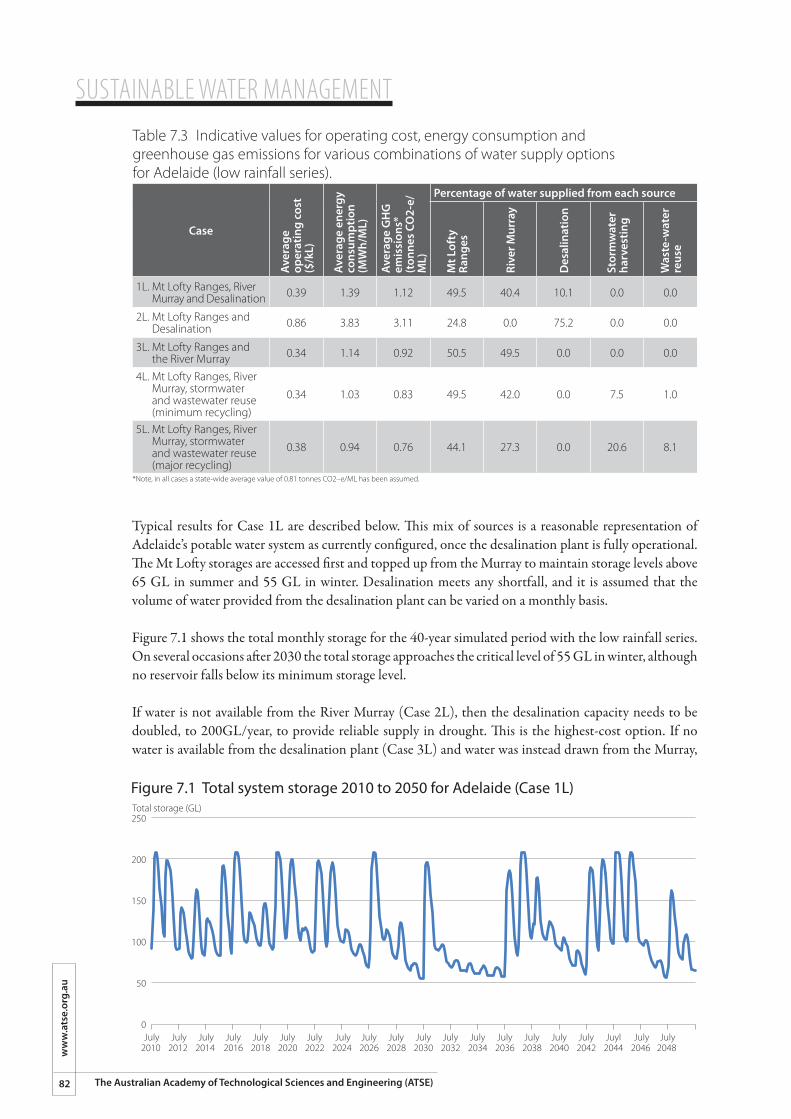
SUSTAINABLE WATER MANAGEMENT
82
ww
w.a
tse.
org.
au
The Australian Academy of Technological Sciences and Engineering (ATSE)
Table 7.3 Indicative values for operating cost, energy consumption and greenhouse gas emissions for various combinations of water supply options for Adelaide (low rainfall series).
Case
Aver
age
oper
atin
g co
st
($/k
L)
Aver
age
ener
gy
cons
umpt
ion
(MW
h/M
L)
Aver
age
GH
G
emis
sion
s*
(ton
nes
CO2-
e/M
L)
Percentage of water supplied from each source
Mt L
ofty
Ra
nges
Rive
r Mur
ray
Des
alin
atio
n
Stor
mw
ater
ha
rves
ting
Was
te-w
ater
re
use
1L. Mt Lofty Ranges, River Murray and Desalination 0.39 1.39 1.12 49.5 40.4 10.1 0.0 0.0
2L. Mt Lofty Ranges and Desalination 0.86 3.83 3.11 24.8 0.0 75.2 0.0 0.0
3L. Mt Lofty Ranges and the River Murray 0.34 1.14 0.92 50.5 49.5 0.0 0.0 0.0
4L. Mt Lofty Ranges, River Murray, stormwater and wastewater reuse (minimum recycling)
0.34 1.03 0.83 49.5 42.0 0.0 7.5 1.0
5L. Mt Lofty Ranges, River Murray, stormwater and wastewater reuse (major recycling)
0.38 0.94 0.76 44.1 27.3 0.0 20.6 8.1
*Note, in all cases a state-wide average value of 0.81 tonnes CO2–e/ML has been assumed.
Typical results for Case 1L are described below. This mix of sources is a reasonable representation of Adelaide’s potable water system as currently configured, once the desalination plant is fully operational. The Mt Lofty storages are accessed first and topped up from the Murray to maintain storage levels above 65 GL in summer and 55 GL in winter. Desalination meets any shortfall, and it is assumed that the volume of water provided from the desalination plant can be varied on a monthly basis.
Figure 7.1 shows the total monthly storage for the 40-year simulated period with the low rainfall series. On several occasions after 2030 the total storage approaches the critical level of 55 GL in winter, although no reservoir falls below its minimum storage level.
If water is not available from the River Murray (Case 2L), then the desalination capacity needs to be doubled, to 200GL/year, to provide reliable supply in drought. This is the highest-cost option. If no water is available from the desalination plant (Case 3L) and water was instead drawn from the Murray,
Figure 7.1 Total system storage 2010 to 2050 for Adelaide (Case 1L)
250
200
150
100
50
0
Total storage (GL)
July2010
July2012
July2014
July2016
July2018
July2020
July2022
July2024
July2026
July2028
July2030
July2032
July2034
July2036
July2038
July2040
July2042
Juyl2044
July2046
July2048
SUSTAINABLE WATER MANAGEMENTw
ww
.atse.org.au
83The Australian Academy of Technological Sciences and Engineering (ATSE)
then water restrictions are needed about 15 per cent of the time, in drought periods. This could be overcome by building a new pipeline and buying up to 65GL of water per year from the river in addition to the current annual entitlement of 130GL, assuming that traded water were available for purchase.
The cost of Cases 4L and 5L also exclude desalination but expand stormwater harvesting and wastewater reuse to replace non-potable uses. For Case 4L, the capital cost of building and operating the stormwater and wastewater reuse schemes is significantly lower than desalination, while it is comparable for case 5L (details are given in Appendix A). The reliability of the desalination plant is higher than that of harvested stormwater as it is not dependent on rainfall. For Case 5L, stormwater supplies 21 per cent over the 40-year period and reclaimed wastewater eight per cent.
Table 7.4 summarises the results for the high rainfall series for the 40-year simulated period.
Table 7.4 Indicative values for operating cost, energy consumption and greenhouse gas emissions for various combinations of water supply options for Adelaide (high rainfall series)
Case
Aver
age
op
erat
ing
cost
($
/kL)
Aver
age
ener
gy
cons
umpt
ion
(M
Wh/
ML)
Aver
age
GH
G
emis
sion
s* (t
onne
s CO
2-e/
ML)
Percentage of water supplied from each source
Mt L
ofty
Ra
nges
Rive
r Mur
ray
Des
alin
atio
n
Stor
mw
ater
ha
rves
ting
Was
te-w
ater
re
use
1H. Mt Lofty Ranges, River Murray and Desalination
0.34 1.15 0.93 60.7 31.2 8.1 0.0 0.0
2H. Mt Lofty Ranges and Desalination 0.79 3.47 2.81 32.5 0.0 67.5 0.0 0.0
3H. Mt Lofty Ranges and the River Murray 0.29 0.89 0.73 62.1 37.9 0.0 0.0 0.0
4H. Mt Lofty Ranges, River Murray, stormwater and wastewater reuse (minimum recycling)
0.30 0.83 0.67 61.0 31.8 0.0 6.2 1.0
5H. Mt Lofty Ranges, River Murray, stormwater and wastewater reuse (major recycling)
0.35 0.74 0.60 54.4 17.6 0.0 20.4 7.7
The results are similar in most respects to the low rainfall series. Not surprisingly, Mt Lofty catchments were able to supply significantly more water, thereby reducing water from the Murray and lowering operating costs (in Case 1 from $0.39/kL to $0.34/kL). Desalination is little changed in Case 1 (Mt Lofty Ranges, River Murray and desalination), but decreases from 75 per cent to 68 per cent for the higher rainfall series for Case 2.
Stormwater harvesting and wastewater reuse (Cases 4 and 5) are similar for both low and high rainfall scenarios.
7.2 Effect of climate change and climate variabilityTwo cases were run to simulate additional reductions in rainfall over the simulated 40-year time period, superimposed on the low rainfall series. In the first (Cases 6L and 7L) the mean annual rainfall decreases linearly from 0 per cent to a 22 per cent reduction from 2010 to 2050, and in the second (Case 8L) there is a sudden drop in mean annual rainfall by 11% in the first year of the simulation and this is maintained for the 40-year simulation.
SUSTAINABLE WATER MANAGEMENT
84
ww
w.a
tse.
org.
au
The Australian Academy of Technological Sciences and Engineering (ATSE)
Case 6L reduces supply from Mt Lofty from 50 per cent to 38 per cent and the River Murray increases from 40 per cent to 50 per cent. Desalination increases from 10 per cent to 12 per cent (maximum 32 GL in any one year). In Case 7L with harvested stormwater and recycled wastewater, the Murray supply increases with only small changes in stormwater and wastewater. Case 8L has similar supply impacts to Case 6L.
7.3. DiscussionThis study highlights water supply issues facing coastal cities. There are clear advantages of diversification in periods of low rainfall. The historical dependence on surface water storages via a few large dams, as in Sydney, Melbourne and Brisbane makes them highly vulnerable in the face of extreme drought, climate variability or climate change. Adelaide has the advantage of being able to access water from the River Murray, and Perth obtains between 35 per cent and 50 per cent of its water from groundwater, although both of these sources are stressed in periods of drought.
Seawater desalination has been the preferred diversification choice for major coastal cities, but is the most expensive option, in terms of both capital and operating costs and greenhouse-gas emissions. For Adelaide, desalination could be replaced by increasing supply from the Murray, assuming water is available on the market. Even during drought, Adelaide’s consumption would be a small fraction of that used for irrigation in the Murray–Darling Basin. This option would require a new pipeline from the River Murray and associated pumping stations and storages, which would need to be taken into account in comparing total costs. For many cities, the cost of pumping water substantial distances may be lower than building a desalination plant (Box 6 in Section 6.1.2).
One advantage of desalination is that it provides a level of “insurance” against extreme drought conditions, as it is independent of rainfall. However the unit cost of water from desalination is strongly dependent on the plant’s utilisation rate – running at less than full capacity raises the levelised cost of water supplied. Access to a broad portfolio of sources reduces risk since is not possible to know everything that we would like to know about the future.
The Adelaide study illustrates the linkages between water supply, energy and associated greenhouse-gas emissions. Each source has a different energy intensity and the mix of water sources can have a dramatic effect on the total energy consumption by the utility. With rapidly rising electricity prices, the move towards lower-energy options is likely to intensify.
In summary, rain-fed catchments provide the lowest-cost water, but volumes are insufficient and too unreliable to meet demand. Sourcing water from the River Murray is the next lowest-cost option, as long as water can be purchased on the open market. Even in times of drought, when the price of water traded on the open market would be expected to be high, Murray water could still be cheaper than desalination when capital costs are taken into account. Desalination is the most expensive option of all and is the most susceptible to rising electricity prices. This conclusion is consistent with analysis by the Productivity Commission (2011b), which found that “building the Port Stanvac desalination plant is a much less efficient way of augmenting Adelaide’s water supply system than purchasing irrigation entitlements.”
Harvested stormwater and reclaimed wastewater for non-potable supply appears to have greater community acceptability than energy-intensive desalination, but are more expensive than other sources such as pumping water from the River Murray. This difference may be partially offset by the environmental benefits of reducing the discharge of nutrient- and sediment-rich stormwater and wastewater effluent to the coastal receiving waters and the lower greenhouse gas emissions associated with these sources Stormwater and recycled wastewater can be used to meet demand from industry, watering of public open space and domestic gardens as well as toilet flushing. It currently has the disadvantage of requiring

SUSTAINABLE WATER MANAGEMENTw
ww
.atse.org.au
85The Australian Academy of Technological Sciences and Engineering (ATSE)
a third pipe network with the associated risk of cross connections. Indirect potable use of stormwater or reclaimed wastewater or direct potable reuse after suitable treatment could become more attractive in the future.
The Adelaide case study demonstrates the importance of policy reforms to eliminate barriers to water trading and potable use of reclaimed treated water. Large, expensive infrastructure programs such as desalination lock in costs that may be difficult to justify on a long-term basis. A diversified supply, amenable to future paths of climate and other external impacts, offers the best chance of adaptation with the greatest net economic, social and environmental benefits.
SUSTAINABLE WATER MANAGEMENT
86
ww
w.a
tse.
org.
au
The Australian Academy of Technological Sciences and Engineering (ATSE)
8. Sustainable water management
Chapter Summary This final chapter describes strategies for sustainable water management, where the three pillars of green growth (economic, environmental and societal) are brought together into one coherent whole. Financial benefits are maximised with open and transparent markets and adaptive planning; environmental outcomes through monetising ecosystem externalities wherever possible, and social values, when not monetised, through liveability criteria and government policy. It is shown that green growth principles drive economic efficiency, productivity and social prosperity.¢ �The combination of inadequate investment in infrastructure, population growth and drought has
had a depressing effect on the productivity of the water sector over the last decade.¢ �Productivity is decreased when unnecessary investments are made for infrastructure, when
externalities are not priced into goods and services, taxpayer subsidies disguise market signals and consumers are not free to make choices on the level of service they require and can afford.
¢ �Improvements to productivity will be underpinned by better resource management, more efficient use of labour and advances in technology (infrastructure for supply, distribution and treatment) as well as integration with other services such as electricity and waste disposal.
¢ �The long lifetime and capital-intensive nature of water infrastructure necessitate a careful and robust process for evaluating investment decisions.
¢ �Adaptive planning using real options for investment decisions minimises the risk of unnecessary, high-cost investments. In water planning, beset by uncertainties of demand and supply, adaptive management leads to more cost-effective investments and the ability to respond to opportunities as they arise.
¢ �Efficient water markets ensure that water is most effectively allocated between competing uses to where it has highest value.
¢ �Policy barriers to rural-urban trading and potable reuse of recycled water should be removed.¢ �Customers should be able to choose between a range of water services offered at different prices.¢ �Water pricing should reflect the value of water. Social impacts of water prices are better addressed
through social policy (e.g., low income support and safety nets) rather than water and energy pricing policy. Government subsidies for infrastructure such as desalination plants and irrigation upgrades distort and disguise the cost and value of water, and represent a transfer of national wealth to a specific sector of the community or region. Such programs may, however, be justified for socio-economic reasons – for instance desalination can be considered as insurance against severe drought with potentially devastating impact on major cities. Water savings from rural infrastructure upgrades benefit broader community interests such as tourism and social amenity, as well as the environment. Demand-side measures such as water efficiency programs may be cost-effective, but when they extend to water restrictions the external social and economic costs are born by the broader community.
¢ �Adopting green-growth principles would incorporate externalities in water pricing wherever possible, to optimise economic, environment and social outcomes.
¢ �There is a need to improve the technical and economic evaluation of water externalities so that they can be incorporated into policy decisions.
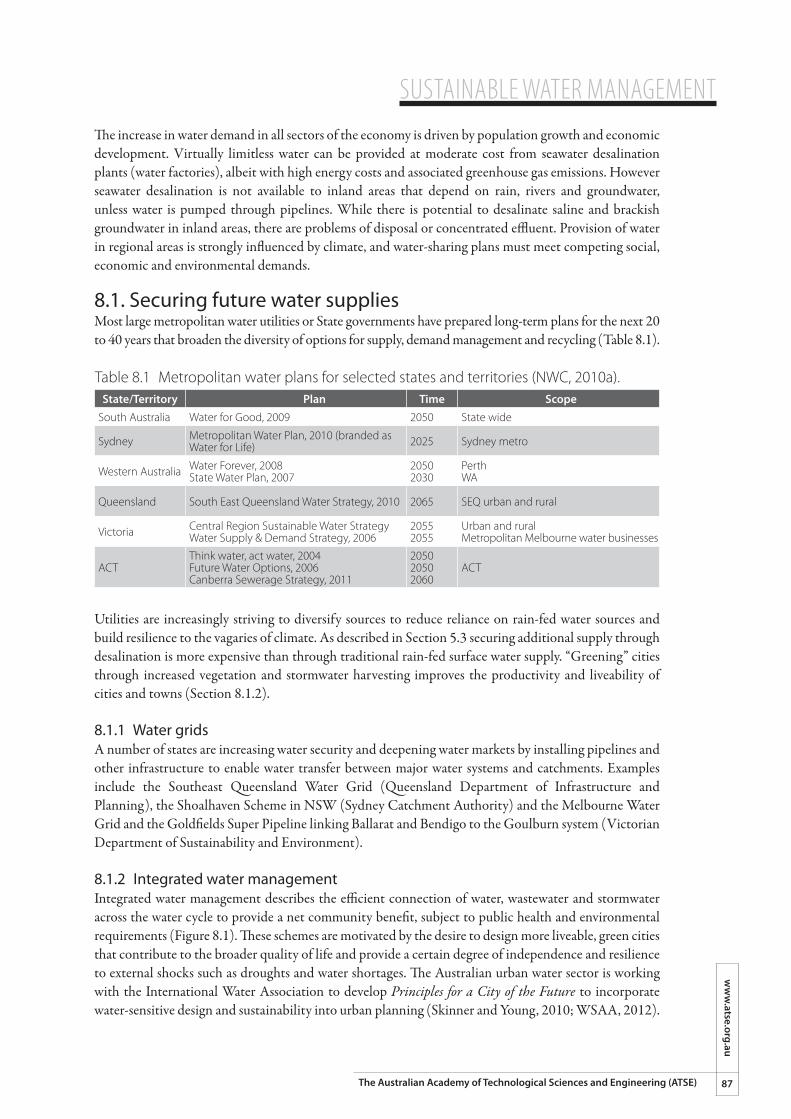
SUSTAINABLE WATER MANAGEMENTw
ww
.atse.org.au
87The Australian Academy of Technological Sciences and Engineering (ATSE)
The increase in water demand in all sectors of the economy is driven by population growth and economic development. Virtually limitless water can be provided at moderate cost from seawater desalination plants (water factories), albeit with high energy costs and associated greenhouse gas emissions. However seawater desalination is not available to inland areas that depend on rain, rivers and groundwater, unless water is pumped through pipelines. While there is potential to desalinate saline and brackish groundwater in inland areas, there are problems of disposal or concentrated effluent. Provision of water in regional areas is strongly influenced by climate, and water-sharing plans must meet competing social, economic and environmental demands.
8.1. Securing future water suppliesMost large metropolitan water utilities or State governments have prepared long-term plans for the next 20 to 40 years that broaden the diversity of options for supply, demand management and recycling (Table 8.1).
Table 8.1 Metropolitan water plans for selected states and territories (NWC, 2010a).State/Territory Plan Time Scope
South Australia Water for Good, 2009 2050 State wide
Sydney Metropolitan Water Plan, 2010 (branded as Water for Life) 2025 Sydney metro
Western Australia Water Forever, 2008State Water Plan, 2007
20502030
PerthWA
Queensland South East Queensland Water Strategy, 2010 2065 SEQ urban and rural
Victoria Central Region Sustainable Water StrategyWater Supply & Demand Strategy, 2006
20552055
Urban and ruralMetropolitan Melbourne water businesses
ACTThink water, act water, 2004Future Water Options, 2006Canberra Sewerage Strategy, 2011
205020502060
ACT
Utilities are increasingly striving to diversify sources to reduce reliance on rain-fed water sources and build resilience to the vagaries of climate. As described in Section 5.3 securing additional supply through desalination is more expensive than through traditional rain-fed surface water supply. “Greening” cities through increased vegetation and stormwater harvesting improves the productivity and liveability of cities and towns (Section 8.1.2).
8.1.1 Water gridsA number of states are increasing water security and deepening water markets by installing pipelines and other infrastructure to enable water transfer between major water systems and catchments. Examples include the Southeast Queensland Water Grid (Queensland Department of Infrastructure and Planning), the Shoalhaven Scheme in NSW (Sydney Catchment Authority) and the Melbourne Water Grid and the Goldfields Super Pipeline linking Ballarat and Bendigo to the Goulburn system (Victorian Department of Sustainability and Environment).
8.1.2 Integrated water managementIntegrated water management describes the efficient connection of water, wastewater and stormwater across the water cycle to provide a net community benefit, subject to public health and environmental requirements (Figure 8.1). These schemes are motivated by the desire to design more liveable, green cities that contribute to the broader quality of life and provide a certain degree of independence and resilience to external shocks such as droughts and water shortages. The Australian urban water sector is working with the International Water Association to develop Principles for a City of the Future to incorporate water-sensitive design and sustainability into urban planning (Skinner and Young, 2010; WSAA, 2012).
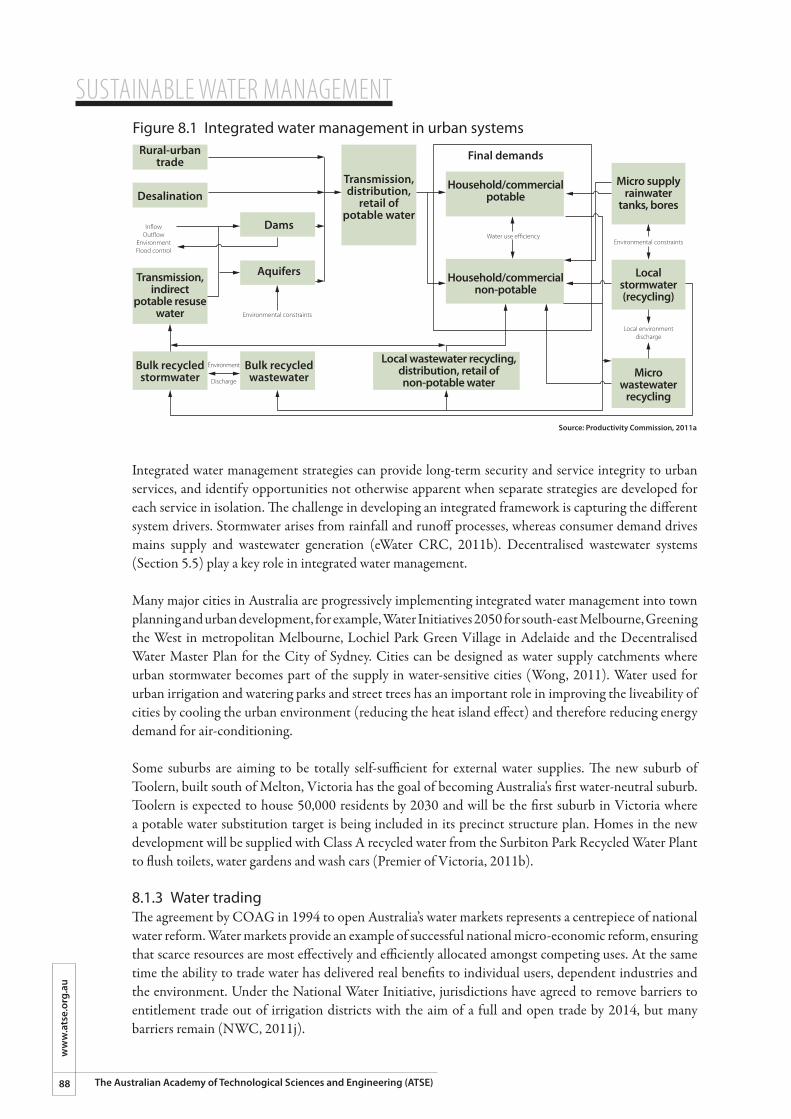
SUSTAINABLE WATER MANAGEMENT
88
ww
w.a
tse.
org.
au
The Australian Academy of Technological Sciences and Engineering (ATSE)
Integrated water management strategies can provide long-term security and service integrity to urban services, and identify opportunities not otherwise apparent when separate strategies are developed for each service in isolation. The challenge in developing an integrated framework is capturing the different system drivers. Stormwater arises from rainfall and runoff processes, whereas consumer demand drives mains supply and wastewater generation (eWater CRC, 2011b). Decentralised wastewater systems (Section 5.5) play a key role in integrated water management.
Many major cities in Australia are progressively implementing integrated water management into town planning and urban development, for example, Water Initiatives 2050 for south-east Melbourne, Greening the West in metropolitan Melbourne, Lochiel Park Green Village in Adelaide and the Decentralised Water Master Plan for the City of Sydney. Cities can be designed as water supply catchments where urban stormwater becomes part of the supply in water-sensitive cities (Wong, 2011). Water used for urban irrigation and watering parks and street trees has an important role in improving the liveability of cities by cooling the urban environment (reducing the heat island effect) and therefore reducing energy demand for air-conditioning.
Some suburbs are aiming to be totally self-sufficient for external water supplies. The new suburb of Toolern, built south of Melton, Victoria has the goal of becoming Australia's first water-neutral suburb. Toolern is expected to house 50,000 residents by 2030 and will be the first suburb in Victoria where a potable water substitution target is being included in its precinct structure plan. Homes in the new development will be supplied with Class A recycled water from the Surbiton Park Recycled Water Plant to flush toilets, water gardens and wash cars (Premier of Victoria, 2011b).
8.1.3 Water tradingThe agreement by COAG in 1994 to open Australia’s water markets represents a centrepiece of national water reform. Water markets provide an example of successful national micro-economic reform, ensuring that scarce resources are most effectively and efficiently allocated amongst competing uses. At the same time the ability to trade water has delivered real benefits to individual users, dependent industries and the environment. Under the National Water Initiative, jurisdictions have agreed to remove barriers to entitlement trade out of irrigation districts with the aim of a full and open trade by 2014, but many barriers remain (NWC, 2011j).
Figure 8.1 Integrated water management in urban systems
Source: Productivity Commission, 2011a
Rural-urbantrade
Desalination
Bulk recycledstormwater
Bulk recycledwastewater
Aquifers
Dams
Transmission,distribution,
retail ofpotable water
Final demands
Household/commercialpotable
Household/commercialnon-potable
Local wastewater recycling,distribution, retail ofnon-potable water
Micro supplyrainwater
tanks, bores
Localstormwater(recycling)
Microwastewater
recycling
Transmission,indirect
potable resusewater
In�owOut�ow
EnvironmentFlood control
Environmental constraints
Water use e�ciencyEnvironmental constraints
Local environmentdischarge
Environment
Discharge
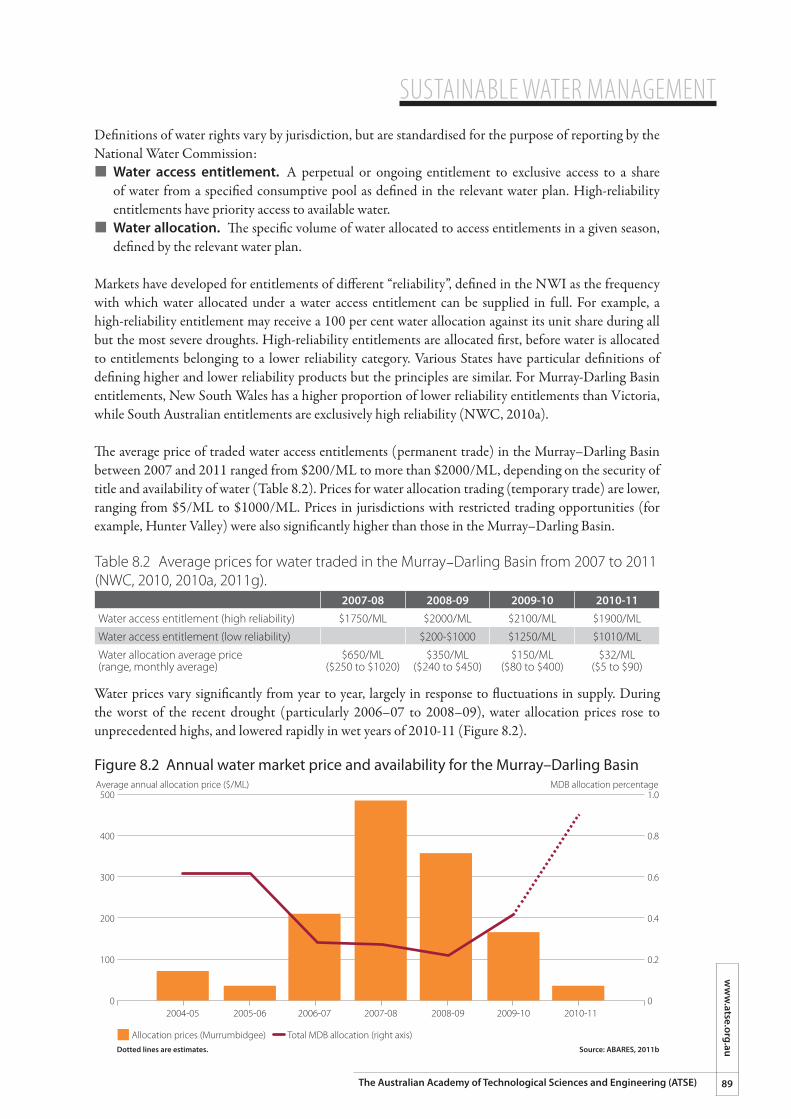
SUSTAINABLE WATER MANAGEMENTw
ww
.atse.org.au
89The Australian Academy of Technological Sciences and Engineering (ATSE)
Definitions of water rights vary by jurisdiction, but are standardised for the purpose of reporting by the National Water Commission:¢ �Water access entitlement. A perpetual or ongoing entitlement to exclusive access to a share
of water from a specified consumptive pool as defined in the relevant water plan. High-reliability entitlements have priority access to available water.
¢ �Water allocation. The specific volume of water allocated to access entitlements in a given season, defined by the relevant water plan.
Markets have developed for entitlements of different “reliability”, defined in the NWI as the frequency with which water allocated under a water access entitlement can be supplied in full. For example, a high-reliability entitlement may receive a 100 per cent water allocation against its unit share during all but the most severe droughts. High-reliability entitlements are allocated first, before water is allocated to entitlements belonging to a lower reliability category. Various States have particular definitions of defining higher and lower reliability products but the principles are similar. For Murray-Darling Basin entitlements, New South Wales has a higher proportion of lower reliability entitlements than Victoria, while South Australian entitlements are exclusively high reliability (NWC, 2010a).
The average price of traded water access entitlements (permanent trade) in the Murray–Darling Basin between 2007 and 2011 ranged from $200/ML to more than $2000/ML, depending on the security of title and availability of water (Table 8.2). Prices for water allocation trading (temporary trade) are lower, ranging from $5/ML to $1000/ML. Prices in jurisdictions with restricted trading opportunities (for example, Hunter Valley) were also significantly higher than those in the Murray–Darling Basin.
Table 8.2 Average prices for water traded in the Murray–Darling Basin from 2007 to 2011 (NWC, 2010, 2010a, 2011g).
2007-08 2008-09 2009-10 2010-11Water access entitlement (high reliability) $1750/ML $2000/ML $2100/ML $1900/ML
Water access entitlement (low reliability) $200-$1000 $1250/ML $1010/ML
Water allocation average price (range, monthly average)
$650/ML($250 to $1020)
$350/ML($240 to $450)
$150/ML($80 to $400)
$32/ML($5 to $90)
Water prices vary significantly from year to year, largely in response to fluctuations in supply. During the worst of the recent drought (particularly 2006–07 to 2008–09), water allocation prices rose to unprecedented highs, and lowered rapidly in wet years of 2010-11 (Figure 8.2).
Figure 8.2 Annual water market price and availability for the Murray–Darling Basin
500
400
300
200
100
0
Average annual allocation price ($/ML)1.0
0.8
0.6
0.4
0.2
0
MDB allocation percentage
Allocation prices (Murrumbidgee) Total MDB allocation (right axis)
2004-05 2005-06 2006-07 2007-08 2008-09 2009-10 2010-11
Dotted lines are estimates. Source: ABARES, 2011b
SUSTAINABLE WATER MANAGEMENT
90
ww
w.a
tse.
org.
au
The Australian Academy of Technological Sciences and Engineering (ATSE)
Trade in water markets has grown substantially, reaching an estimated $3 billion in 2009-10 (NWC, 2011e). Interstate trade continues to expand, especially into South Australia (NWC, 2011j). The NWC estimates that water trading in the southern MDB added $220 million to Australia's GDP in 2008-09 – with net production benefits of $79 million in New South Wales, $16 million in South Australia, and $271 million in Victoria (NWC, 2010e). Efficient water markets ensure efficient allocation between competing uses (NWC, 2011a,b). The flexibility and autonomy offered by water trading has increased agricultural production, helped farmers and communities to survive severe drought, and provided the mechanism for recovering water for the environment (NWC, 2011j). Modelling by ABARES (2011b) demonstrates how water markets help mitigate the effects of reduced water availability by ensuring water is directed to its highest-value uses:
“The inherent unpredictability of the optimal allocation of water is why a market-based mechanism is preferred. A market encourages participants (irrigators) to reveal their private ‘on the ground’ information on the relative returns to water. In contrast, it remains much more difficult to consistently determine the optimal allocation of water across regions, crops and individual irrigators centrally…The preferred policy approach is for governments to facilitate a market-based allocation of water as much as possible, and to ensure any policy responses to the economic effects … are implemented in an adaptive fashion, to enable responses to market trends as they develop. Placing restrictions on the market via trade limits or bans is likely to significantly reduce economic efficiency.”
However, barriers to water trading remain and it is imperative that market reform continues.
8.1.4 Rural-urban transfersTransferring water from rural to urban areas is logical, given that a relatively small proportion of agricultural use represents a relatively large fraction of urban demand. Young et al. (2006) estimated that urban prices could be substantially reduced by rural–urban trading, with a benefit to GDP of around 0.6 per cent. However there are still major impediments to trade between rural and urban users, primarily driven by political considerations that have resulted in policy bans and other institutional barriers
Box 9. Victoria’s North-South Pipeline: A failed attempt at rural-rural water tradeThe Victorian Water Grid, developed in the early 2000s as part of the Victorian Government's "Our Water, Our Future"
program, is a network of rivers, channels and pipes linking the state’s major water systems designed to maximise
flexibility for water sharing across regions and between uses (Victorian Department of Sustainability and Environment).
The grid allows for the management of Victoria’s water systems as an integrated resource, rather than in isolated
pockets. Components of the Grid include the Goldfields Superpipe, linking Coliban Water and Central Highlands
Water customers to the Goulburn system in 2007, and the 75GL/yr Sugarloaf Interconnector, linking Melbourne to the
Goulburn River. (Melbourne will also be supplied by the Wonthaggi desalination plant).
The North-South Pipeline, or Sugarloaf Interconnector, is a major component of Victoria’s Water Grid, The $750
million, 70km pipeline, completed in February 2010, links the Melbourne water system to the Goulburn River in
the north and major irrigation districts. However, the project has become embroiled in controversy, with concerns
expressed by irrigators that their water would be taken by city dwellers, even though the water would be derived
through water savings from the Northern Victoria Irrigation Renewal Project. A change in State Government in 2010
triggered closure of the North-South Pipeline to allay concerns, and as a result severely compromised the operation
of the rural-urban water market. Competing views from both sides of politics are given in the September 2011
edition of Water magazine.
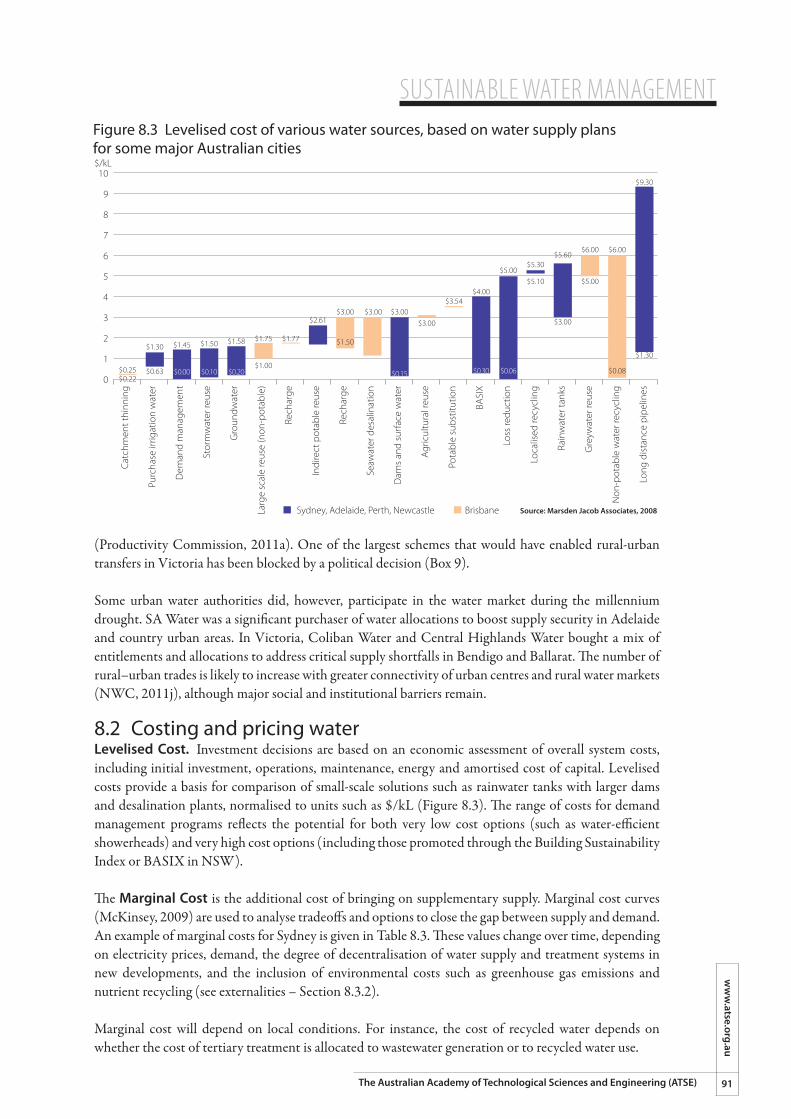
SUSTAINABLE WATER MANAGEMENTw
ww
.atse.org.au
91The Australian Academy of Technological Sciences and Engineering (ATSE)
(Productivity Commission, 2011a). One of the largest schemes that would have enabled rural-urban transfers in Victoria has been blocked by a political decision (Box 9).
Some urban water authorities did, however, participate in the water market during the millennium drought. SA Water was a significant purchaser of water allocations to boost supply security in Adelaide and country urban areas. In Victoria, Coliban Water and Central Highlands Water bought a mix of entitlements and allocations to address critical supply shortfalls in Bendigo and Ballarat. The number of rural–urban trades is likely to increase with greater connectivity of urban centres and rural water markets (NWC, 2011j), although major social and institutional barriers remain.
8.2 Costing and pricing waterLevelised Cost. Investment decisions are based on an economic assessment of overall system costs, including initial investment, operations, maintenance, energy and amortised cost of capital. Levelised costs provide a basis for comparison of small-scale solutions such as rainwater tanks with larger dams and desalination plants, normalised to units such as $/kL (Figure 8.3). The range of costs for demand management programs reflects the potential for both very low cost options (such as water-efficient showerheads) and very high cost options (including those promoted through the Building Sustainability Index or BASIX in NSW).
The Marginal Cost is the additional cost of bringing on supplementary supply. Marginal cost curves (McKinsey, 2009) are used to analyse tradeoffs and options to close the gap between supply and demand. An example of marginal costs for Sydney is given in Table 8.3. These values change over time, depending on electricity prices, demand, the degree of decentralisation of water supply and treatment systems in new developments, and the inclusion of environmental costs such as greenhouse gas emissions and nutrient recycling (see externalities – Section 8.3.2).
Marginal cost will depend on local conditions. For instance, the cost of recycled water depends on whether the cost of tertiary treatment is allocated to wastewater generation or to recycled water use.
Figure 8.3 Levelised cost of various water sources, based on water supply plans for some major Australian cities
10
9
8
7
6
5
4
3
2
1
0
$/kL
Sydney, Adelaide, Perth, Newcastle Brisbane
Catc
hmen
t thi
nnin
g
Purc
hase
irrig
atio
n w
ater
Dem
and
man
agem
ent
Stor
mw
ater
reus
e
Gro
undw
ater
Larg
e sc
ale
reus
e (n
on-p
otab
le)
Rech
arge
Indi
rect
pot
able
reus
e
Rech
arge
Seaw
ater
des
alin
atio
n
Dam
s an
d su
rfac
e w
ater
Agric
ultu
ral r
euse
Pota
ble
subs
titut
ion
BASI
X
Loss
redu
ctio
n
Loca
lised
recy
clin
g
Rain
wat
er ta
nks
Gre
ywat
er re
use
Non
-pot
able
wat
er re
cycl
ing
Long
dis
tanc
e pi
pelin
es
Source: Marsden Jacob Associates, 2008
$0.25$0.22
$0.63 $0.00 $0.10 $0.20 $0.30 $0.06
$1.30$1.30
$9.30
$1.45 $1.50 $1.58
$1.00
$1.75 $1.77
$2.61$3.00 $3.00 $3.00
$0.15
$3.00
$4.00
$5.00$5.00
$6.00 $6.00
$0.08
$5.10
$5.30$5.60
$3.00
$3.54
$1.50
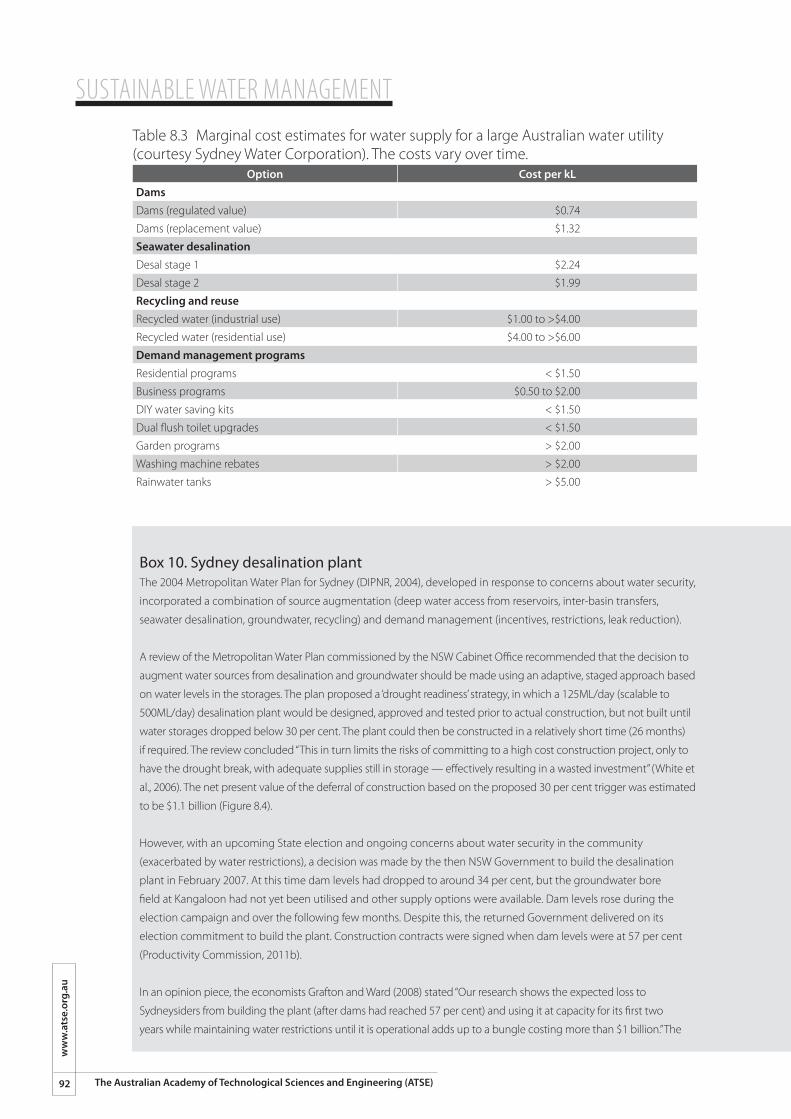
SUSTAINABLE WATER MANAGEMENT
92
ww
w.a
tse.
org.
au
The Australian Academy of Technological Sciences and Engineering (ATSE)
Table 8.3 Marginal cost estimates for water supply for a large Australian water utility (courtesy Sydney Water Corporation). The costs vary over time.
Option Cost per kLDamsDams (regulated value) $0.74
Dams (replacement value) $1.32
Seawater desalinationDesal stage 1 $2.24
Desal stage 2 $1.99
Recycling and reuseRecycled water (industrial use) $1.00 to >$4.00
Recycled water (residential use) $4.00 to >$6.00
Demand management programsResidential programs < $1.50
Business programs $0.50 to $2.00
DIY water saving kits < $1.50
Dual flush toilet upgrades < $1.50
Garden programs > $2.00
Washing machine rebates > $2.00
Rainwater tanks > $5.00
Box 10. Sydney desalination plantThe 2004 Metropolitan Water Plan for Sydney (DIPNR, 2004), developed in response to concerns about water security,
incorporated a combination of source augmentation (deep water access from reservoirs, inter-basin transfers,
seawater desalination, groundwater, recycling) and demand management (incentives, restrictions, leak reduction).
A review of the Metropolitan Water Plan commissioned by the NSW Cabinet Office recommended that the decision to
augment water sources from desalination and groundwater should be made using an adaptive, staged approach based
on water levels in the storages. The plan proposed a ‘drought readiness’ strategy, in which a 125ML/day (scalable to
500ML/day) desalination plant would be designed, approved and tested prior to actual construction, but not built until
water storages dropped below 30 per cent. The plant could then be constructed in a relatively short time (26 months)
if required. The review concluded “This in turn limits the risks of committing to a high cost construction project, only to
have the drought break, with adequate supplies still in storage — effectively resulting in a wasted investment” (White et
al., 2006). The net present value of the deferral of construction based on the proposed 30 per cent trigger was estimated
to be $1.1 billion (Figure 8.4).
However, with an upcoming State election and ongoing concerns about water security in the community
(exacerbated by water restrictions), a decision was made by the then NSW Government to build the desalination
plant in February 2007. At this time dam levels had dropped to around 34 per cent, but the groundwater bore
field at Kangaloon had not yet been utilised and other supply options were available. Dam levels rose during the
election campaign and over the following few months. Despite this, the returned Government delivered on its
election commitment to build the plant. Construction contracts were signed when dam levels were at 57 per cent
(Productivity Commission, 2011b).
In an opinion piece, the economists Grafton and Ward (2008) stated “Our research shows the expected loss to
Sydneysiders from building the plant (after dams had reached 57 per cent) and using it at capacity for its first two
years while maintaining water restrictions until it is operational adds up to a bungle costing more than $1 billion.” The
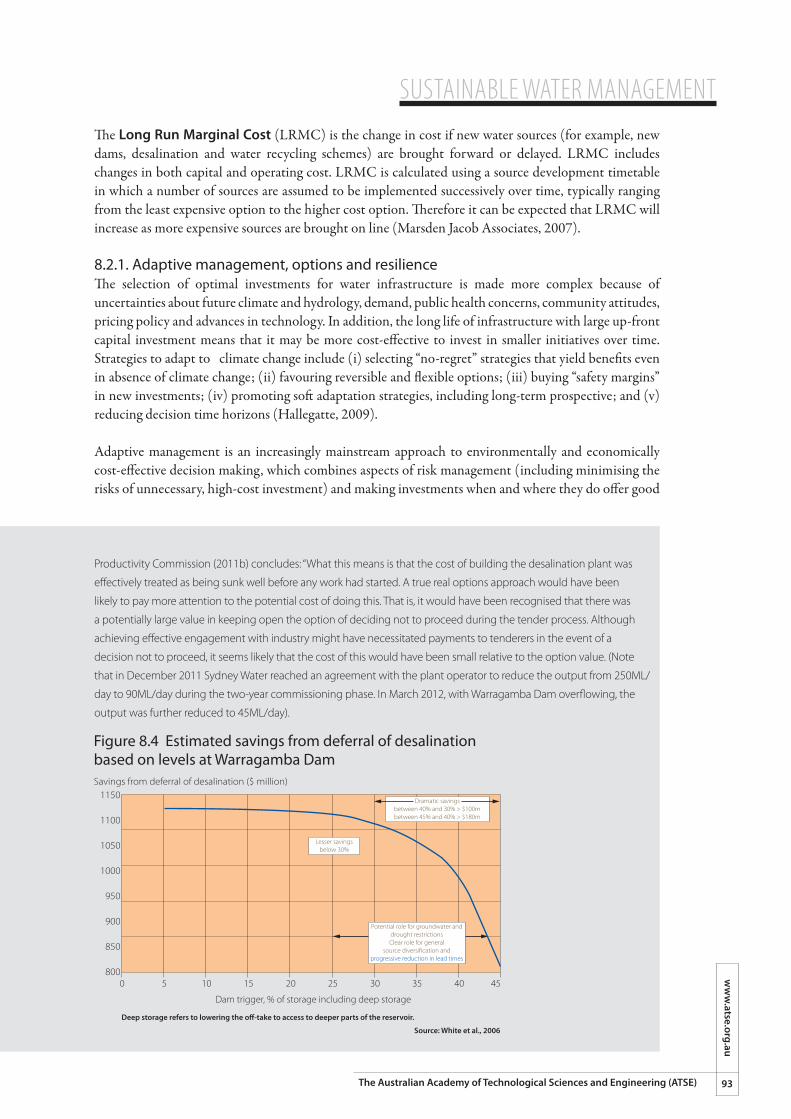
SUSTAINABLE WATER MANAGEMENTw
ww
.atse.org.au
93The Australian Academy of Technological Sciences and Engineering (ATSE)
The Long Run Marginal Cost (LRMC) is the change in cost if new water sources (for example, new dams, desalination and water recycling schemes) are brought forward or delayed. LRMC includes changes in both capital and operating cost. LRMC is calculated using a source development timetable in which a number of sources are assumed to be implemented successively over time, typically ranging from the least expensive option to the higher cost option. Therefore it can be expected that LRMC will increase as more expensive sources are brought on line (Marsden Jacob Associates, 2007).
8.2.1. Adaptive management, options and resilienceThe selection of optimal investments for water infrastructure is made more complex because of uncertainties about future climate and hydrology, demand, public health concerns, community attitudes, pricing policy and advances in technology. In addition, the long life of infrastructure with large up-front capital investment means that it may be more cost-effective to invest in smaller initiatives over time. Strategies to adapt to climate change include (i) selecting “no-regret” strategies that yield benefits even in absence of climate change; (ii) favouring reversible and flexible options; (iii) buying “safety margins” in new investments; (iv) promoting soft adaptation strategies, including long-term prospective; and (v) reducing decision time horizons (Hallegatte, 2009).
Adaptive management is an increasingly mainstream approach to environmentally and economically cost-effective decision making, which combines aspects of risk management (including minimising the risks of unnecessary, high-cost investment) and making investments when and where they do offer good
Productivity Commission (2011b) concludes: “What this means is that the cost of building the desalination plant was
effectively treated as being sunk well before any work had started. A true real options approach would have been
likely to pay more attention to the potential cost of doing this. That is, it would have been recognised that there was
a potentially large value in keeping open the option of deciding not to proceed during the tender process. Although
achieving effective engagement with industry might have necessitated payments to tenderers in the event of a
decision not to proceed, it seems likely that the cost of this would have been small relative to the option value. (Note
that in December 2011 Sydney Water reached an agreement with the plant operator to reduce the output from 250ML/
day to 90ML/day during the two-year commissioning phase. In March 2012, with Warragamba Dam overflowing, the
output was further reduced to 45ML/day).
Figure 8.4 Estimated savings from deferral of desalination based on levels at Warragamba Dam
1150
1100
1050
1000
950
900
850
800
Savings from deferral of desalination ($ million)
0 5 10 15 20 25 30 35 40 45
Source: White et al., 2006
Deep storage refers to lowering the o�-take to access to deeper parts of the reservoir.
Dam trigger, % of storage including deep storage
Lesser savingsbelow 30%
Potential role for groundwater and drought restrictionsClear role for general
source diversi�cation andprogressive reduction in lead times
Dramatic savingsbetween 40% and 30% > $100mbetween 45% and 40% > $180m
SUSTAINABLE WATER MANAGEMENT
94
ww
w.a
tse.
org.
au
The Australian Academy of Technological Sciences and Engineering (ATSE)
value. The principles are suited to decision making under uncertainty, with concepts such as adaptive planning and real options planning that allow flexibility when comparing alternatives (White et al., 2006; WSAA, 2008b). Adaptive management offers opportunities to reduce downside risk while maintaining access to upside opportunities. In water planning, beset by uncertainties of demand and supply, adaptive management leads to more cost-effective investments. For example, a comprehensive new options assessment framework was commissioned by the Smart Water Fund to inform the Melbourne 50 year Water Supply-Demand Strategy (due for release during April 2012). The proposed new framework (Mukheibir and Mitchell 2011) uses a combination of scenario analysis, probability analysis, decision analysis and real options, and tests the robustness of alternate paths to short-term shocks as well as long-term trends. Preferred portfolios will be assessed systemically on a triple bottom line basis, to best meet Melbourne’s vision of shaping a “sustainable, liveable, prosperous and healthy city”.
Investment decisions should be made on the basis of sound economic and scientific advice (Box 10).
8.2.2 Urban water pricingWater prices across urban Australia have doubled over the past five years, as utilities begin to recoup the large investments in infrastructure such as desalination plants made in response to water shortages and drought conditions.
Urban water pricing is determined by State regulators who take into account the monopoly nature of the utilities, capital and operating costs, demand projections and dividends to the government. Pricing typically involves a two-part tariff, with a volumetric component based on long-run marginal cost of supply and a fixed component designed to recover total efficient costs, given forecast demand and customer numbers (NWC, 2011b). During water scarcity, the volumetric charge does not reflect the true cost of water and restrictions are used to reduce demand. The NWC (NWC, 2011k) suggests that a better approach to matching demand with supply would be to institute variable prices, as done with electricity tariffs or through trading on the open market as with irrigators (Section 8.1.2). The Australian Water Association supports scarcity pricing as a means to lower demand in times of drought in preference to the imposition of restrictions (AWA, 2011).
Tiered pricing or inclining block tariffs is used in an attempt to set a low price for what is considered to be ‘essential’ water for non-discretionary use. The size of the initial block varies considerably by State, from 125kL in Adelaide to 255kL in Brisbane, resulting in inequitable outcomes between cities (Productivity Commission, 2011a). Sydney changed from a three-part tariff to a single volumetric price in 1993. The NWC recommends that consumers be given a greater choice of tariff offerings to reflect preferences on security of supply and price stability, and that prices should be based on the marginal opportunity cost of supply, which includes the direct short-run marginal cost of supplying water, the value of any externalities, and the scarcity value of water as supply and demand conditions change. This would reduce or eliminate the need for water restrictions and allow consumers to use water according to its perceived value. The NWC supports the view that the urban water sector should be more customer-focused, that water restrictions should not be used to balance supply and demand, and that all customers (residential, commercial, industrial and other) should be able to choose from a range of water service products at different prices (NWC, 2011b).
8.2.3 Rural water pricingRural water markets are the centrepiece of national water reform (Section 2.1). They are an example of successful national micro-economic reform, ensuring that scarce resources are most effectively and efficiently allocated amongst competing uses. The ability to trade water has delivered real benefits to individuals, industries and the environment (NWC, 20011e).
SUSTAINABLE WATER MANAGEMENTw
ww
.atse.org.au
95The Australian Academy of Technological Sciences and Engineering (ATSE)
Rural water trading (Section 8.1.2) is now worth over $3 billion annually. Prices are set on the open market and represent fair perceived value to both the seller and buyer, rising during times of scarcity and directing water to highest-value uses. Market prices vary depending on the water product, the geographical region and the interconnectedness of systems and institutional barriers. Allocation water prices in 2007-10 ranged from less than $30/ML to over $2,300/ML. Interstate trade accounted for 28 per cent of the allocations traded, by volume, in 2008-09 (NWC, 2010, 2010a).
The NWC and Productivity Commission both stress the need for further market reform to increase trade and market participation, develop new markets and broaden markets to new water products. It is also worth emphasising the need to better synchronise water and carbon markets by ensuring that water markets are broadened to cover mining, energy generation and inflow interception activities, as agreed in the National Water Initiative but not yet implemented.
8.2.4 SubsidiesPricing principles of the NWI (NWC, 2010d) stress the importance of full cost recovery, transparent pricing and efficient markets, but also recognise the need for governments to manage issues of urban and rural equity and encourage efficient water use, recycled water and stormwater reuse. The objective of ‘user pays’ is being distorted through significant taxpayer dollars being spent on water infrastructure schemes in both urban and rural settings.
Examples of Commonwealth subsidies provided through the $1.6 billion Water Smart Australia program include $408 million for the Western Corridor Recycled Water Scheme in southeast Queensland, $266 million for the Wimmera Mallee pipeline project in Victoria, $77 million for the Hawkesbury Nepean River Recovery Project west of Sydney, $38 million and $35 million for the Waterproofing Northern Adelaide and Waterproofing the South projects, respectively, in South Australia, $19 million for the Groundwater replenishment project north of Perth, $8 million for the Tasmanian water use management project and $10 million for the Canberra Integrated Urban Waterways project. As mentioned in the discussion of the Murray Darling Basin in Section 4.3.2, the $8.9 billion allocated to upgrading rural irrigation infrastructure and water buybacks represents a transfer of national wealth to a relatively small sector of the agricultural community.
While these schemes may be beneficial in achieving a specific societal outcome (eg, support regional communities, Section 4.3.3.), they subsidise the cost of water provided to consumers, and disguise and distort price signals.
8.3 Economic efficiency and green growth
8.3.1 ProductivityOver the past two decades, Australians have enjoyed the longest unbroken period of rising living standards of any developed country in history (Garnaut, 2011b). However, Australia risks entering an extended period of declining living standards in what Garnaut terms the “Great Australian Complacency of the Early 21st Century”.
Australia’s decline in productivity growth over the last decade is partly attributed to over-regulation and slippage in Australia’s uptake of productivity-enhancing technologies. The Productivity Commission (2010) estimates that three sectors – mining; agriculture; and electricity, gas, water and waste services – account for almost 80 per cent of the decline in multi-factor productivity growth between the 1998-99 to 2003-04 and 2003-04 to 2007-08 growth cycles, a conclusion also reached by the Australian Treasury (2009).
SUSTAINABLE WATER MANAGEMENT
96
ww
w.a
tse.
org.
au
The Australian Academy of Technological Sciences and Engineering (ATSE)
The water sector. The combination of inadequate or inappropriate investment in infrastructure, population growth and drought has had a depressing effect on productivity of the water sector. Drought conditions prompted governments in most States to impose restrictions on the use of water, which detracted from the output of businesses without commensurate reductions in factor inputs such as labour and capital (Productivity Commission, 2011d). Excessive government-led investment in water infrastructure (including desalination in five states) made with a view to guaranteeing security of supply in drought conditions (Eslake and Walsh 2011) but with little subsequent use, has resulted in inefficient use of capital.
National Performance Reports of the NWC for years 2005-06 to 2008-09 show a marginal (1.0 per cent/pa) increase in productivity of urban water suppliers. Of this increase, a minor component (0.17 to 0.29 per cent) is attributed to technological improvements, slowed by regulatory and compliance costs. Capital expenditure increased from $2.6 billion in 2005–06 to $8.1 billion in 2008–09, due to large-scale desalination, recycling and pipeline projects (NWC, 2011l). The NWC found that efficiencies of scale were maximised at around 90,000 connected properties, supporting vertical integration in the urban water sector and decentralisation of facilities at larger scales. Wastewater services were not modelled in this study.
Some of the decline in multi-factor productivity can be attributed to the lumpy nature of expenditure in water infrastructure, which results in decrease in productivity when the large capital investment is made with gradually improvement over following years as output expands from the newly installed capacity. However, much of the decline is attributed to substantial institutional and regulatory constraints and poor policy decisions. As the (Productivity Commission, 2011d) reflects:
“The bans on urban–rural water trade, in place in several jurisdictions, may have been the most inefficient, particularly when viewed in the context of governments committing to high cost supply augmentation options. For example, the Port Stanvac desalination plant currently in development in South Australia is expected to cost $1.83 billion to build and involve substantial running costs of $0.50-$1.00/kL of water, for an expected annual production of 100 GL. In comparison, acquiring a similar volume of water through rural water entitlements could have cost under $200 million and would likely involve lower operating costs. Recycling for planned indirect potable use is another water supply option currently prohibited in New South Wales, Victoria and South Australia without a transparent analysis of its costs and benefits.”
Other examples of productivity-decreasing decisions by governments include the Sydney desalination plant (Section 5.3) and Victoria’s North-South Pipeline (Section 8.1.4). Adelaide is analysed in detail in Chapter 7.
Demand-side measures such as water efficiency programs are often the lowest cost (Section 8.3), but when they extend to water restrictions the external social and economic costs are born by the broader community. For example, economic modelling showed that stage 3a restrictions in Melbourne reduced community welfare by $420 to $1500 million over a 10-year period (Productivity Commission, 2011a,b). Water, wastewater and stormwater services must be delivered in the most economically efficient manner to maximise the net benefits to the community.
8.3.2 ExternalitiesAn externality is defined in economic terms as a cost or benefit to an external party, including society as a whole, that is not captured in the costing and pricing of a goods or service. Ideally, green-growth principles for water (Section 1.1) would endeavour to bring as many externalities as possible into water pricing so that markets would optimise economic, environmental and social outcomes.
SUSTAINABLE WATER MANAGEMENTw
ww
.atse.org.au
97The Australian Academy of Technological Sciences and Engineering (ATSE)
As noted in Section 2.7, a number of urban water utilities are well advanced in attempting to capture social and environmental costs and benefits when making decisions on investment in infrastructure. By and large, water utilities have been surprisingly successful in arguing the case that factors other than purely financial costs and benefits should be taken into account when justifying investment decisions. This is partly attributed to the long asset life of water infrastructure (five to 100 years), and partly due to the public-good nature of water utilities with predominantly government ownership. It is unlikely that a private company could afford to take such long-term actions unless compelled by legislation and government regulation.
A number of techniques to monetise social and environmental costs and benefits have been developed, including actual market value, where a good is priced on the open market; surrogate market techniques, where a closely related goods or service is influenced by the externality (e.g., household expenditure on water filters); and hypothetical market techniques such as stated preference and contingent valuation created via structured questionnaires which elicit the individuals “willingness to pay” for a benefit or “willingness to be compensated” for a loss or disbenefit (Hardisty et al, 2012). Typical benefits of environmental protection include increased property value, reduction in risk of liability, and protection of a resource needed for a business process. Social or external benefits include improved health (through better quality air and water, outdoor recreation) and protection of resources not otherwise captured or owned by the stakeholder.
Economic benefits from avoided damage accrue due to the protection of the value of the environment or natural resources, and include its use in production or consumption (direct use value), its role in the functioning of ecosystems (indirect use value), or its potential future uses (option value). In a full economic analysis the overall objective of any decision is assumed to be the maximisation of human welfare over time. In the case of water, people may also value water and be willing to pay for its protection unrelated to their own use of the resource (non-use values) but because of its benefits to others (altruistic value), for future generations (bequest value) and for its own sake (existence value) (Hardisty, 2010).
Frontier Economics, in a study of externalities for the NWC (NWC, 2011h), proposed a framework for externality pricing at various points in the urban water cycle. Some externalities associated with the urban water cycle are already managed through non-price means such as regulation and entitlements. Care should be taken when attempting to price in externalities already subject to planning rules, such as diffuse sources of stormwater run-off and pollution in integrated water management (Section 8.1.2). The study found that efficient and sustainable price signals are best sent to customers by ensuring that volumetric price signals reflect the full environmental opportunity cost of future system augmentations (see long-run marginal cost, Section 8.2).
There is a major need to improve the technical and economic evaluation of water externalities so that they can be incorporated better into policy decisions. The NWC (2011h) recommends that the policy goal should not be to eliminate externalities altogether, which could be prohibitively costly, but to aim for optimal levels of externalities, where the marginal benefits of additional intervention are greater than the marginal costs imposed by the externality. However it is often difficult to quantify environmental and social values in monetary terms. Pricing is one of many approaches to addressing externalities to achieve social and economic outcomes. Its key advantage is that it can be a more flexible and cost-effective means of meeting overall environmental objectives compared with prescriptive ‘one size fits all’ regulations.
8.3.3 Towards green growth in the water sectorGreen growth requires a sound appreciation of the true value of water by the community, businesses, regulators and policy makers (UNEP, 2011b). Integration of economic-environmental accounts (Section 2.6) will go some way to improving the quantitative evaluation of water, but other non-market goods and
SUSTAINABLE WATER MANAGEMENT
98
ww
w.a
tse.
org.
au
The Australian Academy of Technological Sciences and Engineering (ATSE)
services also need to be valued. As emphasised by the World Bank, water is an economically important resource that is often either not priced or priced in a way that is not related to its true economic, environmental or social value (Hamilton, 2006; Hamilton and Ley, 2010).
Green-growth principles described in Section 1.1 require lowering the economic cost and increasing economic benefit of water (via open markets, optimisation of a portfolio of water sources, removal of subsidies), lowering the environmental footprint of water users (utilities, agriculture and industry) and increasing the ecological benefit of water (targeted environmental flows), and maximising the social amenity of water (support community and individual values, conservation without restrictions).
In describing ‘economic efficiency’ in the urban water sector, the Productivity Commission (2011a) embraces the tenets of green growth described in this report, by encapsulating specific objectives such as water security, water quality, flood mitigation and the environment. The Productivity Commission concludes that short-term and long-term environmental and social considerations must be integrated into policy making. As such:
“The concept of ‘economic efficiency’ encapsulates many of the more specific objectives that should be pursued in the urban water sector, including those related to water security, water quality, flood mitigation and the environment. It allows short-term and long-term environmental and social considerations to be integrated into policymaking, as required by the principles of ecologically sustainable development. As such, it can also be used to guide the assessment of public health and environmental policies based on rigorous cost–benefit analysis.
In terms of the value of water consumed, consumers are usually best placed to make their own water use decisions. Water use that one person might regard as being of low value, might be of high value to another person. Although there are consumer and political sensitivities about water policy and the provision of water services, independent cost benefit analysis and other information should be provided to communities prior to decisions being made.”
The objectives described by the Productivity Commission for ‘economic efficiency’ are similar to the tenets of ‘green growth’ described in this report.
SUSTAINABLE WATER MANAGEMENTw
ww
.atse.org.au
99The Australian Academy of Technological Sciences and Engineering (ATSE)
9. Conclusions and recommendations
Water underpins all aspects of the Australian society and its economy. Water is used to grow and cook food, maintain public health, transport wastes, support industries including electricity generation, mineral and agricultural exports, and nourish the natural environment. Water management, policy and legislation continue to evolve, but reform is slow in many areas. Drought and water availability, water pricing, and competing demands may result in conflicting policies that could lead to sub-optimal outcomes and negative consequences for other sectors of the economy and the environment.
Australia’s troubling reduction in productivity over the last decade is partly attributed to over-regulation and slippage in Australia’s uptake of productivity-enhancing technologies. The Australian Treasury (2009) and Productivity Commission (2010) estimate that three sectors – mining; agriculture; and electricity, gas, water and waste services – have accounted for almost 80 per cent of the decline in multi-factor productivity growth between 1998 and 2008, the latter part involving the millennium drought. Access to reliable and inexpensive water supplies is crucial to these and other sectors of the economy, and in most cases open access to water markets ensures that water goes to its highest-value use within the economy. However, purely economic or price-based approaches do not recognise the importance of water to support community values, social amenity, public health and the environment. Adopting green-growth principles would incorporate externalities in water pricing wherever possible, to optimise economic, environment and social outcomes.
Productivity is decreased when unnecessary investments are made for infrastructure, externalities are not priced into goods and services, taxpayer subsidies disguise market signals and consumers are not free to make choices on the level of service they require and can afford. Improvements to productivity will be underpinned by improved resource management, more efficient use of labour and advances in technology (infrastructure for supply, distribution and treatment) as well as integration with other services such as electricity and waste disposal.
Green growth Green growth (Section 1.1) describes the process for sustainable economic development that recognises the inter-relationship and inter-dependence of the elements of the economy, the environment and society as a whole. A green growth strategy harnesses the economic opportunities provided by new technologies and advanced products, while reducing the environmental impact and social disruption. Green growth principles can provide a comprehensive framework for management of Australia’s water resources and prioritising investment decisions (Sections 2.7 and 8.3).The integration of Australia’s national economic and environmental accounts, pursued by the ABS (Section 2.6), provides an excellent metric for assessment of progress towards a greener, more sustainable economy.
RECOMMENDATION 1To facilitate the uptake of green growth principles in water policy development, COAG should: (i) Develop a national protocol to align green growth objectives in water management to apply across
all levels of government, and(ii) Accelerate the integration of national economic and environmental accounts to enable consistent
analysis of the contributions of economic sectors and natural capital (e.g., water, soil, biodiversity and ecosystems).
SUSTAINABLE WATER MANAGEMENT
100
ww
w.a
tse.
org.
au
The Australian Academy of Technological Sciences and Engineering (ATSE)
Investment decisionsThe long lifetime and capital-intensive nature of water infrastructure necessitates a careful and robust process for evaluating investment decisions. Triple-bottom-line approaches ensure that social, economic and environmental factors are taken into account (Section 2.7). The price charged for water should transparently reflect the full cost of water provision (as per the NWI) with environmental externalities such as climatic variability, greenhouse-gas emissions, land degradation and water pollution included wherever possible (Sections 2.7 and 8.3.2). These externalities can be quantified and understood by targeted science and research.
RECOMMENDATION 2Investment decisions by water authorities should be based on balanced social, economic and environmental analysis, informed by sound scientific advice and implemented through transparent and contestable processes.RECOMMENDATION 3Governments should ensure that externalities such as greenhouse-gas emissions, land degradation and water use and pollution are priced into goods and services wherever possible, to provide market signals that improve environmental and social outcomes.
Investment in technology.Technological and scientific innovation will underpin green growth in the water sector. However innovation can be impeded by existing long-term investments in infrastructure and systems (sunk cost) and entrenched path dependencies (technology lock-in and stranded assets).
The tables at the beginning of this report (Section 1.3) summarises a wide range of scientific and technological opportunities for the water sector that would increase efficiency and productivity and reduce environmental impact. These technologies will drive multiple green growth and productivity objectives, including lower demand for energy and other resources, reduction in waste and pollutants, increase in economic efficiency, conservation of natural assets and improvements in social cohesion.
New industries will be created in the areas of energy- and water-efficient equipment and appliances, new decentralised stormwater and wastewater treatment technologies, more efficient agricultural practices, better weather forecasting, climate and hydrological modelling, improved recycling technologies and co- and tri-generation of energy, water and waste technologies. Australia is already beginning to be recognised for development of new water policies and technologies. There is significant potential for Australia to export new technologies and expertise to other parts of the world.
RECOMMENDATION 4Governments should encourage investment and uptake of energy-efficient and flexible water supply options such as water grids and decentralised systems which increase efficiency and productivity and reduce environmental impact.RECOMMENDATION 5Government support for innovation in water management should be carefully targeted to accelerate the development and uptake of technologies leading to greater efficiency in supply and use.
SUSTAINABLE WATER MANAGEMENTw
ww
.atse.org.au
101The Australian Academy of Technological Sciences and Engineering (ATSE)
Water has multiple rolesWater as a resource is interrelated with almost all sectors of the economy (Sections 3 and 4), including agriculture, mining, electricity production, manufacturing, recreation and tourism. Water also supports the environment and our social amenity. The difficulty of achieving an acceptable policy that recognises the multiple roles of water is highlighted in the progressive evolution of water management plans for the Murray-Darling Basin (Section 4.3) where tensions between irrigators and environmental groups, townships and communities, upstream and downstream users have been exacerbated by historical over-allocation and extended periods of drought. An optimal Basin plan would recognise the multiple roles and incorporate processes for adaptation to changing climatic, economic and environmental conditions.
RECOMMENDATION 6Government policy development should take a holistic approach, recognising the multiple roles and interdependencies of water within the Australian economy, environment and society.
Portfolio approachExpanded access to a wide range of water sources can provide a reliable and secure, cost-effective water supply, that can respond to changes in population and climate (Chapters 5 and 7). Greater integration of water sources (catchments, groundwater, desalination, recycled wastewater and harvested stormwater) in urban water supply (Chapter 5) will require sophisticated risk management and water quality monitoring strategies to ensure the primacy of public health.
Water management into the future (Chapter 8) will require adaptability, flexibility and innovation in order to adapt quickly and efficiently to changes in climate and water supply, variations in demand, community attitudes to environment and health issues, pricing policy and advances in technology (Section 4.2). Policies need to consider uncertainties and maintain resilience to external shocks in the longer-term. Planning should be based on risk, rather than probability, and be robust over a wide range of possible outcomes, not just the ‘most likely’ (Section 5.1.2).
RECOMMENDATION 7A portfolio approach to investments in water sources and management strategies should be fostered by all governments to provide resilience to natural climate variability, anticipated changes in rain-fed supply arising from climate change, and growing demand. Government planning should include managing for high risk, catastrophic events.RECOMMENDATION 8Where additional drinking water supplies are required, desalination – as well as recycled wastewater and treated stormwater for potable use – should be considered based on their economic, environmental and social merits. A multi-barrier approach should be adopted to maintain primacy for the protection of human health.RECOMMENDATION 9A long-term participatory public awareness program to overcome entrenched negative community perceptions of recycled wastewater and treated stormwater would assist public acceptance of potable recycling.
SUSTAINABLE WATER MANAGEMENT
102
ww
w.a
tse.
org.
au
The Australian Academy of Technological Sciences and Engineering (ATSE)
Economic efficiencyEconomic efficiency is impaired by cross-subsidies between sectors and incentives that distort price signals for consumers of water. Where subsidies exist, they should be recognised as such and transparently communicated to the community. Examples include urban and rural infrastructure upgrades (Sections 4.3.2 and 8.3.1), artificially low prices for recycled water, and the purchase of subsidised renewable energy to offset energy use in desalination plants (Section 5.3).
RECOMMENDATION 10Cross-subsidies within and between economic sectors should be minimised and price signals improved to reflect the true cost, and value, of water. Where subsidies are provided, their cost and rationale should be transparently communicated to stakeholders.
Water–energy nexusThe water and energy sectors are inextricably linked (Sections 2.2, 4.4 and 6.1). For example, the provision of water and sewerage services involves significant energy consumption (Section 6.1) and most forms of energy generation require water use (Section 4.4). Water and energy policy should recognise the interdependencies between these sectors. The provision of water and sewerage services involves significant energy consumption (Section 6.1), which is purchased at market prices. In contrast, electricity generators and, potentially, carbon sequestration projects, are often provided with access to water below its true cost (Section 4.4).
RECOMMENDATION 11Water and energy policies should recognise the interdependencies between these and other industry sectors and subsidies that distort price signals on the true value of water should be eliminated.
National Water InitiativeReforms in water management, led by COAG through the NWI, have made major inroads since 2004 into developing a nationally agreed, coherent set of principles and reform actions to achieve optimal economic, environmental and social outcomes. However there is still much to be done, particularly in addressing the over-allocation of water, broadening sector coverage and eliminating policy barriers to efficient water markets. Restrictions on rural-urban water trading (Section 8.1.3) and potable use of recycled water (Section 5.4) and the exclusion of sectors such as mining from water markets compromise (Section 4.5) the efficiency of water management.
Adoption of reforms implicit in the states’ and territories’ commitment to the National Water Initiative, and more recently urged by the Productivity Commission, would go a long way to improving Australia’s productivity and setting the path for a green growth economy in the water and related sectors.
RECOMMENDATION 12The next iteration of the National Water Initiative should extend water markets to include energy and land use changes including mining.RECOMMENDATION 13The next iteration of the National Water Initiative should continue to address and eliminate policy barriers to efficient water markets, including rural-urban transfers and potable use of recycled water.
SUSTAINABLE WATER MANAGEMENTw
ww
.atse.org.au
103The Australian Academy of Technological Sciences and Engineering (ATSE)
Social impactEfficient water markets require the clear transmission of price signals to all water users to reflect water availability. Price subsidies for disadvantaged groups conceal these signals. Increasing water prices may have disproportionately adverse impacts on socially disadvantaged groups.
RECOMMENDATION 14.Water and energy pricing policy should not distort the transmission of price signals to all water users and any adverse social impacts should be addressed by social policy.
Support for R&D and commercialisationThe public good nature of water justifies government support for research and development (R&D), which drives innovation, increased efficiency and productivity.
Many of Australia’s existing R&D programs in the water sector are nearing the end of their terms, and there is a need for a coordinated national approach to plan the next generation of programs. Specific Commonwealth investments in water R&D including the eWater CRC, the National Centre for Groundwater Research and Training, The International Centre of Excellence in Water Resources Management, National Centre of Excellence in Desalination, Australian Water Recycling Centre of Excellence and the CRC for Water Sensitive Cities, along with various state initiatives such as the Queensland Urban Water Security Research Alliance, Victoria Smart Water Fund and SA Goyder Institute. These programs would benefit from greater coordination and long-term commitment to ensure a strategic research investment focus in priority areas.
RECOMMENDATION 15.A national R&D strategy for water, recognising its multiple roles and importance across the Australian economy, should be developed and its components prioritised.RECOMMENDATION 16.Public funding should be provided for public-good research and support for commercialisation of emerging technologies to improve the efficiency of water use and improve environmental outcomes.
Water is essential for all aspects of human activity and natural ecosystems. Technological innovation and scientific advances will play ever-increasing roles in increasing our understanding of the water cycle, especially in areas such as hydrological modelling and forecasting, increased efficiency of water use, improved environmental outcomes, and the ability to adapt rapidly to changes in climate, changing demand and shifts in population. Australia’s long-term productivity and quality of life will be underpinned by improved understanding and management of water, and ensuring that economic goals are balanced by social prosperity and environmental outcomes. As a major food-exporting nation, Australia has an opportunity to use its water resources even more efficiently as a contribution to feeding the world.
SUSTAINABLE WATER MANAGEMENT
104
ww
w.a
tse.
org.
au
The Australian Academy of Technological Sciences and Engineering (ATSE)
AcronymsABARES Australian Bureau of Agricultural and Resource Economics and Sciences
ABS Australian Bureau of Statistics
ACCARNSI Australian Climate Change Adaptation Research Network for Settlements and Infrastructure
ACCC Australian Competition and Consumer Commission
ADWG Australian Drinking Water Guidelines
AEMO Australian Energy Market Operator
AGWR Australian Guidelines for Water Recycling
ASIRC Australian Sustainable Industry Research Centre
ASR Aquifer storage and Recovery
ASTR Aquifer storage, treatment and recovery
AUSCEW Australia-United States Climate Energy and Water project
AWA Australian Water Association
BASIX Building Sustainability Index (NSW)
BDL Baseline diversion limit
BOM Bureau of Meteorology
BRS Bureau of Rural Sciences
CEDA Committee for Economic Development of Australia
CEWH Commonwealth Environmental Water Holder
CFI Carbon Farming Initiative (Commonwealth government)
COAG Council of Australian Governments
CO2-e Carbon dioxide equivalent (greenhouse gas potential)
CSG Coal seam gas (also know as coal bed methane)
FAO Food and Agriculture Organization (United Nations)
GDP Gross domestic product
GHG Greenhouse gas
IAASTD International Assessment of Agricultural Knowledge, Science and Technology for Development
IPART Independent Pricing and Regulatory Tribunal (NSW)
IPCC Intergovernmental Panel on Climate Change
IPR Indirect Potable Recycling
ISDP Integrated supply-demand planning
IWM Integrated water management
LGA Local government area
LRMC Long run marginal cost
MAR Managed aquifer recharge
MDB Murray-Darling Basin
MDBA Murray-Darling Basin Authority
NCCARF National Climate Change Adaptation Research Facility
NWA National Water Account (Bureau of Meteorology)
NWC National Water Commission
NWI National Water Initiative
NEM National Electricity Market
NHMRC National Health and Medical Research Council
OECD Organisation for Economic Co-operation and Development
IOCI Indian Ocean Climate Initiative
PC Productivity Commission
PR Potable recycling
QWC Queensland Water Commission
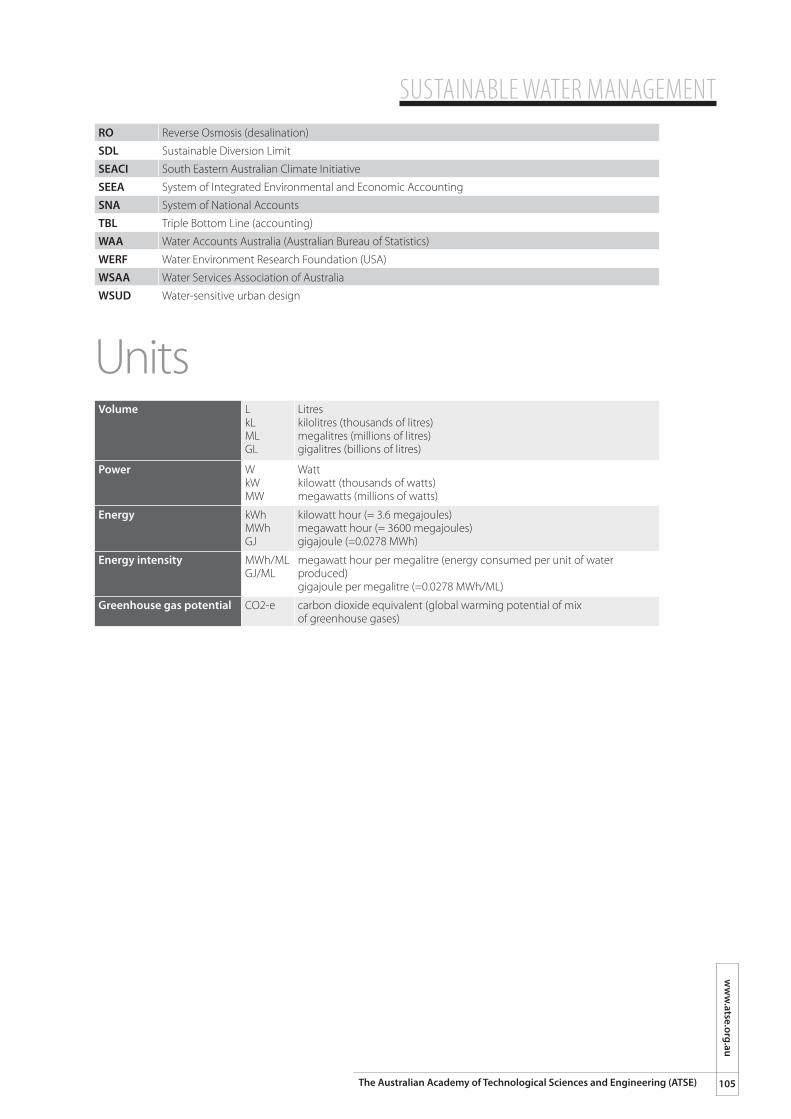
SUSTAINABLE WATER MANAGEMENTw
ww
.atse.org.au
105The Australian Academy of Technological Sciences and Engineering (ATSE)
RO Reverse Osmosis (desalination)
SDL Sustainable Diversion Limit
SEACI South Eastern Australian Climate Initiative
SEEA System of Integrated Environmental and Economic Accounting
SNA System of National Accounts
TBL Triple Bottom Line (accounting)
WAA Water Accounts Australia (Australian Bureau of Statistics)
WERF Water Environment Research Foundation (USA)
WSAA Water Services Association of Australia
WSUD Water-sensitive urban design
UnitsVolume L
kLMLGL
Litreskilolitres (thousands of litres)megalitres (millions of litres)gigalitres (billions of litres)
Power WkWMW
Wattkilowatt (thousands of watts)megawatts (millions of watts)
Energy kWhMWhGJ
kilowatt hour (= 3.6 megajoules)megawatt hour (= 3600 megajoules)gigajoule (=0.0278 MWh)
Energy intensity MWh/MLGJ/ML
megawatt hour per megalitre (energy consumed per unit of water produced)gigajoule per megalitre (=0.0278 MWh/ML)
Greenhouse gas potential CO2-e carbon dioxide equivalent (global warming potential of mix of greenhouse gases)
SUSTAINABLE WATER MANAGEMENT
106
ww
w.a
tse.
org.
au
The Australian Academy of Technological Sciences and Engineering (ATSE)
ReferencesABARES, 2011a, The economic and social effects of the Murray-Darling Basin Plan: recent research and steps. ABARES conference paper 11.12.
ABARES, 2011b, Modelling the economic effects of the Murray–Darling Basin Plan: Australian Bureau of Agricultural and Resource Economics and Sciences, Canberra, 95pp.
ABC, 2007, The World Today: Parched city agrees to give water to gold mine Transcript from the World Today, 15 May 2007 ABS, 2000, Water Account for Australia 1993-94 to 1996-97: Australian Bureau of Statistics 4610.0, Canberra, 1 May 2000.
ABS, 2001, Energy and Greenhouse Gas Emissions Accounts, Australia 1992–93 to 1997-98, 124 pp.
ABS, 2003, Year Book Australia 2003: Australian Bureau of Statistics, Canberra, 972pp.
ABS, 2007, An experimental monetary water account for Australia, 2004-05: Australian Bureau of Statistics 4610.0.55.005, 3 July 2008.
ABS, 2010a, Annual water accounts. Water Account Australia, 2008-09. See also ABS’s Environmental Issues: Water use and Conservation: Australian Bureau of Statistics 4610.0, 29 Nov 2010.
ABS, 2010b, Towards an integrated environmental-economic account for Australia, 2010: Australian Bureau of Statistics 4655.0.55.001.
ABS, 2010c, Year Book Australia 2009-10: Australian Bureau of Statistics 1301.0, Canberra.
ABS, 2010d,Environmental issues: Water use and conservation: Australian Bureau of Statistics 4602.0.55.003, Canberra.
ABS, 2011a, Australian Government Water Accounting: Australian Bureau of Statistics 4610.0, Canberra.
ABS, 2011b, Annual water accounts. Water Account Australia, 2009-10: Australian Bureau of Statistics 4610.0, Canberra.
ABS, 2011c, Water use on Australian farms, 2009-10: Australian Bureau of Statistics, Canberra.
ACCC, 2007: State of the energy market 2007: Australian Competition and Consumer Commission, 26th July 2007.
ACCC, 2008, State of the energy market 2008: Australian Competition and Consumer Commission.
ACEEE, 2011, Addressing the energy-water nexus: A blueprint for action and policy agenda: American Council for an Energy-Efficient Economy (ACEEE) and the Alliance for Water Efficiency (AWE), May 2011, 16pp.
ACIL Tasman, 2007, Water Reform and Industry - Implications of recent water initiatives for the minerals, petroleum, energy, pulp and paper industries: Prepared for Department of Industry, Tourism and Resources, April 2007.
ACIL Tasman, 2008, The impact of an ETS on the energy supply industry: Electricity Supply Association of Australia, Melbourne.
AEMO, 2011, Energy Adequacy Assessment Projection (EAAP) reports: Australian Energy Market Operator.
SUSTAINABLE WATER MANAGEMENTw
ww
.atse.org.au
107The Australian Academy of Technological Sciences and Engineering (ATSE)
AGO, 2009, National inventory by economic sector 2007: Australian Greenhouse Office, Canberra.
AGWR, 2008, Australian guidelines for water recycling: managing health and environmental risks (Phase 2): Augmentation of drinking water supplies: Natural Resource Management Ministerial Council, Environment Protection and Heritage Council and the National Health Medical Research Council: Canberra, Paper 22a.
AIATSIS, Native title and fresh and sea water: Australian Institute of Aboriginal and Torres Strait Islander Studies (AIATSIS):.
Ainger, C., Butler, D., Caffor, I., Crawford-Brown, D., Helm. D., Stephenson, T., 2009, A Low Carbon Water Industry in 2050: Environment Agency Report: SC070010/R3 (UK), 42pp.
Allan RP and Soden BJ, 2008, Atmospheric warming and the amplification of precipitation extremes: Science 321, 1481–1484. DOI: 10.1126/science.1160787
Alexander LV and Arblaster JM, 2009, Assessing trends in observed and modelled climate extremes over Australia in relation to future projections: International Journal of Climatology 29, 417–435.
Asano, T and Levine, A, 1998, Wastewater reclamation, recycling and reuse, in Asano, T, Ed, Wastewater Reclamation and Reuse: CRC Press.
ASIRC, 2005, Overview of treatment processes for the production of fit for purpose water: Desalination and membrane technologies: Australian Sustainable Industry Research Centre Ltd Report No.: R05-2207.
Atkins M, Bell I and Fu S, 2010, The development and use of the advanced sustainability assessment tool in the Water Corporation’s Evaluation Process: ENVIRO 2010 conference, 21-23 July, Melbourne.
Atkinson H, 2009, Murray Darling Basin, National Indigenous Studies Conference ANU, Canberra, AIATSIS.
ATSE and the Institution of Engineers, 1999, Water and the Australian economy, 150pp
ATSE, 2004, Water recycling in Australia: 251pp.
ATSE, 2007a, Population Futures: 30/50 – The technological implications of an Australian population of 30 million by 2050, 151pp.
ATSE, 2007b, Urban Water – Review of Water Supply Planning for Australia’s Non-metropolitan Urban Water Utilities: ATSE, 92pp.
ATSE, 2009, The hidden costs of electricity: Externalities of power generation in Australia, 90pp.
ATSE, 2010, Water and its interdependencies on the Australian Economy: International workshop, Sydney 22-23 June 2010. Workshop report, 64pp. Presentations. Focus magazine (Aug 2010), Water and its core role in Australia.
ATSE, 2011a, Australia/Korea: Focus International #3, June 2011.
ATSE, 2011b, Dams and their use for water management in Australia: ATSE submission to the Coalition Dams and Water Management Task Force, 27 May 2011.
ATSE, 2011c, Australia-Korea Green Growth Second International Workshop Report, Melbourne, 17-18 March 2011
AUSCEW, 2010, Australia - United States Climate-Energy-Water Nexus, exploring the challenges of integrated climate, energy and water policy. Policy forums and presentations.
SUSTAINABLE WATER MANAGEMENT
108
ww
w.a
tse.
org.
au
The Australian Academy of Technological Sciences and Engineering (ATSE)
Australian Academy of Science, 2010, The science of climate change: Questions and answers, 24pp.
Australian Financial Review, 2011, Desal bidders forced to wait for key sales price, 4 Nov 2011.
Australian Government,1994, COAG Water Reform Framework, Environment Australia.
Australian Government, 2010, The 2010 intergenerational report: Australia to 2050: Future challenges: Commonwealth of Australia.
Australian Government, 2011, A national plan for environmental information: Commonwealth of Australia.
Australian Government, 2012a, Progress of water recovery under the Restoring the Balance in the Murray-Darling Basin program: Department of Department of Sustainability, Environment, Water, Population and Communities (accessed 10 March 2012).
Australian Government, 2012b, National Greenhouse Gas Inventory: Accounting for the Kyoto Target: Department of Climate Change and Energy Efficiency, Canberra.
AWA, 2010, Cost-reflective pricing: Australian Water Association position paper 2, March 2010, 6pp.
Bark R, Hatton MacDonald D, Connor J, Crossman N, and Jackson S, 2011, Water values, in Prosser, I.P, (Ed), Water: science and solutions for Australia: CSIRO, Canberra.
Bates B, Kundzewicz ZW, Palutikof J and Wu S (Eds), 2008,Climate Change and Water: IPCC Technical Paper VI, 2010pp.
Behrendt J and Thompson P, 2003, The recognition and protection of Aboriginal Interests in NSW Rivers, Healthy Rivers Commission, Sydney.
Bell M, Wilson T and Charles-Edwards E, 2011, Australia’s population future: Probabilistic forecasts incorporating expert judgement: Geographical Research, vol 49, Issue 3, 261–275. DOI: 10.1111/j.1745-5871.2011.00702.x
BHP, 2011, Olympic Dam Project – Environmental Impact Statement (see Comparison with other desalination plants, Appendix H3, Table H.3.1). Also page 147 of Supplementary Environmental Impact Statement, Description of proposed expansion.
BoM, 2011, National water account, 2010: Bureau of Meteorology.
BoM, 2011b, Annual Climate Summary Reports,
BoM 2011c, Australian climate variability and change – trend maps, http://www.bom.gov.au/cgi-bin/climate/change/trendmaps.cgi?map=rain&area=aus&season=0112&period=1970)
Bonn 2011, Bonn2011 Conference: The water, energy and food security nexus – Solutions for the green economy: 16-18 November 2011 (Accessed 18 Dec 2011).
Boughton W, The Australian Water Balance Model: Environmental Modelling & Software, October 2004, pg. 943-956.
Brett, J, 2011, Fair share: Country and city in Australia: The Quarterly Essay 42, p 1-68.
Brown R and Farrelly MA, 2007, Advancing the adoption of diverse water supplies in Australia: A survey of stakeholder perceptions of institutional drivers and barriers: Report No. 07/04, National Urban Water Governance Program, Monash University.
BRS, 2008, Rural water: Bureau of Rural Sciences, 2008, Rural Water, viewed 9 July 2008.
SUSTAINABLE WATER MANAGEMENTw
ww
.atse.org.au
109The Australian Academy of Technological Sciences and Engineering (ATSE)
Bruinsma, J. (ed.), 2003, World agriculture: Towards 2015/2030. An FAO Perspective: Earthscan.
Cai W and T Cowan, 2008, Evidence of impacts from rising temperature on inflows to the Murray-Darling Basin: Geophysical Research Letters, vol 35: L07701, doi:10.1029/2008GL033390
Carbon Farming Initiative, 2011. Australian Government.
Cadogan-Cowper, A, and Johnson, T., 2011, Measuring the green economy: London Group on Environmental Accounting meeting, Stockholm, 12-15 September 2011.
Canberra Times, 2011, Emissions target slugs water users: Canberra Times, 12 Sep 2011. (Accessed 18 Dec 2011).
Carter, N.T., 2011, Desalination: Technologies, use, and congressional Issues: Congressional Research Service Report for Congress R40477, August 15, 2011.
Chiew, F.H.S., 2006, Estimation of rainfall elasticity of streamflow in Australia. Hydrological Sciences Journal 51: 613–625.
Chiew, F and Prosser, I, 2011, Water and climate, in Prosser, I.P, (Ed), Water: science and solutions for Australia: CSIRO, Canberra.
CIE, 2008, Technical Documents: Updated estimates of the cost of water restrictions in the ACT Region: Centre for International Economics,prepared for ActewAGL, Sept 2008.
Clennell, A, 2011, Recycling in Retreat: Daily Telegraph, 27 October 2011.
Cohen, R., Nelson, B. and Wolff, G, 2004, Energy down the drain: The hidden costs of California’s water supply: Pacific Institute & Natural Resources Defense Council.
Commonwealth of Australia, 1900, The Australian Constitution.
Commonwealth of Australia, 2011a, Of drought and flooding rains: Inquiry into the impact of the Guide to the Murray-Darling Basin Plan: House of Representatives Standing Committee on Regional Australia, Tony Winsdor, Chair. Canberra, 2011, 253pp.
Commonwealth of Australia, 2011b, Sustainable Australia –sustainable communities: A sustainable population strategy for Australia: Department of Sustainability, Environment, Water, Population and Communities, 85pp.
Costanza ,R, d’Arge, R, de Groot, R, Farber, S, Grasso, M, Hannon, B, Limburg, K, Naeem, S, O’Neill, RV, Paruelo, J, Raskin, RG, Sutton, P and van den Belt M, 1997, The value of the world’s ecosystem services and natural capital: Nature 387, 253–260.
Cosier, P and McDonald, J, 2010, A Common Currency for Building Environmental (Ecosystem) Accounts. Paper for the 16th meeting of the London Group on Environmental Accounting, Santiago, Chile, October 2010.
Cosier P, 2011, Accounting for the Condition of Environmental Assets: UNCEEA Expert meeting on Ecosystem Accounts in London, 5-7 December 2011.
Cresswell, R, Petheram, C, Harrington, G, Buettikofer, H, Hodgen, M, Davies, P and Li, L, 2009, Water resources in northern Australia: Northern Australia Land and Water Science Review Report ,Chapter 1. CSIRO, Canberra.
SUSTAINABLE WATER MANAGEMENT
110
ww
w.a
tse.
org.
au
The Australian Academy of Technological Sciences and Engineering (ATSE)
CSIRO, 2008, Water availability in the Murray-Darling Basin: A report from CSIRO to the Australian Government: CSIRO, Canberra, 68pp.
CSIRO, 2010, Climate variability and change in south-eastern Australia: A synthesis of findings from Phase 1 of the South Eastern Australian Climate Initiative (SEACI) http://www.seaci.org/publications/documents/SEACI-1%20Reports/Phase1_SynthesisReport.pdf
CSIRO, 2011, Sustainable yield projects: http://www.csiro.au/partnerships/SYP.html.
CSIRO, 2011b, Carbon and rural land use: key findings: CSIRO Fact sheet.
CSIRO, 2011c, Climate change: Science and solutions for Australia, Cleugh H, Stafford Smith M, Battaglia M and Graham P (Eds), CSIRO Publishing, 168pp.
CSIRO, 2012, Groundwater resource assessment in Western Australia - The role of airborne hydrogeophysical methods: CSIRO for a Healthy Country Flagship, Workshop, Kensington WA, 22 Feb 2011. http://www.agu.org/focus_group/nsg/Airborne%20EM%20Workshop_Feb22_Final.pdf
CSIRO and BoM, 2012, State of the climate 2012: CSIRO and Bureau of Meteorology,12pp.
Cullen, P, 2006, Water challenges of the 21st Century: AgForce State Conference, Charleville Qld, 25 July 2006.
Dalla Marta A, Natali F, Mancini M, Ferrise R, Bindi M and Orlandini S, 2011, Energy and water use related to the cultivation of energy crops: a case study in the Tuscany region: Ecology and Society 16(2): 2.
De Groot RS, Stuip MAM, Finlayson CM, Davidson N, 2006, Valuing wetlands: Guidance for valuing the benefits derived from wetland ecosystem services: Ramsar Technical Report No. 3/CBD Technical Series No. 27. Ramsar Convention Secretariat & Secretariat of the Convention on Biological Diversity, Gland, Switzerland & Montreal, Canada, 46pp.
Delta Electricity, 2007, Annual Report 2007.
DIPNR, 2004, Meeting the challenges: securing Sydney’s water future: the Metropolitan Water Plan. NSW Department of Infrastructure, Planning and Natural Resources.
Dominguez-Faus, R, Powers, SE, Burken, JG, Alvarez, PJ, 2009,The water footprint of biofuels: A drink or drive issue?: Environ. Sci. Technol. 2009, 43, 3005–3010.
Duff, N, 2011, Introduction to cultural flows in Australia: Synexe, Brisbane.
Eady S, Grundy M, Battaglia M and Keating B (Eds), 2009, An analysis of greenhouse gas mitigation and carbon biosequestration opportunities from rural land use: CSIRO, 169pp.
EBC, RMCG, Marsden Jacob Associates, EconSearch, McLeod G, Cummins T, Roth G and Cornish D., 2011, Community impacts of the Guide to the proposed Murray-Darling Basin Plan: Murray-Darling Basin Authority, May 2011.
Elimelech M and Phillip WA, 2011, The future of seawater desalination: Energy, technology, and the environment: Science v 333, 712-717. doi:10.1126/science.1200488.
Environment Australia, 2003, Triple Bottom Line Reporting in Australia: A Guide to Reporting Against Environmental Indicators: Environment Australia, 80pp.
EPHC, 2009, Australian Guidelines for Water Recycling – Managed Aquifer Recharge: Natural Resource Management Ministerial Council, Environment Protection and Heritage Council, and the National Health and Medical Research Council, Canberra, 237pp.
SUSTAINABLE WATER MANAGEMENTw
ww
.atse.org.au
111The Australian Academy of Technological Sciences and Engineering (ATSE)
Eslake S and Walsh M. 2011, Australia’s Productivity Challenge: Grattan Institute, 33pp.
eWater CRC, 2011a, The cultural value of water: H2O Thinking, vol 7, July 2011.
eWater CRC, 2011b, Water efficiency with Urban Developer: H2O Thinking, Vol 6, 2011.
Falkenmark M, 2003, Freshwater as shared between society and ecosystems: From divided approaches to integrated challenges: Philos. Trans. R. Soc. Lond., B, Biol. Sci. 358 (1440): 2037–49. doi:10.1098/rstb.2003.1386.
FAO, 2011, Climate Change, Water, and Food Security: UN Food and Agriculture Organization Water report 36, 175pp.
Finlayson M, 2010, Water – a basis for the future: Charles Sturt University. Accessed 5 Aug 2011.
Foran BD and Poldy F. 2002. Future dilemmas: Options to 2050 for Australia’s population, technology, resources and environment: CSIRO Sustainable Ecosystems, Canberra, 377pp.
Frontier Economics, 2007, Analysis of recent changes in NEM wholesale electricity prices: Frontier Economics, 2 May 2007, submission to IPART.
Garnaut R, 2008, Issues paper 1 - Climate Change: Land use - Agriculture and forestry: The Garnaut Climate Change Review 2008.
Garnaut R, 2011a, Australia in the global response to climate change: Cambridge University Press. See also The Garnaut Climate Change Review 2008.
Garnaut R, 2011b, Growth, cycles, climate and structural change: two hard decades ahead: Australia 2030, Focus, No 166, April 2011, 9-11.
Gerbens-Leenes, W, Hoekstra, AY, and van der Meer, TH, 2009, The water footprint of bioenergy: Proc Natl Acad Sci, 106, 10219-10223.
Gill R, 2011, Droughts and flooding rains: water provision for a growing Australia: Centre for Independent Studies Policy Monograph 115, 19pp.
Gleick PH, and Palaniappan M., 2010, Peak water limits to freshwater withdrawal and use: Proc. Nat. Acad. Sci USA, 107 (25), 11155-11162.
Global Reporting Initiative (GRI): www.globalreporting.org/
Grafton Q, and Ward M, 2008, So much money down the drain, The Sydney Morning Herald, 18 July.
Grafton RQ, 2011, Economic costs and benefits of the Proposed Basin Plan, in Connell D, Grafton RQ (Eds.), Basin futures: Water reform in the Murray-Darling Basin. ANU E Press, Canberra, pp. 245 – 261.
Griffiths P, 2003, Energy utilisation and minimisation in the water cycle: Australian Water Association – Water Recycling Australia 2nd National Conference, Brisbane, 1-2 September 2003.
Hallegatte S, 2009, Strategies to adapt to an uncertain climate change: Global Environmental Change 19(2): 240-247. DOI: 10.1016/j.gloenvcha.2008.12.003.
Hamilton, K, 2006, Where is the wealth of nations? Measuring capital for the 21st century: World Bank, Washington DC, 188pp.
SUSTAINABLE WATER MANAGEMENT
112
ww
w.a
tse.
org.
au
The Australian Academy of Technological Sciences and Engineering (ATSE)
Hamilton, K, and Ley, E, 2010, Measuring national income and growth in resource-rich, income-poor countries: Poverty reduction and economic management network, Aug 2010, No 28, World Bank, Washington DC.
Hardisty PE, 2010, Environmental and Economic Sustainability: CRC Press, 337pp.
Hardisty PE, Sivapalan M, and Humphries R, 2012, Determining a sustainable and economically optimal wastewater treatment and discharge strategy: Journal of Environmental Management (in press).
Hatfield-Dodds S, Carwardine J, Dunlop M, Graham P and Klein C, 2007, Rural Australia providing climate solutions: Preliminary report to the Australian Agricultural Alliance on Climate Change: CSIRO Sustainable Ecosystems, Canberra.
Hatton MacDonald D, Morrison M, Rose J and Boyle K, 2011, Valuing a multi-state river: the case of the River Murray: Australian Journal of Agricultural Resource Economics 55(3), 373–391.
Herczeg A, 2011, Groundwater, in Prosser IP (Ed), Water: science and solutions for Australia: CSIRO, Canberra.
Hoang M, Bolto B, Haskard C, Barron O, Gray S, and Leslie G, 2009, Desalination in Australia: CSIRO Water for a Healthy Country National Research Flagship.
Hoekstra AY, Chapagain AK, Maite MA and Mekonnen MM, 2011, The water footprint assessment manual: Earthscan, Washington, 206pp.
Hossain F, Niyogi D, Adegoke J, Kallos G and Pielke R.2011, Making sense of the water resources that will be available for future use: Eos, Vol. 90, No. 17, 26 April 2011.
HSBC, 2010, Sizing the climate economy: HSBC Global Research, 61pp.
Hunwick RJ, 2001, Power station dry cooling: Presentation to Australian Institute of Energy Sydney Branch, July 2001: Hunwick Consultants, Sydney.
Hunwick, RJ 2011, personal communication.
IAASTD, 2009. Agriculture at the Crossroads: International Assessment of Agricultural Knowledge, Science and Technology for Development, 98pp.
IEA, 2011a, Technology Roadmap: Biofuels for Transport: International Energy Agency, Paris. 53pp.
IEA, 2011b, Renewable Energy: Policy Considerations for Deploying Renewables: International Energy Agency, Paris. 74pp.
IOCI (The Indian Ocean Climate Initiative). Research partnership begun in 1977 to investigate the causes of the changing climate in WA and develop projections of the future climate in WA. Partnership between the WA State Government, CSIRO and Bureau of Meteorology.
IPART, 2011a, Review of prices for Sydney Desalination Plant Pty Limited’s water supply services For the period to 30 June 2017: Independent Pricing and Regulatory Tribunal Issues Paper, June 2011.
IPART, 2011b, Review of water prices for Sydney Desalination Plant Pty Limited from 1 July 2012: Independent Pricing and Regulatory Tribunal, December 2011.
IPCC: the Intergovernmental Panel on Climate Change (IPCC).
IPCC, 2011,The IPCC special report on managing the risks of extreme events and disasters to advance climate change adaptation: IPCC. (Full report schedule to be published Feb 2012)
SUSTAINABLE WATER MANAGEMENTw
ww
.atse.org.au
113The Australian Academy of Technological Sciences and Engineering (ATSE)
IWMI, 2007, Climate change adaptation for agriculture and agro-ecosystems: the critical role of water: International Water Management Institute, Sri Lanka.
IWMI, 2008,Water implications of biofuel crops: Understanding tradeoffs and identifying options:Water Policy Brief 30, International Water Management Institute, Sri Lanka.
Jackson,T, 2009, Prosperity without Growth? - The transition to a sustainable economy: Sustainable Development Commission, UK.
Jackson TM, Khan S. and Hafeez M, 2010, A comparative analysis of water application and energy consumption at the irrigated field level: Agric. Water Manage. 97 (10), 1477–1485.
Kenway SJ, Priestley A, Cook S, Seo S, Inman M, Gregory A and Hall M, 2008, Energy use in the provision and consumption of urban water in Australia and New Zealand: CSIRO: Water for a Healthy Country National Research Flagship/WSAA.
Kermane G, McKay J and Wu Z, 2011, No stormwater in my teacup: An internet survey of residents in three Australian cities: Water, v. 39, no 2, 118-124.
Khan S, 2011a, The case for direct potable water reuse in Australia: Water: Journal of the Australian Water Association, 38(4), 92-96.
Khan S, 2011b, Direct potable water recycling (DPR) as a means of flood mitigation: National Water Recycling and Reuse 2011 Conference, IBRC, Melbourne, 3 November 2011.
Kildea P and Williams G, 2011, The Water Act and the Murray Darling Basin Plan: Public Law Review 22 PLR 9.
Klein G, 2005, California’s Water-Energy Relationship: California Energy Commission, 180pp.
Law I, 2011, The great divide – Political will and water industry vision: Water, Vol 38, No 7, 8-9.
Le H, Pritchard T, and Palmer N, 2011, Desalination of hypersaline groundwater for remote mining sites: Water, vol 38, no. 2, 100-103.
LECG, 2010, Competition in the Australian urban water sector: LECG Limited Asia Pacific, National Water Commission Waterlines report No 42, April 2011.
Lenzen M, 2004, Nature, preparation and use of water accounts in Australia: CRC for Catchment Hydrology technical report 04/2.
Lenzen M, 2009, Understanding virtual water flows – a multi-region input-output case study of Victoria: Water Resources Research 45, W09416.
Macquarie Generation, 2007, Annual report 2007.
Marsden Jacob Associates, 2007, The cost effectiveness of rainwater tanks in urban Australia, March 2007: National Water Commission Waterlines Report, No 1, 38pp.
Marsden Jacob Associates, 2008, A national snapshot of current and planned water recycling and reuse rates: Report prepared for the Department of the Environment, Water, Heritage and the Arts, June 2008.
Marsden Jacobs Associates, 2012. Progress against the national target of 30% of Australia’s wastewater being recycled by 2015. Report prepared by Marsden Jacob Associates for the Department of Sustainabilitym Environment, Water, Population and Communities, 74pp.
Marsden J and Pickering P, 2006, Securing Australia’s urban water supplies: Opportunities and impediments: Marsden Jacob for the Department of Prime Minister and Cabinet, 58pp.
SUSTAINABLE WATER MANAGEMENT
114
ww
w.a
tse.
org.
au
The Australian Academy of Technological Sciences and Engineering (ATSE)
McKinsey, 2009, Charting our water future: Economic frameworks to inform decision-making: 2030 Water Resources Group, 185pp.’
Melbourne Water, 2006, Water supply-demand strategy for Melbourne 2006 – 2055: Melbourne Water, 57pp. [Next revision due March 2012]
Millennium Ecosystem Assessment, 2005, Ecosystems and human well-being: General synthesis: Island Press, Washington, DC, 137pp.
Minerals Council of Australia , 2008, 2008-09 Pre Budget Submission p 49 http://www.minerals.org.au/__data/assets/pdf_file/0015/26025/FINAL_08_Pre-Budget_Sub_rev.pdf
Mitchell C, Fane S, Willetts J, Plant R, and Kazaglis A, 2007, Costing for Sustainable Outcomes in Urban Water Systems - A Guidebook: Cooperative Research Centre for Water Quality and Treatment Research Report 35, 94pp.
McMahon J E and Price SK, 2011, Water and energy interactions: Annu. Rev. Environ. Resour., 36:17.1–17.29. doi 10.1146/annurev-environ-061110-103827.
MDBA, 2002, The Living Murray program: Murray Darling Basin Authority.
MDBA, 2011, The draft Basin Plan (proposed Basin Plan): Murray–Darling Basin Authority, Canberra.Media release. Draft Basin Plan. Plain English Summary. Delivering a Healthy, Working Basin.
Moggridge B, 2010, Aboriginal water knowledge and connections: ATSE International Workshop on Water and its Interdependencies on the Australian Economy, 22-23 June 2010.
Morrison M, and Hatton MacDonald D, 2010, Economic Valuation of Environmental Benefits in the Murray-Darling Basin, Charles Sturt University and CSIRO Ecosystems Sciences, 47pp.
MSCI, 2011, Shale Gas and Hydraulic Fracturing in the US: Opportunity or Underestimated Risk?: MSCI ESG Research, Industry in Focus - Unconventional Oil & Gas, Oct 2011, 21pp.
Mukheibir P and Mitchell C, 2011, Planning for resilient water systems – a water supply and demand investment options assessment framework, [prepared for the Smart Water Fund]: Institute for Sustainable Futures, University of Technology, Sydney.
Mushtaq S, and Maraseni T, 2011, Technological change in the Australian irrigation industry: implications for future resource management and policy development: National Water Commission, Waterlines Report 53, Aug 2011.
Nelson N and Leckie T, 2011, Private decentralised recycled water systems – What role will they have?: Discussion paper for Cities of the Future workshop, Ozwater conference 2011.
Newell B, Marsh DM and Sharma D, 2011, Enhancing the resilience of the Australian National Electricity Market: Taking a systems approach in policy development: Ecology and Society 16(2): 15.
NHMRC, 2011, Australian Drinking Water Guidelines 6: National Health and Medical Research Council, Canberra.
Nova, 2008, Making every drop count: Nova: Science in the news: Australian Academy of Sciences, Canberra.
NWC, 2008, Groundwater position statement: National Water Commission, Canberra.
NWC, 2009, Australian Water Reform 2009: Second biennial assessment of progress in
http://www.mdba.gov.au/files/bp-kid/1282-MDBA-NMV-Report-Morrison-and-Hatton-MacDonald-20Sep2010.pdf
SUSTAINABLE WATER MANAGEMENTw
ww
.atse.org.au
115The Australian Academy of Technological Sciences and Engineering (ATSE)
implementation of the National Water Initiative, September 2009: National Water Commission, Canberra.
NWC, 2010, Australian water markets reports 2008-2009: National Water Commission, Canberra.
NWC, 2010a, Australian water markets reports 2009-2010: National Water Commission, Canberra.
NWC, 2010b, The Coal Seam Gas and water challenge: National Water Commission position paper, 3pp.
NWC, 2010c. Position statement on water recycling: National Water Commission position paper, 2pp.
NWC, 2010d, National Water Initiative pricing principles, National Water Commission, Canberra. See also Review of pricing reform in the Australian water sector.
NWC, 2010e, Impacts of water trading in the southern Murray-Darling Basin: An economic, social and environmental assessment: National Water Commission, Canberra, 239pp.
NWC, 2011a, Australian water markets: trends and drivers 2007–08 to 2009–10: National Water Commission, Canberra. 78pp.
NWC, 2011b, Urban water in Australia: future directions: National Water Commission, Canberra. 68pp.
NWC, 2011c, National Performance Report 2009–10: Urban water utilities, April 2011: National Water Commission, Canberra.
NWC, 2011d, National Performance Report 2009-10: Rural water service providers: National Water Commission, Canberra, April 2011, 266pp.
NWC, 2011e, Strengthening Australian water markets: National Water Commission, Canberra, June 2011, 160pp.
NWC, 2011f, Potential local and cumulative effects of mining on groundwater resources - project summary report: National Water Commission, Canberra, June 2011, 13pp.
NWC, 2011g, Australian water markets reports 2010-2011: National Water Commission, Canberra.
NWC, 2011h,Externality pricing in the Australian water sector: Waterlines report No 43, April 2011, 43pp.
NWC, 2011i,Australian water markets: trends and drivers 2007–08 to 2010–11:National Water Commission, Canberra.
NWC, 2011j, Water markets in Australia: a short history: National Water Commission, Canberra.
NWC, 2011k, Efficient water resource pricing in Australia: an assessment of administered scarcity pricing in urban areas: Waterlines report No 44, April 2011, 59pp.
NWC, 2011l, Productivity, efficiency and technological progress in Australia’s urban water utilities: Waterlines report No 62, October 2011, 59pp.
NWC, 2011m, Onshore co-produced water: extent and management: Waterlines report No 54, September 2011.
NWI, 2004, National Water Initiative: Intergovernmental Agreement on a National Water Initiative, Canberra.
SUSTAINABLE WATER MANAGEMENT
116
ww
w.a
tse.
org.
au
The Australian Academy of Technological Sciences and Engineering (ATSE)
OECD, 2011a, Towards green growth, OECD, May 2011, 142pp.
OECD, 2011b,Tools for delivering on green growth: OECD, May 2011,
OECD, 2011c, Towards green growth: Monitoring progress – OECD Indicators, OECD, May 2011, 141pp
OECD Secretary-General Angel Gurria, 2011: OECD Forum 2011: Better Policies for Better Lives http://www.oecd.org/document/10/0,3746,en_21571361_46558043_47729290_1_1_1_1,00.html
Office for Water Security, 2009, Water for Good: South Australian Government, 194 pp.
Orange County Water District, Groundwater recharge and replenishment schemes (accessed 2 Dec 2011)
Paton FL, Dandy GC and Maier HR, 2010, Sensitivity of estimated urban water supply security based on various global circulation models and SRES emission scenarios, Practical Responses to Climate Change National Conference 2010, September 29-October 1, Melbourne, Australia.
Pittock J, 2011, National climate change policies and sustainable water management: Conflicts and synergies: Ecology and Society 16, 25.
Pittock J and Connell D, 2010, Australia demonstrates the planet’s future: Water and climate in the Murray-Darling Basin: International Journal of Water Resources Development vol 26, 561-578.
Pittock J, Finlayson CM, Gardner A., McKay C, 2010, Changing character: the Ramsar Convention on Wetlands and climate change in the Murray-Darling Basin: Australia. Environmental and Planning Law Journal 27, 401-425.
Pittock J and Finlayson C M, 2011, Freshwater ecosystem conservation in the Basin: Principles versus policy, in Grafton Q and Connell D (Eds.), Basin futures: Water reform in the Murray-Darling Basin (pp. 39-58). Canberra: ANU E-press.
Pittock J, Finlayson CM and Howitt JA, 2012, Beguiling and risky: “Environmental works and measures” for wetlands conservation under a changing climate. (Manuscript in preparation)
PMSEIC, 2010. Challenges at energy-water-carbon intersections: Report of the PMSEIC Expert Working Group, October 2010, 88pp.
Polglase P, Reeson A, Hawkins C, Paul K, Siggins A, Turner J, Crawford D, Jovanovic T, Hobbs T, Opie K, Carwardine J and Almeida A, 2011, Opportunities for carbon forestry in Australia: Economic assessment and constraints to implementation CSIRO, 30pp.
Premier of Victoria, 2011a, Northern Victoria Irrigation Renewal Project Stage 2 agreement: Press release, 18 Oct 2011.
Premier of Victoria, 2011b, Toolern sets new standard for water management: Press release, 24 August 2011.
Productivity Commission 2008, Towards urban water reform: a discussion paper: Productivity Commission research paper.
Productivity Commission 2010, Market Mechanisms for Recovering Water in the Murray-Darling Basin: Productivity Commission research report, March 2010, 420pp.
Productivity Commission, 2011a, Australia’s urban water sector: Productivity Commission Inquiry Report Volume 1, No. 55, 31 Aug 2011, Canberra. 548pp.
SUSTAINABLE WATER MANAGEMENTw
ww
.atse.org.au
117The Australian Academy of Technological Sciences and Engineering (ATSE)
Productivity Commission, 2011b, Australia’s urban water sector: Productivity Commission Inquiry Report Volume 2, No. 55, 31 Aug 2011, Canberra. 332pp.
Productivity Commission, 2011c, Carbon emission policies in key economies: Productivity Commission Research Report, Canberra, 231pp.
Productivity Commission, 2011d, Annual Report 2010-11: Productivity Commission, Canberra, 310pp.
Productivity Commission, 2011e, A ‘Sustainable’ Population? – Key Policy Issues, Roundtable Proceedings, Canberra, March:Productivity Commission, Canberra.
Prosser IP (Ed), 2011, Water: science and solutions for Australia: CSIRO, Canberra.
Proust K, Dovers S, Foran B, Newell B, Steffen W and Troy P, 2007, Climate, energy and water – Accounting for the links: Land & Water Australia, 68pp.
Proust K and Newell B, 2006, Catchment and community: Towards a management-focused dynamical study of the ACT water system: Actew Project WF-30038 Final Report, 63pp.
PWC Australia, 2011, Review of urban water quality regulation: National Water Commission Waterlines report 47, May 2011.
Queensland government, 2011, Understanding floods: Questions and answers: Office of the Queensland Chief Scientist, July 2011, 36pp.
QWC, 2010, Water for today, water for tomorrow—South East Queensland water strategy: Queensland Water Commission, Brisbane, 153pp.
Radcliffe J, 2010, Evolution of water recycling in Australian cities since 2003: Water Science and Technology – WST, 62(4), 792-802, IWA publishing
Retamal M, Glassmire J, Abeysuriya K, Turner A and White S, 2009, The water-energy nexus: Investigation into the energy implications of household rainwater systems: Institute for Sustainable Futures, University of Technology Sydney, 71pp.
Repetto R, Magrath W, Wells M, Beer C and Rossini F, 1989, Wasting Assets: Natural Resources in the National Income Accounts, World Resource Institute, Washington D.C.
RPS Aquaterra and Hot Dry Rocks, 2012, Geothermal energy and water use: National Water Commission, Waterlines report 72, 76pp.
Reid-Piko C, Crase, LR, Horwitz P, Butcher R, 2010, Ecosystem services and productive base for the Basin Plan: Final report prepared for the Murray-Darling Basin Authority. MDFRC Publication 06/2010. Murray-Darling Freshwater Research Centre, Wodonga.
Rodriguez C, Van Buynder P, Lugg R, Blair P, Devin B, Cook A and Weinstein, P, 2009, Indirect potable reuse: A sustainable water supply alternative: Intern Jour. Envir. Research and Public Health 2009, 6(3), 1174-1209.
Rothausen, SGSA and Conway D, 2011, Greenhouse-gas emissions from energy use in the water sector: Nature Climate Change, 1, 210-219. DOI: 10.1038/NCLIMATE1147.
Rutherfurd I and Finlayson B, 2011, Whither Australia: Will availability of water constrain the growth of Australia’s population?: Geographical Research, vol 49, Issue 3, 301–316. DOI: 10.1111/j.1745-5871.2011.00707.x
SUSTAINABLE WATER MANAGEMENT
118
ww
w.a
tse.
org.
au
The Australian Academy of Technological Sciences and Engineering (ATSE)
Schroeder E, Tchobanoglous G, Leverenz HL and Asano T, 2012, Direct potable reuse:
Benefits for public water supplies, agriculture, the environment, and energy conservation: National Water Research, California, 14pp.
SEACI (The South Eastern Australian Climate Initiative). Collaboration between Bureau of Meteorology, CSIRO, Australian Government Department of Climate Change and Energy Efficiency, Murray–Darling Basin Authority and Victorian Department of Sustainability and Environment. Website accessed 14 Dec 2011.
Senate committee, 2011, A Balancing Act: provisions of the Water Act 2007,10 June 2011: Commonwealth of Australia.
Siemens, 2011, Desalination: Plunging Price: Pictures of the Future Magazine, Spring 2011.
Shell International, 2011, Shell energy scenarios to 2050, Signals and signposts: Shell International, 41pp.
Sinclair Knight Merz, CSIRO, Bureau of Rural Sciences, 2010, Surface and/or groundwater interception activities: initial estimates: National Water Commission Waterlines report 30, Canberra, 166pp.
Skinner R and Young R, 2010, Cities of the Future: Ozwater workshop, 9-10 March 2010, Brisbane.
SKM and CSIRO, 2012, Progress in Managed Aquifer Recharge in Australia: National Water Commission, Waterlines report No 73, 108pp.
Smart A and Aspinall A, 2009, Water and the generation industry - implications of use: National Water Commission Waterlines report no 18. Report (101 pp).
SMH, 2011, Another try on Murray-Darling: Sydney Morning Herald, Editorial, 29 Nov 2011 (accessed 29 Nov 2011). http://www.smh.com.au/opinion/editorial/another-try-on-murraydarling-20111128-1o36f.html
Steffen W, 2011, The Critical Decade –Climate science, risks and responses: Climate Commission, Department of Climate Change and Energy Efficiency, 70pp.
Stokes, J.R., and Horvath, A., 2009, Energy and air emission effects of water supply: Environ. Sci. Technol., 43 (8), 2680–2687. DOI: 10.1021/es801802h.
Sydney Water, 2011, Sydney Desalination Plant lowers production: Media release, Dec 9, 2011. Accessed 10 Dec 2011.
Talebpour M, Stewart R, Beal C, Dowlong B, Sharma A and Fane S, 2011, Rainwater tank end usage and energy demand: A pilot study: Water, v 38, no 1, 97-100.
Ten Brink P, Berghöfer A, Schröter-Schlaack C, Sukhdev P, Vakrou A. White S and Wittmer, H, 2009, TEEB: The economics of ecosystems and biodiversity: Summary: Responding to the value of nature: UNEP, Bonn, 42pp.
Thomas M, and Wright,J, 2008, Biofuels for Transport: A roadmap for development in Australia: ATSE, Melbourne.
Trensen J, 2010, Water issues in jurisdictional planning for mining: National Water Commission Waterlines Report No 29 (67pp).
United Nations Conference on Sustainable Development (UNCSD), 2012,
SUSTAINABLE WATER MANAGEMENTw
ww
.atse.org.au
119The Australian Academy of Technological Sciences and Engineering (ATSE)
UNEP, 2011a, Towards a green economy: Pathways to sustainable development and poverty eradication: United Nations Environmental Programme, 631pp. (Green economy report)
UNEP, 2011b, Water: Investing in natural capital: in Green Economy Report, chapter 11, 111-150: United Nations Environment Programme.
UNESCO, 2009, Water in a Changing World: World Water Assessment Programme, United
Nations World Water Development Report 3, United Nations Educational, Scientific and Cultural Organization.
United Nations, 2011, System of Environmental-Economic Accounts (SEEA):United Nations, New York. See also the UN’s discussion of Water Accounts under the SEAA.
United Nations 2012, System of Environmental-Economic Accounts (SEEA): United Nations Statistical Division.
Victorian Government, 2011, Living Melbourne, Living Victoria roadmap: Department of Sustainability and Environment, 21pp.
Vörösmarty CJ, McIntyre PB, Gessner MO, Dudgeon D, Prusevich A, Green AP, Glidden S, Bunn SE, Sullivan CA, Reidy Liermann C and PDavies PM, 2010, Global threats to human water security and river biodiversity: Nature v 467, 556-361. doi:10.1038/nature09440.
Water Corporation, 2011a, Public Environment Review, Southern Seawater Desalination Project, Chapter 13 - Sustainability and Environmental Protection: Water Corporation (accessed 17 Feb 2012)
Water Corporation, 2011b, Banking water in the ground: reWater Magazine, Autumn 2011, Water Corporation, Perth (accessed 17 Feb 2012).
Water Corporation, 2011c, Yearly streamflow for major surface water sources http://www.watercorporation.com.au/D/dams_streamflow.cfm
Weir,JK, 2010, Cultural flows in Murray River Country: Australian Humanities Review, Issue 48, May 2010.
Wentworth Group of Concerned Scientists, 2008,Accounting for nature: A model for building the National Environmental Accounts of Australia: Wentworth Group of Concerned Scientists, 2008, 14pp.
Wentworth Group of Concerned Scientists, 2010, Sustainable Diversions in the Murray-Darling Basin (32 pp)
The Wentworth Group of Concerned Scientists, 2012, Statement on the 2011 Draft Murray-Darling Basin Plan: Response to the release of the Draft Plan on November 28, 2011
WERF, 2011, Dutch Wastewater Program Hopes to Develop Energy-Positive Plants by 2020: Water Environment Research Foundation. See also project description of Energy Factory.
White S, Campbell D, Giurco D., Snelling C, Kazaglis A and Fane S, 2006, Review of the Metropolitan Water Plan: Final Report: Institute for Sustainable Futures, Sydney
Whitten SM, Coggan A, Reeson A and Shelton D, 2009, Market based instruments for ecosystem services in a regional context: RIRDC Publication No 08/196. RIRDC, Canberra, 48pp.
Wong, THF (ed), 2011, Stormwater management in a water sensitive city: Centre for Water Sensitive Cities, Monash University, 48pp.
SUSTAINABLE WATER MANAGEMENT
120
ww
w.a
tse.
org.
au
The Australian Academy of Technological Sciences and Engineering (ATSE)
Woods P, Hynes R, Jones M, Walters R, Sullivan J and Ferguson M, 2011, Carbon abatement at Sydney Water: Applying the cost of carbon abatement tool: Water, Nov 2011, 78-83
World Commission on Environment and Development, 1987, Our Common Future: Oxford University Press.
World Economic Forum, 2011, Global Risks 2011: World Economic Forum, Jan 2011, 58pp.
World Water Assessment Programme, 2009, Water in a changing world: The United Nations World Water Development Report 3: UNESCO Publishing and Earthscan, Paris and London, 75pp.
WSAA, 2002, Greenhouse Horizons Report: WSAA Occasional Paper 5, 20pp.
WSAA, 2008a, Energy and Greenhouse Mitigation Strategies: WSAA Occasional Paper 19, 38pp.
WSAA, 2008b: Real options and urban water resource planning: Water Services Association of Australia Occasional, Paper 20
WSAA, 2010a, WSAA Report Card for 2009–2010, Performance of the Australian urban water industry and projections for the future: Water Services Association of Australia, Melbourne
WSAA, 2010b, Implications of population growth in Australia on urban water resources: WSAA Occasional Paper 25, 26pp.
WSAA, 2011, Take the politics out of water: Water Services Association of Australia Media release 20 April 2011. See also - Politicians sluice billions away: Alan Mitchell, AFR 2 May 2011.
WSAA, 2012, Cities of the Future: 2011 Report and Recommendations: Water Services Association of Australia, Occasional paper 26. 30pp.
Yarra Valley Water, 2011, Community cost model. See Community Cost: A journey and an evolution? and Response to Productivity Commission’s issue paper “Australia’s urban water sector”.
Young, M, Shi, T and McIntyre W, 2006, Informing reform: scoping the affects, effects and effectiveness of high level water policy reforms on irrigation investment and practice in four irrigation areas: Cooperative Research Centre for Irrigation Futures, Adelaide.
Young M, 2011, Longevity of basin key to success: Australian Financial Review, 28 Nov 2011, p.61.
Young WJ, Bond N, Brookes J, Gawne B and Jones GJ, 2011, Science review of the estimation of an environmentally sustainable level of take for the Murray-Darling Basin: A report to the Murray-Darling Basin Authority from the CSIRO Water for a Healthy Country Flagship. 36pp.
Zakkour PD, Gaterell MR, Griffin P, Gochin R J and Lester J N, 2002, Developing a sustainable energy strategy for a water utility: Journal of Environmental Management, 66, 115-125. doi:10.1006/jema.2002.0567
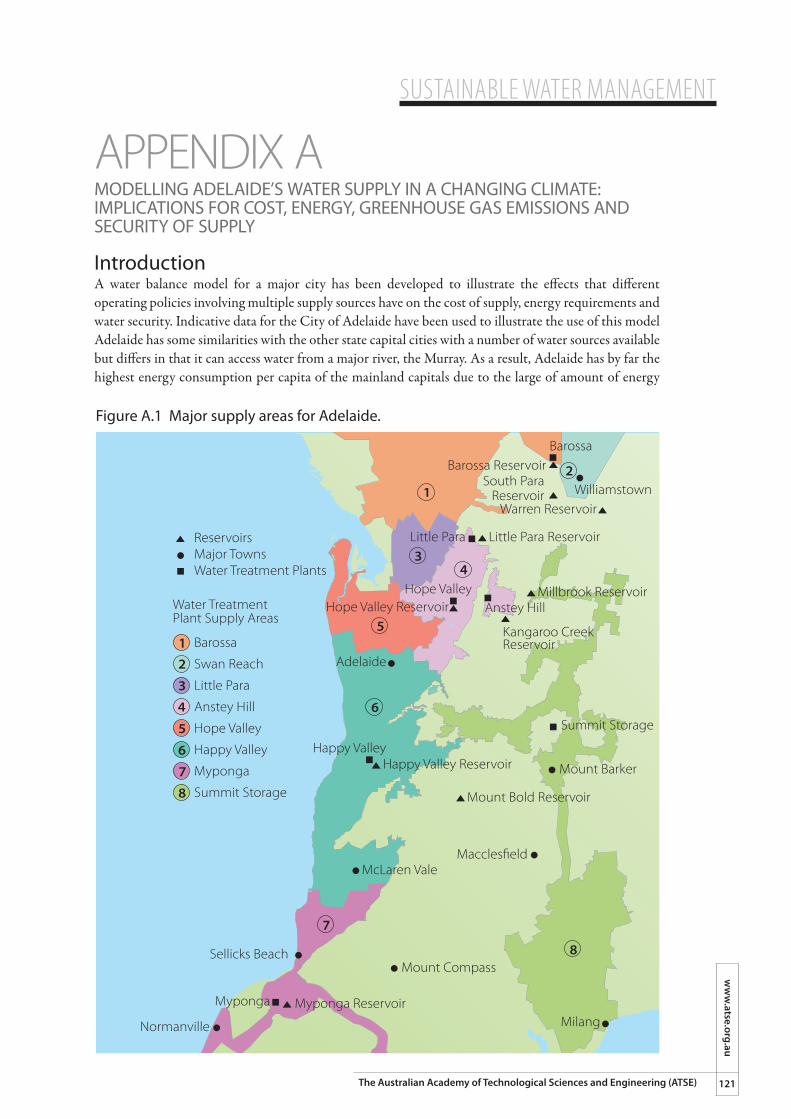
SUSTAINABLE WATER MANAGEMENTw
ww
.atse.org.au
121The Australian Academy of Technological Sciences and Engineering (ATSE)
APPENDIX AMODELLING ADELAIDE’S WATER SUPPLY IN A CHANGING CLIMATE: IMPLICATIONS FOR COST, ENERGY, GREENHOUSE GAS EMISSIONS AND SECURITY OF SUPPLY
IntroductionA water balance model for a major city has been developed to illustrate the effects that different operating policies involving multiple supply sources have on the cost of supply, energy requirements and water security. Indicative data for the City of Adelaide have been used to illustrate the use of this model Adelaide has some similarities with the other state capital cities with a number of water sources available but differs in that it can access water from a major river, the Murray. As a result, Adelaide has by far the highest energy consumption per capita of the mainland capitals due to the large of amount of energy
1
34
5
6
7
8
2Williamstown
Adelaide
Mount Barker
Maccles�eldMcLaren Vale
Mount Compass
Normanville
Sellicks Beach
Milang
Barossa ReservoirBarossa
South ParaReservoir
Hope Valley ReservoirHope Valley
Anstey Hill
Happy Valley Reservoir
Warren Reservoir
Little Para ReservoirLittle Para
Millbrook Reservoir
Kangaroo Creek Reservoir
Mount Bold Reservoir
Myponga ReservoirMyponga
Summit Storage
Happy Valley
12
3
4
5
6
7
8
ReservoirsMajor TownsWater Treatment Plants
Water Treatment Plant Supply Areas
Barossa
Swan Reach
Little Para
Anstey Hill
Hope Valley
Happy Valley
Myponga
Summit Storage
Figure A.1 Major supply areas for Adelaide.
SUSTAINABLE WATER MANAGEMENT
122
ww
w.a
tse.
org.
au
The Australian Academy of Technological Sciences and Engineering (ATSE)
expended in pumping water (Figure 6.5). Therefore, Adelaide is likely to be at the forefront of urban systems that will feel the impact of increasing electricity prices and the desire to reduce greenhouse gas emissions associated with water supply and sewage treatment and disposal.
The Adelaide SystemAdelaide has a population of 1.2 million people, with an average annual rainfall of 550 mm, hot dry summers and wet winters. The average annual pan evaporation is 1500 mm. There is a strong seasonality of demand with about 40 per cent of the domestic water consumption used for garden watering.
The demand for water in Adelaide is largely met by supply from catchments in the Mt Lofty Ranges and pumping from the River Murray. On average, 40 per cent of the supply comes from the River Murray, although in a dry year that may be as high as 90 per cent. During the 2006 to 2010 drought the available supply of water from both the local catchments and the River Murray were significantly below historical levels and severe water restrictions had to be imposed. In response to the drought, the State Government initiated the planning, design and construction of a desalination plant that commenced operation in late 2011.
The major supply areas for Greater Adelaide are shown in Figure A.1.
The Water for Good Plan published in 2009 (Government of South Australia, 2009) identified the need to draw Adelaide’s water supply from a diversity of sources including the catchments in the Mt Lofty Ranges, the River Murray, desalination, reclaimed wastewater, stormwater and rainwater tanks, combined with a variety of demand-side conservation measures.
The Adelaide Water Balance ModelThe Adelaide Water Balance Model (AWBM) simulates the operation of various sources of water and supply zones over the period 2010-2050 under conditions of population growth and climate change. The sources of water are:¢ �Mt Lofty Ranges (catchments),¢ �River Murray,¢ �Seawater desalination¢ �Harvested stormwater, and¢ �Reclaimed wastewater.
The model is based on the water balance of various storages and supply areas and operates on a monthly time step. The model can be used to investigate the impacts of drawing water from the various sources and calculates the cost, energy requirements and associated greenhouse emissions and security of supply. There are clearly other externalities associated with the various water supply sources considered including the environmental impacts on the urban environment, local catchments and rivers, the River Murray, Lower Lakes and Coorong as well as the coastal waters adjacent to the City of Adelaide. This analysis does not include these externalities.
The model is described in greater detail in Appendix B.
Model Assumptions
DemandThere are five demand zones in the model (Table A.1). The total annual consumption for Adelaide has declined in recent years (Figure A.2) due to a combination of voluntary water conservation measures,
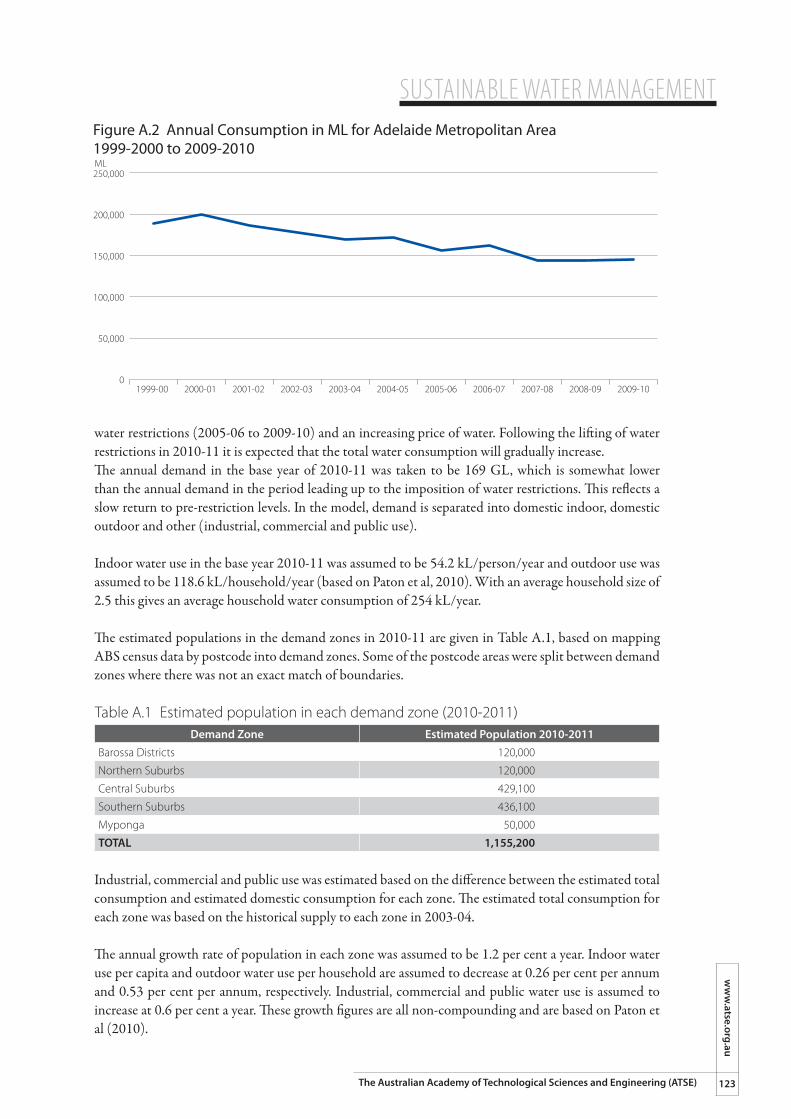
SUSTAINABLE WATER MANAGEMENTw
ww
.atse.org.au
123The Australian Academy of Technological Sciences and Engineering (ATSE)
water restrictions (2005-06 to 2009-10) and an increasing price of water. Following the lifting of water restrictions in 2010-11 it is expected that the total water consumption will gradually increase. The annual demand in the base year of 2010-11 was taken to be 169 GL, which is somewhat lower than the annual demand in the period leading up to the imposition of water restrictions. This reflects a slow return to pre-restriction levels. In the model, demand is separated into domestic indoor, domestic outdoor and other (industrial, commercial and public use).
Indoor water use in the base year 2010-11 was assumed to be 54.2 kL/person/year and outdoor use was assumed to be 118.6 kL/household/year (based on Paton et al, 2010). With an average household size of 2.5 this gives an average household water consumption of 254 kL/year.
The estimated populations in the demand zones in 2010-11 are given in Table A.1, based on mapping ABS census data by postcode into demand zones. Some of the postcode areas were split between demand zones where there was not an exact match of boundaries.
Table A.1 Estimated population in each demand zone (2010-2011)Demand Zone Estimated Population 2010-2011
Barossa Districts 120,000
Northern Suburbs 120,000
Central Suburbs 429,100
Southern Suburbs 436,100
Myponga 50,000
TOTAL 1,155,200
Industrial, commercial and public use was estimated based on the difference between the estimated total consumption and estimated domestic consumption for each zone. The estimated total consumption for each zone was based on the historical supply to each zone in 2003-04.
The annual growth rate of population in each zone was assumed to be 1.2 per cent a year. Indoor water use per capita and outdoor water use per household are assumed to decrease at 0.26 per cent per annum and 0.53 per cent per annum, respectively. Industrial, commercial and public water use is assumed to increase at 0.6 per cent a year. These growth figures are all non-compounding and are based on Paton et al (2010).
Figure A.2 Annual Consumption in ML for Adelaide Metropolitan Area 1999-2000 to 2009-2010250,000
200,000
150,000
100,000
50,000
0
ML
1999-00 2000-01 2001-02 2002-03 2003-04 2004-05 2005-06 2006-07 2007-08 2008-09 2009-10
SUSTAINABLE WATER MANAGEMENT
124
ww
w.a
tse.
org.
au
The Australian Academy of Technological Sciences and Engineering (ATSE)
Water SourcesThe model allows for water to be provided from the following sources: reservoirs in the Mt Lofty Ranges, pumping from the River Murray, the desalination plant, stormwater harvesting and reclaimed wastewater.
The fraction supplied to each demand zone from each source is specified by the user, and can be changed for each 10 years of the simulation. The 10 reservoirs in the Mt Lofty Ranges are grouped by catchment and modelled as lumped storages. The catchments are: Little Para (Little Para reservoir), South Para (Warren, South Para and Barossa reservoirs), Torrens (Millbrook, Kangaroo Creek and Hope Valley reservoirs), Onkaparinga (Mt Bold and Happy Valley reservoirs) and Myponga (Myponga reservoir).
In the model, water pumped from the River Murray is initially supplied to the relevant reservoirs and, from there, supplied to the demand zones. This is not strictly correct as River Murray water can be supplied directly to Anstey Hill water treatment plant via the Mannum-Adelaide pipeline, but is considered reasonable given the other assumptions in the model.
SA Water currently has a water entitlement to take a total of 650 GL from the River Murray for Adelaide’s water supply over a rolling five-year period. For simplicity in this study, it is assumed that, if more than 130 GL per year is pumped from the River Murray to Adelaide in any one year, the excess is purchased via temporary water trading at a price of $0.25/kL.
It is assumed that water from the desalination plant can be used to supply any demand zone and that flow through the plant can be varied on a monthly basis.
Stormwater harvesting schemes in the Northern, Central and Southern suburbs are modelled as a single equivalent catchment and storage in each zone. The volumes of harvested stormwater included in the model represent new schemes implemented from July 2010 onwards. Additional capital cost would be incurred if they were to be constructed and utilised. It is assumed that treated stormwater will only be used for non-potable purposes such as industrial use, watering of public open space and domestic gardens and toilet flushing.
In 2009, Adelaide recycled 30 per cent its wastewater effluent (Government of South Australia, 2009). In the current study, recycled wastewater represents additional recycling schemes that are implemented from July 2010 onwards. As the model includes only water use in Metropolitan Adelaide, the reuse volume included is the volume that would replace (and hence reduce) mains water consumption. Additional volumes of reclaimed wastewater that are used for irrigation in peri-urban areas and are not currently supplied from mains water are not considered in the model. Like treated stormwater, it is assumed that reclaimed wastewater will only be used for non-potable purposes such as industrial use, watering of public open space and domestic gardens and toilet flushing.
The possible sources of supply for each zone are summarised in Table A.2. The Northern, Central and Southern zones can only be supplied with stormwater from the Northern, Central and Southern stormwater harvesting schemes, respectively.
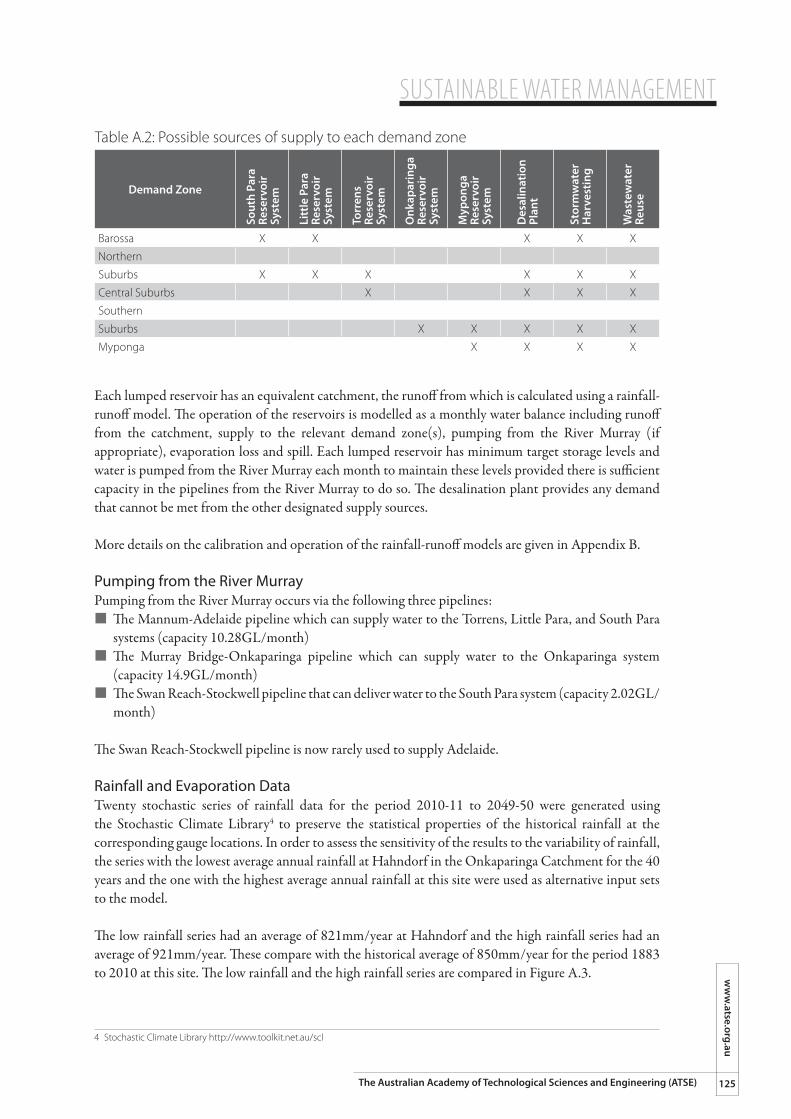
SUSTAINABLE WATER MANAGEMENTw
ww
.atse.org.au
125The Australian Academy of Technological Sciences and Engineering (ATSE)
Table A.2: Possible sources of supply to each demand zone
Demand Zone
Sout
h Pa
ra
Rese
rvoi
r Sy
stem
Litt
le P
ara
Re
serv
oir
Syst
em
Torr
ens
Rese
rvoi
r Sy
stem
Onk
apar
inga
Re
serv
oir
Syst
em
Myp
onga
Re
serv
oir
Syst
em
Des
alin
atio
nPl
ant
Stor
mw
ater
Har
vest
ing
Was
tew
ater
Reus
e
Barossa X X X X X
Northern
Suburbs X X X X X X
Central Suburbs X X X X
Southern
Suburbs X X X X X
Myponga X X X X
Each lumped reservoir has an equivalent catchment, the runoff from which is calculated using a rainfall-runoff model. The operation of the reservoirs is modelled as a monthly water balance including runoff from the catchment, supply to the relevant demand zone(s), pumping from the River Murray (if appropriate), evaporation loss and spill. Each lumped reservoir has minimum target storage levels and water is pumped from the River Murray each month to maintain these levels provided there is sufficient capacity in the pipelines from the River Murray to do so. The desalination plant provides any demand that cannot be met from the other designated supply sources.
More details on the calibration and operation of the rainfall-runoff models are given in Appendix B.
Pumping from the River MurrayPumping from the River Murray occurs via the following three pipelines:¢ �The Mannum-Adelaide pipeline which can supply water to the Torrens, Little Para, and South Para
systems (capacity 10.28GL/month)¢ �The Murray Bridge-Onkaparinga pipeline which can supply water to the Onkaparinga system
(capacity 14.9GL/month)¢ �The Swan Reach-Stockwell pipeline that can deliver water to the South Para system (capacity 2.02GL/
month)
The Swan Reach-Stockwell pipeline is now rarely used to supply Adelaide.
Rainfall and Evaporation DataTwenty stochastic series of rainfall data for the period 2010-11 to 2049-50 were generated using the Stochastic Climate Library4 to preserve the statistical properties of the historical rainfall at the corresponding gauge locations. In order to assess the sensitivity of the results to the variability of rainfall, the series with the lowest average annual rainfall at Hahndorf in the Onkaparinga Catchment for the 40 years and the one with the highest average annual rainfall at this site were used as alternative input sets to the model.
The low rainfall series had an average of 821mm/year at Hahndorf and the high rainfall series had an average of 921mm/year. These compare with the historical average of 850mm/year for the period 1883 to 2010 at this site. The low rainfall and the high rainfall series are compared in Figure A.3.
4 Stochastic Climate Library http://www.toolkit.net.au/scl
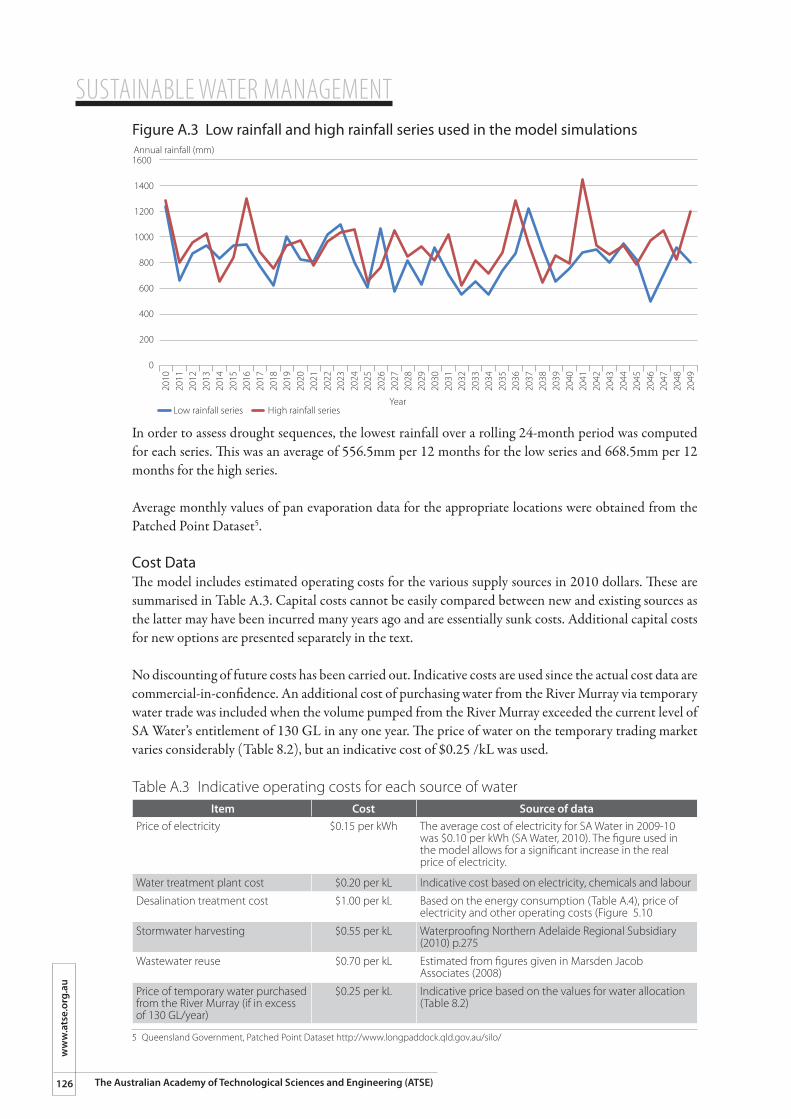
SUSTAINABLE WATER MANAGEMENT
126
ww
w.a
tse.
org.
au
The Australian Academy of Technological Sciences and Engineering (ATSE)
In order to assess drought sequences, the lowest rainfall over a rolling 24-month period was computed for each series. This was an average of 556.5mm per 12 months for the low series and 668.5mm per 12 months for the high series.
Average monthly values of pan evaporation data for the appropriate locations were obtained from the Patched Point Dataset5.
Cost DataThe model includes estimated operating costs for the various supply sources in 2010 dollars. These are summarised in Table A.3. Capital costs cannot be easily compared between new and existing sources as the latter may have been incurred many years ago and are essentially sunk costs. Additional capital costs for new options are presented separately in the text.
No discounting of future costs has been carried out. Indicative costs are used since the actual cost data are commercial-in-confidence. An additional cost of purchasing water from the River Murray via temporary water trade was included when the volume pumped from the River Murray exceeded the current level of SA Water’s entitlement of 130 GL in any one year. The price of water on the temporary trading market varies considerably (Table 8.2), but an indicative cost of $0.25 /kL was used.
Table A.3 Indicative operating costs for each source of water Item Cost Source of data
Price of electricity $0.15 per kWh The average cost of electricity for SA Water in 2009-10 was $0.10 per kWh (SA Water, 2010). The figure used in the model allows for a significant increase in the real price of electricity.
Water treatment plant cost $0.20 per kL Indicative cost based on electricity, chemicals and labour
Desalination treatment cost $1.00 per kL Based on the energy consumption (Table A.4), price of electricity and other operating costs (Figure 5.10
Stormwater harvesting $0.55 per kL Waterproofing Northern Adelaide Regional Subsidiary (2010) p.275
Wastewater reuse $0.70 per kL Estimated from figures given in Marsden Jacob Associates (2008)
Price of temporary water purchased from the River Murray (if in excess of 130 GL/year)
$0.25 per kL Indicative price based on the values for water allocation (Table 8.2)
Figure A.3 Low rainfall and high rainfall series used in the model simulations
1600
1400
1200
1000
800
600
400
200
0
Annual rainfall (mm)20
1020
1120
1220
1320
1420
1520
1620
1720
1820
1920
2020
2120
2220
2320
2420
2520
2620
2720
2820
2920
3020
3120
3220
3320
3420
3520
3620
3720
3820
3920
4020
4120
4220
4320
4420
4520
4620
4720
4820
49
YearLow rainfall series High rainfall series
5 Queensland Government, Patched Point Dataset http://www.longpaddock.qld.gov.au/silo/
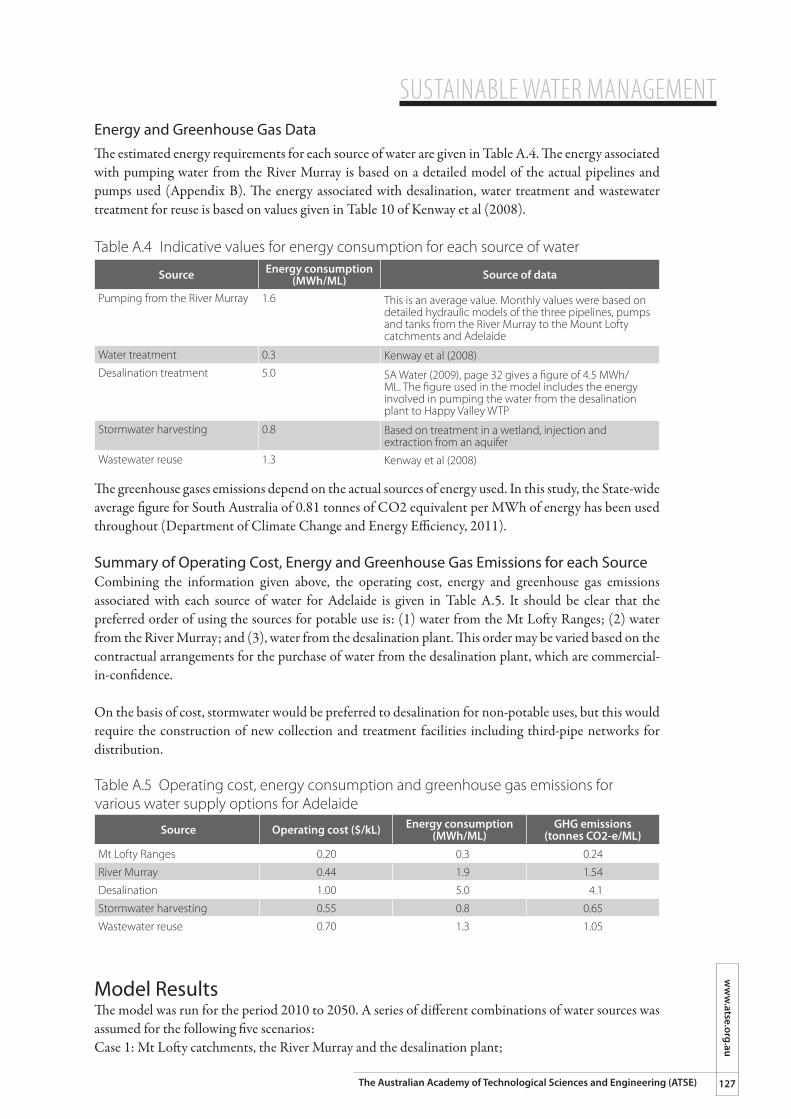
SUSTAINABLE WATER MANAGEMENTw
ww
.atse.org.au
127The Australian Academy of Technological Sciences and Engineering (ATSE)
Energy and Greenhouse Gas DataThe estimated energy requirements for each source of water are given in Table A.4. The energy associated with pumping water from the River Murray is based on a detailed model of the actual pipelines and pumps used (Appendix B). The energy associated with desalination, water treatment and wastewater treatment for reuse is based on values given in Table 10 of Kenway et al (2008).
Table A.4 Indicative values for energy consumption for each source of water
Source Energy consumption(MWh/ML) Source of data
Pumping from the River Murray 1.6 This is an average value. Monthly values were based on detailed hydraulic models of the three pipelines, pumps and tanks from the River Murray to the Mount Lofty catchments and Adelaide
Water treatment 0.3 Kenway et al (2008)Desalination treatment 5.0 SA Water (2009), page 32 gives a figure of 4.5 MWh/
ML. The figure used in the model includes the energy involved in pumping the water from the desalination plant to Happy Valley WTP
Stormwater harvesting 0.8 Based on treatment in a wetland, injection and extraction from an aquifer
Wastewater reuse 1.3 Kenway et al (2008)
The greenhouse gases emissions depend on the actual sources of energy used. In this study, the State-wide average figure for South Australia of 0.81 tonnes of CO2 equivalent per MWh of energy has been used throughout (Department of Climate Change and Energy Efficiency, 2011).
Summary of Operating Cost, Energy and Greenhouse Gas Emissions for each SourceCombining the information given above, the operating cost, energy and greenhouse gas emissions associated with each source of water for Adelaide is given in Table A.5. It should be clear that the preferred order of using the sources for potable use is: (1) water from the Mt Lofty Ranges; (2) water from the River Murray; and (3), water from the desalination plant. This order may be varied based on the contractual arrangements for the purchase of water from the desalination plant, which are commercial-in-confidence.
On the basis of cost, stormwater would be preferred to desalination for non-potable uses, but this would require the construction of new collection and treatment facilities including third-pipe networks for distribution.
Table A.5 Operating cost, energy consumption and greenhouse gas emissions for various water supply options for Adelaide
Source Operating cost ($/kL) Energy consumption(MWh/ML)
GHG emissions(tonnes CO2-e/ML)
Mt Lofty Ranges 0.20 0.3 0.24
River Murray 0.44 1.9 1.54
Desalination 1.00 5.0 4.1
Stormwater harvesting 0.55 0.8 0.65
Wastewater reuse 0.70 1.3 1.05
Model ResultsThe model was run for the period 2010 to 2050. A series of different combinations of water sources was assumed for the following five scenarios:Case 1: Mt Lofty catchments, the River Murray and the desalination plant;
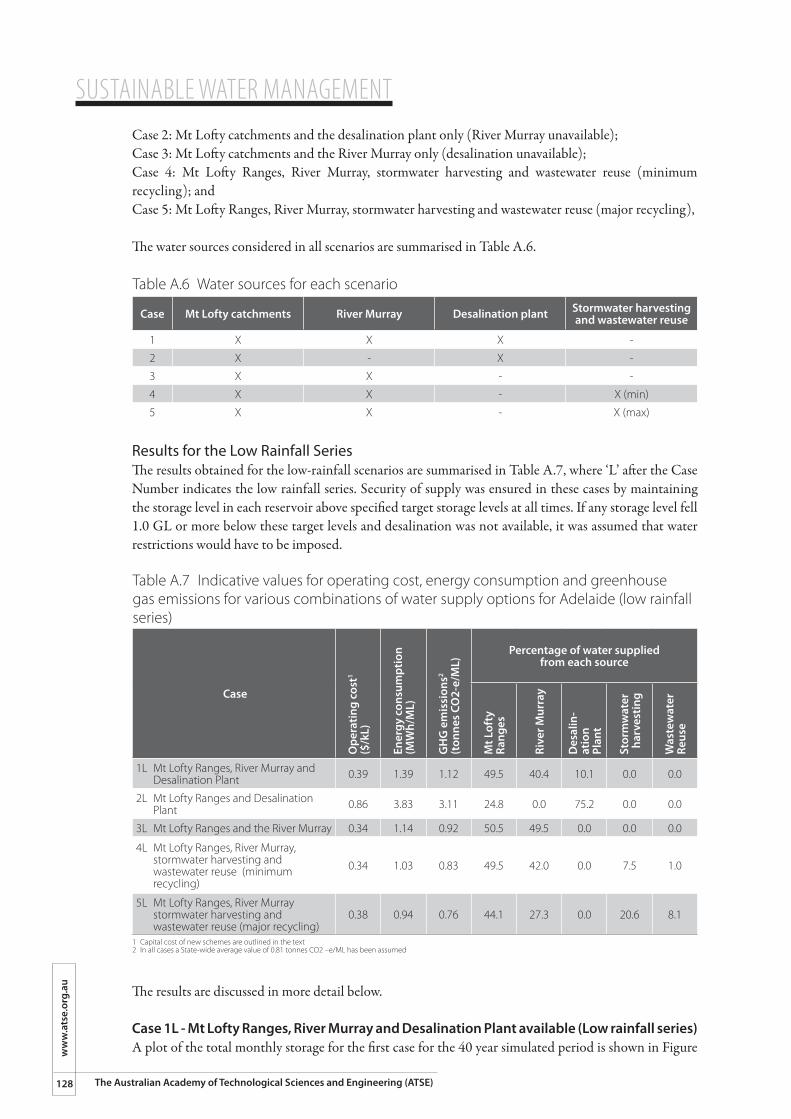
SUSTAINABLE WATER MANAGEMENT
128
ww
w.a
tse.
org.
au
The Australian Academy of Technological Sciences and Engineering (ATSE)
Case 2: Mt Lofty catchments and the desalination plant only (River Murray unavailable); Case 3: Mt Lofty catchments and the River Murray only (desalination unavailable);Case 4: Mt Lofty Ranges, River Murray, stormwater harvesting and wastewater reuse (minimum recycling); andCase 5: Mt Lofty Ranges, River Murray, stormwater harvesting and wastewater reuse (major recycling),
The water sources considered in all scenarios are summarised in Table A.6.
Table A.6 Water sources for each scenario
Case Mt Lofty catchments River Murray Desalination plant Stormwater harvesting and wastewater reuse
1 X X X -
2 X - X -
3 X X - -
4 X X - X (min)
5 X X - X (max)
Results for the Low Rainfall SeriesThe results obtained for the low-rainfall scenarios are summarised in Table A.7, where ‘L’ after the Case Number indicates the low rainfall series. Security of supply was ensured in these cases by maintaining the storage level in each reservoir above specified target storage levels at all times. If any storage level fell 1.0 GL or more below these target levels and desalination was not available, it was assumed that water restrictions would have to be imposed.
Table A.7 Indicative values for operating cost, energy consumption and greenhouse gas emissions for various combinations of water supply options for Adelaide (low rainfall series)
Case
Ope
ratin
g co
st1
($/k
L)
Ener
gy c
onsu
mpt
ion
(MW
h/M
L)
GH
G e
mis
sion
s2
(ton
nes
CO2-
e/M
L)
Percentage of water supplied from each source
Mt L
ofty
Ra
nges
Rive
r Mur
ray
Des
alin
-at
ion
Plan
t
Stor
mw
ater
harv
estin
g
Was
tew
ater
Re
use
1L Mt Lofty Ranges, River Murray and Desalination Plant 0.39 1.39 1.12 49.5 40.4 10.1 0.0 0.0
2L Mt Lofty Ranges and Desalination Plant 0.86 3.83 3.11 24.8 0.0 75.2 0.0 0.0
3L Mt Lofty Ranges and the River Murray 0.34 1.14 0.92 50.5 49.5 0.0 0.0 0.0
4L Mt Lofty Ranges, River Murray, stormwater harvesting and wastewater reuse (minimum recycling)
0.34 1.03 0.83 49.5 42.0 0.0 7.5 1.0
5L Mt Lofty Ranges, River Murray stormwater harvesting and wastewater reuse (major recycling)
0.38 0.94 0.76 44.1 27.3 0.0 20.6 8.1
1 Capital cost of new schemes are outlined in the text2 In all cases a State-wide average value of 0.81 tonnes CO2 –e/ML has been assumed
The results are discussed in more detail below.
Case 1L - Mt Lofty Ranges, River Murray and Desalination Plant available (Low rainfall series)A plot of the total monthly storage for the first case for the 40 year simulated period is shown in Figure
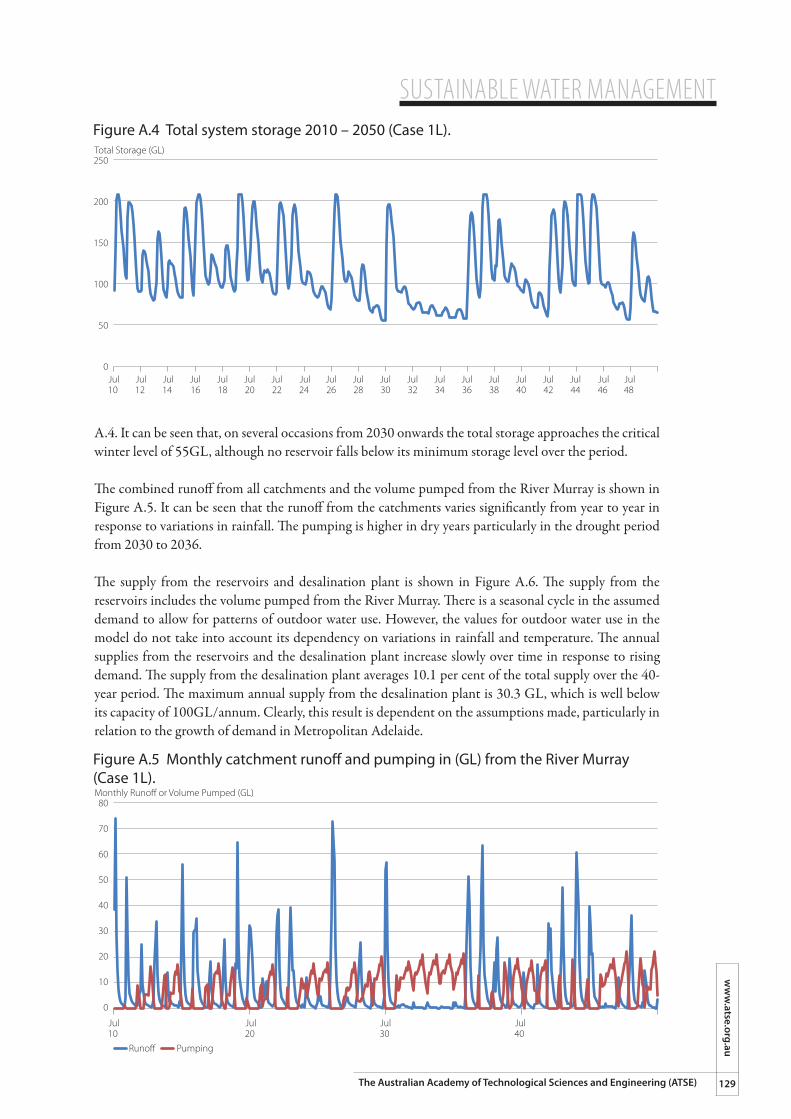
SUSTAINABLE WATER MANAGEMENTw
ww
.atse.org.au
129The Australian Academy of Technological Sciences and Engineering (ATSE)
A.4. It can be seen that, on several occasions from 2030 onwards the total storage approaches the critical winter level of 55GL, although no reservoir falls below its minimum storage level over the period.
The combined runoff from all catchments and the volume pumped from the River Murray is shown in Figure A.5. It can be seen that the runoff from the catchments varies significantly from year to year in response to variations in rainfall. The pumping is higher in dry years particularly in the drought period from 2030 to 2036.
The supply from the reservoirs and desalination plant is shown in Figure A.6. The supply from the reservoirs includes the volume pumped from the River Murray. There is a seasonal cycle in the assumed demand to allow for patterns of outdoor water use. However, the values for outdoor water use in the model do not take into account its dependency on variations in rainfall and temperature. The annual supplies from the reservoirs and the desalination plant increase slowly over time in response to rising demand. The supply from the desalination plant averages 10.1 per cent of the total supply over the 40-year period. The maximum annual supply from the desalination plant is 30.3 GL, which is well below its capacity of 100GL/annum. Clearly, this result is dependent on the assumptions made, particularly in relation to the growth of demand in Metropolitan Adelaide.
Figure A.4 Total system storage 2010 – 2050 (Case 1L).
250
200
150
100
50
0
Total Storage (GL)
Jul10
Jul12
Jul14
Jul16
Jul18
Jul20
Jul22
Jul24
Jul26
Jul28
Jul30
Jul32
Jul34
Jul36
Jul38
Jul40
Jul42
Jul44
Jul46
Jul48
Figure A.5 Monthly catchment runo� and pumping in (GL) from the River Murray (Case 1L).
80
70
60
50
40
30
20
10
0
Monthly Runo� or Volume Pumped (GL)
Jul10
Jul20
Jul30
Jul40
Runo� Pumping
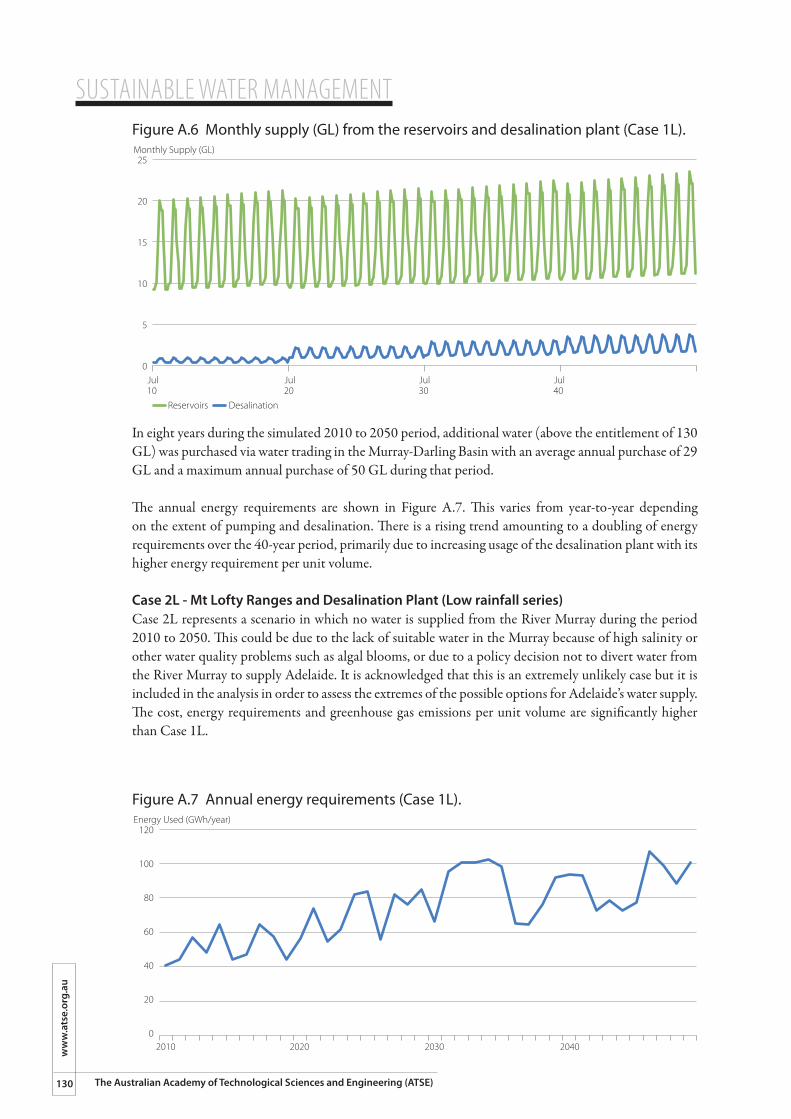
SUSTAINABLE WATER MANAGEMENT
130
ww
w.a
tse.
org.
au
The Australian Academy of Technological Sciences and Engineering (ATSE)
In eight years during the simulated 2010 to 2050 period, additional water (above the entitlement of 130 GL) was purchased via water trading in the Murray-Darling Basin with an average annual purchase of 29 GL and a maximum annual purchase of 50 GL during that period.
The annual energy requirements are shown in Figure A.7. This varies from year-to-year depending on the extent of pumping and desalination. There is a rising trend amounting to a doubling of energy requirements over the 40-year period, primarily due to increasing usage of the desalination plant with its higher energy requirement per unit volume.
Case 2L - Mt Lofty Ranges and Desalination Plant (Low rainfall series)Case 2L represents a scenario in which no water is supplied from the River Murray during the period 2010 to 2050. This could be due to the lack of suitable water in the Murray because of high salinity or other water quality problems such as algal blooms, or due to a policy decision not to divert water from the River Murray to supply Adelaide. It is acknowledged that this is an extremely unlikely case but it is included in the analysis in order to assess the extremes of the possible options for Adelaide’s water supply. The cost, energy requirements and greenhouse gas emissions per unit volume are significantly higher than Case 1L.
Figure A.6 Monthly supply (GL) from the reservoirs and desalination plant (Case 1L).
25
20
15
10
5
0
Monthly Supply (GL)
Jul10
Jul20
Jul30
Jul40
Reservoirs Desalination
Figure A.7 Annual energy requirements (Case 1L).
120
100
80
60
40
20
0
Energy Used (GWh/year)
2010 2020 2030 2040
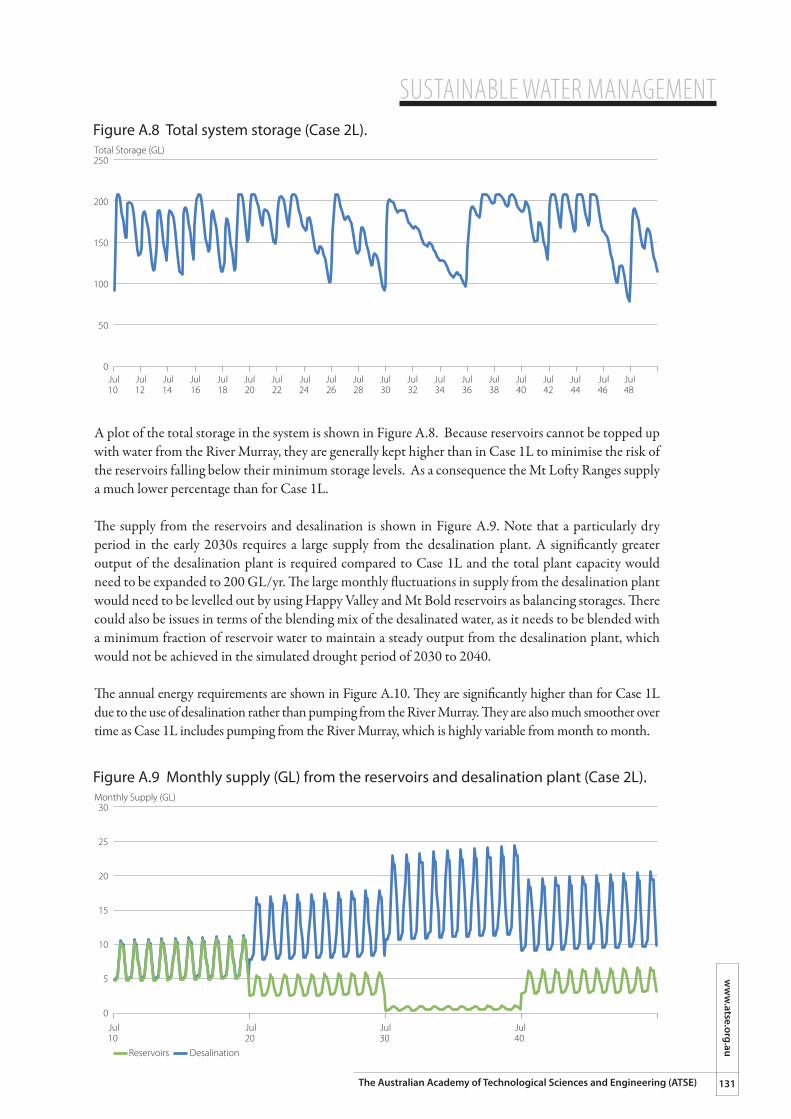
SUSTAINABLE WATER MANAGEMENTw
ww
.atse.org.au
131The Australian Academy of Technological Sciences and Engineering (ATSE)
A plot of the total storage in the system is shown in Figure A.8. Because reservoirs cannot be topped up with water from the River Murray, they are generally kept higher than in Case 1L to minimise the risk of the reservoirs falling below their minimum storage levels. As a consequence the Mt Lofty Ranges supply a much lower percentage than for Case 1L.
The supply from the reservoirs and desalination is shown in Figure A.9. Note that a particularly dry period in the early 2030s requires a large supply from the desalination plant. A significantly greater output of the desalination plant is required compared to Case 1L and the total plant capacity would need to be expanded to 200 GL/yr. The large monthly fluctuations in supply from the desalination plant would need to be levelled out by using Happy Valley and Mt Bold reservoirs as balancing storages. There could also be issues in terms of the blending mix of the desalinated water, as it needs to be blended with a minimum fraction of reservoir water to maintain a steady output from the desalination plant, which would not be achieved in the simulated drought period of 2030 to 2040.
The annual energy requirements are shown in Figure A.10. They are significantly higher than for Case 1L due to the use of desalination rather than pumping from the River Murray. They are also much smoother over time as Case 1L includes pumping from the River Murray, which is highly variable from month to month.
Figure A.8 Total system storage (Case 2L).
250
200
150
100
50
0
Total Storage (GL)
Jul10
Jul12
Jul14
Jul16
Jul18
Jul20
Jul22
Jul24
Jul26
Jul28
Jul30
Jul32
Jul34
Jul36
Jul38
Jul40
Jul42
Jul44
Jul46
Jul48
Figure A.9 Monthly supply (GL) from the reservoirs and desalination plant (Case 2L).
30
25
20
15
10
5
0
Monthly Supply (GL)
Jul10
Jul20
Jul30
Jul40
Reservoirs Desalination
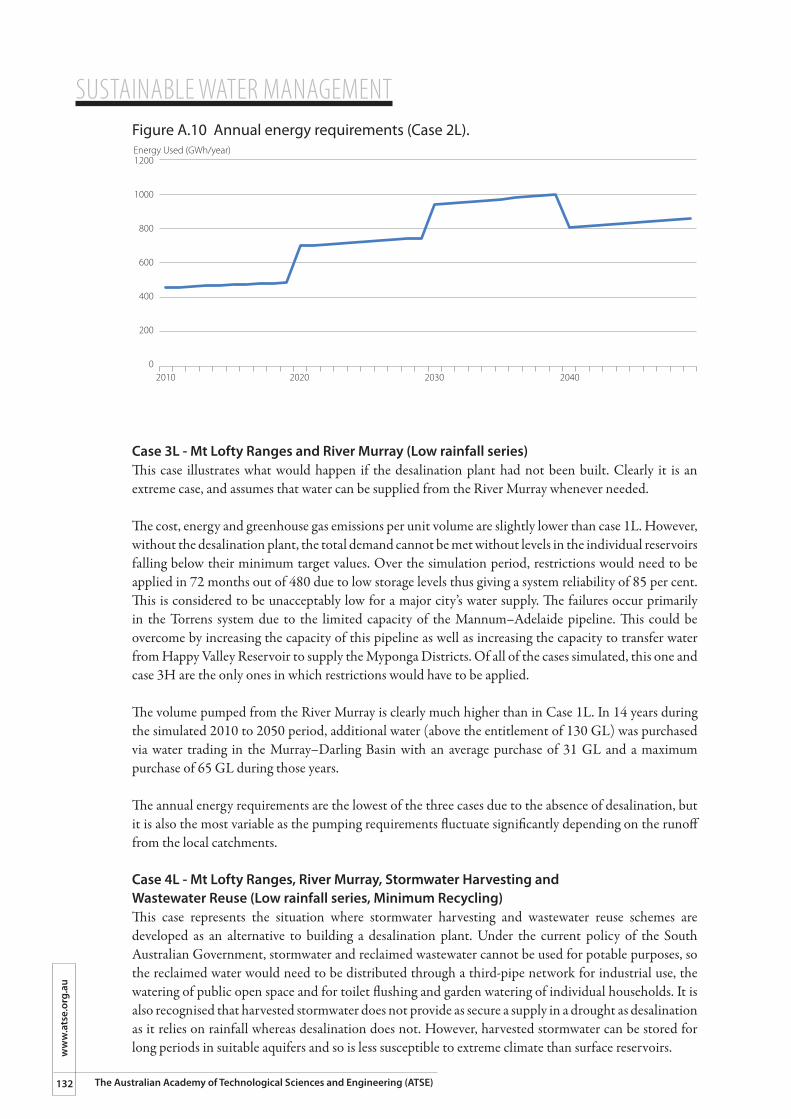
SUSTAINABLE WATER MANAGEMENT
132
ww
w.a
tse.
org.
au
The Australian Academy of Technological Sciences and Engineering (ATSE)
Case 3L - Mt Lofty Ranges and River Murray (Low rainfall series)This case illustrates what would happen if the desalination plant had not been built. Clearly it is an extreme case, and assumes that water can be supplied from the River Murray whenever needed.
The cost, energy and greenhouse gas emissions per unit volume are slightly lower than case 1L. However, without the desalination plant, the total demand cannot be met without levels in the individual reservoirs falling below their minimum target values. Over the simulation period, restrictions would need to be applied in 72 months out of 480 due to low storage levels thus giving a system reliability of 85 per cent. This is considered to be unacceptably low for a major city’s water supply. The failures occur primarily in the Torrens system due to the limited capacity of the Mannum–Adelaide pipeline. This could be overcome by increasing the capacity of this pipeline as well as increasing the capacity to transfer water from Happy Valley Reservoir to supply the Myponga Districts. Of all of the cases simulated, this one and case 3H are the only ones in which restrictions would have to be applied.
The volume pumped from the River Murray is clearly much higher than in Case 1L. In 14 years during the simulated 2010 to 2050 period, additional water (above the entitlement of 130 GL) was purchased via water trading in the Murray–Darling Basin with an average purchase of 31 GL and a maximum purchase of 65 GL during those years.
The annual energy requirements are the lowest of the three cases due to the absence of desalination, but it is also the most variable as the pumping requirements fluctuate significantly depending on the runoff from the local catchments.
Case 4L - Mt Lofty Ranges, River Murray, Stormwater Harvesting and Wastewater Reuse (Low rainfall series, Minimum Recycling)This case represents the situation where stormwater harvesting and wastewater reuse schemes are developed as an alternative to building a desalination plant. Under the current policy of the South Australian Government, stormwater and reclaimed wastewater cannot be used for potable purposes, so the reclaimed water would need to be distributed through a third-pipe network for industrial use, the watering of public open space and for toilet flushing and garden watering of individual households. It is also recognised that harvested stormwater does not provide as secure a supply in a drought as desalination as it relies on rainfall whereas desalination does not. However, harvested stormwater can be stored for long periods in suitable aquifers and so is less susceptible to extreme climate than surface reservoirs.
Figure A.10 Annual energy requirements (Case 2L).
1200
1000
800
600
400
200
0
Energy Used (GWh/year)
2010 2020 2030 2040
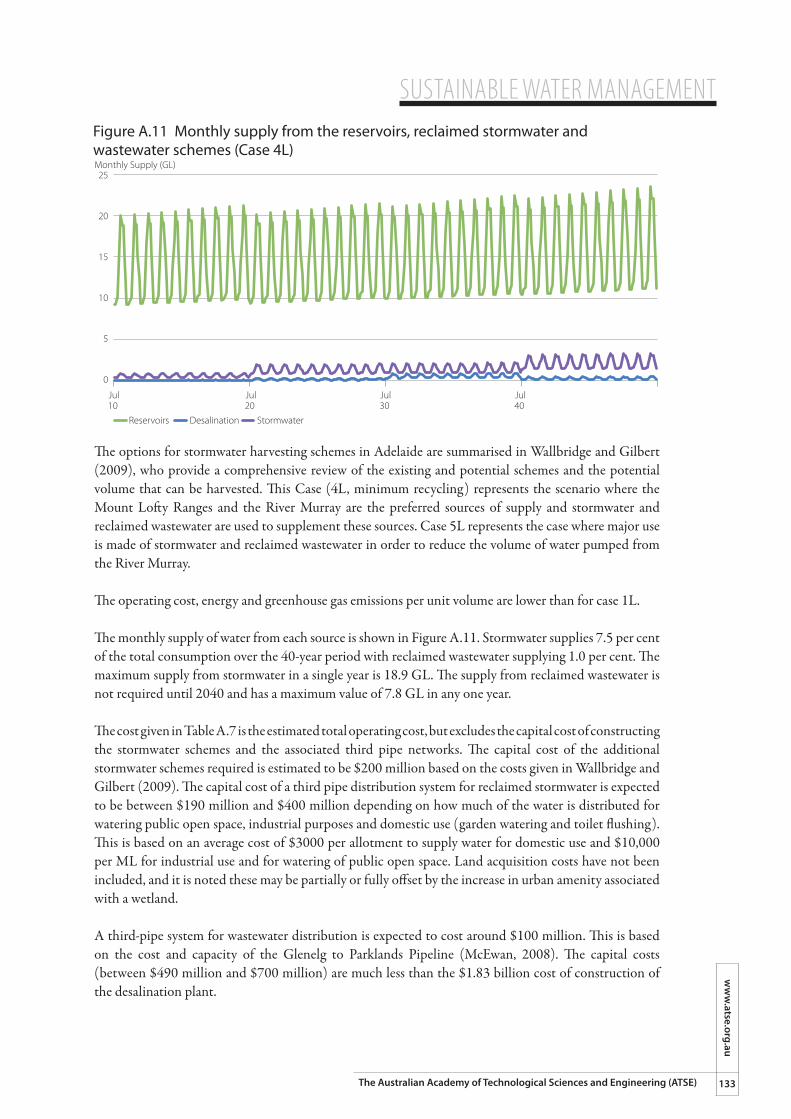
SUSTAINABLE WATER MANAGEMENTw
ww
.atse.org.au
133The Australian Academy of Technological Sciences and Engineering (ATSE)
The options for stormwater harvesting schemes in Adelaide are summarised in Wallbridge and Gilbert (2009), who provide a comprehensive review of the existing and potential schemes and the potential volume that can be harvested. This Case (4L, minimum recycling) represents the scenario where the Mount Lofty Ranges and the River Murray are the preferred sources of supply and stormwater and reclaimed wastewater are used to supplement these sources. Case 5L represents the case where major use is made of stormwater and reclaimed wastewater in order to reduce the volume of water pumped from the River Murray.
The operating cost, energy and greenhouse gas emissions per unit volume are lower than for case 1L.
The monthly supply of water from each source is shown in Figure A.11. Stormwater supplies 7.5 per cent of the total consumption over the 40-year period with reclaimed wastewater supplying 1.0 per cent. The maximum supply from stormwater in a single year is 18.9 GL. The supply from reclaimed wastewater is not required until 2040 and has a maximum value of 7.8 GL in any one year.
The cost given in Table A.7 is the estimated total operating cost, but excludes the capital cost of constructing the stormwater schemes and the associated third pipe networks. The capital cost of the additional stormwater schemes required is estimated to be $200 million based on the costs given in Wallbridge and Gilbert (2009). The capital cost of a third pipe distribution system for reclaimed stormwater is expected to be between $190 million and $400 million depending on how much of the water is distributed for watering public open space, industrial purposes and domestic use (garden watering and toilet flushing). This is based on an average cost of $3000 per allotment to supply water for domestic use and $10,000 per ML for industrial use and for watering of public open space. Land acquisition costs have not been included, and it is noted these may be partially or fully offset by the increase in urban amenity associated with a wetland.
A third-pipe system for wastewater distribution is expected to cost around $100 million. This is based on the cost and capacity of the Glenelg to Parklands Pipeline (McEwan, 2008). The capital costs (between $490 million and $700 million) are much less than the $1.83 billion cost of construction of the desalination plant.
Figure A.11 Monthly supply from the reservoirs, reclaimed stormwater and wastewater schemes (Case 4L)
25
20
15
10
5
0
Monthly Supply (GL)
Jul10
Jul20
Jul30
Jul40
Reservoirs Desalination Stormwater
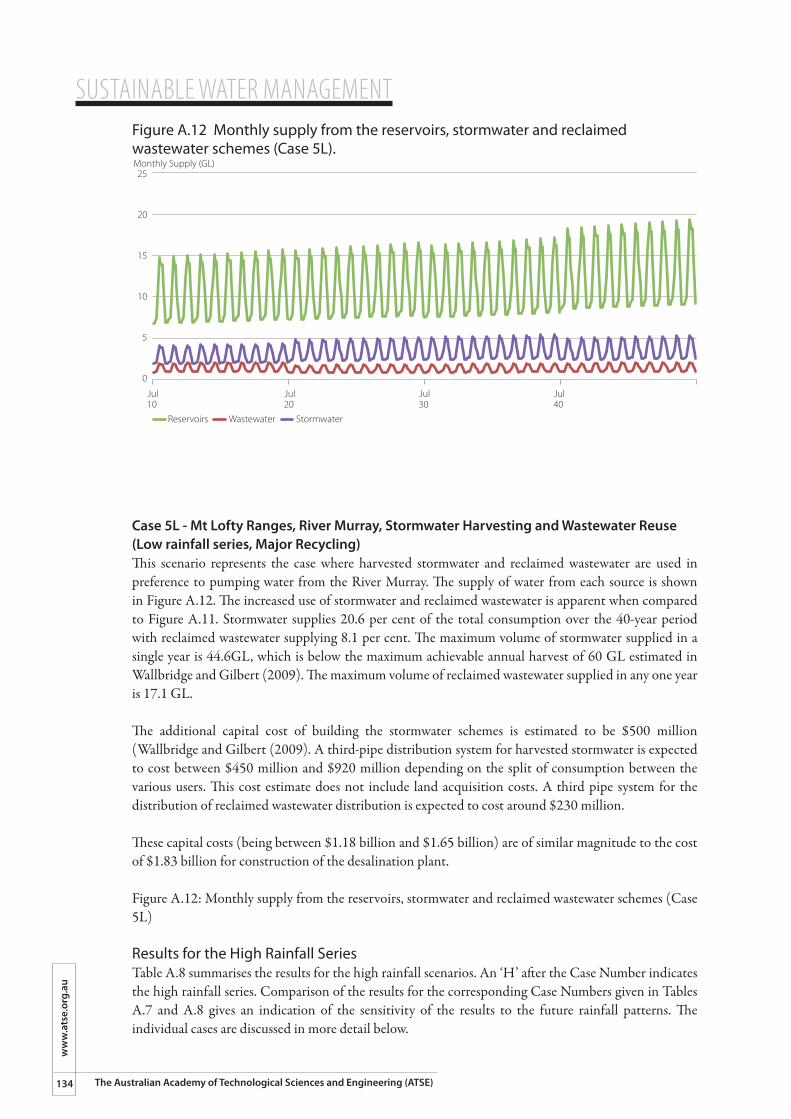
SUSTAINABLE WATER MANAGEMENT
134
ww
w.a
tse.
org.
au
The Australian Academy of Technological Sciences and Engineering (ATSE)
Case 5L - Mt Lofty Ranges, River Murray, Stormwater Harvesting and Wastewater Reuse (Low rainfall series, Major Recycling)This scenario represents the case where harvested stormwater and reclaimed wastewater are used in preference to pumping water from the River Murray. The supply of water from each source is shown in Figure A.12. The increased use of stormwater and reclaimed wastewater is apparent when compared to Figure A.11. Stormwater supplies 20.6 per cent of the total consumption over the 40-year period with reclaimed wastewater supplying 8.1 per cent. The maximum volume of stormwater supplied in a single year is 44.6GL, which is below the maximum achievable annual harvest of 60 GL estimated in Wallbridge and Gilbert (2009). The maximum volume of reclaimed wastewater supplied in any one year is 17.1 GL.
The additional capital cost of building the stormwater schemes is estimated to be $500 million (Wallbridge and Gilbert (2009). A third-pipe distribution system for harvested stormwater is expected to cost between $450 million and $920 million depending on the split of consumption between the various users. This cost estimate does not include land acquisition costs. A third pipe system for the distribution of reclaimed wastewater distribution is expected to cost around $230 million.
These capital costs (being between $1.18 billion and $1.65 billion) are of similar magnitude to the cost of $1.83 billion for construction of the desalination plant.
Figure A.12: Monthly supply from the reservoirs, stormwater and reclaimed wastewater schemes (Case 5L)
Results for the High Rainfall SeriesTable A.8 summarises the results for the high rainfall scenarios. An ‘H’ after the Case Number indicates the high rainfall series. Comparison of the results for the corresponding Case Numbers given in Tables A.7 and A.8 gives an indication of the sensitivity of the results to the future rainfall patterns. The individual cases are discussed in more detail below.
Figure A.12 Monthly supply from the reservoirs, stormwater and reclaimed wastewater schemes (Case 5L).
25
20
15
10
5
0
Monthly Supply (GL)
Jul10
Jul20
Jul30
Jul40
Reservoirs Wastewater Stormwater
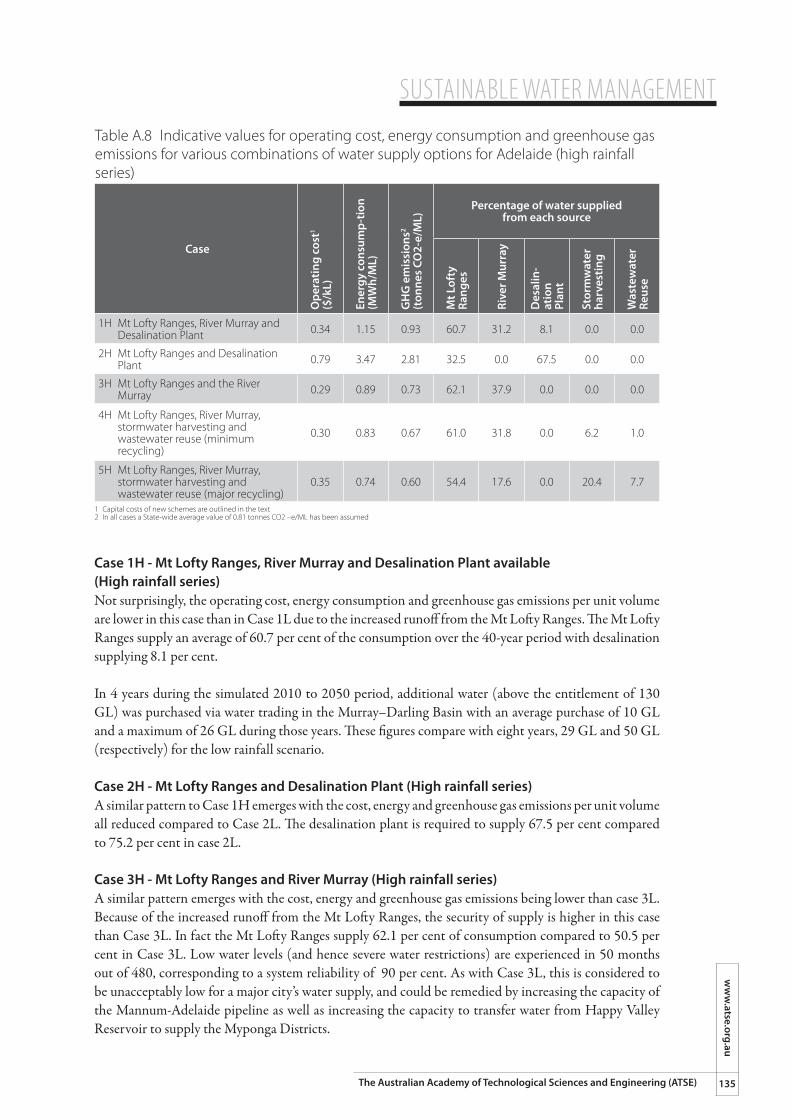
SUSTAINABLE WATER MANAGEMENTw
ww
.atse.org.au
135The Australian Academy of Technological Sciences and Engineering (ATSE)
Table A.8 Indicative values for operating cost, energy consumption and greenhouse gas emissions for various combinations of water supply options for Adelaide (high rainfall series)
Case
Ope
ratin
g co
st1
($/k
L)
Ener
gy c
onsu
mp-
tion
(MW
h/M
L)
GH
G e
mis
sion
s2
(ton
nes
CO2-
e/M
L)
Percentage of water supplied from each source
Mt L
ofty
Ra
nges
Rive
r Mur
ray
Des
alin
-at
ion
Plan
t
Stor
mw
ater
harv
estin
g
Was
tew
ater
Re
use
1H Mt Lofty Ranges, River Murray and Desalination Plant 0.34 1.15 0.93 60.7 31.2 8.1 0.0 0.0
2H Mt Lofty Ranges and Desalination Plant 0.79 3.47 2.81 32.5 0.0 67.5 0.0 0.0
3H Mt Lofty Ranges and the River Murray 0.29 0.89 0.73 62.1 37.9 0.0 0.0 0.0
4H Mt Lofty Ranges, River Murray, stormwater harvesting and wastewater reuse (minimum recycling)
0.30 0.83 0.67 61.0 31.8 0.0 6.2 1.0
5H Mt Lofty Ranges, River Murray, stormwater harvesting and wastewater reuse (major recycling)
0.35 0.74 0.60 54.4 17.6 0.0 20.4 7.7
1 Capital costs of new schemes are outlined in the text2 In all cases a State-wide average value of 0.81 tonnes CO2 –e/ML has been assumed
Case 1H - Mt Lofty Ranges, River Murray and Desalination Plant available (High rainfall series)Not surprisingly, the operating cost, energy consumption and greenhouse gas emissions per unit volume are lower in this case than in Case 1L due to the increased runoff from the Mt Lofty Ranges. The Mt Lofty Ranges supply an average of 60.7 per cent of the consumption over the 40-year period with desalination supplying 8.1 per cent.
In 4 years during the simulated 2010 to 2050 period, additional water (above the entitlement of 130 GL) was purchased via water trading in the Murray–Darling Basin with an average purchase of 10 GL and a maximum of 26 GL during those years. These figures compare with eight years, 29 GL and 50 GL (respectively) for the low rainfall scenario.
Case 2H - Mt Lofty Ranges and Desalination Plant (High rainfall series)A similar pattern to Case 1H emerges with the cost, energy and greenhouse gas emissions per unit volume all reduced compared to Case 2L. The desalination plant is required to supply 67.5 per cent compared to 75.2 per cent in case 2L.
Case 3H - Mt Lofty Ranges and River Murray (High rainfall series)A similar pattern emerges with the cost, energy and greenhouse gas emissions being lower than case 3L. Because of the increased runoff from the Mt Lofty Ranges, the security of supply is higher in this case than Case 3L. In fact the Mt Lofty Ranges supply 62.1 per cent of consumption compared to 50.5 per cent in Case 3L. Low water levels (and hence severe water restrictions) are experienced in 50 months out of 480, corresponding to a system reliability of 90 per cent. As with Case 3L, this is considered to be unacceptably low for a major city’s water supply, and could be remedied by increasing the capacity of the Mannum-Adelaide pipeline as well as increasing the capacity to transfer water from Happy Valley Reservoir to supply the Myponga Districts.
SUSTAINABLE WATER MANAGEMENT
136
ww
w.a
tse.
org.
au
The Australian Academy of Technological Sciences and Engineering (ATSE)
In eight years during the simulated 2010 to 2050 period, additional water (above the entitlement of 130 GL) was purchased via water trading in the Murray–Darling Basin with an average annual purchase of 14 GL and a maximum of 40 GL during those years. These figures compare to 14 years, 31 GL and 65 GL (respectively) for the low rainfall scenario.
Case 4H - Mt Lofty Ranges, River Murray, Stormwater Harvesting and Wastewater Reuse (High rainfall series, Minimum Recycling)This is similar to the comparison between Cases 1H and 1L. Operating cost, energy and greenhouse gas emissions per unit volume are reduced compared to case 4L. The Mt Lofty Ranges supply 61.0 per cent of the consumption compared to 49.5 per cent to case 4L. Stormwater supplies 6.2 per cent compared to 7.5 per cent for Case 4L. Reclaimed wastewater supplies 1.0 per cent in both cases.
Case 5H - Mt Lofty Ranges, River Murray, Stormwater Harvesting and Wastewater Reuse (High rainfall series, Major Recycling)A similar pattern to the other cases with the high rainfall series emerges. The operating cost, energy and greenhouse gas emissions per unit volume are reduced compared to Case 5L. In this case the percentage supplied by stormwater is similar to the low rainfall case (20.4 per cent compared to 20.6 per cent for low rainfall). The maximum supply of stormwater in a single year is 46.9 GL, compared to 44.6 GL for Case 5L. Use of reclaimed wastewater is reduced from 8.1 per cent to 7.7 per cent.
Effects of Climate Change and Climate VariabilityThe likely effects of climate change on rainfall and other climatic variables are highly uncertain. Paton et al (2010) found that the forecast changes in rainfall for the Adelaide region depend on the particular rainfall series, the global circulation model (GCM) used and the emission scenario assumed. The CSIRO Ozclim website6 provides projections of the likely changes in mean rainfall at various locations in Australia as modelled by various GCMs for different emission scenarios up to the year 2050.
For example the CSIRO Mark 3.5 model forecasts for Adelaide for 2050 are for a 22 per cent reduction in mean annual rainfall in 2050 compared to 1990 for the A2 emission scenario. The corresponding values for the B1 and A1B scenarios are reductions of 18 per cent and 23 per cent respectively. For the purposes of this study, a reduction of 22 per cent in mean annual rainfall in 2050 has been assumed. It is assumed that this reduction applies to monthly rainfalls and increases in a linear fashion from 0 per cent in 2010 to 22 per cent in 2050. While it is recognised that the actual reduction will be different for each month and downscaling is normally required, the assumed values are reasonable for the purposes of this study given the large uncertainties involved.
No change is applied to evaporation rates, as it is unclear whether these will increase or decrease with increasing global temperatures. Furthermore, the demand patterns have not been changed in response to climate change as the likely consumer response is unclear. For example, while gardens could require more water due to increased evapotranspiration, consumers could respond by reducing the areas of lawn or by replacing exotic species with drought tolerant native species.
A further case examined corresponds to an abrupt change in rainfall patterns due to a shift in climate patterns. As discussed in Section 5.1, the City of Perth has experienced significant decline in the runoff from its catchments since 1975. The average annual runoff further decreased in 2001 and 2006. There is some speculation about whether was caused by climate change or variations in global sea surface pressure patterns such as the Interdecadal Pacific Oscillation. Such a rapid change is simulated in Case 8L, which provides for a sudden reduction in mean annual rainfall of 11 per cent starting in July 2010, applied to
6 CSIRO Ozclim website www.csiro.au/ozclim/login.do
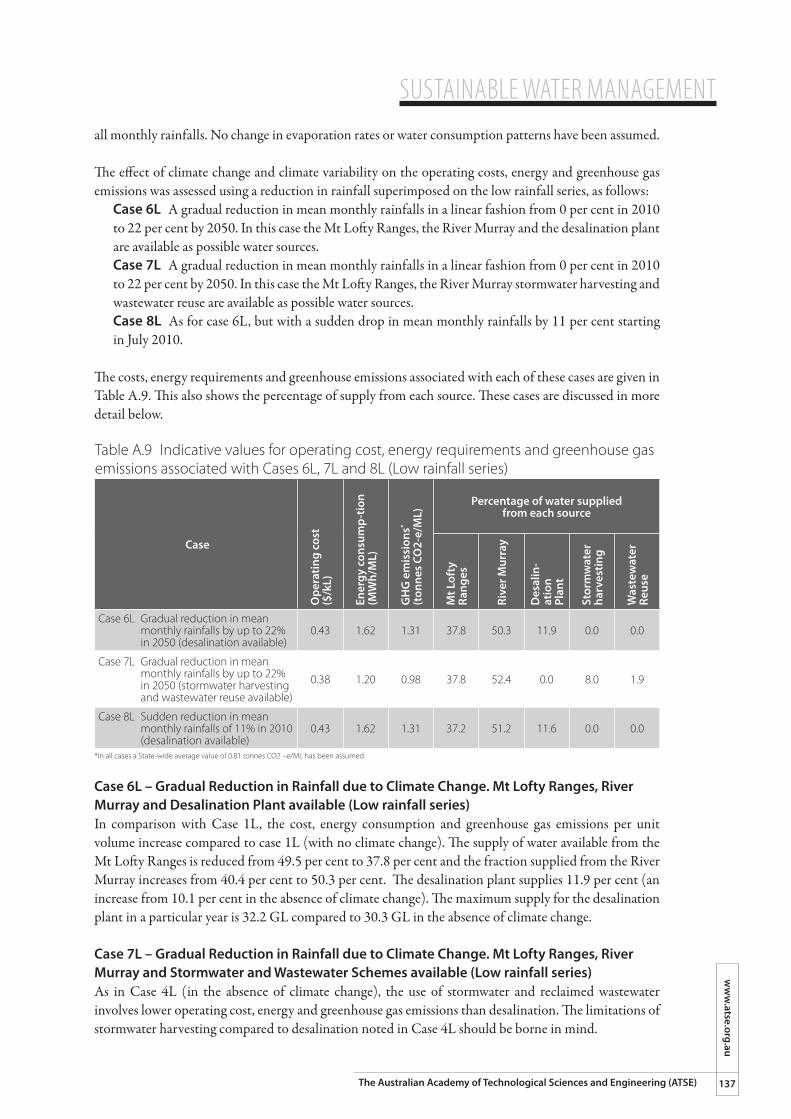
SUSTAINABLE WATER MANAGEMENTw
ww
.atse.org.au
137The Australian Academy of Technological Sciences and Engineering (ATSE)
all monthly rainfalls. No change in evaporation rates or water consumption patterns have been assumed.
The effect of climate change and climate variability on the operating costs, energy and greenhouse gas emissions was assessed using a reduction in rainfall superimposed on the low rainfall series, as follows:
Case 6L A gradual reduction in mean monthly rainfalls in a linear fashion from 0 per cent in 2010 to 22 per cent by 2050. In this case the Mt Lofty Ranges, the River Murray and the desalination plant are available as possible water sources.Case 7L A gradual reduction in mean monthly rainfalls in a linear fashion from 0 per cent in 2010 to 22 per cent by 2050. In this case the Mt Lofty Ranges, the River Murray stormwater harvesting and wastewater reuse are available as possible water sources.Case 8L As for case 6L, but with a sudden drop in mean monthly rainfalls by 11 per cent starting in July 2010.
The costs, energy requirements and greenhouse emissions associated with each of these cases are given in Table A.9. This also shows the percentage of supply from each source. These cases are discussed in more detail below.
Table A.9 Indicative values for operating cost, energy requirements and greenhouse gas emissions associated with Cases 6L, 7L and 8L (Low rainfall series)
Case
Ope
ratin
g co
st($
/kL)
Ener
gy c
onsu
mp-
tion
(MW
h/M
L)
GH
G e
mis
sion
s*
(ton
nes
CO2-
e/M
L)
Percentage of water supplied from each source
Mt L
ofty
Ra
nges
Rive
r Mur
ray
Des
alin
-at
ion
Plan
t
Stor
mw
ater
harv
estin
g
Was
tew
ater
Re
use
Case 6L Gradual reduction in mean monthly rainfalls by up to 22% in 2050 (desalination available)
0.43 1.62 1.31 37.8 50.3 11.9 0.0 0.0
Case 7L Gradual reduction in mean monthly rainfalls by up to 22% in 2050 (stormwater harvesting and wastewater reuse available)
0.38 1.20 0.98 37.8 52.4 0.0 8.0 1.9
Case 8L Sudden reduction in mean monthly rainfalls of 11% in 2010 (desalination available)
0.43 1.62 1.31 37.2 51.2 11.6 0.0 0.0
*In all cases a State-wide average value of 0.81 tonnes CO2 –e/ML has been assumed
Case 6L – Gradual Reduction in Rainfall due to Climate Change. Mt Lofty Ranges, River Murray and Desalination Plant available (Low rainfall series)In comparison with Case 1L, the cost, energy consumption and greenhouse gas emissions per unit volume increase compared to case 1L (with no climate change). The supply of water available from the Mt Lofty Ranges is reduced from 49.5 per cent to 37.8 per cent and the fraction supplied from the River Murray increases from 40.4 per cent to 50.3 per cent. The desalination plant supplies 11.9 per cent (an increase from 10.1 per cent in the absence of climate change). The maximum supply for the desalination plant in a particular year is 32.2 GL compared to 30.3 GL in the absence of climate change.
Case 7L – Gradual Reduction in Rainfall due to Climate Change. Mt Lofty Ranges, River Murray and Stormwater and Wastewater Schemes available (Low rainfall series)As in Case 4L (in the absence of climate change), the use of stormwater and reclaimed wastewater involves lower operating cost, energy and greenhouse gas emissions than desalination. The limitations of stormwater harvesting compared to desalination noted in Case 4L should be borne in mind.
SUSTAINABLE WATER MANAGEMENT
138
ww
w.a
tse.
org.
au
The Australian Academy of Technological Sciences and Engineering (ATSE)
Due to reduced rainfall, supply of water from the Mt Lofty Ranges is reduced from 49.5 per cent to 37.8 per cent and supply from the River Murray increases from 42.0 per cent to 52.4 per cent. Use of stormwater is increased from 7.5 per cent to 8.0 per cent. Reclaimed wastewater would be required from 2030 onwards and increases from 1.0 per cent to 1.9 per cent.
Case 8L – Sudden Reduction in Rainfall due to Climate Change. Mt Lofty Ranges, River Murray and Desalination Plant available (Low rainfall series)The results obtained in this case is very similar to case 6L, which is not surprising given that they both have the same reduction in average rainfall over the 40 year period.
DiscussionThis case study demonstrates a number of issues for the water supply of major coastal cities in Australia.
In the first instance the need to have a diversity of water sources is clearly demonstrated. The historical dependence on surface water storages via a few large dams, as in Sydney, Melbourne and Brisbane is highly vulnerable in the face of extreme drought, climate variability or climate change. Adelaide also has the River Murray available and Perth obtains about one-third of its water from groundwater sources however, the inherent vulnerability of these systems remains.
All major coastal cities in Australia have built desalination plants (see Section 5.3). Although these offer a source of water that is independent of rainfall, they may be less cost-effective compared to other alternatives such as stormwater harvesting and reclaimed wastewater, as noted by the Productivity Commission (2011a).
The Adelaide study illustrates the inherent linkage between water supply and energy consumption. Various water sources involve different energy intensities and the choice of the mix of water sources can have a dramatic effect on the total energy consumption by the water utility.
Energy consumption is closely linked to the production of greenhouse gases (GHG). The actual quantity of GHG produced depends on the source of energy. In this study an average value of 0.81 tonnes of CO2 equivalent/MWh for all of South Australia was used. The quantity of greenhouse gases associated with a water supply system can be reduced by careful selection of the sources of water used, or as with some water utilities offset by the purchase of green energy from wind farms.
Climate change is likely to reduce the runoff from surface catchments in southern Australia and hence will reduce the available water supply from traditional sources. The need to use alternative sources of water such as desalination, stormwater and reclaimed wastewater is likely to increase greenhouse gas emissions and hence form a positive feedback on a global scale that will further accelerate climate change. Although drought will also reduce the volume of water available from the River Murray, it should be possible to purchase water from willing sellers via an efficient water trading system as envisaged under the National Water Initiative.
Sudden changes in rainfall patterns due to climate variability are also likely to occur. In certain circumstances, these can have more of an impact on costs, energy requirements and greenhouse gas emissions than gradual change over a long period.
SUSTAINABLE WATER MANAGEMENTw
ww
.atse.org.au
139The Australian Academy of Technological Sciences and Engineering (ATSE)
ReferencesDepartment of Climate Change and Energy Efficiency, 2011, National Greenhouse Accounts Factors: Commonwealth of Australia, July
Government of South Australia, 2009, Water for Good – A Plan to Ensure our Water Future to 2050, Adelaide
Kenway SJ, Priestley A, Cook S, Seo S, Inman M, Gregory A and Hall M, 2008, Energy use in the provision and consumption of urban water in Australia and New Zealand: CSIRO: Water for a Healthy Country National Research Flagship/WSAA
Marsden Jacob Associates, 2008, A national snapshot of current and planned water recycling and reuse rates: Report prepared for the Department of the Environment, Water, Heritage and the Arts, June 2008
McEwan, Hon Rory, 2008, Glenelg to City Recycled Water Project a Step Closer, Government of SA, News Release, July 16, 2008
Paton FL, Dandy GC and Maier HR, 2010, Sensitivity of estimated urban water supply security based on various global circulation models and SRES emission scenarios: Practical Responses to Climate Change National Conference 2010, September 29-October 1, Melbourne, Australia
Productivity Commission, 2011a. Australia’s urban water sector, Draft report, Canberra. 566pp.
SA Water, 2009, Proposed Adelaide desalination plant environmental impact statement. Response Document January 2009
SA Water, 2010, South Australia Water Corporation Annual Report, Adelaide.
Wallbridge and Gilbert, 2009, Urban Stormwater Harvesting Options Study: Report prepared for the Government of South Australia, Stormwater Management Authority.
Water Proofing Northern Adelaide Subsidiary, 2010, Water Proofing Northern Adelaide Final Report, 30th September 2010
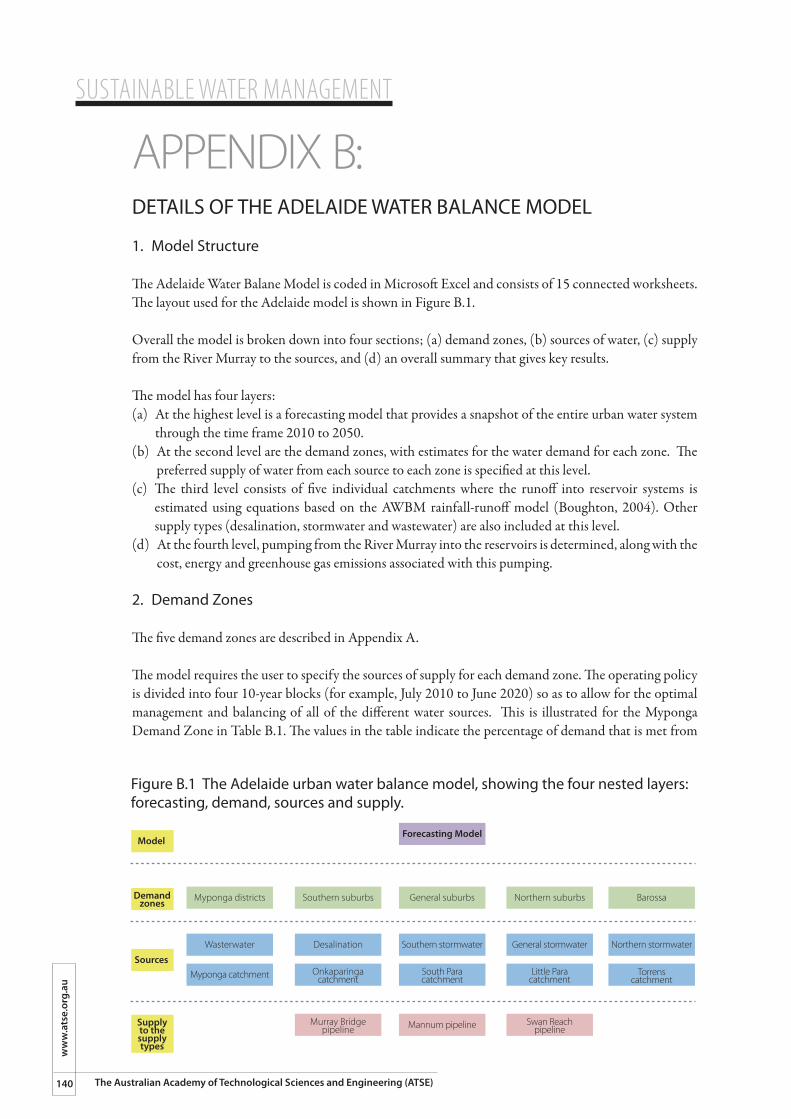
SUSTAINABLE WATER MANAGEMENT
140
ww
w.a
tse.
org.
au
The Australian Academy of Technological Sciences and Engineering (ATSE)
APPENDIX B: DETAILS OF THE ADELAIDE WATER BALANCE MODEL
1. Model Structure
The Adelaide Water Balane Model is coded in Microsoft Excel and consists of 15 connected worksheets. The layout used for the Adelaide model is shown in Figure B.1.
Overall the model is broken down into four sections; (a) demand zones, (b) sources of water, (c) supply from the River Murray to the sources, and (d) an overall summary that gives key results.
The model has four layers:(a) At the highest level is a forecasting model that provides a snapshot of the entire urban water system
through the time frame 2010 to 2050.(b) At the second level are the demand zones, with estimates for the water demand for each zone. The
preferred supply of water from each source to each zone is specified at this level.(c) The third level consists of five individual catchments where the runoff into reservoir systems is
estimated using equations based on the AWBM rainfall-runoff model (Boughton, 2004). Other supply types (desalination, stormwater and wastewater) are also included at this level.
(d) At the fourth level, pumping from the River Murray into the reservoirs is determined, along with the cost, energy and greenhouse gas emissions associated with this pumping.
2. Demand Zones
The five demand zones are described in Appendix A.
The model requires the user to specify the sources of supply for each demand zone. The operating policy is divided into four 10-year blocks (for example, July 2010 to June 2020) so as to allow for the optimal management and balancing of all of the different water sources. This is illustrated for the Myponga Demand Zone in Table B.1. The values in the table indicate the percentage of demand that is met from
Figure B.1 The Adelaide urban water balance model, showing the four nested layers: forecasting, demand, sources and supply.
Forecasting Model
General suburbsSouthern suburbsMyponga districts
Model
Sources
Demandzones
Supplyto thesupplytypes
Wasterwater
Northern suburbs Barossa
Southern stormwaterDesalination General stormwater Northern stormwater
Myponga catchment South Paracatchment
Onkaparingacatchment
Little Paracatchment
Mannum pipelineMurray Bridgepipeline
Swan Reachpipeline
Torrenscatchment
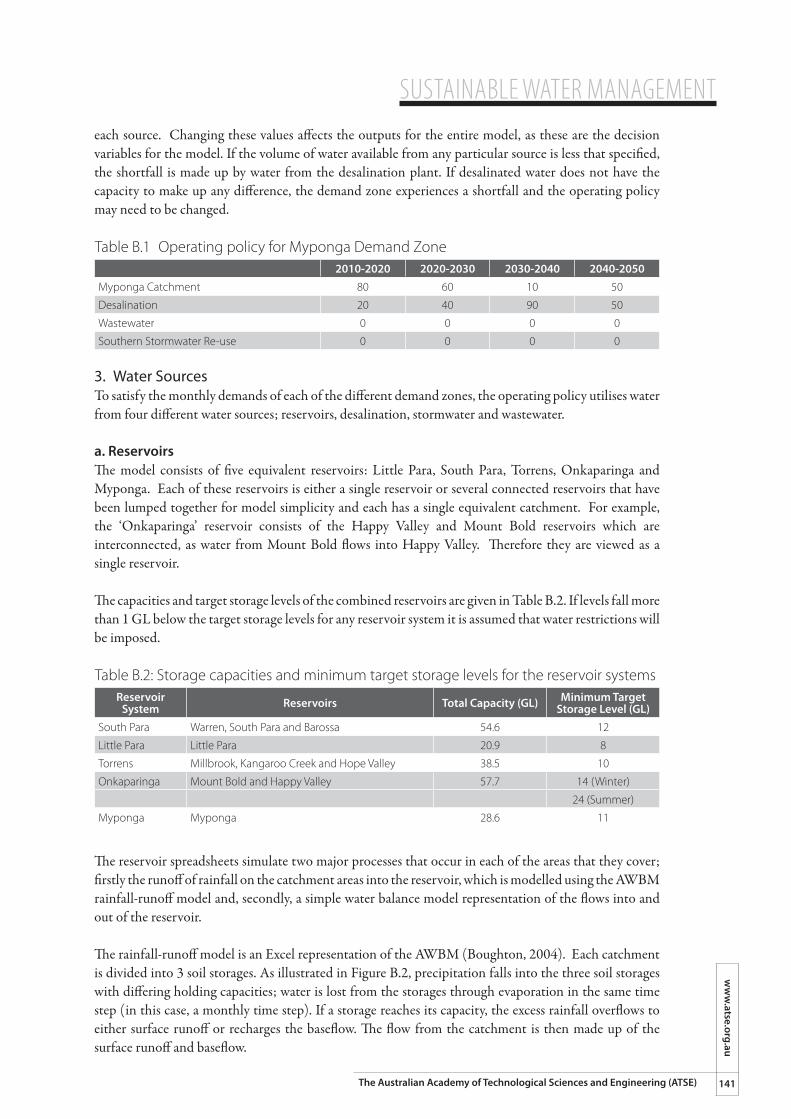
SUSTAINABLE WATER MANAGEMENTw
ww
.atse.org.au
141The Australian Academy of Technological Sciences and Engineering (ATSE)
each source. Changing these values affects the outputs for the entire model, as these are the decision variables for the model. If the volume of water available from any particular source is less that specified, the shortfall is made up by water from the desalination plant. If desalinated water does not have the capacity to make up any difference, the demand zone experiences a shortfall and the operating policy may need to be changed.
Table B.1 Operating policy for Myponga Demand Zone 2010-2020 2020-2030 2030-2040 2040-2050
Myponga Catchment 80 60 10 50
Desalination 20 40 90 50
Wastewater 0 0 0 0
Southern Stormwater Re-use 0 0 0 0
3. Water SourcesTo satisfy the monthly demands of each of the different demand zones, the operating policy utilises water from four different water sources; reservoirs, desalination, stormwater and wastewater.
a. Reservoirs The model consists of five equivalent reservoirs: Little Para, South Para, Torrens, Onkaparinga and Myponga. Each of these reservoirs is either a single reservoir or several connected reservoirs that have been lumped together for model simplicity and each has a single equivalent catchment. For example, the ‘Onkaparinga’ reservoir consists of the Happy Valley and Mount Bold reservoirs which are interconnected, as water from Mount Bold flows into Happy Valley. Therefore they are viewed as a single reservoir.
The capacities and target storage levels of the combined reservoirs are given in Table B.2. If levels fall more than 1 GL below the target storage levels for any reservoir system it is assumed that water restrictions will be imposed.
Table B.2: Storage capacities and minimum target storage levels for the reservoir systemsReservoir
System Reservoirs Total Capacity (GL) Minimum Target Storage Level (GL)
South Para Warren, South Para and Barossa 54.6 12
Little Para Little Para 20.9 8
Torrens Millbrook, Kangaroo Creek and Hope Valley 38.5 10
Onkaparinga Mount Bold and Happy Valley 57.7 14 (Winter)
24 (Summer)
Myponga Myponga 28.6 11
The reservoir spreadsheets simulate two major processes that occur in each of the areas that they cover; firstly the runoff of rainfall on the catchment areas into the reservoir, which is modelled using the AWBM rainfall-runoff model and, secondly, a simple water balance model representation of the flows into and out of the reservoir.
The rainfall-runoff model is an Excel representation of the AWBM (Boughton, 2004). Each catchment is divided into 3 soil storages. As illustrated in Figure B.2, precipitation falls into the three soil storages with differing holding capacities; water is lost from the storages through evaporation in the same time step (in this case, a monthly time step). If a storage reaches its capacity, the excess rainfall overflows to either surface runoff or recharges the baseflow. The flow from the catchment is then made up of the surface runoff and baseflow.
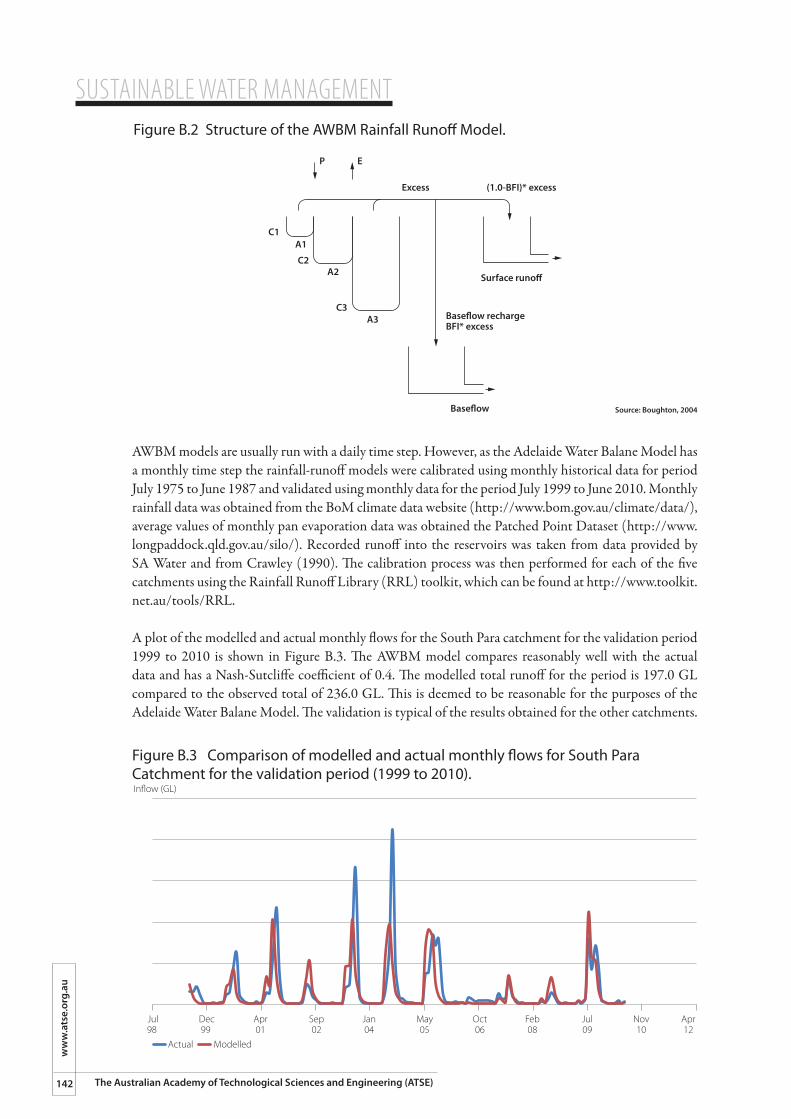
SUSTAINABLE WATER MANAGEMENT
142
ww
w.a
tse.
org.
au
The Australian Academy of Technological Sciences and Engineering (ATSE)
AWBM models are usually run with a daily time step. However, as the Adelaide Water Balane Model has a monthly time step the rainfall-runoff models were calibrated using monthly historical data for period July 1975 to June 1987 and validated using monthly data for the period July 1999 to June 2010. Monthly rainfall data was obtained from the BoM climate data website (http://www.bom.gov.au/climate/data/), average values of monthly pan evaporation data was obtained the Patched Point Dataset (http://www.longpaddock.qld.gov.au/silo/). Recorded runoff into the reservoirs was taken from data provided by SA Water and from Crawley (1990). The calibration process was then performed for each of the five catchments using the Rainfall Runoff Library (RRL) toolkit, which can be found at http://www.toolkit.net.au/tools/RRL.
A plot of the modelled and actual monthly flows for the South Para catchment for the validation period 1999 to 2010 is shown in Figure B.3. The AWBM model compares reasonably well with the actual data and has a Nash-Sutcliffe coefficient of 0.4. The modelled total runoff for the period is 197.0 GL compared to the observed total of 236.0 GL. This is deemed to be reasonable for the purposes of the Adelaide Water Balane Model. The validation is typical of the results obtained for the other catchments.
Figure B.3 Comparison of modelled and actual monthly �ows for South Para Catchment for the validation period (1999 to 2010).In�ow (GL)
Jul98
Dec99
Apr01
Sep02
Jan04
May05
Oct06
Feb08
Jul09
Nov10
Apr12
Actual Modelled
Source: Boughton, 2004
Figure B.2 Structure of the AWBM Rainfall Runo� Model.
Base�ow
Base�ow rechargeBFI* excess
Surface runo�
(1.0-BFI)* excessExcess
EP
C1
C2
C3A3
A1
A2
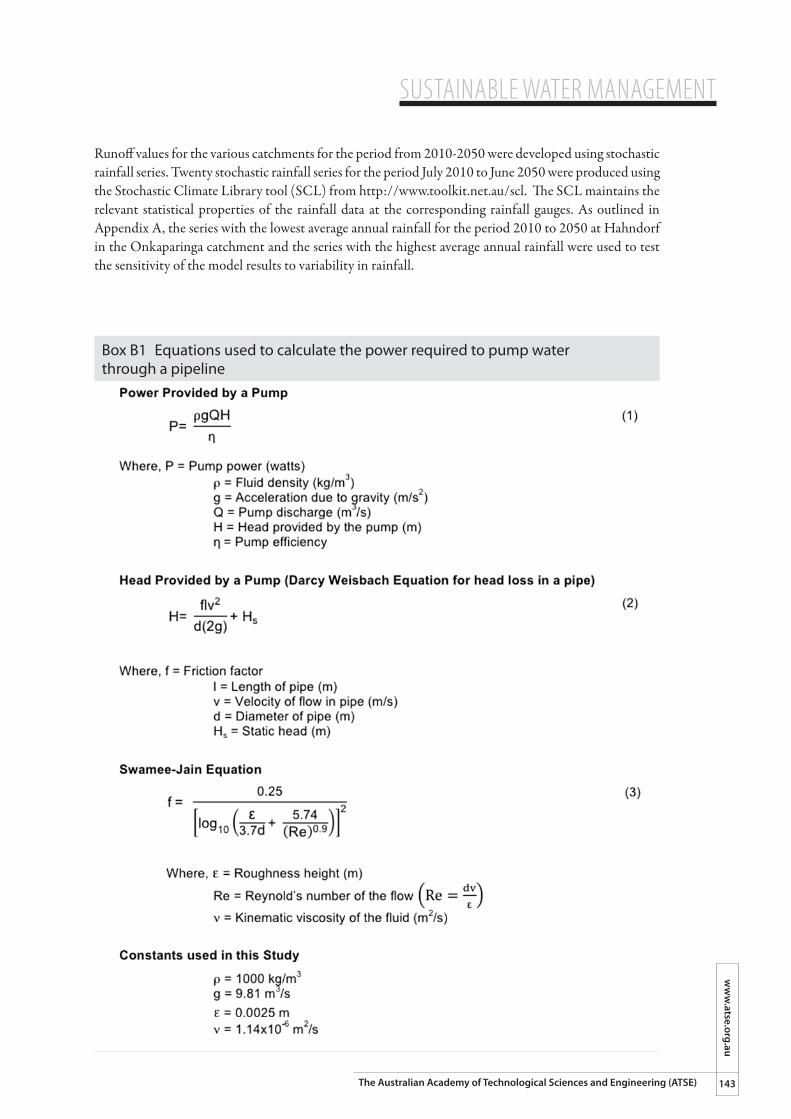
SUSTAINABLE WATER MANAGEMENTw
ww
.atse.org.au
143The Australian Academy of Technological Sciences and Engineering (ATSE)
Runoff values for the various catchments for the period from 2010-2050 were developed using stochastic rainfall series. Twenty stochastic rainfall series for the period July 2010 to June 2050 were produced using the Stochastic Climate Library tool (SCL) from http://www.toolkit.net.au/scl. The SCL maintains the relevant statistical properties of the rainfall data at the corresponding rainfall gauges. As outlined in Appendix A, the series with the lowest average annual rainfall for the period 2010 to 2050 at Hahndorf in the Onkaparinga catchment and the series with the highest average annual rainfall were used to test the sensitivity of the model results to variability in rainfall.
Box B1 Equations used to calculate the power required to pump water through a pipeline
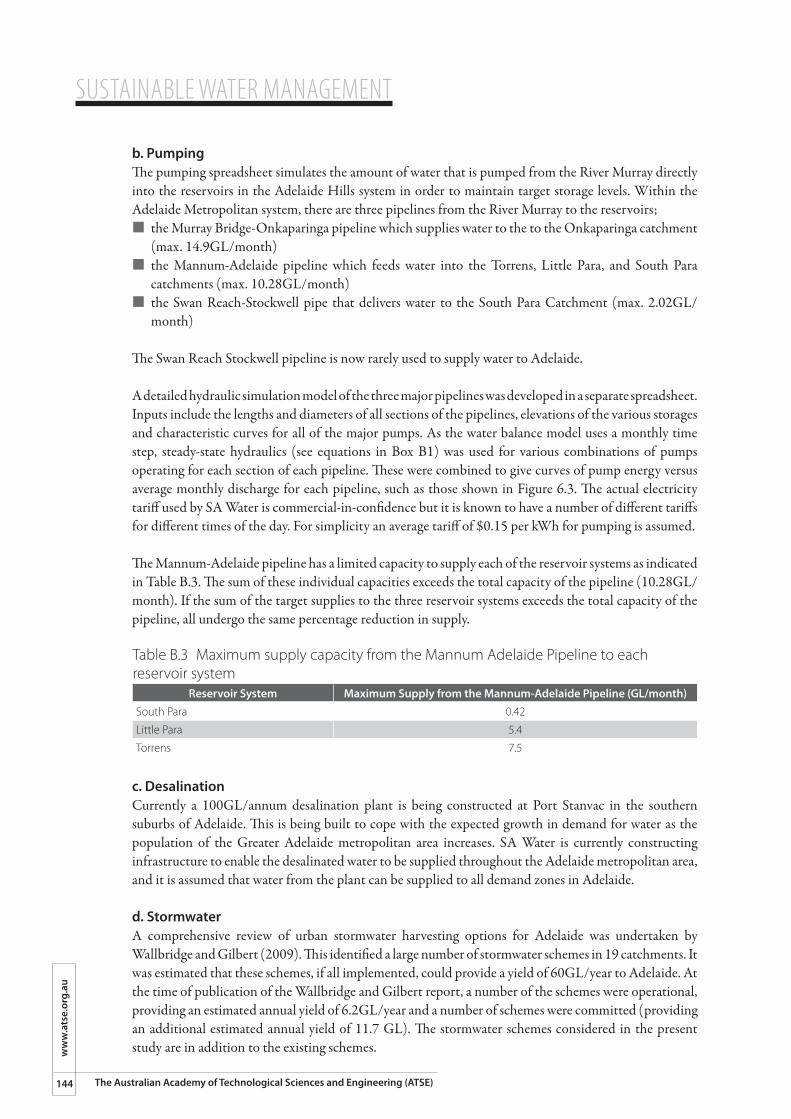
SUSTAINABLE WATER MANAGEMENT
144
ww
w.a
tse.
org.
au
The Australian Academy of Technological Sciences and Engineering (ATSE)
b. PumpingThe pumping spreadsheet simulates the amount of water that is pumped from the River Murray directly into the reservoirs in the Adelaide Hills system in order to maintain target storage levels. Within the Adelaide Metropolitan system, there are three pipelines from the River Murray to the reservoirs; ¢ �the Murray Bridge-Onkaparinga pipeline which supplies water to the to the Onkaparinga catchment
(max. 14.9GL/month)¢ �the Mannum-Adelaide pipeline which feeds water into the Torrens, Little Para, and South Para
catchments (max. 10.28GL/month)¢ �the Swan Reach-Stockwell pipe that delivers water to the South Para Catchment (max. 2.02GL/
month)
The Swan Reach Stockwell pipeline is now rarely used to supply water to Adelaide.
A detailed hydraulic simulation model of the three major pipelines was developed in a separate spreadsheet. Inputs include the lengths and diameters of all sections of the pipelines, elevations of the various storages and characteristic curves for all of the major pumps. As the water balance model uses a monthly time step, steady-state hydraulics (see equations in Box B1) was used for various combinations of pumps operating for each section of each pipeline. These were combined to give curves of pump energy versus average monthly discharge for each pipeline, such as those shown in Figure 6.3. The actual electricity tariff used by SA Water is commercial-in-confidence but it is known to have a number of different tariffs for different times of the day. For simplicity an average tariff of $0.15 per kWh for pumping is assumed.
The Mannum-Adelaide pipeline has a limited capacity to supply each of the reservoir systems as indicated in Table B.3. The sum of these individual capacities exceeds the total capacity of the pipeline (10.28GL/month). If the sum of the target supplies to the three reservoir systems exceeds the total capacity of the pipeline, all undergo the same percentage reduction in supply.
Table B.3 Maximum supply capacity from the Mannum Adelaide Pipeline to each reservoir system
Reservoir System Maximum Supply from the Mannum-Adelaide Pipeline (GL/month)South Para 0.42
Little Para 5.4
Torrens 7.5
c. DesalinationCurrently a 100GL/annum desalination plant is being constructed at Port Stanvac in the southern suburbs of Adelaide. This is being built to cope with the expected growth in demand for water as the population of the Greater Adelaide metropolitan area increases. SA Water is currently constructing infrastructure to enable the desalinated water to be supplied throughout the Adelaide metropolitan area, and it is assumed that water from the plant can be supplied to all demand zones in Adelaide.
d. StormwaterA comprehensive review of urban stormwater harvesting options for Adelaide was undertaken by Wallbridge and Gilbert (2009). This identified a large number of stormwater schemes in 19 catchments. It was estimated that these schemes, if all implemented, could provide a yield of 60GL/year to Adelaide. At the time of publication of the Wallbridge and Gilbert report, a number of the schemes were operational, providing an estimated annual yield of 6.2GL/year and a number of schemes were committed (providing an additional estimated annual yield of 11.7 GL). The stormwater schemes considered in the present study are in addition to the existing schemes.
SUSTAINABLE WATER MANAGEMENTw
ww
.atse.org.au
145The Australian Academy of Technological Sciences and Engineering (ATSE)
Rather than attempting to model all of the individual schemes, they were grouped into Northern, Central and Southern Stormwater schemes. Each of these was modelled using an aggregate catchment area, surface storage and aquifer storage. The data used are given in Table B.4.
Table B.4: Characteristics of Lumped Stormwater Schemes
Lumped Stormwater
Scheme
Total catchment area (km2)
Runoff Coefficient
Maximum Volume
of Surface Storage (GL)
Minimum Volume
of Surface Storage (GL)
Maximum Achievable
Recharge Rate to Aquifer
(GL/month)
Maximum Extraction Rate from
Aquifer (GL/month)
Northern 1079 0.06 2.55 0.78 2.65 6.07
Central 306 0.21 0.84 0.27 1.59 4.77
Southern 593 0.11 1.87 0.21 1.98 5.05
The catchment areas were estimated using GIS data and the runoff coefficients were based on values given in Wallbridge and Gilbert (2009). The maximum volume of surface storage was based on the sum of the maximum volumes of each wetland and other surface storages for all schemes. The minimum volume of surface storage was taken to be one-third of the maximum wetland volumes. The maximum extraction rate from the aquifers was set at 10L/s/bore, while the maximum achievable recharge rate to the aquifer was set between one-third and one-half of the maximum extraction rate to reflect the peakiness of stormwater flow data in view of the fact that a monthly time step is used in the model. This last value was adjusted so the annual yield from each of the lumped schemes matched the annual yield estimated by Wallbridge and Gilbert (2009).
In order to match EPA policy, only 80 per cent of the stormwater injected into the aquifer was allowed to be extracted. If the total consumption of stormwater during the 40-year simulation period was less than 60GL, it was assumed that not all stormwater schemes were required.
In accordance with current government policy, treated stormwater was assumed to be used solely for industrial use, watering of public open space, watering of domestic gardens and toilet flushing.
The capital cost of constructing stormwater schemes was based on the figures given in Wallbridge and Gilbert (2009). The capital cost of constructing the third pipe distribution network was assumed to be $3000 per house supplied for domestic use and $10,000/ML/year for industry and watering of public open space.
e. WastewaterNon-potable wastewater reuse included in the model is only that portion that replaces potable mains supply. It is assumed that adequate quantities of wastewater are available from the major wastewater treatment plants and can be supplied to any demand zone. The capital cost of constructing the third pipe network is assumed to be the same as for harvested stormwater.
4. ReferencesBoughton, W, 2004, The Australian Water Balance Model: Environmental Modelling & Software, 19 (10), 943-956. Crawley, P, 1990, Optimum operating policies for multiple reservoir systems: Thesis submitted for the degree of Master of Engineering Science, Department of Civil Engineering, University of Adelaide.Land and Water Australia, 2001, National Land and Water Resources Audit Annual Report 2000-2001, Commonwealth of Australia.Wallbridge and Gilbert, 2009, Urban Stormwater Harvesting Options Study: Report prepared for the Government of South Australia, Stormwater Management Authority.

SUSTAINABLE WATER MANAGEMENT
146
ww
w.a
tse.
org.
au
The Australian Academy of Technological Sciences and Engineering (ATSE)

ATSE – in briefThe Academy of Technological Sciences and Engineering (ATSE) is an independent, non-government organisation, promoting the development and adoption of existing and new technologies that will improve and sustain our society and economy.
ATSE consists of some 800 eminent Australian fellows and was founded in 1976 to recognise and promote the outstanding achievement of Australian scientists, engineers and technologists.
ATSE provides a national forum for discussion and debate of critical issues about Australia’s future, especially the impact of science, engineering and technology on quality of life.
ATSE links Australia with leading international bodies and worldwide expertise in the technological sciences and engineering.
ATSE fosters excellence in science, engineering and technology research and the critical education systems that underpin Australia’s capacity in these areas.
ATSE tackles many of the most difficult issues governing our future, by offering fresh ideas, practical solutions and sound policy advice – and putting them on the public record.

SUSTAINABLE WATER MANAGEMENT:Securing Australia’s future in a green economy
© Australian Academy of Technological Sciences and Engineering
The Australian Academy of Technological Sciences and Engineering (ATSE)
ATSE OfficeLevel 1, 1 Bowen CrescentMelbourne Victoria 3004AUSTRALIA
Mail addressGPO Box 4055Melbourne Victoria 3001AUSTRALIA
Phone+61 (0)3 9864 0900
Fax+61 (0)3 9864 0930
[email protected] [email protected]
Websiteswww.atse.org.auwww.crawfordfund.org www.cluniesross.org.au


![[EBRD Publications] Securing sustainable energy in ... · Alexa Koch, Richard Bate and Steven Still in the Design Unit. Many experts both inside and outside ... Securing sustainable](https://static.fdocuments.us/doc/165x107/5b84118c7f8b9ae5498b7daa/ebrd-publications-securing-sustainable-energy-in-alexa-koch-richard-bate.jpg)