Sustainable Tea at Unilever - UBC...
25
9-712-438 REV: NOVEMBER 21, 2012 ________________________________________________________________________________________________________________ Professor Rebecca M. Henderson and Research Associate Frederik Nellemann (MBA 2011) prepared this case. HBS cases are developed solely as the basis for class discussion. Cases are not intended to serve as endorsements, sources of primary data, or illustrations of effective or ineffective management. Copyright © 2011, 2012 President and Fellows of Harvard College. To order copies or request permission to reproduce materials, call 1-800-545- 7685, write Harvard Business School Publishing, Boston, MA 02163, or go to www.hbsp.harvard.edu/educators. This publication may not be digitized, photocopied, or otherwise reproduced, posted, or transmitted, without the permission of Harvard Business School. REBECCA M. HENDERSON FREDERIK NELLEMANN Sustainable Tea at Unilever To survive and prosper over the long term, learn how to adapt your business model by making it servant to society and the environment. Not the other way around. — Paul Polman, CEO, Unilever In 2010, Unilever announced its commitment to a new “Sustainable Living Plan,” a document that set wide-ranging, companywide goals for improving the health and well-being of consumers, reducing environmental impact, and, perhaps most ambitiously, sourcing 100% of agricultural raw materials sustainably by 2020. Such a goal implied a massive transformation of a supply chain that sourced close to 8 million tons of commodities across 50 different crops. Unilever CEO Paul Polman believed that the company’s ambitious goals could drive savings, product innovation, and differentiation across the company’s portfolio of products. But more importantly, it would create a company better suited to survive in the future that Polman envisaged: This is a world that is challenged. When you look at the interdependent challenges that we face on food security, poverty reduction, sustainability of resources, climate change, and social, economic, environmental development, these challenges have never been greater. And I believe that these pressures will only increase as 2 billion more people enter this world and many aspire to increase their living standards. 1 The changes happening at Lipton, Unilever’s €3.5 billion tea brand, were an important cornerstone of Unilever’s plan. For more than five years, Michiel Leijnse, the global brand director for Lipton Tea, and the Unilever procurement team had led the transformation of the Lipton brand and its supply chain toward a goal of 100% sustainable sourcing. Approximately 25% of all Unilever tea now came from Rainforest Alliance–certified farms, and real gains had been made in the social, environmental, and economic sustainability of tea production. The scale of Unilever’s mainstream partnership approach was unprecedented in the beverages industry, where “ethical” brands had failed to grow beyond niche market positions. Unilever’s goal was to have all of the tea in Lipton tea bags sourced from Rainforest Alliance–certified farms by 2015, and to have every kilogram of Unilever tea sustainably sourced by 2020. Leijnse was confident that the company could achieve these goals, but it faced two critical issues as it worked to make them a reality. Authorized for use only in educational programs at University of British Columbia until Jul 28, 2016. Use outside these parameters is a copyright violation.
Transcript of Sustainable Tea at Unilever - UBC...

9-712-438
R E V : N O V E M B E R 2 1 , 2 0 1 2
________________________________________________________________________________________________________________
Professor Rebecca M. Henderson and Research Associate Frederik Nellemann (MBA 2011) prepared this case. HBS cases are developed solely as the basis for class discussion. Cases are not intended to serve as endorsements, sources of primary data, or illustrations of effective or ineffective management. Copyright © 2011, 2012 President and Fellows of Harvard College. To order copies or request permission to reproduce materials, call 1-800-545-7685, write Harvard Business School Publishing, Boston, MA 02163, or go to www.hbsp.harvard.edu/educators. This publication may not be digitized, photocopied, or otherwise reproduced, posted, or transmitted, without the permission of Harvard Business School.
R E B E C C A M . H E N D E R S O N
F R E D E R I K N E L L E M A N N
Sustainable Tea at Unilever
To survive and prosper over the long term, learn how to adapt your business model by making it servant to society and the environment. Not the other way around.
— Paul Polman, CEO, Unilever
In 2010, Unilever announced its commitment to a new “Sustainable Living Plan,” a document that
set wide-ranging, companywide goals for improving the health and well-being of consumers, reducing environmental impact, and, perhaps most ambitiously, sourcing 100% of agricultural raw materials sustainably by 2020. Such a goal implied a massive transformation of a supply chain that sourced close to 8 million tons of commodities across 50 different crops. Unilever CEO Paul Polman believed that the company’s ambitious goals could drive savings, product innovation, and differentiation across the company’s portfolio of products. But more importantly, it would create a company better suited to survive in the future that Polman envisaged:
This is a world that is challenged. When you look at the interdependent challenges that we face on food security, poverty reduction, sustainability of resources, climate change, and social, economic, environmental development, these challenges have never been greater. And I believe that these pressures will only increase as 2 billion more people enter this world and many aspire to increase their living standards.1
The changes happening at Lipton, Unilever’s €3.5 billion tea brand, were an important cornerstone of Unilever’s plan. For more than five years, Michiel Leijnse, the global brand director for Lipton Tea, and the Unilever procurement team had led the transformation of the Lipton brand and its supply chain toward a goal of 100% sustainable sourcing. Approximately 25% of all Unilever tea now came from Rainforest Alliance–certified farms, and real gains had been made in the social, environmental, and economic sustainability of tea production. The scale of Unilever’s mainstream partnership approach was unprecedented in the beverages industry, where “ethical” brands had failed to grow beyond niche market positions. Unilever’s goal was to have all of the tea in Lipton tea bags sourced from Rainforest Alliance–certified farms by 2015, and to have every kilogram of Unilever tea sustainably sourced by 2020. Leijnse was confident that the company could achieve these goals, but it faced two critical issues as it worked to make them a reality.
Aut
horiz
ed fo
r us
e on
ly in
edu
catio
nal p
rogr
ams
at U
nive
rsity
of B
ritis
h C
olum
bia
until
Jul
28,
201
6.
Use
out
side
thes
e pa
ram
eter
s is
a c
opyr
ight
vio
latio
n.

712-438 Sustainable Tea at Unilever
2
The first issue was how Unilever could transform a supply chain that was not only geographically very diverse but also highly fragmented. Unilever bought tea from all producing regions, and in many markets, the majority of production was controlled by smallholders who sold their tea at open auctions. Unilever and the Rainforest Alliance had successfully certified Unilever’s own tea estates and those of many large plantations, but the firm now faced the increasingly difficult task of convincing smallholders in worldwide markets of the benefits of changing agricultural practices and pursuing Rainforest Alliance certification. India, for example, was a major tea producer and consumer, but the small scale of many of the farms and the nature of local farming practices made certification a significant challenge. What should Unilever do in such markets? Should Unilever insist on Rainforest Alliance certification or instead work to implement incremental change through standards better suited for Indian practices? How could it persuade hundreds of thousands of smallholders to adopt new farming methods in markets where most tea production and consumption was local and Unilever was not the dominant buyer?
The second issue was whether and how Unilever could gain market advantage from its move to sustainable tea. While the adoption of Rainforest Alliance certification appeared to have led to market share growth in some Western markets, it was not clear either that this would continue or that the concept of a sustainability message would resonate with consumers in developing markets like Turkey, India, or Russia. How should Unilever market its sustainability efforts in emerging markets?
Beyond these two key issues, several other smaller but also potentially important questions consumed Unilever’s attention. The Unilever Sustainable Living Plan committed the company to sourcing 100% of all agricultural raw materials sustainably by 2020. Did this mean moving to sustainable paper in tea bags and packaging or to sustainable ingredients sourced in very small amounts—such as chamomile—where there was currently no sustainable supply? If so, what was the best way to approach such moves? And more broadly, were there lessons in Lipton’s experience for the rest of Unilever’s agricultural supply chain and for the power of sustainability as a source of consumer differentiation?
Unilever and Lipton Tea
Unilever
In 2011, Unilever was one of the world’s leading consumer goods companies, selling everything from food products to personal-care and home-care goods. It was a company with a global reach, with sales coming from more than 180 countries, over half of which were in the developing world. Worldwide, over 2 billion consumers used Unilever products each day, and 2010 revenue was over €44 billion ($59 billiona).2 (See Exhibit 1 for income statements from 2006 to 2010.) Just over half of these sales came from foods and beverages, with 31% of sales in personal care and 17% in home care. (See Exhibit 2 for a breakdown by segment.) The company employed 167,000 people globally. Much of the company’s success was due to its portfolio of strong brands. The company had 12 brands with individual sales over €1 billion per annum, including such widely recognized products as Lipton, Dove, and Axe.
a Using exchange rate of €1 = $1.35 as of December 2, 2011.
Aut
horiz
ed fo
r us
e on
ly in
edu
catio
nal p
rogr
ams
at U
nive
rsity
of B
ritis
h C
olum
bia
until
Jul
28,
201
6.
Use
out
side
thes
e pa
ram
eter
s is
a c
opyr
ight
vio
latio
n.

Sustainable Tea at Unilever 712-438
3
The company faced competition from a number of other large consumer goods companies, including Procter & Gamble, Nestlé, and Colgate-Palmolive. (See Exhibits 3 through 5 for further comparative financial figures.)
Unilever Tea
Lipton Tea was the largest tea brand in the world, with annual sales of approximately €3.5 billion.b Unilever’s tea portfolio contained a number of other strong regional brands, such as PG tips in the United Kingdom (U.K.), Lyons in Ireland, and various other brands in countries worldwide, including India, Pakistan, Russia, and Poland. Lipton’s global market share was nearly three times that of its nearest rival, Tata Beverages, the owners of Tetley Tea.
Lipton teas were sold in over 130 countries and were particularly popular in Europe, North America, the Middle East, and parts of Asia. Growth in the developed world was around 1% to 2% a year, but the markets of the developing world—specifically, India and China—were seen as particularly promising, with anticipated annual growth rates of close to 10%.
In 2010, Unilever sold nearly 350,000 tons of tea. Approximately 90% came from external suppliers, with the remainder coming from Unilever’s own estates in East Africa, including its flagship estate in Kericho, Kenya. Every market had a distinct taste in tea, making it to some extent reliant on supply from particular countries. For example, the North American market sourced much of its tea from Argentina, since its tea was particularly well suited for iced tea, which was popular in the U.S.
The Global Tea Market
Tea was the world’s most popular beverage after water. In 2009, approximately 4 million tons of tea was produced in 46 countries, with China, India, Kenya, and Sri Lanka accounting for 70% of global production.3 Kenya, where much of Lipton’s tea was produced, accounted for approximately 8% of global production,4 but was the world’s largest exporter of tea (see Exhibit 14 for a breakdown of global tea production).5
Tea was consumed for a variety of reasons and in a wide variety of blends. Russia, the U.S., and the U.K. were the biggest net importers of tea, accounting for nearly 30% of global imports.6 Japan, with its strong preference for green tea, consumed approximately a fifth of all the global green tea supply. In many countries, tea was an ingrained part of daily life for cultural and historical reasons. In other parts of the world, tea was becoming increasingly popular due to its perceived health benefits.7
Historically, global tea markets had suffered from oversupply. The resulting price pressure was exacerbated by tea’s high degree of commoditization, low switching costs for consumers, and tea’s perishability, which meant prices were often cut drastically to clear stocks.8 Despite moderate gains in the price of tea since 2000, the price of tea in real terms in 2010 was still 35% lower than its peak in the mid-1980s.9 (See Exhibit 6 for global average tea prices, 1960–2010.)
b This figure included some sales realized through the joint venture with Pepsi on ready-to-drink products. These sales are not included Unilever’s total turnover.
Aut
horiz
ed fo
r us
e on
ly in
edu
catio
nal p
rogr
ams
at U
nive
rsity
of B
ritis
h C
olum
bia
until
Jul
28,
201
6.
Use
out
side
thes
e pa
ram
eter
s is
a c
opyr
ight
vio
latio
n.

712-438 Sustainable Tea at Unilever
4
Tea Production and Its Consequences
Tea production was a very labor-intensive activity. With a few regional exceptions, tea production occurred year-round, as farmers carefully hand-picked the top two to three leaves of the plants every 7 to 21 days, depending on the altitude and climate.10 Tea plantsc could grow to a height of 30 feet or more, but were usually cropped at about 2 to 3 feet and then pruned regularly in order to make them easier to pick.11
The leaves were plucked by hand and then processed immediately, either on-site at the plantation or at a bought-leaf factory.12 During processing, tea leaves were withered, macerated, oxidized, dried, and sorted on-site. The processed tea was then transported to a broker or auction, after which it was blended, sometimes flavored, and packaged. Finally, it entered the relevant retail sales channel before ending up with the consumer.
Inappropriately managed, tea production could raise a number of social and environmental concerns. The industry contained a mix of large-scale estates and smallholders, each with their own challenges. Over the years, there had been reports of bad working conditions on poorly managed plantations that damaged worker health through exposure to harmful pesticides and agrochemicals. In certain cases, the workforce included migrant laborers with no protection in case of illness, pregnancy, or other factors.13 Workers generally received low wages and were not always given medical care, housing, education, or pensions. Further, in some cases, independent trade unions, when they existed, had been accused of corruption or ineffectiveness.14
For some smallholders who grew tea as a cash crop, tea production implied the conversion of tropical forests into agricultural land, which could lead to reductions in the diversity of local species and to soil degradation.15 However, for most farmers, unsustainable practices were a result of focus on increasing yields and not acreage. Logging for the firewood needed to dry tea could lead to local deforestation, which could in turn lead to problems in water retention. Some farms used excessive amounts of fertilizers and pesticides, which could negatively affect soil quality and pollute local soils and waterways. Years of commoditization had contributed to a downward price spiral that put pressure on workers and the environment as farmers tried to safeguard their income.
Unilever’s Commitment to Sustainable Tea
Unilever first established a set of good agriculture practice guidelines in 1998. The guidelines outlined sustainable farming practices for the suppliers of its major crops, including tea, palm oil, and tomatoes, and included 10 key indicators of environmental, social, and economic performance, each with its own sub-parameters (see Exhibit 7b for more details). Unilever did not impose the guide on external suppliers, but shared it with them and with the broader public. This was the first move of this kind in the industry.
In 2006, Leijnse began the process of transforming this internal commitment into a major consumer-facing initiative. He believed that many Western consumers had become sufficiently concerned about sustainability that it might help drive product differentiation. More importantly, he saw this as an opportunity to transform the entire tea industry, benefiting not only tea workers and
c There are two main varieties of the tea plant: China and Assam. The Assam variety, which is used in India and Kenya, is the most common. All varieties can be and are used to produce green and black tea. There are many kinds of hybrids between the varieties, and other factors like soil, climate, altitude, picking time, and processing all affect the flavor.
Aut
horiz
ed fo
r us
e on
ly in
edu
catio
nal p
rogr
ams
at U
nive
rsity
of B
ritis
h C
olum
bia
until
Jul
28,
201
6.
Use
out
side
thes
e pa
ram
eter
s is
a c
opyr
ight
vio
latio
n.
Sustainable Tea at Unilever 712-438
5
the environment, but also purchasers of tea who were reliant on a healthy supply chain. Aware that such a transformation was not costless, Leijnse explained the initiative’s rationale:
If we didn’t do something to transform the industry, at some point we just wouldn’t be able to get the quality and quantity of tea we need. While we might see market share gains in some markets, it won’t always be the case. It is a challenge to properly align the short-term and long-term interests of the brand.
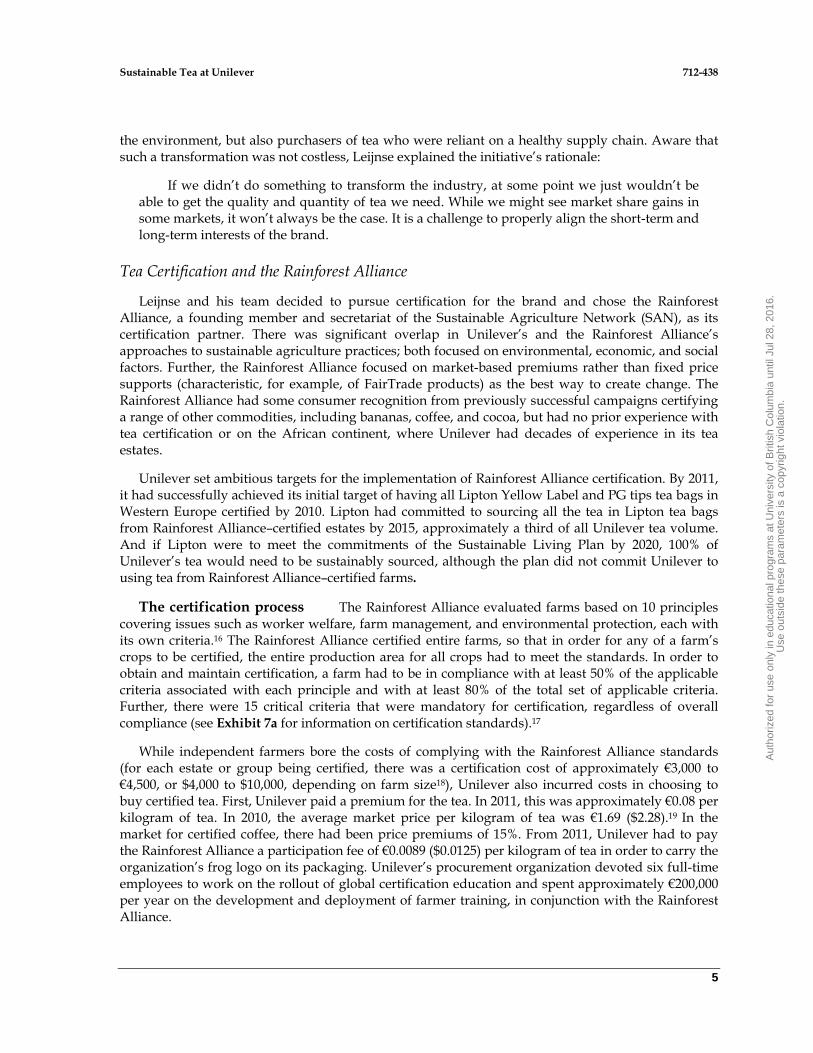
Tea Certification and the Rainforest Alliance
Leijnse and his team decided to pursue certification for the brand and chose the Rainforest Alliance, a founding member and secretariat of the Sustainable Agriculture Network (SAN), as its certification partner. There was significant overlap in Unilever’s and the Rainforest Alliance’s approaches to sustainable agriculture practices; both focused on environmental, economic, and social factors. Further, the Rainforest Alliance focused on market-based premiums rather than fixed price supports (characteristic, for example, of FairTrade products) as the best way to create change. The Rainforest Alliance had some consumer recognition from previously successful campaigns certifying a range of other commodities, including bananas, coffee, and cocoa, but had no prior experience with tea certification or on the African continent, where Unilever had decades of experience in its tea estates.
Unilever set ambitious targets for the implementation of Rainforest Alliance certification. By 2011, it had successfully achieved its initial target of having all Lipton Yellow Label and PG tips tea bags in Western Europe certified by 2010. Lipton had committed to sourcing all the tea in Lipton tea bags from Rainforest Alliance–certified estates by 2015, approximately a third of all Unilever tea volume. And if Lipton were to meet the commitments of the Sustainable Living Plan by 2020, 100% of Unilever’s tea would need to be sustainably sourced, although the plan did not commit Unilever to using tea from Rainforest Alliance–certified farms.
The certification process The Rainforest Alliance evaluated farms based on 10 principles covering issues such as worker welfare, farm management, and environmental protection, each with its own criteria.16 The Rainforest Alliance certified entire farms, so that in order for any of a farm’s crops to be certified, the entire production area for all crops had to meet the standards. In order to obtain and maintain certification, a farm had to be in compliance with at least 50% of the applicable criteria associated with each principle and with at least 80% of the total set of applicable criteria. Further, there were 15 critical criteria that were mandatory for certification, regardless of overall compliance (see Exhibit 7a for information on certification standards).17
While independent farmers bore the costs of complying with the Rainforest Alliance standards (for each estate or group being certified, there was a certification cost of approximately €3,000 to €4,500, or $4,000 to $10,000, depending on farm size18), Unilever also incurred costs in choosing to buy certified tea. First, Unilever paid a premium for the tea. In 2011, this was approximately €0.08 per kilogram of tea. In 2010, the average market price per kilogram of tea was €1.69 ($2.28).19 In the market for certified coffee, there had been price premiums of 15%. From 2011, Unilever had to pay the Rainforest Alliance a participation fee of €0.0089 ($0.0125) per kilogram of tea in order to carry the organization’s frog logo on its packaging. Unilever’s procurement organization devoted six full-time employees to work on the rollout of global certification education and spent approximately €200,000 per year on the development and deployment of farmer training, in conjunction with the Rainforest Alliance.
Aut
horiz
ed fo
r us
e on
ly in
edu
catio
nal p
rogr
ams
at U
nive
rsity
of B
ritis
h C
olum
bia
until
Jul
28,
201
6.
Use
out
side
thes
e pa
ram
eter
s is
a c
opyr
ight
vio
latio
n.

712-438 Sustainable Tea at Unilever
6
Scaling Certification in the Supply Chain
Unilever had to certify almost a quarter of its tea volumes to meet its 2010 goals. Given the lack of any preexisting certified sources, Unilever and the Rainforest Alliance faced a significant challenge in developing large volumes of certified tea in a relatively short time. To address this, Unilever initially focused on certifying its own production in Kenya and Tanzania, as well as some of its larger and better-managed tea suppliers.
Achieving the firm’s 2015 and 2020 goals would require working further down the supply chain with smaller, less organized suppliers operating in widely varying countries, each of which had different agricultural practices, government support, and institutional capacity. Unilever had been successful in building a certified supply chain in East Africa. Could it replicate this across the entire supply chain?
The Certification of Unilever’s Estates in East Africa
The Unilever estates in Kenya and Tanzania were the first sites to be certified. Unilever had actively worked to maximize long-term yields and to control costs ever since planting commenced on the 13,000-hectare estate20 in Kericho, Kenya, in 1928. For example, the estate left tea bush prunings on the field to rot, rather than removing them as waste or for use as firewood or cattle food; this practice maximized soil fertility and water retention. The estate also carefully managed its fertilizer use. Fertilizer was not only expensive but also a potential threat to soil quality if mismanaged. On-site hydropower provided reliable electricity at one-third the cost of power bought from the Kenyan grid, and the tea was dried using wood sourced from fast-growing eucalyptus forests planted on the edge of the estate. In contrast to estates in Asia, Kericho was able to minimize use of agrochemicals and other pesticides because of the favorable climate and appropriate management of the surrounding land, which was home to natural predators of many pests.
The Kericho estate also invested in the health and well-being of its 16,000 employees and their dependents. The employees, who were paid a fixed sum per kilo of tea plucked, typically earned two-and-a-half times more than the local agricultural minimum wage. In addition, Unilever provided them free access to company housing and health care, including the company’s hospital and pharmacies, and the employees’ children were educated in company-owned schools.21 The company had recently invested €1.2 million to update many of these facilities.
The Kericho estate achieved some of the highest yields in the world, with annual yields of 3.5 to 4 tons per hectare, compared to an average of 2 to 3 tons per hectare in India. At the Unilever estate in Tanzania, which followed similar practices, the yields were 3 tons per hectare compared to less than 2 tons per hectare in the rest of the country. “The sustainability work we did at Kericho made good agricultural sense, and in the long run it also made good financial sense,” explained Richard Fairburn, former managing director of Unilever Tea East Africa. “We understand that this is simply the way the industry needs to operate in order to survive and thrive.”
To further increase the supply of certified tea, Unilever identified a priority list of its larger suppliers in Africa, Argentina, and Indonesia. Many of these estates were already professionally managed and were certified following adjustments to existing practices using available tools.22
Aut
horiz
ed fo
r us
e on
ly in
edu
catio
nal p
rogr
ams
at U
nive
rsity
of B
ritis
h C
olum
bia
until
Jul
28,
201
6.
Use
out
side
thes
e pa
ram
eter
s is
a c
opyr
ight
vio
latio
n.
Sustainable Tea at Unilever 712-438
7
Working Down the Supply Chain
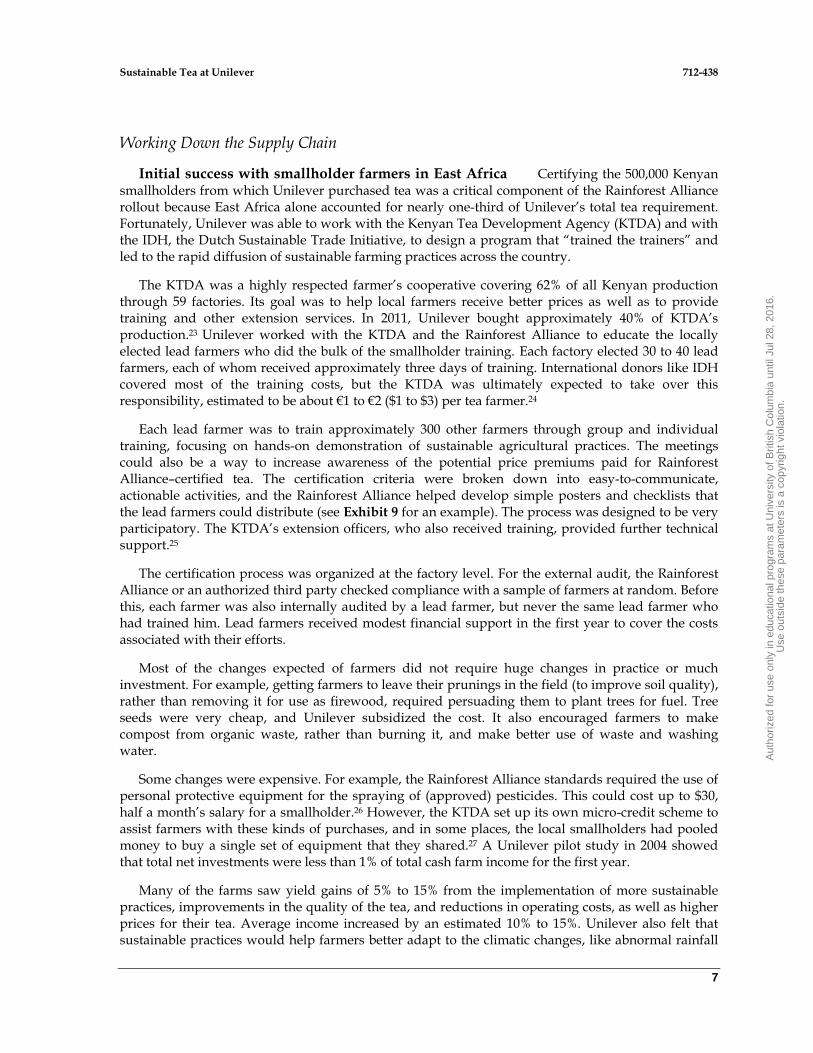
Initial success with smallholder farmers in East Africa Certifying the 500,000 Kenyan smallholders from which Unilever purchased tea was a critical component of the Rainforest Alliance rollout because East Africa alone accounted for nearly one-third of Unilever’s total tea requirement. Fortunately, Unilever was able to work with the Kenyan Tea Development Agency (KTDA) and with the IDH, the Dutch Sustainable Trade Initiative, to design a program that “trained the trainers” and led to the rapid diffusion of sustainable farming practices across the country.
The KTDA was a highly respected farmer’s cooperative covering 62% of all Kenyan production through 59 factories. Its goal was to help local farmers receive better prices as well as to provide training and other extension services. In 2011, Unilever bought approximately 40% of KTDA’s production.23 Unilever worked with the KTDA and the Rainforest Alliance to educate the locally elected lead farmers who did the bulk of the smallholder training. Each factory elected 30 to 40 lead farmers, each of whom received approximately three days of training. International donors like IDH covered most of the training costs, but the KTDA was ultimately expected to take over this responsibility, estimated to be about €1 to €2 ($1 to $3) per tea farmer.24
Each lead farmer was to train approximately 300 other farmers through group and individual training, focusing on hands-on demonstration of sustainable agricultural practices. The meetings could also be a way to increase awareness of the potential price premiums paid for Rainforest Alliance–certified tea. The certification criteria were broken down into easy-to-communicate, actionable activities, and the Rainforest Alliance helped develop simple posters and checklists that the lead farmers could distribute (see Exhibit 9 for an example). The process was designed to be very participatory. The KTDA’s extension officers, who also received training, provided further technical support.25
The certification process was organized at the factory level. For the external audit, the Rainforest Alliance or an authorized third party checked compliance with a sample of farmers at random. Before this, each farmer was also internally audited by a lead farmer, but never the same lead farmer who had trained him. Lead farmers received modest financial support in the first year to cover the costs associated with their efforts.
Most of the changes expected of farmers did not require huge changes in practice or much investment. For example, getting farmers to leave their prunings in the field (to improve soil quality), rather than removing it for use as firewood, required persuading them to plant trees for fuel. Tree seeds were very cheap, and Unilever subsidized the cost. It also encouraged farmers to make compost from organic waste, rather than burning it, and make better use of waste and washing water.
Some changes were expensive. For example, the Rainforest Alliance standards required the use of personal protective equipment for the spraying of (approved) pesticides. This could cost up to $30, half a month’s salary for a smallholder.26 However, the KTDA set up its own micro-credit scheme to assist farmers with these kinds of purchases, and in some places, the local smallholders had pooled money to buy a single set of equipment that they shared.27 A Unilever pilot study in 2004 showed that total net investments were less than 1% of total cash farm income for the first year.
Many of the farms saw yield gains of 5% to 15% from the implementation of more sustainable practices, improvements in the quality of the tea, and reductions in operating costs, as well as higher prices for their tea. Average income increased by an estimated 10% to 15%. Unilever also felt that sustainable practices would help farmers better adapt to the climatic changes, like abnormal rainfall
Aut
horiz
ed fo
r us
e on
ly in
edu
catio
nal p
rogr
ams
at U
nive
rsity
of B
ritis
h C
olum
bia
until
Jul
28,
201
6.
Use
out
side
thes
e pa
ram
eter
s is
a c
opyr
ight
vio
latio
n.
712-438 Sustainable Tea at Unilever
8
patterns, that many locals were already experiencing.28 But, according to Fairburn, the most salient benefit to farmers was their personal empowerment: “The Kenyan smallholders are ultimately interested in creating a farm in good health that can be passed on to future generations. That was the ’sustainability’ that resonated with them.”
By 2011, the Rainforest Alliance had successfully certified over one-third of the smallholder farmers in Kenya, and Unilever was confident that eventually all Kenyan smallholders would gain certification. One encouraging sign was that some of the first groups to become certified had since independently renewed their certification.29 Whether this model could be rolled out to other tea-growing regions like Turkey and India was, of course, still in question.
Marketing the Sustainable Message to Consumers
While Unilever’s procurement organization took the lead on sustainable sourcing, Leijnse’s major task was to explore whether and how the company’s commitment could be translated into increased sales or market share. This effort was complicated by the fact that Unilever had a portfolio of tea brands, each with its own distinct brand proposition. Leijnse had responsibility for Lipton, the largest of the brands, but he needed to work closely with his fellow brand managers across the category to frame appropriate messages and to communicate them well. His research suggested that an increasing number of consumers were interested in a brand’s ethical position and that credible action could change consumer preferences, but no one believed that any of Unilever’s tea brands should become “green” brands. “Certification was never approached as green marketing, but rather as a new marketing message for consumers,” explained one manager involved with the U.K. campaign. “Consumers aren’t choosing our product because it’s green, but because this new message was aligned with their expectations for our brand.”
Retailers were very supportive of the certified tea—some even demanded it—since the product was well aligned with the retailers’ own sustainability initiatives for their businesses and supply chains. Despite this, none of the brand managers wanted to charge a premium for sustainable tea. Instead they hoped to use certification to boost brand equity and, possibly, market share.
The Early Successes of the Rainforest Alliance Initiative
Unilever launched the Rainforest Alliance certification with full-scale marketing campaigns for all of its biggest Western European and Australian tea brands, including Lipton Yellow Label, PG tips, and Lyons. In some markets, the campaigns had significant success. In others, however, the impact was much more limited.
The PG tips success The U.K. market was a large and important one for Unilever, representing just under 10% of the firm’s tea production. The almost €990 milliond (£850 million) market was dominated by two major brands, PG tips and its rival, Tetley Tea, each of which had roughly a quarter of the market.30 PG tips was a classic, black tea blend, with few line extensions.
Unilever saw the U.K. as a progressive country in terms of environmental policies. However, while Unilever’s research suggested that the mass-market consumers were aware and concerned about “sustainability issues,” broadly defined, they were not interested in paying more for green products. The PG tips brand was a mass-market, working-class brand that held a place in the everyday lives of its consumers, who were, in general, middle aged and middle income. The brand
d Using exchange rate of €1 = £0.86 as of December 2, 2011.
Aut
horiz
ed fo
r us
e on
ly in
edu
catio
nal p
rogr
ams
at U
nive
rsity
of B
ritis
h C
olum
bia
until
Jul
28,
201
6.
Use
out
side
thes
e pa
ram
eter
s is
a c
opyr
ight
vio
latio
n.

Sustainable Tea at Unilever 712-438
9
proposition was one of sociability, family, and lightheartedness. This was captured in its ad campaigns, which were infused with offbeat British humor.
In 2008, PG tips was the only brand on the market proposing any sustainability differentiation. The marketing team treated the initiative as a major brand innovation and devoted its entire €12 million (£10 million) marketing spend in the launch year 2008 to promoting the efforts. Previous U.K. experience indicated that it took 12 to 18 months to address mental barriers and get the full message to consumers. The challenge for the PG tips team was to find a message that would resonate with its core consumers while maintaining consistency with the brand’s core proposition. “It was a huge challenge,” explained Neil Gledhill of the PG tips campaign. “We had to talk to mainstream consumers in a way that explained a complex topic without preaching, all in a language aligned with the brand.”
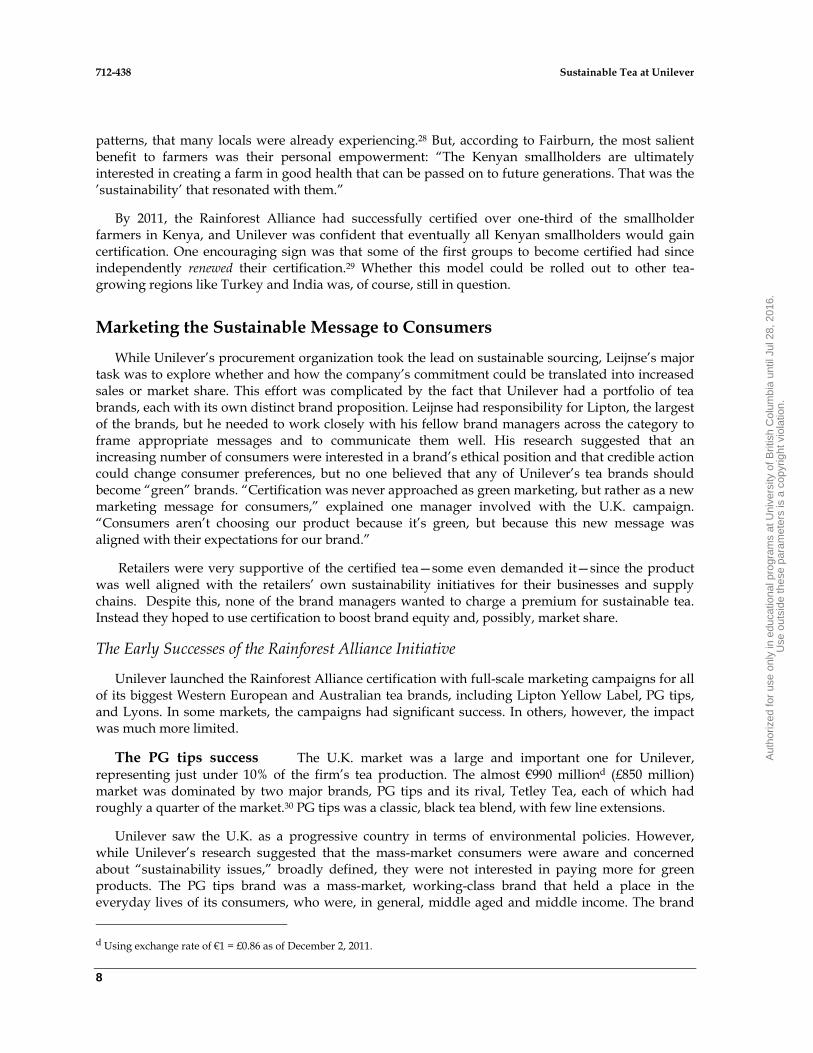
The chosen message, “do your bit: put the kettle on,” emphasized the positive action that consumers could take by drinking PG tips. The campaign tried to keep the lighthearted spirit of the brand’s previous campaigns and used its well-established characters: a talking monkey called Monkey and a working class man named Al. In one of the ads, for example, Monkey, presenting a slide show in the kitchen, explained to Al what certification meant, and how easy it was for him to do the right thing (see Exhibit 11 for sample ads). The campaign used TV and print, as well as a short movie that was shown as a preview in cinemas and was ultimately included as a DVD in special promotion packages along with a tea towel. Packaging was also changed to include the certification seal and a description of the alliance.
Prior to the campaign, PG tips and Tetley Tea were battling hard for the top spot in the British market. However, following the campaign, PG tips developed a significant lead in market share, which increased by 1.8 points, while Tetley remained relatively flat; the purchase repeat rate increased from 44% to 49%. Sales of PG tips increased by 6%. Surveys suggested that following the launch of the campaign, there had been a steady increase in the perception of PG tips as an ethical brand.
“Project Sunshine”: the Australian success Like the U.K.’s tea market, Australia’s market was relatively straightforward, with only a handful of available products and most of its sales in black tea. Before the launch of the campaign in 2009, the Lipton brand held nearly a quarter of the €260 millione (345 million Australian dollars [A$]) market. Unilever’s other brand, Bushell’s, had an approximately 13% share of the market. The local team chose the phrase “Make a Better Choice with Lipton, the world’s first Rainforest Alliance Certified tea,” and because of the relatively small portfolio, implemented it across the majority of the products. The team felt that the phrase was aligned with the existing brand vision, which had been “Drink Better, Live Better,” an attempt to increase the perceptions of quality and the health benefits of the Lipton brand. The €1.1 million (A$1.4 million) campaign covered television, print, and public relations. Unilever also supported the initiative with in-store promotions. It changed packaging to include the Rainforest Alliance seal on the front of the package, with further explanation of the initiative and its benefits on the back and sides. Customers were not charged a premium for certified tea, since surveys had found that higher prices were a perceived barrier to sustainable consumption. Relative to the same test period the year before the campaign, sales were up 11%, and Lipton’s market share rose by 158 basis points from 24.2% to 25.8%. Average purchase value per occasion rose from €3.11 to €3.23 (A$4.10 to A$4.25). The only area where the Lipton brand did not improve was in perceptions of quality, which decreased slightly during the campaign.
e Using exchange rate of €1 = A$1.31 as of December 2, 2011.
Aut
horiz
ed fo
r us
e on
ly in
edu
catio
nal p
rogr
ams
at U
nive
rsity
of B
ritis
h C
olum
bia
until
Jul
28,
201
6.
Use
out
side
thes
e pa
ram
eter
s is
a c
opyr
ight
vio
latio
n.
712-438 Sustainable Tea at Unilever
10
Full activation in Italy The Italian tea market was estimated to be approximately €285 million in 2010. Unilever’s share was approximately 12%.31 The Italian marketing team supported the certification with a €3 million mixed campaign of television, press, online, public relations, in-store promotions, and packaging updates. The team chose the message, “your small cup can make a big difference.” Following the first year of the campaign in 2008, Lipton saw sales of its Yellow Label brand increase by 10.5% and market share increase by over two full percentage points. It also witnessed an increase in its buyer base, which came mostly from younger and more upmarket consumers. The team continued to support the campaign with in-store promotion in 2009 and a web and editorial partnership with Italy’s National Geographic magazine in 2010, all of which cost €250,000.
The French market disappointment In 2010, Lipton had a 37% market share in the €430 million French tea market.32 Lipton’s main competition came from retailers’ private-label brands, which accounted for 30% to 40% of sales. In France, Unilever’s portfolio was more diversified than in other countries: Lipton sold over 40 different tea products. Whereas in the U.K. and Australia, Unilever had been able to carry the certification message on the majority of its products, in France, it was initially only linked to the Lipton Yellow Label black tea product, representing only about a fifth of sales.
The first wave of the campaign in France relied heavily on a significant public relations effort to educate consumers and customers (i.e., the retailers) and inform them of Lipton’s certification efforts. The team focused on engaging key opinion leaders and journalists with press releases, media and press conferences, and trips to the Kericho estate in Kenya. The press widely covered the brand’s efforts, and the team members felt that they had made significant inroads in attracting attention. Print ads with the message “your tea can make a difference” were placed in travel and cooking magazines and were primarily focused toward current consumers, who tended to be female and over the age of 50.
The team’s research had suggested that French consumers were less likely to buy box of tea with a Rainforest Alliance seal on it. This reluctance appeared to reflect a dislike of changes in packaging rather than any lack of concern for environmental issues, but as a result, the team chose a staggered approach to package change, whereby certification was initially announced only on the inside of packages before being added to the back. Only in 2010 did the seal start to appear on the front of the packages. This made it harder for consumers to link advertising support to the product they were seeing on shelves.
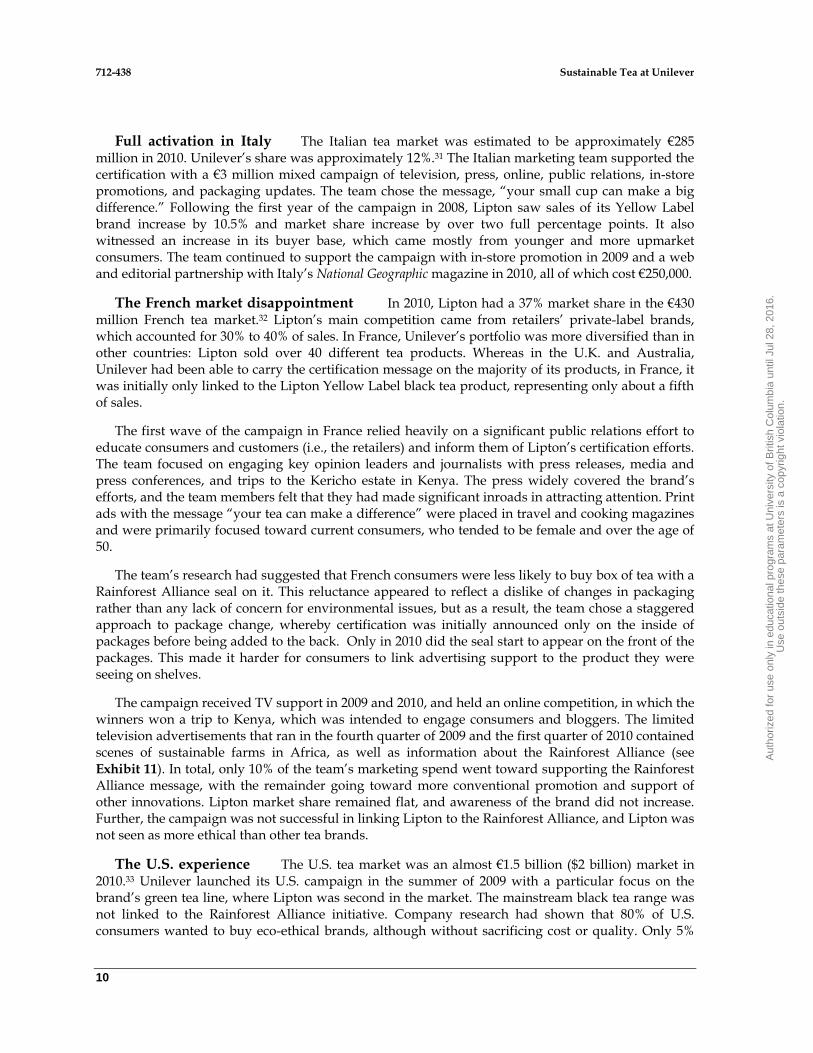
The campaign received TV support in 2009 and 2010, and held an online competition, in which the winners won a trip to Kenya, which was intended to engage consumers and bloggers. The limited television advertisements that ran in the fourth quarter of 2009 and the first quarter of 2010 contained scenes of sustainable farms in Africa, as well as information about the Rainforest Alliance (see Exhibit 11). In total, only 10% of the team’s marketing spend went toward supporting the Rainforest Alliance message, with the remainder going toward more conventional promotion and support of other innovations. Lipton market share remained flat, and awareness of the brand did not increase. Further, the campaign was not successful in linking Lipton to the Rainforest Alliance, and Lipton was not seen as more ethical than other tea brands.
The U.S. experience The U.S. tea market was an almost €1.5 billion ($2 billion) market in 2010.33 Unilever launched its U.S. campaign in the summer of 2009 with a particular focus on the brand’s green tea line, where Lipton was second in the market. The mainstream black tea range was not linked to the Rainforest Alliance initiative. Company research had shown that 80% of U.S. consumers wanted to buy eco-ethical brands, although without sacrificing cost or quality. Only 5%
Aut
horiz
ed fo
r us
e on
ly in
edu
catio
nal p
rogr
ams
at U
nive
rsity
of B
ritis
h C
olum
bia
until
Jul
28,
201
6.
Use
out
side
thes
e pa
ram
eter
s is
a c
opyr
ight
vio
latio
n.

Sustainable Tea at Unilever 712-438
11
were willing to pay a premium. The message used was “Your Small Cup Can Make a Big Difference,” although Unilever also had other messaging for its ready-to-drink beverage line running concurrently. To generate credibility, Unilever allowed National Geographic to create independent TV, print, and online content about the certification, which was published between June and September 2009. The campaign was also supported by a sponsored trip to the Kericho estate for three online bloggers and journalists, as well as advertising in online and social media. It changed the packaging to include the Rainforest Alliance seal on the front and information about certification on the side and flap of the package. A retail partnership with Walmart and Sam’s Club provided information and positive images at the point of purchase, which helped reinforce perceptions of health and quality benefits (see Exhibit 13 for examples of in-store promotions). The marketing team’s analysis indicated a strong ROI for the €740,000 ($1 million) campaign; however, given the size of the business, the investment was relatively small. Unilever did not see any significant effect on overall market share for Lipton or the Rainforest Alliance–certified green tea.
Challenges Going Forward
A few years after the launch of the certification scheme, many of Unilever’s major competitors responded with their own certification programs. Tetley, Twinings, and Yorkshire Tea all made arrangements for some or all of their tea suppliers to obtain Rainforest Alliance certification, while Pickwick and Carmien Tea opted to use UTZ, a certification scheme originating in The Netherlands. Yorkshire Tea announced a goal of selling 100% Rainforest Alliance–certified tea by 2015.34 Twinings had goals of 100% certification by 2015 for its Everyday brand tea.35 Tata’s Tetley Tea vowed to have 100% of its branded tea certified by 2016, a year after Lipton.36 The surge in demand placed pressure on the Rainforest Alliance, which expected to be certifying close to 20% to 25% of the world’s tea supply by 2015.37
The Emerging Market Challenge
With competitors committing to third-party certification, sustainable tea at Unilever faced a number of challenges going forward. On the supply side, the company had to improve farming practices in some very difficult markets in order to meet the company’s targets. On the marketing side, Leijnse and his colleagues had to decide how to proceed in emerging markets. Could consumers in countries like Turkey, Russia, or India be persuaded to value certified tea? If so, how? And how could Lipton maintain a point of difference in countries where competitor brands had followed suit?
Reaching 100% Sustainable Sourcing
In 2011, Unilever sourced approximately 25% of its global tea requirement from India; most of India’s tea was consumed domestically. Some Indian tea growers had already achieved Rainforest Alliance certification, but they were generally exporters and Unilever purchased a significant share of their production. Converting smaller domestic producers to sustainable practices presented (at least) two tricky challenges. First, developing an organizational model that could handle training and rollout was likely to be difficult. A large proportion of India’s tea was grown by smallholders who sold to local tea factories. However, in contrast to the situation in Kenya, there were no government-sponsored tea cooperatives, and farmers were free to sell to any factory. Some factories did provide extension services and training for their farms, but the quality of these services varied dramatically.
Aut
horiz
ed fo
r us
e on
ly in
edu
catio
nal p
rogr
ams
at U
nive
rsity
of B
ritis
h C
olum
bia
until
Jul
28,
201
6.
Use
out
side
thes
e pa
ram
eter
s is
a c
opyr
ight
vio
latio
n.

712-438 Sustainable Tea at Unilever
12
Second, farming practices in India were in conflict with the Rainforest Alliance over two main issues, child labor and pesticide use. The standards did not permit certified farms to employ anyone under the age of 15, but Indian law and the United Nation’s International Labor Organization permitted the employment of 14-year-olds in developing countries. Moreover, in India, the pesticide Paraquat was widely used in tea production. It was quick and effective, but it was also highly toxic when ingested or if absorbed by a person without protective equipment.38 It was implicated in many suicides in the developing world due to its low cost, potency, and widespread availability. The European Union banned the use of Paraquat, but the U.S. allowed its use, with restrictions.39 Rainforest Alliance standards did not permit its use, and since the ban on Paraquat was one of its critical criteria, it could not make exceptions by country.40
Unilever could potentially address these issues by introducing an alternative standard tailored to India’s local practices. This standard could act as a stepping stone toward future certification. Unilever would almost certainly need partners to transform Indian tea growing. One option was to work with local NGOs, as it had in Kenya; another was to implement industrywide initiatives.
Marketing in India and Other Emerging Markets
Getting the messaging right in India would be another important challenge. Tea was the traditional hot beverage of India, and the market was estimated to be €1 billionf (RS 64.6 billion), with Unilever the market leader with a share of around 30%. Demand for tea was robust, with the market growing an estimated 12% per annum by value and 3% per annum by volume from 2005 to 2010. The demand for tea had actually outstripped the growth in national tea production, resulting in tea price increases in 2010.41
Approximately two-thirds of the market, by volume, was sold as unbranded loose black tea (in bulk). Only one-third of the market was branded tea, which was almost exclusively loose black tea in packets. Tea bags represented less than 2% of the market, but were a growing segment. Green tea was another high-growth category, particularly in urban areas, because of its perceived health benefits.42 Almost three-quarters of all tea was still sold through independent small grocers, but supermarkets and hypermarkets had begun to slowly increase their share as rising incomes began to shift consumers’ buying behavior. Branded coffee shop chains had also become popular, particularly with young Indian consumers, who increasingly viewed tea as an old-fashioned beverage.43
Unilever’s Indian subsidiary, Hindustan Unilever, sold mostly through two major brands, Brooke Bond and Lipton, which had market shares of 19% and 6%, respectively, in the branded tea market. Its main competitor was Tata Global Beverages, which had a market share of 26%, mostly under its Tata Tea brand, which had almost 20% of the market by retail value.44 But Unilever also faced competition from regional tea companies, which took pride in tailoring their blends and preparation methods according to local preferences and which often competed aggressively on price.
Under the Sustainable Living Plan umbrella, Hindustan Unilever had begun to introduce products designed to improve the quality of life of India’s poorest consumers, including new, highly effective hand soaps and a range of water purifiers. (See Exhibit 12 for an illustration of the plan.) The company had also been marketing Surf Excel, a concentrated laundry detergent, which required two fewer buckets of water for washing than competing products.45 The company believed that if the environmental issue was tangible and had an immediate local impact, people’s awareness and
f Using exchange rate of €1 = RS 69.6 as of December 2, 2011.
Aut
horiz
ed fo
r us
e on
ly in
edu
catio
nal p
rogr
ams
at U
nive
rsity
of B
ritis
h C
olum
bia
until
Jul
28,
201
6.
Use
out
side
thes
e pa
ram
eter
s is
a c
opyr
ight
vio
latio
n.

Sustainable Tea at Unilever 712-438
13
appreciation of the issue was generally high. But it was less clear if Unilever could communicate the comparatively distant benefits of sustainable tea farming.
Leijnse wondered whether the company’s recent experience in Turkey could provide any lessons. In Turkey, the tea-growing industry played a prominent role in national cultural identity, and the Turkish team had chosen a message that suggested that certified tea offered national benefits, highlighting gains to domestic producers, as well as to the country’s tea crops (see Exhibit 8 for sample packaging in Turkey). Should Leijnse attempt something similar in India?
He also had to consider how tea could be marketed in emerging markets where there was no tea-growing base. One such example was Russia, where Unilever had a 16% share of the almost €3 billiong (115 billion rubles [RUB]) market in 2010. Tea was a traditional Russian drink consumed by almost everyone.46 A domestic tea manufacturer led the market, and while volume growth had been limited, sales in the market had been growing at close to 15% since 2005, as consumers switched to more expensive varieties of tea and as the major Russian brands continued to expand the range of their offerings.47 Could Unilever’s sustainable tea platform serve as the basis for product differentiation that would drive growth and market share in Russia? Or should Unilever forgo any promotion of sustainability and instead focus on other ways of competing in the Russian market?
Concluding Thoughts
With the launch of Rainforest Alliance certification in 2007, Unilever had started the transformation of the tea industry and improved the lives of hundreds of thousands of farmers. It had also demonstrated that in certain markets, certification could increase market share. However, with most major tea manufacturers implementing aggressive certification targets of their own, it appeared that sustainability might, at least in Western markets, become increasingly more a cost of doing business and less a source of competitive advantage. Unilever needed to decide not only how to ensure that 100% of its supply chain could be sustainably sourced, but also how that message could be communicated in a diverse group of emerging markets.
Leijnse also needed to decide how far he could push sustainability in the brand. If Unilever were to reach its targets under the Sustainable Living Plan, it would eventually need to sustainably source all agricultural raw materials, including the paper and board used for the tea packaging and tea bags (see Exhibit 10 for its agricultural raw materials by volume). Could it communicate this to consumers in a useful way?
Looking across Unilever, Leijnse wondered if his experiences in tea had anything to contribute to marketing managers grappling with the potential benefits of 100% sustainable sourcing. From a marketing perspective, tea and the Lipton brand had been an obvious place to start addressing sustainability, given the tight link between the raw material and the end product. The same could not be said for many of the other raw materials that Unilever purchased. For example, Unilever was the world’s largest buyer of sustainable palm oil, and it had committed to ensuring that all its purchases came from sustainable sources by 2015. Consumers did not ultimately buy sustainable palm oil, but rather, products that contained it, such as soap and edible fats. Unilever was uncertain whether to make consumers aware of its efforts. Moreover, Leijnse had experienced increased attention and criticism from activists since launching the Rainforest Alliance partnership; would the Sustainable Living Plan potentially make Unilever a bigger target for scrutiny? Were there any lessons that could be learned from Lipton?
g Using exchange rate of €1 = RUB 41.4 as of December 2, 2011.
Aut
horiz
ed fo
r us
e on
ly in
edu
catio
nal p
rogr
ams
at U
nive
rsity
of B
ritis
h C
olum
bia
until
Jul
28,
201
6.
Use
out
side
thes
e pa
ram
eter
s is
a c
opyr
ight
vio
latio
n.

712-438 Sustainable Tea at Unilever
14
Exhibit 1 Unilever Income Statements, 2006–2010 (€ millions)
2010 2009 2008 2007 2006
Revenue 44,256 39,821 40,519 40,116 39,647
Cost of Goods Sold 37,637 33,933 21,340 20,522 20,095
Gross Profit 6,619 5,888 19,179 19,594 19,551
Gross Profit Margin 15.0% 14.8% 47.3% 48.8% 49.3%
SG&A Expense -- -- 12,012.79 13,790.41 13,900.57
Depreciation & Amortization 992.86 1,031.94 1,002.90 941.28 982.07
Operating Income 6,338 5,020 7,166 5,235 5,408
Operating Margin 14.3% 12.6% 17.7% 13.1% 13.6%
Non-operating Income 206.97 324.98 361.96 646.66 181.87
Non-operating Expenses -413.94 -428.98 -399.96 -- --
Income Before Taxes 6,131 4,916 7,128 5,175 4,832
Income Taxes 1,534 1,257 1,844 1,126 1,146
Net Income After Taxes 4,597 3,659 5,284 4,049 3,686
Continuing Operations 4,243 3,370 5,284 3,801 3,415
Discontinued Operations -- -- 0 80 1,330
Total Operations 4,243 3,370 5,284 3,881 4,745
Total Net Income 4,243 3,370 5,026 3,881 4,745
Net Profit Margin 9.6% 8.5% 12.4% 9.7% 12.0%
Diluted EPS from Continuing Operations 1.46 1.17 1.73 5.12 4.6
Diluted EPS from Total Operations 1.46 1.17 1.73 5.24 6.4
Diluted EPS from Total Net Income 1.46 1.17 1.73 5.24 6.4
Dividends Per Share 0.86 0.69 0.69 0.72 0.45
Source: Unilever income statements, via Hoover’s Inc., http://www.hoovers.com, accessed November 2011.
Exhibit 2 Revenue and Operating Income by Division,a 2010 (€ millions)
Savory, Dressings,
& Spreads Ice Cream &
Beverages Personal
Care Home Care Total
Revenue 14,164 8,605 13,767 7,726 44,262
Operating Expenses 11,318 7,881 11,471 7,253 37,923
Operating Income 2,846 724 2,296 473 6,339
Operating Margin 20.1% 8.4% 16.7% 6.1% 14.3%
Source: Company documents.
a Some of Unilever’s other brands include Hellmann’s, Knorr, Becel, Heartbrand Ice Cream, Breyers, Axe, Dove, Vaseline, Omo, and Surf.
Aut
horiz
ed fo
r us
e on
ly in
edu
catio
nal p
rogr
ams
at U
nive
rsity
of B
ritis
h C
olum
bia
until
Jul
28,
201
6.
Use
out
side
thes
e pa
ram
eter
s is
a c
opyr
ight
vio
latio
n.

Sustainable Tea at Unilever 712-438
15
Exhibit 3 Revenue Growth by Company (%)
CAGR, 1980–2009 1980s 1990s 2000s
L’Oréal 9.4% 13.7% 9.8% 3.6%
Reckitt 8.5% 8.9% 5.9% 10.6%
P&G 6.9% 8.3% 4.8% 7.8%
Danone 6.0% 11.5% 5.7% 0.5%
Nestlé 5.2% 7.8% 5.4% 3.1%
Colgate 3.8% -0.2% 5.4% 6.1%
Unilever 3.5% 8.1% 2.5% -2.0%
Source: Company documents.
Exhibit 4 Enterprise Value Growth by Company (%)
CAGR, 1980–2009 1980–1989 1990–1999 2000–2009
Nestlé 18.6% 37.5% 21.7% 3.4%
Reckitt 16.9% 24.2% 7.6% 16.1%
L’Oréal 16.6% 23.4% 34.7% -3.1%
Danone 14.0% 31.1% 10.3% 2.4%
Colgate 12.6% 16.0% 23.0% 0.9%
P&G 12.4% 17.1% 17.7% 6.6%
Unilever 10.2% 21.5% 10.6% -3.4%
Source: Company documents.
Exhibit 5 EBIT Margins by Company (%)
1980 2009 Margin Growth
(bps)
L’Oréal 11.0% 14.2% 326
P&G 10.5% 20.5% 999
Reckitt 9.3% 25.2% 1,591
Nestlé 8.4% 14.6% 621
Colgate 7.9% 24.0% 1,610
Danone 6.8% 16.4% 963
Unilever 5.7% 14.8% 912
Source: Company documents.
Aut
horiz
ed fo
r us
e on
ly in
edu
catio
nal p
rogr
ams
at U
nive
rsity
of B
ritis
h C
olum
bia
until
Jul
28,
201
6.
Use
out
side
thes
e pa
ram
eter
s is
a c
opyr
ight
vio
latio
n.

712-438 Sustainable Tea at Unilever
16
Exhibit 6 Global Average Tea Prices,a 1960–2010 (U.S. cents per kilogram)
Source: Adapted from World Bank data, Global Economic Monitor (GEM) Commodities, World databank, http://databank. worldbank.org/ddp/home.do?Step=1&id=4, accessed November 2011.
a Base year is 2000. Prices are averages of Colombo, Kokata, and Mombasa auctions.
Aut
horiz
ed fo
r us
e on
ly in
edu
catio
nal p
rogr
ams
at U
nive
rsity
of B
ritis
h C
olum
bia
until
Jul
28,
201
6.
Use
out
side
thes
e pa
ram
eter
s is
a c
opyr
ight
vio
latio
n.

Sustainable Tea at Unilever 712-438
17
Exhibit 7a Ten Core Principles of Sustainable Agriculture Network
1. Social and Environmental Management System 2. Ecosystem Conservation 3. Wildlife Protection 4. Water Conservation 5. Fair Treatment and Good Working Conditions for Workers 6. Occupational Health and Safety 7. Community Relations 8. Integrated Crop Management 9. Soil Management and Conservation 10. Integrated Waste Management
Source: Sustainable Agriculture Network, “Our Standards: SAN Principles,” Sustainable Agriculture Network website, http://sanstandards.org/sitio/subsections/display/7, accessed December 2011.
Exhibit 7b Ten Indicators of Unilever Sustainable Agriculture Code
1. Agrochemicals and fuels 2. Soils 3. Water 4. Biodiversity 5. Energy 6. Waste 7. Social and human capital 8. Animal welfare 9. Value chain and local economy 10. Training
Source: Company documents.
Aut
horiz
ed fo
r us
e on
ly in
edu
catio
nal p
rogr
ams
at U
nive
rsity
of B
ritis
h C
olum
bia
until
Jul
28,
201
6.
Use
out
side
thes
e pa
ram
eter
s is
a c
opyr
ight
vio
latio
n.

712-438 Sustainable Tea at Unilever
18
Exhibit 8 Rainforest Alliance Messaging in Turkey
“As Lipton, Turkey's expert tea brand and responsible teaproducer, we want to ensure that our tea will be passed onto our children and future generations. To this end, we aretaking the first steps in our ‘Sustainable Tea FarmingProject’ by combining our expertise with the passion of thetea growers in Black Sea Region. Our goal is to enhanceexisting agricultural practices and to generalize the use ofthose that conserve the ecological balance by raisingawareness among more than 15,000 tea growers in theregion about the tea planting and harvesting. We arecommitted to accomplish this goal in a way that will enableto gain Rainforest Alliance Certified™ status for ourfarmers. Remember that you support our farmers withevery cup of Lipton tea you drink.”
Source: Company documents.
Aut
horiz
ed fo
r us
e on
ly in
edu
catio
nal p
rogr
ams
at U
nive
rsity
of B
ritis
h C
olum
bia
until
Jul
28,
201
6.
Use
out
side
thes
e pa
ram
eter
s is
a c
opyr
ight
vio
latio
n.

Sustainable Tea at Unilever 712-438
19
Exhibit 9 Educational Poster for Smallholders in East Africa
Source: Company documents (via Rainforest Alliance).
Aut
horiz
ed fo
r us
e on
ly in
edu
catio
nal p
rogr
ams
at U
nive
rsity
of B
ritis
h C
olum
bia
until
Jul
28,
201
6.
Use
out
side
thes
e pa
ram
eter
s is
a c
opyr
ight
vio
latio
n.

712-438 Sustainable Tea at Unilever
20
Exhibit 10 Unilever Agricultural Raw Materials by Volume, 2010
Source: Company documents.
Aut
horiz
ed fo
r us
e on
ly in
edu
catio
nal p
rogr
ams
at U
nive
rsity
of B
ritis
h C
olum
bia
until
Jul
28,
201
6.
Use
out
side
thes
e pa
ram
eter
s is
a c
opyr
ight
vio
latio
n.
Sustainable Tea at Unilever 712-438
21
Exhibit 11 Examples of Rainforest Alliance Advertising
PG tips (U.K.)
Lipton (France)
Source: Company documents.
Aut
horiz
ed fo
r us
e on
ly in
edu
catio
nal p
rogr
ams
at U
nive
rsity
of B
ritis
h C
olum
bia
until
Jul
28,
201
6.
Use
out
side
thes
e pa
ram
eter
s is
a c
opyr
ight
vio
latio
n.

71
2-4
38
-
22
-
Exh
ibit
12
Un
ilev
er S
ust
ain
able
Liv
ing
Pla
n T
arg
ets
So
urc
e:
Co
mp
any
do
cum
ents
.
Aut
horiz
ed fo
r us
e on
ly in
edu
catio
nal p
rogr
ams
at U
nive
rsity
of B
ritis
h C
olum
bia
until
Jul
28,
201
6.
Use
out
side
thes
e pa
ram
eter
s is
a c
opyr
ight
vio
latio
n.

Sustainable Tea at Unilever 712-438
23
Exhibit 13 Examples of U.S. In-Store Promotions
Source: Company documents
Exhibit 14 Global Tea Production, 2009 (Tons)
Tons Percent of
Total
China 1,375,780 34.8%
India 800,000 20.3%
Kenya 314,100 8.0%
Sri Lanka 290,000 7.3%
Turkey 198,601 5.0%
Vietnam 185,700 4.7%
Indonesia 160,000 4.1%
Japan 86,000 2.2%
Argentina 73,425 1.9%
Thailand 63,707 1.6%
Other 402,734 10.2%
Total 3,950,047 100.0%
Source: Adapted from FAOSTAT, FAO website, http://faostat.fao.org/site/567/default.aspx#ancor, accessed December 2011.
Aut
horiz
ed fo
r us
e on
ly in
edu
catio
nal p
rogr
ams
at U
nive
rsity
of B
ritis
h C
olum
bia
until
Jul
28,
201
6.
Use
out
side
thes
e pa
ram
eter
s is
a c
opyr
ight
vio
latio
n.
712-438 Sustainable Tea at Unilever
24
Endnotes
1 Paul Polman, “Unilever CEO Paul Polman at One Young World—Plans for the World’s Sustainability,” speech at Second Annual One Young World Summit, September 4, 2011, http://www.youtube.com/watch?v=_ Tq1k088MbE, accessed November 2011.
2 Unilever income statements, via Hoover’s Inc., http://www.hoovers.com, accessed November 2011.
3 Tea Production Quantity, FAOSTAT, FAO website, http://faostat.fao.org/site/567/default.aspx#ancor, accessed December 2011.
4 Tea Production Quantity, FAOSTAT.
5 The World Bank, “Global Commodity Markets,” http://siteresources.worldbank.org/EXTDEC PROSPECTS/Resources/476882-1253048544063/GDF_Jan2010_GEPweb.pdf, accessed December 2011.
6 The World Bank, “Global Commodity Markets.”
7 Jason Clay, World Agriculture and the Environment (Washington, DC: Island Press), pp. 96–97.
8 FairTrade, “The Tea Market—A Background Study,” http://www.maketradefair.com/assets/english/TeaMarket.pdf, accessed November 2011.
9 Global Economic Monitor (GEM) Commodities, World databank, http://databank.worldbank.org/ ddp/home.do?Step=1&id=4, accessed November 2011.
10 Clay, World Agriculture and the Environment, p. 98.
11 Kelly Rossiter, “Tea Time: A Visit to a Sustainable Tea Plantation,” Tree Hugger, March 25, 2009, http://www.treehugger.com/files/2009/03/tea-time-about-tea.php, accessed October 2011.
12 FairTrade, “The Tea Market—A Background Study.”
13 Tropical Commodity Coalition, “Tea: Producers,” TCC website, http://www.teacoffeecocoa.org/tcc/ Commodities/Tea/Producers, accessed November 2011
14 Tropical Commodity Coalition, “Tea: Producers.”
15 Clay, World Agriculture and the Environment, pp. 102–103.
16 Tania Braga et al., “Unilever Sustainable Tea: Leapfrogging to Mainstream,” IMD No. IMD-2-0157 (IMD, December 2010), http://www.saiplatform.org/uploads/Library/IMD-CaseStudyUnileverSustainableTea.pdf, accessed November 2011.
17 Sustainable Agriculture Network, “Our Standards: SAN Principles,” Sustainable Agriculture Network website, http://sanstandards.org/sitio/subsections/display/7, accessed December 2011.
18 Marc Monsarrat, Rainforest Alliance, interview by author, Cambridge, MA, October 26, 2011.
19 The World Bank, “Global Commodity Markets.”
20 Rainforest Alliance, “Tour the First Rainforest Alliance Certified Tea Estate,” Rainforest Alliance website, http://www.rainforest-alliance.org/multimedia/kericho-tea-estate, accessed November 2011.
21 Rainforest Alliance, “Tour the First Rainforest Alliance Certified Tea Estate.”
22 Tania Braga, Aileen Ionescu-Somers, and Ralf W. Seifert, “Unilever Sustainable Tea Part II: Reaching out to smallholders in Kenya and Argentina,” http://www.idhsustainabletrade.com/idh-publications, accessed November 2011.
23 Braga, Ionescu-Somers, and Seifert, “Unilever Sustainable Tea Part II.”
24 Monsarrat, interview by author.
25 Braga, Ionescu-Somers, and Seifert, “Unilever Sustainable Tea Part II.”
Aut
horiz
ed fo
r us
e on
ly in
edu
catio
nal p
rogr
ams
at U
nive
rsity
of B
ritis
h C
olum
bia
until
Jul
28,
201
6.
Use
out
side
thes
e pa
ram
eter
s is
a c
opyr
ight
vio
latio
n.

Sustainable Tea at Unilever 712-438
25
26 “Britain Backs Kenya Tea Farmers,” March 14, 2011, SOS Children’s Village, http://www.soschildrens villages.org.uk/charity-news/archive/2011/03/britain-backs-kenya-tea-farmers, accessed November 2011.
27 Tensie Whelan, Rainforest Alliance, interview by author, Cambridge, MA, October 24, 2011.
28 Monsarrat, interview by author.
29 Monsarrat, interview by author.
30 “Tea in the United Kingdom,” Euromonitor International, January 2011, http://www.euromonitor.com, accessed November 2011.
31 “Tea in Italy,” Euromonitor International, February 2011, http://www.euromonitor.com, accessed November 2011.
32 “Tea in France,” Euromonitor International, February 2011, http://www.euromonitor.com, accessed November 2011.
33 “Tea in the US,” Euromonitor International, February 2011, http://www.euromonitor.com, accessed November 2011.
34 Rainforest Alliance, “A Seal with Wide Appeal,” Rainforest Alliance website, http://www.rainforest-alliance.org/multimedia/seal-appeal, accessed October 2011
35 Twinings, “Frequently Asked Questions,” Twinings website, http://shop.twinings.co.uk/shop/ Frequently-Asked-Questions#_What_is_the_3, accessed December 2011.
36 Tetley Tea, “Tetley and Sustainability,” Tetley Tea website, http://www.tetley.com/malta/aboutus/ Pages/Sustainability.aspx, accessed October 2011
37 Monsarrat, interview by author.
38 Whelan, interview by author.
39 “Paraquat,” Pesticide Action Network UK, http://www.pan-uk.org/pestnews/Actives/paraquat.htm, accessed November 2011.
40 Whelan, interview by author.
41 “Tea in India,” Euromonitor International, January 2011, http://www.euromonitor.com, accessed November 2011.
42 “Tea in India,” Euromonitor International.
43 “Tea in India,” Euromonitor International.
44 “Tea in India,” Euromonitor International.
45 “Smart Marketing = Doing Good,” Business Standard, August 1, 2011, via Factiva, accessed November 2011.
46 “Tea in Russia,” Euromonitor International, January 2011, http://www.euromonitor.com, accessed November 2011.
47 “Tea in Russia,” Euromonitor International.
Aut
horiz
ed fo
r us
e on
ly in
edu
catio
nal p
rogr
ams
at U
nive
rsity
of B
ritis
h C
olum
bia
until
Jul
28,
201
6.
Use
out
side
thes
e pa
ram
eter
s is
a c
opyr
ight
vio
latio
n.


![Unilever and tea sustainability [PRESENTER’S NAME], [TITLE], UNILEVER [COUNTRY]](https://static.fdocuments.us/doc/165x107/56649e4c5503460f94b41ad7/unilever-and-tea-sustainability-presenters-name-title-unilever-country.jpg)