SUSTAINABLE REGIONAL DEVELOPMENT OF SEBUKU … · SUSTAINABLE REGIONAL DEVELOPMENT OF SEBUKU STRAIT...
14
May 2015. Vol. 5, No03 ISSN 2307-227X International Journal of Research In Social Sciences © 2013-2015 IJRSS & K.A.J. All rights reserved www.ijsk.org/ijrss 19 SUSTAINABLE REGIONAL DEVELOPMENT OF SEBUKU STRAIT AT KOTABARU REGENCY, SOUTH KALIMANTAN AMARULLAH 1 , SETIA HADI 2 , TRIDOYO KUSUMASTANTO 3 , ACHMAD FAHRUDIN 4 1) PhD Student, Regional and Rural Development Planning Science, Bogor Agricultural University 2) Lecturer, Regional and Rural Development Planning Science, Bogor Agricultural University 3) Professor, Ocean Economics Policy, Bogor Agricultural University 4) Lecturer, Coastal and Marine Resources Management, Bogor Agricultural University E-mail: 1 [email protected], 2 [email protected], 3 [email protected], 4 [email protected] ABSTRACT Regional development at Sebuku Strait through the utilization of existing potential, which is productive coastal resources of renewable resource, non-renewable resource or environment services, is expected to refer to the principle of sustainable development. This research aims to find out the status of sustainability index of Sebuku Strait. Sustainability analysis on Sebuku Strait area is using Multi Dimentional Scalling (MDS) method adopted from Rapfish (Rapid Appraisal of Fisheries) or in this research it is called Rap-Sebuku. Rap-Sebuku is a sustainability estimation technique on five dimensions with attributes that are easy to be valuated based on time and cost consideration and applied in various multidiscipline valuation aspects. Indicators representing sustainable regional development consist of five dimensions: ecology, economy, social, technology and institution. Result of valuation on the weight of interest level for every dimension on the performance of Sebuku Strait area shows that the weight of each dimensions are as follow: 45.55 for ecological dimension, 48.20 for economic dimension, 53.08 for social dimension, 53.92 for technological dimension and 50.49 institutional dimension. Based on the weight of five dimensions of regional development at Sebuku Strait in average their value index is in 50.248. It means that Sebuku Strait index is in status of fairly sustainable based on the sustainability scale of 0-100. Based on the existing condition, Sebuku Strait area is fairly sustainable with seventeen sensitive attributes having influence on sustainability index value. To enhance the status in the future, a comprehensive improvement should be conducted on sensitive attributes. The sustainability is expected to follow the type of condition and trend indicators describing linier tendency of resource development to the optimum limit. A scenario strategy could be used to enhance the current sustainability status is moderate scenario (scenario 2), which is a scenario considering budget, time and human resources with sustainability index of 7.362 and conducting improvement around 53.9% in sensitive attributes influencing the enhancement of sustainability status of the area. Key Words: regional development, renewable resource, non-renewable resource, environmental services and sustainability 1. INTRODUCTION The important implication of the increasing in economic activities volume was more utilization of natural resources and environment. As already known, natural and environmental aspect is the important factor to achieve economic growth and sustainable development. An overwhelming utilization of natural resources for economic activities could create detrimental negative externality in regional development context (Mukhlis, 2009). Meanwhile, Sustainability has evolved as the principles and processes that integrate socio-economic development with environmental management and conservation and supported by institutional reform. (Allahyari, 2010). Therefore, the need to reform the old development paradigm to a new paradigm by integrating all dimensions of development so as to support sustainable development (Tajerin, 2009) Sustainable development is a development process optimizing the sustainable utilization of natural and human resources by harmonizing human activities based on the ability of the supporting natural resources in land, ocean and air areas as a unity through rational and wise management (Sugandhy and Hakim, 2009). The concept is in accordance with a concept of sustainable development that combining environmental (natural capital), social (social capital) and economic (man-made capital) aspects (Nugrogo and Dahuri, 2012). Sustainable development assures present and future
Transcript of SUSTAINABLE REGIONAL DEVELOPMENT OF SEBUKU … · SUSTAINABLE REGIONAL DEVELOPMENT OF SEBUKU STRAIT...

May 2015. Vol. 5, No03 ISSN 2307-227X
International Journal of Research In Social Sciences © 2013-2015 IJRSS & K.A.J. All rights reserved www.ijsk.org/ijrss
19
SUSTAINABLE REGIONAL DEVELOPMENT
OF SEBUKU STRAIT AT KOTABARU REGENCY,
SOUTH KALIMANTAN
AMARULLAH1, SETIA HADI
2, TRIDOYO KUSUMASTANTO
3, ACHMAD FAHRUDIN
4
1) PhD Student, Regional and Rural Development Planning Science, Bogor Agricultural University 2) Lecturer, Regional and Rural Development Planning Science, Bogor Agricultural University
3) Professor, Ocean Economics Policy, Bogor Agricultural University 4) Lecturer, Coastal and Marine Resources Management, Bogor Agricultural University
E-mail: [email protected],
ABSTRACT
Regional development at Sebuku Strait through the utilization of existing potential, which is productive
coastal resources of renewable resource, non-renewable resource or environment services, is expected to refer to
the principle of sustainable development. This research aims to find out the status of sustainability index of Sebuku
Strait. Sustainability analysis on Sebuku Strait area is using Multi Dimentional Scalling (MDS) method adopted
from Rapfish (Rapid Appraisal of Fisheries) or in this research it is called Rap-Sebuku. Rap-Sebuku is a
sustainability estimation technique on five dimensions with attributes that are easy to be valuated based on time and
cost consideration and applied in various multidiscipline valuation aspects. Indicators representing sustainable
regional development consist of five dimensions: ecology, economy, social, technology and institution. Result of
valuation on the weight of interest level for every dimension on the performance of Sebuku Strait area shows that the
weight of each dimensions are as follow: 45.55 for ecological dimension, 48.20 for economic dimension, 53.08 for
social dimension, 53.92 for technological dimension and 50.49 institutional dimension. Based on the weight of five
dimensions of regional development at Sebuku Strait in average their value index is in 50.248. It means that Sebuku
Strait index is in status of fairly sustainable based on the sustainability scale of 0-100. Based on the existing
condition, Sebuku Strait area is fairly sustainable with seventeen sensitive attributes having influence on
sustainability index value. To enhance the status in the future, a comprehensive improvement should be conducted
on sensitive attributes. The sustainability is expected to follow the type of condition and trend indicators describing
linier tendency of resource development to the optimum limit. A scenario strategy could be used to enhance the
current sustainability status is moderate scenario (scenario 2), which is a scenario considering budget, time and
human resources with sustainability index of 7.362 and conducting improvement around 53.9% in sensitive
attributes influencing the enhancement of sustainability status of the area.
Key Words: regional development, renewable resource, non-renewable resource, environmental services and
sustainability
1. INTRODUCTION
The important implication of the increasing in economic
activities volume was more utilization of natural
resources and environment. As already known, natural
and environmental aspect is the important factor to
achieve economic growth and sustainable development.
An overwhelming utilization of natural resources for
economic activities could create detrimental negative
externality in regional development context (Mukhlis,
2009). Meanwhile, Sustainability has evolved as the
principles and processes that integrate socio-economic
development with environmental management and
conservation and supported by institutional reform.
(Allahyari, 2010). Therefore, the need to reform the old
development paradigm to a new paradigm by integrating
all dimensions of development so as to support
sustainable development (Tajerin, 2009)
Sustainable development is a development process
optimizing the sustainable utilization of natural and
human resources by harmonizing human activities based
on the ability of the supporting natural resources in land,
ocean and air areas as a unity through rational and wise
management (Sugandhy and Hakim, 2009). The concept
is in accordance with a concept of sustainable
development that combining environmental (natural
capital), social (social capital) and economic (man-made
capital) aspects (Nugrogo and Dahuri, 2012).
Sustainable development assures present and future

May 2015. Vol. 5, No03 ISSN 2307-227X
International Journal of Research In Social Sciences © 2013-2015 IJRSS & K.A.J. All rights reserved www.ijsk.org/ijrss
20
generation to have the same right for nature and its
content (Subrada and Nadra, 2006). According to Lim
(1998) and Goodland (1995), sustainable development
concept has four dimensions: ecology, social-economy-
culture, social politic and law and institution to solve
problems in coastal areas.
Therefore, the purpose of economic and social
development should be conducted in sustainable way
(Fauzi and Octavianus, 2014). The success of
sustainable development should be compatible with
legal / regulation situation and political education,
economy, social, culture, institutions, technology and
environment (Kaklauskas et al, 2009). However,
sustainable development tends to be seen in long term,
thus it needs monitoring and implementation evaluation
to direct it to the right process (Rozema and Martens,
2010). Pezzey (1992) saw sustainability in different
side, which is from static and dynamic definitions.
Static sustainability is the use of renewed natural
resources through constant technological rate. Dynamic
sustainability, on the other hand, is the use of non-
renewed resources with changing technological level.
However, the sustainability of resources utilization is
determined by the utilization level of the resources that
is not exceeding the carrying capacity Manafi etc,
2009).
One of important areas to be developed in sustainable
way is coastal area. The characteristics and natural
coastal and marine ecosystems that are ecologically
interlinked with each other requires that the
management of coastal and ocean resources in an
optimal and sustainable can only be realized through an
integrated approach and holostik (Lekipiouw, 2010).
Therefore, it is important for resources manager who
work in the coastal area to consider the impact of
change caused by the use of resources or exploitation on
the balance (Gunawan, 1998).
Integrated coastal management can be a useful
process to reconcile economic development and
conservation values. (Muir, 2002). The need for
Integrated Coastal Management Implementation which
is a development of coastal area management by
integrating the use of land and sea for environmental
interest and for people who use it (Havard et al, 1996).
The Integrated Coastal Management Implementation
will have significant impact and give contribution to the
management of coastal and sea areas in Indonesia
(Farhan and Lim, 2010).
The coastal zone has high population density
and it has increased conflict among coastal societies.
The conflict was due to the competition in space
utilization since coastal area is a strategic area with
utilization in environmental, economic and social
aspects. Therefore, solution for various problems is an
important consideration when forming policy for
sustainable development and the need for integrated and
coordinated management policies (Ramesh and Senthil,
2011). The process of Integrated Coastal Management
consists of three main components: coastal zone policy,
coastal development strategy and priority investment
program (Islam et al, 2009).
Coastal areas are rich in bio diversity thus it
needs to be arranged on sustainable policies,
implementation of space layout by considering
geographical condition, social-cultural such as
demographic and population distribution and other
potential and strategic aspects. Result from the
implementation of space layout is expected to be able to
achieve sustainable development by integrating
economic, social cultural, environmental and
developmental equity pillars (Marliana etc, 2014).
As a coastal area, the existence and function of
Sebuku Strait is very important. Sebuku Strait is a very
potential area and optimally untapped and is tended to
be left behind (poor area). Sebuku Strait area has
productive natural resources including renewable
resource especially fishery, non-renewable resource
especially coal deposit or environment services such as
marine tourism. Therefore, Sebuku Strait is the hope of
the society in fulfilling their future life needs.
In order to accelerate development in the area,
Kinnear and Odgen (2014) stated that regional
development is becoming important by paying attention
on and utilizing resources of the area through innovation
efforts on regional planning; thus, creating better socio-
culture, economic and environment. Moreover, since the
ecological and economic aspects are tended to be in
conflict; therefore, in order to maintain the sustainability
aspect a utilization plan is needed through adaptive
capacity of resources utilization system based on its
characteristic (Brunkhorst, 2005). Regional Develop-
ment referring to sustainable development principle
through the utilization of natural resources, then
resource management decisions should consider the
input, views and influence of various stakeholders
(Abubakar, 2010). Thereby, it is important to
understand that sustainability principle in utilizing
Sebuku Strait resources through integrated layout plan
will bring regularity in the implementation of
development.

May 2015. Vol. 5, No03 ISSN 2307-227X
International Journal of Research In Social Sciences © 2013-2015 IJRSS & K.A.J. All rights reserved www.ijsk.org/ijrss
21
2. RESEARCH METHODOLOGY
2.1. Research Location
Sebuku Strait is located between Laut Island
and Sebuku Island, Kotabaru Regency, South
Kalimantan (Figure 1).
Figure 1. Sebuku
Strait2.2. Analysis Used
Sustainability analysis of regional development
at Sebuku Strait area used Rap-Sebuku method. The
method is the development of Rapfish (Rapid Appraisal
of Fisheries) method. RAPFISH is a rapid appraisal
technique designed to allow an objective, transparent,
multi-disciplinary evaluation, but it is not intended to
replace conventional stock assessment for setting (
Pitcher , 1999). This dynamic and multi-criteria analysis
using Rapfish provides a useful tool. Firstly, it enables
an assessment of the effectiveness of fisheries
management. Secondly, the results provide information
to policy makers about the best policy options for the
sustainable management of fisheries in the future
(Murillas et al. / Fisheries 2008). Rapfish method was
developed by Pitcher et al. (1998) and continued to be
improved and initially applied to evaluate the
sustainability of catching fishery (Pitcher and Preikshot
2001; Kavanagh 2001; Alder et al. 2002; Fauzi and
Anna 2002 in Fauzi and Anna, 2005). Still irrelevance
uses RAPFISH analysis in Indonesia because the actual
data that describes the condition of the water
management area in Indonesia is still very minimal. On
the other hand the need for sustainable management of
the region increasingly urgent (Hartono et al, 2005).
Rap-Sebuku method is a sustainability estimation
technique with attributes that are easy to be valuated
based on time and cost and to be applied in various
multidiscipline valuation aspects. The method is also
able to show the current sustainaility level of Sebuku
Strait area based on development concept and various
resources utilization.
In short, Rap-Sebukum method and procedures
of MDS Rap-Sebuku analysis was conducted in the
following stages:
1. Determination of Research Study
The determination of research study in this
case was the study on the sustainability of regional
development at Sebuku Strait Area. The study tried to
find out the current status of the sustainability of
regional development at Sebuku Strait Area. The
sustainability status would then become the material to
give recommendation on sustainable regional
development.
2. Determination of Indicators for the Sustainability
of Regional Development
The indicators were indicators that representing
sustainable regional development consisting of five
dimensions: ecology, economy, social, technology and
institution.
3. Determination of Each Sustainable Attributes for
every Dimension
Attributes are chosen to refect sustainability
within each discipline, and although intended to remain
fixed for all analyses, may be refined or substituted as
Sebuku Strait, Kotabaru Regency, South Kalimantan
Research
Location

May 2015. Vol. 5, No03 ISSN 2307-227X
International Journal of Research In Social Sciences © 2013-2015 IJRSS & K.A.J. All rights reserved www.ijsk.org/ijrss
22
improved information becomes available. Ordinations
of sets of attributes are performed using multi-
dimensional scaling (MDS) followed by scalingand
rotation (Pitcher dan Preikshot, 2001).
Multidimensional scaling (MDS) is an exploratory data
analysis technique that can be used in testing the
hypothesized existence of particular dimensions or
structures within a data set. The use of MDS in data
analyses offers several advantages. Namely, MDS is an
extremely flexible technique, one that can model
non‐linear relationships and is not bound by the
numerous assumptions associated with general linear
models or even with factor analyses (Jaworska and
Anastasova, 2009).
To evaluate the sustainability status of a system
to be studied, preparation was needed on the appropriate
sustainable attributes. The general criteria for attribute
determination for each dimension was the easiness to
give objective score and having sustainable extreme
point that able to be stated in simple way as good or
bad. The attributes chosen in one dimension reflected
the sustainability from the dimension and could be
modified with other attributes if the information
available. Those attributes were referred to and
modified by Bintoro (2005), Sinaga (2010), Sujiman
(2010), Nur (2011) and Putera (2013) and additional
attributes based on research location.
- Ecological Dimension
The dimension is the reflection of environmental
quality and system order that support sustainable
regional development. The definition of the
dimension was explained in nine attributes.
Operationally, all attributes could describe the
ecological point of view of the condition of
Sebuku Strait area being analyzed.
- Economic Dimension
The dimension is the reflection of financial self
sufficiency and resources based utilization of the
area that able to increase regional prosperity and
income and in turn, could support sustainable
regional development. The definition of the theory
was explained in nine attributes. Operationally, all
attributes could describe the economic point of
view of the condition of Sebuku Strait area being
analyzed.
- Social Dimension
The dimension is the reflection of human social
system that supports sustainable regional
development. The definition of the dimension was
explained in nine attributes. Operationally, all
attributes could describe the social point of view of
the condition of Sebuku Strait area being analyzed.
- Technological Dimension
The dimension is the reflection of technological
system that supports sustainable regional
development. The definition of the dimension was
explained in five
attributes. Operationally, all attributes could
describe the technological point of view of the
condition of Sebuku Strait area being analyzed.
- Institutional Dimension
The dimension is the reflection of institutional
system that supports sustainable regional
development. The definition of the dimension was
explained in six attributes. Operationally, all
attributes could describe the institutional point of
view of the condition of Sebuku Strait area being
analyzed.
4. Determination of value and scoring for every
attributes
Value determination for every attribute was
based on the real condition at research location. Value
determination for every attribute was gained from
analysis result on those attributes by competent
respondents or respondents who know about research
location, such as resources user, government,
legislative, NGO or academic (higher education
institutions). Heersman et. al. (1999) stated that there
are 3 (three) options of value in every attributes: bad
was given value 0 (zero), middle value was given value
1 (one) and good was given value 2 (two). Every
attribute had one value. The value was the reflection of
the attribute condition. Criteria in determining value for
every attribute were based on scientific judgment.
5. Determination of Rap-Sebuku ordination for
every attribute
Rap-Sebuku (Multidimensional Scaling)
ordination was performed on all data from the attributes
considered in the research to determine one point
reflecting the position of sustainability of regional
development being studied toward two main reference
points, which were good and bad points. The ordination
was conducted after giving value to every indicator of
each dimension, determining main reference points of
horizontal direction (good and bad), determining other
main reference points of vertical direction and creating
useful additional reference points so that points studied
would not be out of the reference points. Through Rap-
Sebuku ordination, the position of sustainability point
was visualized in two dimensions (vertical and
horizontal axis). Through axis rotation method the
position of those points could be projected in horizontal
line where bad points were given with 0% value and

May 2015. Vol. 5, No03 ISSN 2307-227X
International Journal of Research In Social Sciences © 2013-2015 IJRSS & K.A.J. All rights reserved www.ijsk.org/ijrss
23
good points were given with 100% value. The position
of sustainability of the regional development studied
would be between those two points and its sustainability
index could be analyzed by observing the percentage
value of sustainability of regional development on the
horizontal line.
6. Determination of index and category of
sustainability status of regional development
The result of Rap-Sebuku ordination was a
sustainability index of regional development with range
of 0-100. The sustainability index of regional
development gained from the ordination was used to
find out the status of sustainability of regional
development.
The score of each attribute was analyzed in
multidimensional to determine one or few points
reflecting the position of sustainability of regional
development based on resources utilization at Sebuku
Strait, Kotabaru Regency. The scores of sustainability
index of every dimension is presented in Table 1.
Table 1. Index Value Scale and Category of Sustainability Status
Index Value Category
0 - 25 not sustainable
>25 - 50 less sustainable
>50 - 75 fairly sustainable
>75 - 100 sustainable Source : Sinaga (2008)
7. Monte Carlo and Leverage Analysis
Monte Carlo analysis is conducted to see the
stability of sustainability index of regional development
gained. Method used for Monte Carlo analysis is scatter
plot method that shows ordination of every dimension.
If the result shows an accumulate plot, the sustainability
index of the regional development is stable. On the
contrary, if the plot is scattered, the sustainability index
of the regional development is unstable. After
ordination and good and bad index of the regional
development was known, leverage analysis was
conducted from those attributes. Leverage analysis was
conducted to see what attribute that sensitive to give
contribution to the formation of sustainability index of
regional development. Leverage analysis was conducted
by observing any change on ordination if certain
attribute was removed from the analysis. All attributes
were successively removed from Rap-Sebuku
ordination. The influence of each attribute was seen
from root mean square (RMS) on its x-axis. If an
attribute was removed from Rap-Sebuku ordination and
it did not change the RMS value, the attribute was
considered insensitive in forming sustainability index of
regional development and conversely. Result of the
analysis was the value of change on RMS in every
attribute.
8. Preparation of recommendation on sustainable
regional development at Sebuku Strait
The preparation of recommendation on
sustainable regional development was based on the
result of leverage analysis. The result itself helped to see
what attributes that sensitive to contribute to the
formation of sustainability index of regional
development. The sensitive attributes would be a base to
make policy since they influenced the preparation of
sustainability index of regional development. Whereas,
insensitive attributes was ignored in making policy since
they have no influence on the formation of sustainability
index of regional development. Policies are made to
improve sensitive attributes that currently have bad
scores and to maintain those with good scores.
3. RESULT AND DISCUSSION
The determination of index and sustainability status
of Sebuku Strait in Kotabaru Regency is very important
in order to have detail picture on the existing condition.
Understanding on the existing condition and influential
factors will facilitate policies formation or program
planning. Result from attributes valuation conducted by
experts and other respondents showed that thirty eight
attributes or factors had mutual relevance relationship
that influenced every dimension of Sebuku Strait in
Kotabaru Regency consisted of: ecological, economic
and social dimensions were each influenced by nine
attributes, technological dimension was influenced by
five attributes and institutional dimension was
influenced by six attributes.
Result from index analysis and sustainability status
of every dimension of regional dimension at Sebuku
Strait conducted through Rap-Sebuku ordination
technique with MDS method is described as follow:

May 2015. Vol. 5, No03 ISSN 2307-227X
International Journal of Research In Social Sciences © 2013-2015 IJRSS & K.A.J. All rights reserved www.ijsk.org/ijrss
24
3.1. Sustainability Index and Status of Ecological
Dimension
Result from Rap-Sebuku ordination analysis on
nine attributes influencing the ecological dimension
showed that the sustainability index value of ecological
dimension was 45.55%. The value was in the interval of
25.00 – 50.00 of sustainability scale with status of less
sustainable as shown in Figure 2.
Figure 2. Sustainability index value and sustainability status of ecological dimension and sensitivity value of
ecological dimension attributes stated in the change of RMS of sustainability scale of 0-100
Result of leverage analysis on nine attributes of
ecological dimension showed three sensitive attributes:
1) arrangement of the region, 2) carrying capacity of the
region and 3) level of environmental damage as shown
in Figure 2.
3.2. Sustainability Index and Status of Economic
Dimension
Result from Rap-Sebuku ordination analysis on
nine attributes of economic dimension indicated that the
sustainability index value of economic dimension was
48.20 with category of less sustainable as presented in
Figure 3.
Leverage analysis on nine attributes of
economic dimension resulted in four sensitive attributes
on the sustainability of economic dimension: 1)
contribution to PAD (Regional Real Income) and PDRB
(Gross Domestic Regional Product); 2) society income,
3) access to resources and 4) local business
development as presented.
Figure 3. Sustainability index value and sustainability status of economic dimension and sensitivity value
of economic dimension attributes stated in the change of RMS of sustainability scale of 0-100

May 2015. Vol. 5, No03 ISSN 2307-227X
International Journal of Research In Social Sciences © 2013-2015 IJRSS & K.A.J. All rights reserved www.ijsk.org/ijrss
25
3.3. Sustainability Index and Status of Social
Dimension
Result from Rap-Sebuku ordination analysis on
nine attributes of social dimension indicated that the
value of sustainability index of social dimension was
53.08 with category of fairly sustainable as presented in
Figure 4.
Leverage analysis showed that from 9
attributes of economic dimension analyzed there were 4
attributes showing high sensitivity value on the
sustainability of social dimension: 1) level of education;
2) role of private sector, 3) potential of conflict and 4)
role of government as presented in Figure 5.
Potential of conflict was a serious threat for the
sustainability of strait area since it had detrimental
impact. On the other hand, the role of government and
private sector and participation from the society had
influence on sustainable management of strait area;
therefore they had impact on productivity of resources
at the strait area.
Figure 4. Sustainability index value and sustainability status of social dimension and sensitivity value of
social dimension attributes stated in the change of RMS of sustainability scale of 0-100
3.4. Sustainability Index and Status of Technological
Dimension
Current condition of technology had important
role in determining sustainability status of Sebuku Strait
area. Result from Rap-Sebuku ordination analysis
indicated that the value of sustainability index of
technological and infrastructure dimension was 53.93
with category of fairly sustainable as presented in
Figure 5. Result from leverage analysis showed that
from five attributes analyzed there were three attributes
showing high sensitivity: 1) technology of non-
renewable re-sources utilization, 2) technology of
renewable resources utilization and 3) port affairs
Figure 5. Sustainability index value and sustainability status of technological dimension and sensitivity value of
technological dimension attributes stated in the change of RMS of sustainability scale of 0-100

May 2015. Vol. 5, No03 ISSN 2307-227X
International Journal of Research In Social Sciences © 2013-2015 IJRSS & K.A.J. All rights reserved www.ijsk.org/ijrss
26
3.5. Sustainability Index and Status of Institutional
Dimension
Result from Rap-Sebuku ordination analysis on
six attributes of institutional dimension showed that the
value of sustainability index of policy and institutional
dimensions was 50.49 with category of fairly
sustainable as presented in Figure 6.
Result from leverage analysis showed that
from six attributes analyzed there were three attributes
showing high sensitivity: 1) technology of non-
renewable re-from institutional dimension: 1) resources
management planning; 2) resources management regime
and 3) availability and completeness of the rules.
Figure 6. Sustainability index value and sustainability status of institutional dimension and sensitivity value of
institutional dimension attributes stated in the change of RMS of sustainability scale of 0-100
3.6. Sustainability Index and Status of Multi-
Dimension
Sustainability index value and sustainability
status of five dimensions of regional development of the
strait is visualized in kite diagram as presented in Figure
7.
The result of weight evaluation of interest level
for each dimension on the performance of Sebuku Strait
area showed that the weight for each dimension is:
45.55 for ecology, 48.20 for economy, 53.08 for social,
53.92 for technology and 50.49 for institution. It can be
seen that, in average, the five dimensions of regional
development of Sebuku Strait were in 50.248 of index
value with sustainability scale of 0-100, thus the status
was fairly sustainable.
Figure 7. Kite diagram of multi-dimension sustainabi-
lity of regional developmet at Sebuku Strait
3.7. Stress Value and Coefficient of Determination
The accuracy of configuration of one point
reflecting the real data can be measured by observing
stress value from Rap-Sebuku ordination analysis on
every dimension analyzed. The ability of every attribute
to explain and give contribution to the sustainability of
studied system can be seen from its coefficient of
determination (R2) value. Stress value and coefficient of
determination of every dimension can be seen in Table
2.

May 2015. Vol. 5, No03 ISSN 2307-227X
International Journal of Research In Social Sciences © 2013-2015 IJRSS & K.A.J. All rights reserved www.ijsk.org/ijrss
27
Table 2. Stress Value and Coefficient of Determination of Multi-dimension
DIMENSION STRESS
VALUE
R2
Squared
Correlation=
(RSQ)
SUSTAINABILITY VALUE MONTECARLO
ECOLOGY 0,1408223 0,9502316 45,55 45,83
ECONOMY 0,1592253 0,9407296 48,20 48,17
SOCIAL 0,1363429 0,9437857 53,08 52,48
TECHNOLOGY 0,1482640 0,9291337 53,92 53,15
INSTITUTION 0,1529214 0,9427338 50,49 50,00
Average 0,14751518 0,941323 50,248 49,926
Source: Analysis Result, 2014
Table 2 shows that the average stress value of the
dimensions is 0.1475 and average R2 is 0.9413. In
sustainability, good stress value is < 0.25 (Malhotra,
2006) means goodness of fit in MDS stating that
attribute configuration could reflect its actual data.
Whereas R2 of 0.9413 shows that attribute or factor in
every dimension is able to explain and give
recommendation of 94.1323% to the sustainability of
system studied. According to Kavanagh (2001), good R2
value is >80% or close to 100%.
3.8. The influence of Error
Evaluation on the influence of random error
through Monte Carlo Analysis is aimed to find out: (a)
the influence of error in determining attribute score, (b)
the influence of scoring variation, (c) the stability of
repetitive MDS analysis process, (d) error in data entry
or missing data and (e) acceptable stress value, which is
< 20%. Result from Monte Carlo analysis and multi-
dimension stress value showed that there was no
significant difference on the value of sustainability
index from Rap-Sebuku and from Monte Carlo analysis
(stress value of 5%) both on distribution value and the
influence of error in level of 95%. It confirms that error
on scoring, the influence of score variation, stability of
repetitive MDS analysis process and error in data entry
or missing data had no significant influence on resulted
output.
3.9. Key Factors from MDS Analysis Result
Result from leverage (sensitivity) analysis in
MDS indicated that from 38 attributes analyzed, there
were seventeen sensitive attributes or factors influenced
the sustainability of regional development at Sebuku
Strait, consisted of ecological dimension with three
attributes, economic dimension with four attributes,
social dimension with four attributes, technological
dimension with three attributes and institutional
dimension with three attributes. Those seventeen
sensitive attributes were analyzed for the level of
interest among factors to regional development of
Sebuku Strait by using prospective analysis. Outputs
from prospective analysis were ranking and sector of
each attribute illustrated in four sectors/quadrants
diagram along with their coordinate. The diagram is
presented in Figure 8.
Source: Analysis Result, 2014
Figure 8. Level of Interest of Factors Influencing Regional Development of Sebuku Strait

May 2015. Vol. 5, No03 ISSN 2307-227X
International Journal of Research In Social Sciences © 2013-2015 IJRSS & K.A.J. All rights reserved www.ijsk.org/ijrss
28
According to Bourgeois and Jesus (2004),
determinant factors or driving variables located in the
first quadrant (1) consist of factors with strong influence
but less dependency. Factors in this quadrant are the
determinant or driving factors included in the strongest
factors category in the system studied. Quadrant two
(2), connecting factors (leverage variables), shows
factors with strong influence and dependency among
factors; therefore factors in this quadrant are considered
as strong factors or variables. Quadrant three (3),
dependent factors (output variables), represents output
factors with small influence but high dependency.
Whereas, factors in quadrant four (4) are called
independent factors (marginal variables), that are
marginal factors with less influence and low
dependency; therefore these factors are free in the
system.
Based on the distribution type of factors in
influence and dependency quadrant as seen on the
graph, type of distribution was accumulate from
quadrant one to quadrant three. According to Bourgeois
(2007) this type of distribution is an indication that the
system built is stable since it shows strong relationship
where driving variables strongly regulate output
variables. In addition, through this type, a strategic
scenario is easy and efficient to build. On the contrary,
distribution type that tends to accumulate in diagonal of
quadrant four to quadrant two shows that the system
built is unstable since most of variables resulted are
within the marginal variable; therefore, it is difficult to
build future strategic scenario.
3.10. Scenario Simulation of Management Model of
Sebuku Strait
Scenario of sustainable management of Sebuku
Strait was performed through prospective analysis to
predict possible future events based on goals to be
achieved. Prospective analysis was conducted in three
steps: (1) identification of future key factors, (2)
determination of strategic goals and main actors’
interest and (3) definition and description of future
evolution and determination of sustainable management
strategies of Sebuku Strait based on resources owned.
The determination of key factors in analysis
was conducted by combining sensitive key factors
influencing system performance resulted from
sustainability analysis and key factors resulted from
needs analysis. Based on the result of sustainability
analysis, there were seventeen sensitive attributes.
Various possibilities were formulated as follow: (1)
pessimistic scenario with improvement on attributes
around 24.9%; (2) moderate scenario with improvement
on attributes around 53.9% and (3) optimistic scenario
with improvement on attributes around 81.5%.
Pessimistic Scenario (Scenario 1)
In this scenario, improvement was done
effortless or based on cost efficiency by suppressing
cost as low as possible (50%). Improvement on key
attributes would change their score value. Further, Rap-
Sebuku analysis was conducted on some key attributes
that had changed in their score value to see the level of
improvement on sustainability index value of Sebuku
Strait. Level of change in index value based on Rap-
Sebuku analysis is presented in Table 3.
Table 3. Level of change in sustainability index value of scenario 1 (pessimistic)
No. Sustainability Dimension Value Index Value Index The
Difference Now Scenario 1
1 Ecology 45,55 59,87 14,32
2 Economy 48,20 60,97 12,77
3 Social 53,08 64,42 11,34
4 Technology 53,92 68,78 14,86
5 Institution 50,49 59,87 9,38
Multi-dimension 50,248 62,782 12,534
Source: Analysis Result, 2014
The above table shows increase in the value of
sustainability index in all dimensions. Almost all
dimension, including multi-dimension has sustainability
index value above 50%. However, in average, all
dimensions are generally in status of fairly sustainable
(64.172). It implies that Sebuku Strait condition was not
able to fully support sustainable development. It was
because increase in index value through improvement
on some attributes was not maximal. Based on index
value of scenario 1, a kite diagram was made from five
dimensions as shown in Figure 9.
May 2015. Vol. 5, No03 ISSN 2307-227X
International Journal of Research In Social Sciences © 2013-2015 IJRSS & K.A.J. All rights reserved www.ijsk.org/ijrss
29
Figure 9. Kite Diagram of Index of Scenario 1 (pessimistic)
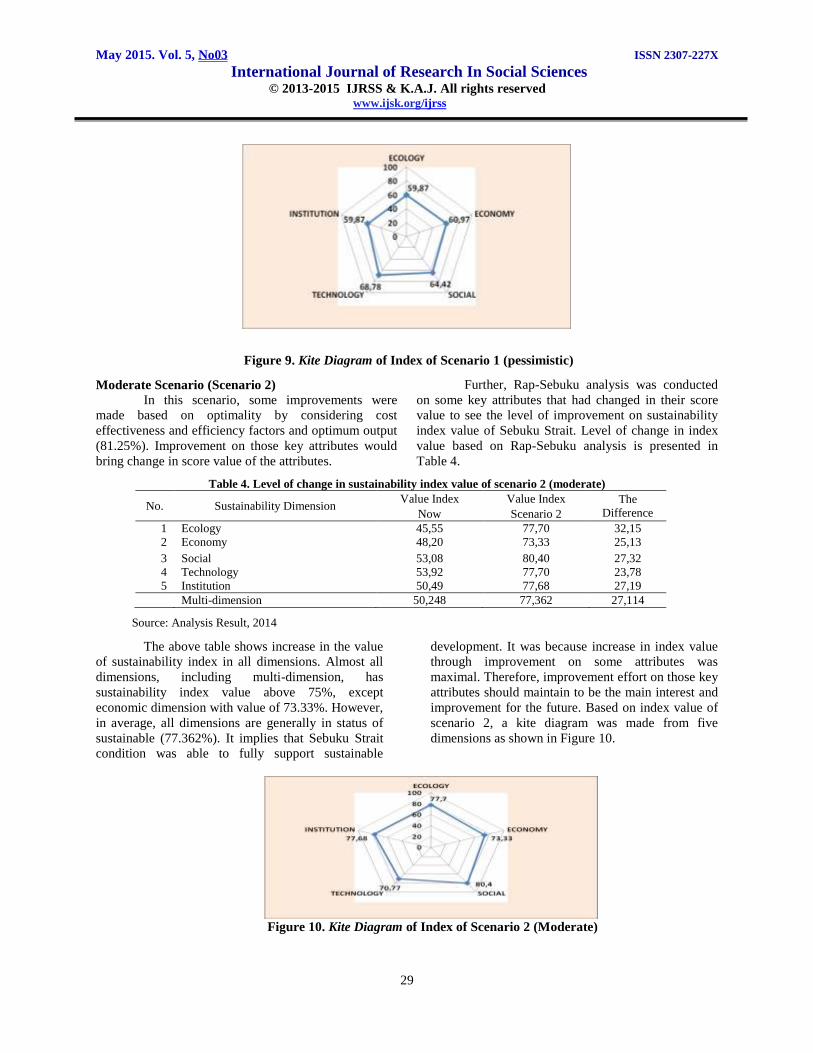
Moderate Scenario (Scenario 2)
In this scenario, some improvements were
made based on optimality by considering cost
effectiveness and efficiency factors and optimum output
(81.25%). Improvement on those key attributes would
bring change in score value of the attributes.
Further, Rap-Sebuku analysis was conducted
on some key attributes that had changed in their score
value to see the level of improvement on sustainability
index value of Sebuku Strait. Level of change in index
value based on Rap-Sebuku analysis is presented in
Table 4.
Table 4. Level of change in sustainability index value of scenario 2 (moderate)
No. Sustainability Dimension Value Index Value Index The
Difference Now Scenario 2
1 Ecology 45,55 77,70 32,15
2 Economy 48,20 73,33 25,13
3 Social 53,08 80,40 27,32
4 Technology 53,92 77,70 23,78
5 Institution 50,49 77,68 27,19
Multi-dimension 50,248 77,362 27,114
Source: Analysis Result, 2014
The above table shows increase in the value
of sustainability index in all dimensions. Almost all
dimensions, including multi-dimension, has
sustainability index value above 75%, except
economic dimension with value of 73.33%. However,
in average, all dimensions are generally in status of
sustainable (77.362%). It implies that Sebuku Strait
condition was able to fully support sustainable
development. It was because increase in index value
through improvement on some attributes was
maximal. Therefore, improvement effort on those key
attributes should maintain to be the main interest and
improvement for the future. Based on index value of
scenario 2, a kite diagram was made from five
dimensions as shown in Figure 10.
Figure 10. Kite Diagram of Index of Scenario 2 (Moderate)
May 2015. Vol. 5, No03 ISSN 2307-227X
International Journal of Research In Social Sciences © 2013-2015 IJRSS & K.A.J. All rights reserved www.ijsk.org/ijrss
30
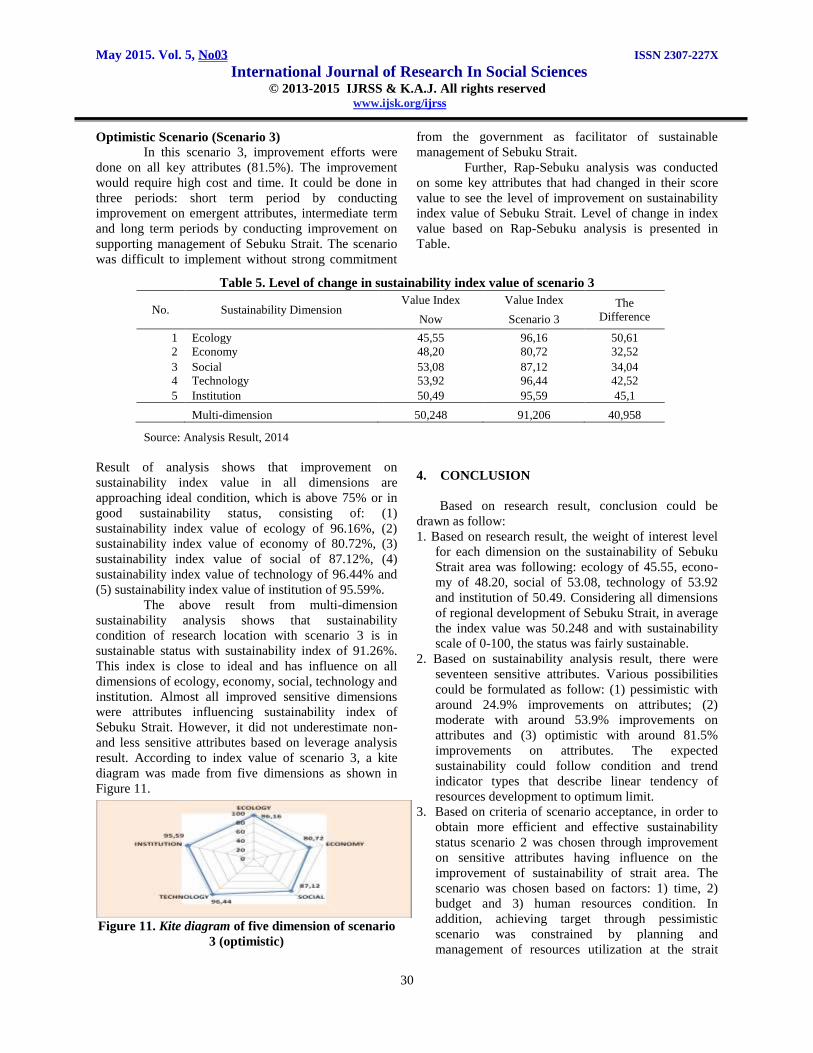
Optimistic Scenario (Scenario 3)
In this scenario 3, improvement efforts were
done on all key attributes (81.5%). The improvement
would require high cost and time. It could be done in
three periods: short term period by conducting
improvement on emergent attributes, intermediate term
and long term periods by conducting improvement on
supporting management of Sebuku Strait. The scenario
was difficult to implement without strong commitment
from the government as facilitator of sustainable
management of Sebuku Strait.
Further, Rap-Sebuku analysis was conducted
on some key attributes that had changed in their score
value to see the level of improvement on sustainability
index value of Sebuku Strait. Level of change in index
value based on Rap-Sebuku analysis is presented in
Table.
Table 5. Level of change in sustainability index value of scenario 3
No. Sustainability Dimension Value Index Value Index The
Difference Now Scenario 3
1 Ecology 45,55 96,16 50,61
2 Economy 48,20 80,72 32,52
3 Social 53,08 87,12 34,04
4 Technology 53,92 96,44 42,52
5 Institution 50,49 95,59 45,1
Multi-dimension 50,248 91,206 40,958
Source: Analysis Result, 2014
Result of analysis shows that improvement on
sustainability index value in all dimensions are
approaching ideal condition, which is above 75% or in
good sustainability status, consisting of: (1)
sustainability index value of ecology of 96.16%, (2)
sustainability index value of economy of 80.72%, (3)
sustainability index value of social of 87.12%, (4)
sustainability index value of technology of 96.44% and
(5) sustainability index value of institution of 95.59%.
The above result from multi-dimension
sustainability analysis shows that sustainability
condition of research location with scenario 3 is in
sustainable status with sustainability index of 91.26%.
This index is close to ideal and has influence on all
dimensions of ecology, economy, social, technology and
institution. Almost all improved sensitive dimensions
were attributes influencing sustainability index of
Sebuku Strait. However, it did not underestimate non-
and less sensitive attributes based on leverage analysis
result. According to index value of scenario 3, a kite
diagram was made from five dimensions as shown in
Figure 11.
Figure 11. Kite diagram of five dimension of scenario
3 (optimistic)
4. CONCLUSION
Based on research result, conclusion could be
drawn as follow:
1. Based on research result, the weight of interest level
for each dimension on the sustainability of Sebuku
Strait area was following: ecology of 45.55, econo-
my of 48.20, social of 53.08, technology of 53.92
and institution of 50.49. Considering all dimensions
of regional development of Sebuku Strait, in average
the index value was 50.248 and with sustainability
scale of 0-100, the status was fairly sustainable.
2. Based on sustainability analysis result, there were
seventeen sensitive attributes. Various possibilities
could be formulated as follow: (1) pessimistic with
around 24.9% improvements on attributes; (2)
moderate with around 53.9% improvements on
attributes and (3) optimistic with around 81.5%
improvements on attributes. The expected
sustainability could follow condition and trend
indicator types that describe linear tendency of
resources development to optimum limit.
3. Based on criteria of scenario acceptance, in order to
obtain more efficient and effective sustainability
status scenario 2 was chosen through improvement
on sensitive attributes having influence on the
improvement of sustainability of strait area. The
scenario was chosen based on factors: 1) time, 2)
budget and 3) human resources condition. In
addition, achieving target through pessimistic
scenario was constrained by planning and
management of resources utilization at the strait

May 2015. Vol. 5, No03 ISSN 2307-227X
International Journal of Research In Social Sciences © 2013-2015 IJRSS & K.A.J. All rights reserved www.ijsk.org/ijrss
31
since the improvement on attributes was done
effortless. Whereas, achieving target through
optimistic scenario was constrained by cost
effectiveness and efficiency due to the large number
of attributes to be improved.
REFERENCES
1. Abubakar. 2010. Sustainable Development
Strategy for the Management of Marine
Protected Areas Gili Sulat: An Approach
Stakeholder. Faculty of Agriculture Unram
Mataram. Jurnal Bumi Lestari, Vol. 10 No. 2
(2010) Hal : 256-262
2. Alder, J. Pitcher, T.J., Preikshot, D., Kaschner, K.
and Ferriss, B. 2000 . Rapfish estimates - how
good is good? Pages 136 - 182 in Pauly, D. and
Pitcher T.J. (eds) Methods for assessing the
impact of fisheries on marine ecosystems of the
North Atlantic. Fisheries Centre Research Reports
8(2): 195pp.
3. Alder, J., Zeller, D., Pitcher, T.J. and Sumaila,
U.R., 2002. A Method for Evaluating Marine
Protected Area Management. Coastal
Management. 30: 121-131.
4. Allahyari, M.S. (2010) Fisheries Sustainability
Assessment in Guilan province, Iran. Journal of
Food, Agriculture & Environment 8(3&4): 1300-
1304.
5. Bintoro, G. 2005. Sustainable Utilization of
Tembang Fish (Sardinella imbriata
Valenciennes) Resources at Madura Strait..
Graduate School IPB, Bogor.
6. Brunckhorst, D.J., 2005. Integration Research
for Shaping Sustainable Regional Landscapes.
University of New England, Australia. Journal
of Reserarch Practice. Vol. 1, Issue 2, Article
M7, H.1-24.
7. Fauzi, A. dan Anna S., 2005. Fishery and
Marine Resources Modeling for Policy
Analysis. PT. Gramedia Pustaka Utama,
Jakarta.
8. Farhan, A.R. and Lim, S. 2010. Integrated
Coastal Zone Management Towards Indonesia
Global Ocean Observing System (Ina-Goos):
Review And Recommendation. Ocean & Coastal
Management Elsevier Journal. Ocean & Coastal
Management 53 (2010) 421-427.
9. Fauzi A, Oxtavianus A. 2014. The
Measurement of Sustainable Development
in Indonesia. Journal of Development
Economics. Volume 15, Nomor 1, Juni 2014,
p. 68-83
10. Goodland, R. 1995. The Concept of
Environmental Sustainability. Annual Review of
Ecology and Systematics. JSTOR, Volume 26, 1-
24.
11. Gunawan, I. 1998. Typical Geographic
Information System (GIS) Applications For
Coastal Resources Management in Indonesia.
Journal of Coastal and Marine Resource
Management Indonesia, Volume 1 No. 1 1998.
12. Havard, M.S.C. et al.1996. Coastal Zone
Management in Wales: The Information Gaps.
Journal of Coastal Conservation 2: 175-178,
1996.
13. Hartono, et al. (2005) Development of Rapid
Appraisal Techniques for Fisheries (RAPFISH)
for Determining Performance Indicators
Sustainable fisheries in Indonesia. Fisheries
Economic Bulletin 6(1): 65-76.
14. Islam, K.Z. et al. 2009. Successful Integrated
Coastal Zone Management (ICZM) Program
Model of a Developing Country (Xiamen, China)
Implementation in Bangladesh Perspective.
Journal of Wetlands Ecology, (2009) vol. 2, pp
35-41
15. Kaklauskas, A. et al. 2009. Conceptual
modelling of sustainable Vilnius development.
Technological and economic development Baltic
Journal on Sustainability. 2009 15(1): 154–177.
16. Kavanagh, P and Pitcher, T.J. 2004. Implementing
Microsoft Excel Software for rapfish: A
Technique for The Rapid Appraisal of Fisheries
Status. Fisheries Centre Research Reports 2004
Volume 12 Number 2. Fisheries Centre,
University of British Columbia, Canada
17. Kinnear, S. dan Ogden, I. 2014. Planning the
innovation agenda for sustainable development
in resource regions: A Central Queensland
case study. CQ University and Innovative
Region Centre Australia. Journal of Resource
Policy 39 (2014) 42–53
18. Manafi, M. R, Fahrudin A., Bengen, D.G
and Mennofatria Boer. 2009. The
Application of Carrying Capacity Concept for
Sustainable Development in Small Island
(Case Study Kaledupa Islands, Distict
Wakatobi. Journal of Aquatic Sciences and
Fisheries Indonesia, Juni 2009, Jilid 16, No.
1: 63-71.
19. Lim. 1998. Carrying capacity Assessment of
Pulau Payar Marine Park, Malaysia . Bay of
Bengal Programme. Madras. 129 p.
20. Muir, M.A.K. 2002. Integrated Coastal and
Marine Management in Northern Regions:
Reconciling Economic Development and
Conservation. Journal of Coastal Research SI 36

May 2015. Vol. 5, No03 ISSN 2307-227X
International Journal of Research In Social Sciences © 2013-2015 IJRSS & K.A.J. All rights reserved www.ijsk.org/ijrss
32
522-530 (ICS 2002 Proceedings) Northern Ireland
ISSN 0749-0208.
21. Murillas, A., R. Prellezo, E. Garmendia, M.
Escapa, C. Gallastegui and A. Ansuategi (2008)
Multidimensional and intertemporal sustainability
assessment: A case study of the Basque trawl
fisheries. Fisheries Research 91(2-3): 222-238.
22. Mukhlis, I. 2009. Externalities, Economic
Growth and Sustainable Development in
Theoretical Perspective. Journal of Business
Economics, Tahun 14, Nomor 3, Nopember
2009.
23. Marliana, D. et al., 2014. Sustainable
Development-Based Regional Policy of
Coastal Area at Sampang Regency. FIA
Unibraw Malang. Jurnal Administrasi Publik
(JAP), Vol. 1. No. 3. H. 80-86.
24. Natalia Jaworska, N. and Anastasova, A.C. 2009.
A Review of Multidimensional Scaling (MDS)
and its Utility in Various Psychological Domains.
Tutorials in Quantitative Methods for Psychology
2009, Vol. 5(1), p. 1‐10.
25. Nur, A.I., 2011. The Sustainability of Skipjack
Tuna (Kasuwonus pelamis) Fishery Resources
at Indonesian Exclusive Economic Zone
Waters of Southern Indies Ocean East Java.
Graduate School IPB, Bogor.
26. Nugroho, I. dan Dahuri, R., 2012. Regional
Development: Economic, Social and
Environmental Perspectives. LP3ES. Jakarta.
27. Pezzey, J. 1992. Sustainable Development
Concepts An Economic Analysis. World Bank
EnvironmentPaper Number 2, The World
BankWashington, D.C. November 1992.
28. Putera, F.H.A., 2013. Study on the
Sustainability of Coastal Tourism Management
at Pasir Putih Bira Beach, Bulukumba, South
Sulawesi. Graduate School IPB, Bogor.
29. Pitcher, T.J and Preikshot, D. 2001. RAPFISH:
A Rapid Appraisal Technique To Evaluate The
Sustainability Status Of Fisheries. Fisheries
Research Elsevier Journal . Fisheries Research
49 (2001) 255-270.
30. Pitcher, T.J. 1999. Rapfish, A Rapid Appraisal
Technique For Fisheries, And Its Application To
The Code Of Conduct For Responsible
Fisheries. Food And Agriculture Organization
Of The United Nations Rome, 1999.
31. Rozema, V.Z. and Martens, P., 2010. An
adaptive indicator framework for monitoring
regional sustainable development : a case
study of the INSURE project in Limburg, The
Netherlands. Sustainability : Science, Practice
and Policy. Spring 2010 Vol.6 Issue 1.
http://ejurnal.nbii.org.
32. Ramesh, D.A. and Senthil, A. 2011. Methodology
of Integrated Coastal Zone Management Plan
Preparation—Case Study of Andaman Islands,
India. Journal of Environmental Protection, 2011,
2, 750-760.
33. Sinaga, N., 2010. Policy Design and Strategy of
Sustainable Management of Post-Coal Mine Area
at Kutai Kertanegara Regency, Dissertation.
Graduate School IPB.
34. Sujiman, 2010. Model and Strategy of Sustainable
Management of Post-Coal Mine Area at Kutai
Kertanegara Regency, Dissertation.
Pascasarjana,IPB.
35. Sugandhy, A., Hakim, R., 2009. Envionmentally
Sound Sustainable Development. Penerbit Bumi
Aksara.Jakarta.
36. Subadra, I.N, Nadra, N.M. 2006. Impact of
Economic, socio-Cultural, Environmental and
Rural Development of Tourism In
Jatiluwih-Tabanan.jurnal tourism management,
47 juni 2006, Volume 5, No. 1.
37. Stanis, S. et al. 2007. Coastal and Marine
Resources Management Empowerment Through
Local Wisdom in the district of East Nusa
Tenggara province. Journal of sea sand, Vol.71
2, No.2, Januari 2007 : 67-82.
38. Sherlock H. Lekipiouw, S.H. 2010. Model
Penataan Ruang Laut Daerah Berdasarkan Inte-
grated Coastal Management Sebagai Acuan
Penyusunan Penataan Ruang Laut Pada Wilayah
Kepulauan. Jurnal Sasi Vol. 16 No. 4 Bulan
Oktober – Desember 2010.
39. Tajerin. 2009. Role of Political Economy of
Coastal and Marine Resources Management
Integrated in Promoting Sustainable
Development. Journal of Mangrove and Coastal
IX (1), Februari 2009: 18-28 ISSN: 1411-067