Sustainable Intensification of Cereal-based Farming Systems in the Sudano-Sahelian Zone of West...
29
Sustainable Intensification of Cereal-based Farming Systems in the Sudano-Sahelian Zone of West Africa: Project Design Workshop, Tamale, Ghana, 9-12 January 2012
-
Upload
lydia-fowler -
Category
Documents
-
view
220 -
download
2
Transcript of Sustainable Intensification of Cereal-based Farming Systems in the Sudano-Sahelian Zone of West...

Sustainable Intensification of Cereal-based Farming Systems in the Sudano-Sahelian Zone of West Africa: Project Design Workshop, Tamale, Ghana, 9-12 January 2012

Overview• Broad M&E Guiding Principles• Recap on SI Program Targeting• Monitoring and Reporting Scales • Evaluation Approaches• Site Selection• M&E Data and Analysis Platform• Issues/Questions

M&E Guiding Principles• FtF Compliance: Conform to the overall FtF core indicator guidelines• Open-access platform: Maintain a transparent, open-access M&E
data management and analysis platform to serve the needs of SI stakeholders
• Multi-scale, Multi-site reporting: Meet broad stakeholder needs and support multi-scale/multi-site M&E through;– System and sub-system reports: e.g. rice, maize, sorghum-based for WA– Site-reports: for each of the three SI system sites– Country reports: Breakout of site reports to serve national stakeholder needs– SSA-reports: cross-system reporting and SI-wide “roll-up” of indicators across
the 3 “sites” (Sudano-Sahelian zone, Ethiopian Highlands, Eastern and Southern Africa)
• Backward & forward assessment: Provide monitoring reports and ex ante evaluations (projections) of key M&E indicators, updated annually
• Scaling-up and out assessments (evaluate spillover potential/ options): Examine the potential productivity and sustainability consequences of a range of adoption and geographic/system spillover pathways beyond actual implementation sites.

HH Attributes
Urban/Rural
Income/Exp
ConsumptionPatterns
Production SystemsInputs, Tech Adoption
MarketParticipation
Policy/Market Context & ImpactUsually geo-political/admin units (policies, institutions) as the unifying concept and object of analysis.Commodity focus
Fixed Geographies of Analysis
e.g., IMPACT/WATER,GTAP & derivatives
Flexible Geographies of Analysis
e.g., DREAM,MM models
MACRO
Household/Community CharacterizationCross-country data harmonization challenges. Livelihoods, Assets, Gender & Access Foci
MICRO
Production/Market Context & ImpactGridcells/pixels as units of analysis.Natural/Human landscape patterns as well as resource and product flows are unifying concepts and objects of analysis.Systems focus.
MESO
Production Systems
Ecosystems & ES Services
Infrastructure/Market Access
Demographics/Human Welfare
Linking Data & Analysis Across Scales

SSA Farming Systems
Source: Dixon el al. 2001

Selecting SIFocus Areas
PopulationDensity
GRUMP 2005
Selecting SIFocus Areas
Poverty
Wood et al 2009(now replaced)

Selecting SIFocus Areas
Cropland
Ramankutty et al(2008)

Selecting SIFocus Areas
Time to >50K town
HarvestChoiceGuo 2010

CAADP:National
InvestmentPlans (NIPs)
CAADP:National
InvestmentPlans (NIPs)
CAADP:National
InvestmentPlans (NIPs)
CAADP:National
InvestmentPlans (NIPs)
CAADP:National
InvestmentPlans (NIPs)
SSA Research Programs
(CGIAR CRPs,SROs, NARS)
Identify and inventorize target;(1) geographies/agroecologies(2) farming systems(3) value chains
Using standardized descriptors
DEMANDCountries
(NIP needs described in terms of standard AES/Value chain components)
SUPPLYAgroecosystems/
Value chains(entry points for existing
technologies & knowledge & pipeline R&D)
Articulate, Review,and Finalize
Coherent RegionalAgroecosystem/
Value ChainSpatial Framework
SupplyGaps?
IntegratedM&E
IndicatorDatabase
Coordination/Institutional/Investment Needs and Options
Diagnosis: Intensification ChallengesIdentify challenges and potential intensification opportunities by system
Role of Farming Systems in Bridging CAADP-CGIAR Agendas(Dublin Process Activity)
Draft Conceptual Framework, November 2011
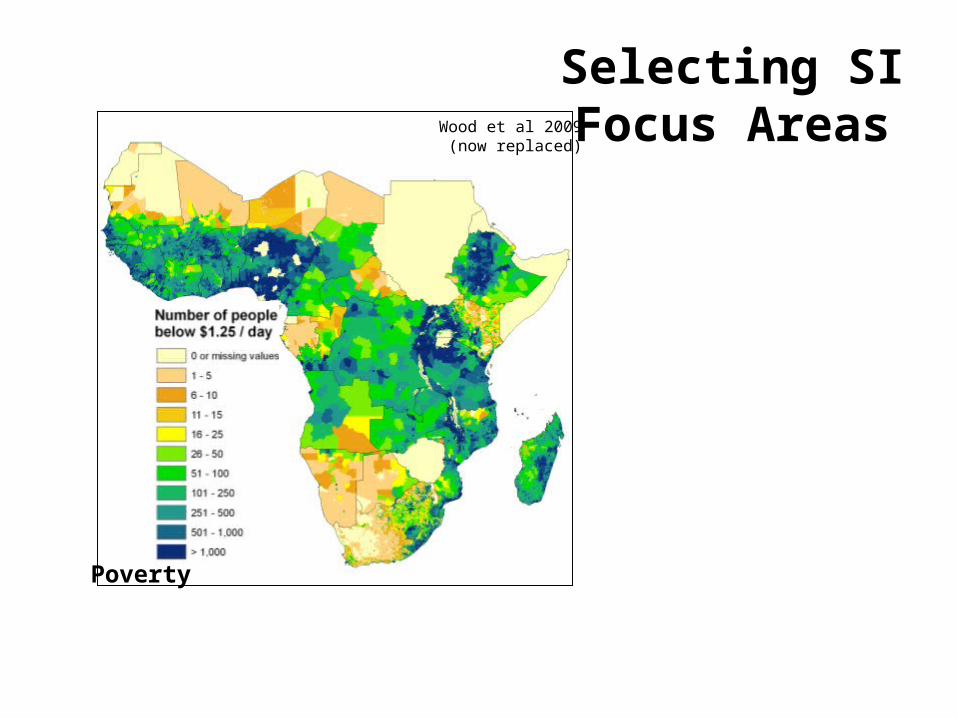
Eastern & Southern Africa Maize-based Systems
Ethiopian HighlandsSudano-Sahelian Zone
Systems
Sub-Systems
Country A
Country B
+
+ +++
+
ActionSites
6. Country to country barriers to spillover
SI Monitoring and Reporting Scales
Fostering Spillover by Design
1. Implementation sites to local sub-systems
2. Implementation to non-implementation sub-systems
3. Sub-systems to (sub-) systems
4. Systems to systems5. Sites to sites
& Spillover Needs& Spillover Needs

Evaluation Approaches•Delineation and characterization (typologies?) of target farming systems: Relies on the fusion of spatially-explicit agricultural production, environmental, and farm/household data, and a conceptual model of impact pathways/goals.•Maintain Technology/Intervention Inventory: A characterized inventory of the nature of the individual and integrated farming system components whose adoption and impacts is being evaluated. Includes characterization of spillover potential•Recursive Modeling of Projected Change (with and w/o interventions): e.g., productivity and income change, land, labour (sex differentiated) and water use•Attribution assessment: Additional to the ability to measure and model change in indicators is the need (with additional information/assumptions) to assess attribution of changes to an agreed level of specificity.

2015 20302011
2011 2013 2030
20142011 2030
Annual Evaluation of Past and Projected Impacts
Increase in productivity or revenue

Av. Daily Temperature(mean 1960-2000)
Northern GhanaSouthern Mali
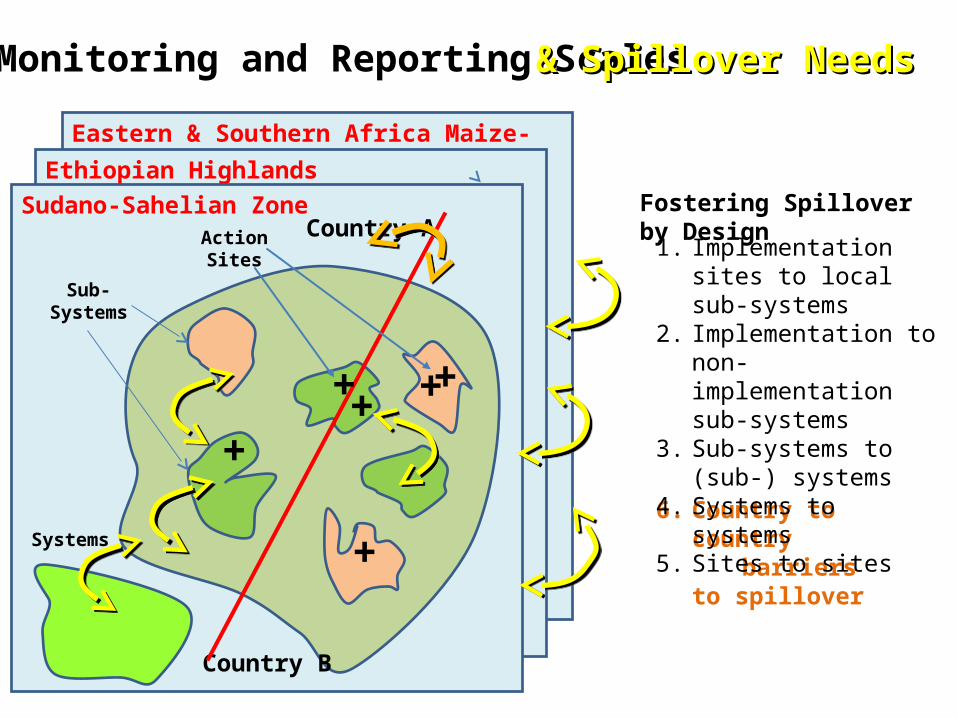
WorldClim 2005
Rainfall(mean 1960-2000)
Northern GhanaSouthern Mali
WorldClim 2005

NDVI(mean 2001-2010)
Northern GhanaSouthern Mali

NDVI Variability
Northern GhanaSouthern Mali

Population Density (2005)
Northern GhanaSouthern Mali
AfriPop 2010
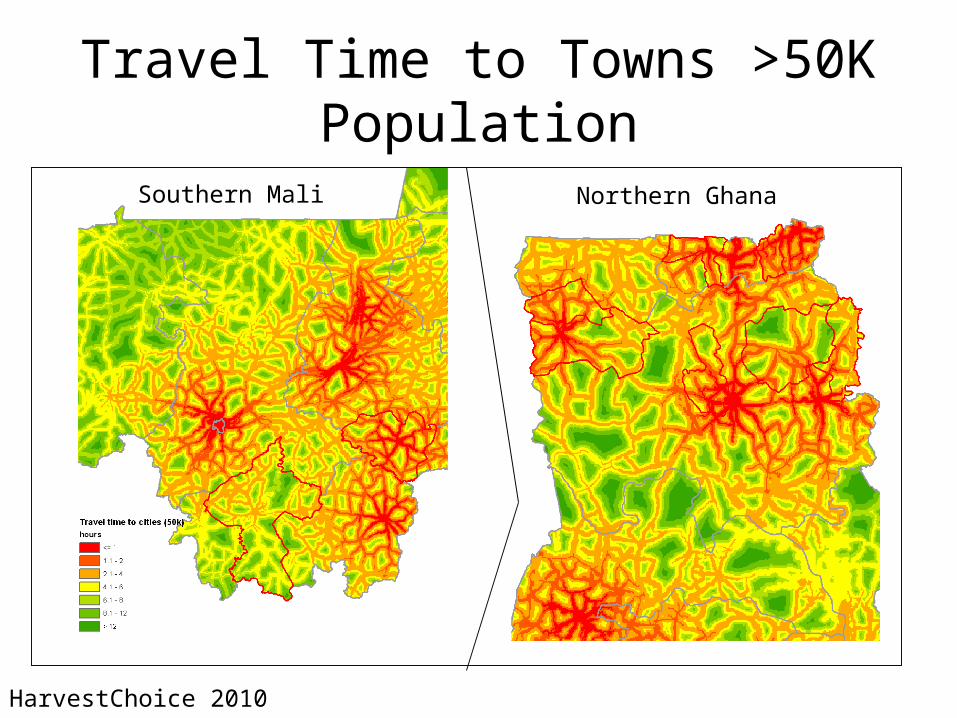
Travel Time to Towns >50K Population
Northern GhanaSouthern Mali
HarvestChoice 2010

Cropland Intensity (2005)
Northern GhanaSouthern Mali
Ramankutty et al 2008

Household Enterprise Choices
Proportion of Household (2005-2006)
<0.100
0.101 - 0.200
0.201 - 0.300
0.301 - 0.400
0.401 - 0.500
0.501 - 0.600
0.601 - 0.700
0.701 - 0.800
0.801 - 0.900
>0.900
Maize Producing Households
Rice Producing Households
Sorghum Producing Households
Proportion ofHouseholds
Source: HarvestChoice 2011 based on Ghana Living Standards Survey 2005

Proportion of Household (2005-2006)
< 0.050
0.051 - 0.100
0.101 - 0.200
0.201 - 0.300
> 0.030
Households Owning Cattle
Household Enterprise Choices (cont.)
Proportion ofHouseholds
Source: HarvestChoice 2011 based on Ghana Living Standards Survey 2005
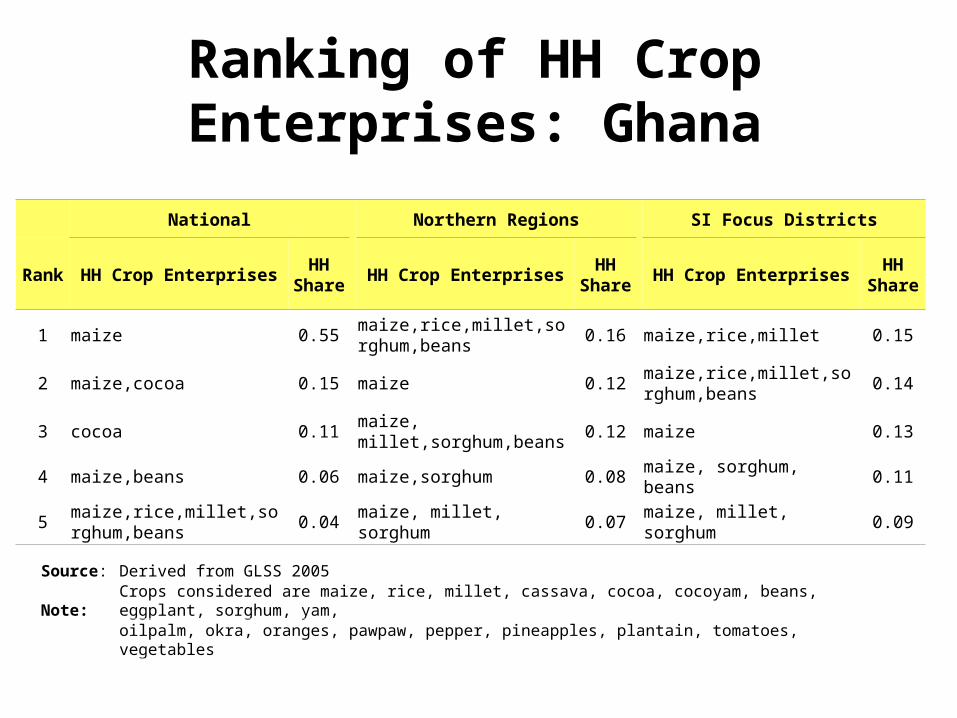
National Northern Regions SI Focus Districts
Rank HH Crop EnterprisesHH
Share HH Crop Enterprises
HH Share
HH Crop EnterprisesHH
Share
1 maize 0.55maize,rice,millet,sorghum,beans
0.16 maize,rice,millet 0.15
2 maize,cocoa 0.15 maize 0.12maize,rice,millet,sorghum,beans
0.14
3 cocoa 0.11maize, millet,sorghum,beans
0.12 maize 0.13
4 maize,beans 0.06 maize,sorghum 0.08 maize, sorghum, beans 0.11
5maize,rice,millet,sorghum,beans
0.04 maize, millet, sorghum 0.07 maize, millet, sorghum 0.09
Ranking of HH Crop Enterprises: Ghana
Source: Derived from GLSS 2005
Note: Crops considered are maize, rice, millet, cassava, cocoa, cocoyam, beans, eggplant, sorghum, yam,
oilpalm, okra, oranges, pawpaw, pepper, pineapples, plantain, tomatoes, vegetables

01
0,00
02
0,00
0#
of h
ous
eho
lds
maiz
e,m
illet
maiz
e,so
rghu
m
maiz
e,ric
e,m
illet,b
eans
maiz
e, m
illet,s
orgh
um,b
eans
maiz
e,ric
e,m
illet,s
orgh
um
maiz
e, m
illet,
sorg
hum
maiz
e, so
rghu
m, b
eans
maiz
e
maiz
e,ric
e,m
illet,s
orgh
um,b
eans
maiz
e,ric
e,m
illet
focus districts# of households growing

*DSSAT Cropping System Model Ver. 4.0.2.000 May 21, 2009; 16:32:33
*RUN 1 : RAINFED LOW NITROGEN
MODEL : MZCER040 - MAIZE
EXPERIMENT : UFGA8201 MZ NIT X IRR, GAINESVILLE 2N*3I
TREATMENT 1 : RAINFED LOW NITROGEN
CROP : MAIZE CULTIVAR : McCurdy 84aa ECOTYPE :IB0002
STARTING DATE : FEB 25 1982
PLANTING DATE : FEB 26 1982 PLANTS/m2 : 7.2 ROW SPACING : 61.cm
WEATHER : UFGA 1982
SOIL : IBMZ910014 TEXTURE : - Millhopper Fine Sand
SOIL INITIAL C : DEPTH:180cm EXTR. H2O:160.9mm NO3: 2.5kg/ha NH4: 12.9kg/ha
WATER BALANCE : IRRIGATE ON REPORTED DATE(S)
IRRIGATION : 13 mm IN 1 APPLICATIONS
NITROGEN BAL. : SOIL-N & N-UPTAKE SIMULATION; NO N-FIXATION
N-FERTILIZER : 116 kg/ha IN 3 APPLICATIONS
RESIDUE/MANURE : INITIAL : 1000 kg/ha ; 0 kg/ha IN 0 APPLICATIONS
ENVIRONM. OPT. : DAYL= 0.00 SRAD= 0.00 TMAX= 0.00 TMIN= 0.00
RAIN= 0.00 CO2 = R330.00 DEW = 0.00 WIND= 0.00
SIMULATION OPT : WATER :Y NITROGEN:Y N-FIX:N PHOSPH :N PESTS :N
PHOTO :C ET :R INFIL:S HYDROL :R SOM :G
MANAGEMENT OPT : PLANTING:R IRRIG :R FERT :R RESIDUE:N HARVEST:M WTH:M
*SUMMARY OF SOIL AND GENETIC INPUT PARAMETERS
SOIL LOWER UPPER SAT EXTR INIT ROOT BULK pH NO3 NH4 ORG
DEPTH LIMIT LIMIT SW SW SW DIST DENS C
cm cm3/cm3 cm3/cm3 cm3/cm3 g/cm3 ugN/g ugN/g %
-------------------------------------------------------------------------------
0- 5 0.026 0.096 0.230 0.070 0.086 1.00 1.30 7.00 0.10 0.50 2.00
5- 15 0.025 0.086 0.230 0.061 0.086 1.00 1.30 7.00 0.10 0.50 1.00
15- 30 0.025 0.086 0.230 0.061 0.086 0.70 1.40 7.00 0.10 0.50 1.00
30- 45 0.025 0.086 0.230 0.061 0.086 0.30 1.40 7.00 0.10 0.50 0.50
45- 60 0.025 0.086 0.230 0.061 0.086 0.30 1.40 7.00 0.10 0.50 0.50
60- 90 0.028 0.090 0.230 0.062 0.076 0.05 1.45 7.00 0.10 0.60 0.10
90-120 0.028 0.090 0.230 0.062 0.076 0.03 1.45 7.00 0.10 0.50 0.10
120-150 0.029 0.130 0.230 0.101 0.130 0.00 1.45 7.00 0.10 0.50 0.04
150-180 0.070 0.258 0.360 0.188 0.258 0.00 1.20 7.00 0.10 0.50 0.24
TOT-180 6.2 22.2 45.3 16.1 21.4 <--cm - kg/ha--> 2.5 12.9 87080
SOIL ALBEDO : 0.18 EVAPORATION LIMIT : 2.00 MIN. FACTOR : 1.00
RUNOFF CURVE # :60.00 DRAINAGE RATE : 0.65 FERT. FACTOR : 0.80
MAIZE CULTIVAR :IB0035-McCurdy 84aa ECOTYPE :IB0002
P1 : 265.00 P2 : 0.3000 P5 : 920.00
G2 : 990.00 G3 : 8.500 PHINT : 39.000
*SIMULATED CROP AND SOIL STATUS AT MAIN DEVELOPMENT STAGES
RUN NO. 1 RAINFED LOW NITROGEN
CROP GROWTH BIOMASS CROP N STRESS DATE AGE STAGE kg/ha LAI kg/ha % H2O N ------ --- ---------- ----- ----- --- --- ---- ---- 25 FEB 0 Start Sim 0 0.00 0 0.0 0.00 0.00 26 FEB 0 Sowing 0 0.00 0 0.0 0.00 0.00 27 FEB 1 Germinate 0 0.00 0 0.0 0.00 0.00 9 MAR 11 Emergence 29 0.00 1 4.4 0.00 0.00 27 MAR 29 End Juveni 251 0.43 4 1.6 0.00 0.09 1 APR 34 Floral Ini 304 0.44 4 1.5 0.00 0.50
OUTPUTS/INDICATORS
Phenologyflowering dates
grain/seed/tuber maturity dates
Yieldsgrain/seed/tuber yieldsresidues/stover yields
total biomass yield
Growthgrain/seed/tuber, biomass, LAI
SoilN, C and H2O balances
0
1
2
3
4
5
6
7
8
9
10
0 50 100 150 200
Yield(t/ha)
Fertilizer (kg[N]/ha)
Cropping System Models as Means of Tracking & Forecasting Key Indicators
Source: Jawoo Koo (HarvestChoice 2010)

Potential Productivity Gains in Maize in Northern Ghana:Yield Responses by Region, Soil Response Class & Management
Intervention for Representative OPV and Hybrid Varieties
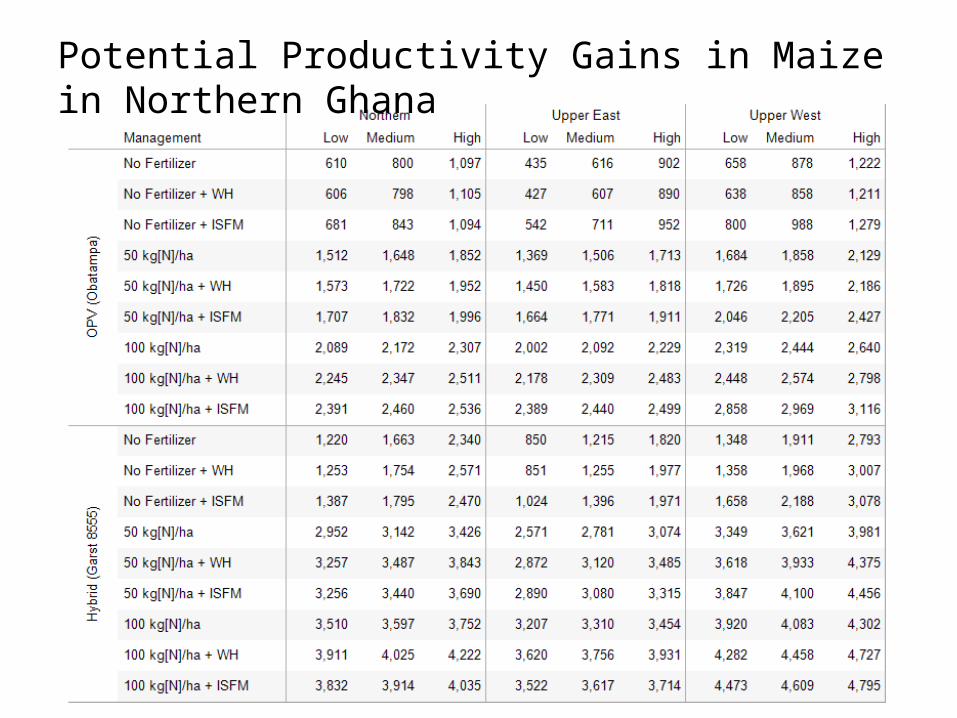
Potential Productivity Gains in Maize in Northern Ghana

M&E Implementation Strategy (to date)
• Establish Core FtF Monitoring Obligations: Primarily with USAID Washington (e.g., agree required core indicators and reporting timelines)
• Senior M&E Coordinator: IFPRI to recruit SI M&E Coordinator (Senior International Research position, likely based in Addis) with junior staff support in addition to DC-based team.
• M&E Implementation Alliance: Establish M&E community (esp. evaluation methods and tools) to finalize project M&E design, as well as guide, participate in and review M&E work plans and deliverables (composition, e.g., M&E specialist/liaison from involved CG centers, donor and national and regional partners).
• M&E Open-Access, Web-Based Platform: To host and make accessible SI M&E plans, documents, and annual reports, as well as background publications, underlying datasets and, wherever possible, analytical tools. Promote and apply standards for farming system, technology and impact characterization.
• Annual M&E Technical Meeting: Likely aligned with proposed Project-wide Annual meeting (Need for cross-site planning and review meetings?)

Issues/Questions• What is appropriate split of M&E resources
between M & E?• Scope of donor’s minimum indicator needs?• Project management versus strategic M&E
needs?• Roles of implementation partners versus M&E
team in collecting/analysing indicator data?• Do we need to re-examine the rationale for
specific focus sites and sub-systems?• Who will join the M&E Alliance/community?• Any likely candidates for M&E Coordinator?